
Abstract
In the development of engineered vascular grafts, assessing the material's interactive properties with peripheral blood cells and its capacity to endothelialize are important for predicting in vivo graft behavior. Current in vitro techniques used for characterizing cell adhesion at the surface of engineered scaffolds under flow only facilitate a terminal quantification of cell/surface interactions. Here, we present the design of an innovative flow chamber for real-time analysis of blood–biomaterial interactions under controllable hemodynamic conditions. Decellularized human umbilical veins (dHUV) were used as model vascular allografts to characterize platelet, leukocyte, and endothelial cell (EC) adhesion dynamics. Confluent EC monolayers adhered to the lumenal surface of the grafting material were flow conditioned to resist arterial shear stress levels (up to 24 dynes/cm2) over a 48 h period, and shown to maintain viability over the 1 week assessment period. The basement membrane was imaged while whole blood/neutrophil suspensions were perfused across the HUV surface to quantify cell accumulation. This novel method facilitates live visualization of dynamic events, including cell adhesion, migration, and morphological adaptation at the blood–graft interface on opaque materials, and it can be used for preliminary assessment of clinically relevant biomaterials before implantation.
Introduction
C
Adhesion of circulating blood cells is a dynamic process that is mediated by the mechanical forces associated with blood flow. Due to the difficulties associated with (1) accurately measuring variable hemodynamic forces across different vascular geometries and (2) imaging peripheral cell adhesion events in vivo, parallel plate flow chambers have been used to simulate these processes in a more controllable in vitro setting. These devices produce a parabolic flow velocity profile between two planar surfaces, subjecting each surface to uniform fluid shear stress (SS).8–10 Glass, polystyrene, or other optically transparent substrates can then be coated with cells or proteins, or micropatterned with selectively adhesive peptides/non-adhesive monomers to observe cell adhesion under flow using conventional light microscopy. Much of our current understanding of the role shear plays in cell signaling, protein conformational changes, and other phenomena associated with peripheral cell adhesion has been obtained through the use of parallel plate chambers.8,11
Given the practical advantages of real-time, non-invasive imaging of circulating cell adhesion without the need for expensive imaging systems, we sought to develop a device that could be used to monitor these events on the surfaces of clinically implantable vascular biomaterials. Here, we detail the design of a novel parallel plate flow chamber for real-time observation of peripheral cell adhesion and morphological adaptation on opaque vascular biomaterials under controlled shear stresses. Using labeled whole blood and select cell suspensions, we demonstrate the capability of this device to permit live capture of dynamic cell adhesion events at the intimal surface of naturally derived blood vessels using time lapse fluorescence microscopy. We also validate the use of this flow chamber for long-term culture of neo-endothelia and optimize a flow preconditioning regime that yields confluent endothelial cell (EC) monolayers which are resistant to arterial shear stresses. These assays demonstrate the versatility of this device for improved in vitro modeling of physiological cell adhesion events as they occur in vivo.
Materials and Methods
Cell culture
Human umbilical vein endothelial cells (HUVEC) were sourced from umbilical cords obtained from the Labor and Delivery unit at Shands Hospital at the University of Florida and processed within 12 h of birth. EC were isolated from cords using collagenase perfusion, as previously described by Jaffe et al. 12 Cells were maintained in VascuLife basal medium supplemented with VEGF LifeFactors kit (LifeLine Cell Technologies) and 100 U/mL penicillin/streptomycin (HyClone) at 37°C with 5% CO2, and used experimentally between P2 and P5.
HL-60 promyelocytic leukemia cells transduced with a green fluorescent protein (GFP)-expressing lentiviral vector were generously provided by Dr. Christopher Cogle (University of Florida Department of Medicine). They were maintained at 5×10⁵–2×10⁶ cells/mL in Dulbecco's modified Eagle Medium (Hyclone) supplemented with 20% fetal bovine serum (FBS).
Blood draws
Human venous blood was harvested from healthy adult volunteers after obtaining informed consent (IRB approval #689-2010). Blood was collected in 10 U of heparin using a 21-gauge needle. Platelets were fluorescently labeled with 20 μg/mL of Acridine Orange (Molecular Probes) and used immediately in perfusion experiments.
Dissection and decellularization of human umbilical veins
Human umbilical veins (HUV) were isolated from the surrounding tissue using an automated dissection procedure that has been previously described. 13 In brief, umbilical cords were rinsed clean and cut into 10 cm sections. A stainless steel mandrel (1/4′′ outside diameter (OD)) was inserted through the vein and then progressively frozen down to −80°C. After at least 24 h, frozen cords were machined to a uniform wall thickness of 750 μm using a CNC lathe (MicroKinetics). Veins were progressively thawed at −20°C for 2 h and then at 4°C for 2 h. Veins were decellularized by immersion in 1% (w/v) solution of sodium dodecyl sulfate (SDS) in DI water under orbital shaking (100 rpm) for 24 h at a 1:20 mass to volume ratio. Decellularized HUV (dHUV) were sequentially rinsed in DI water solutions under orbital shaking for 5 min, 15 min, 40 min, 1 h, 3 h, 12 h, and 24 h. dHUV sections were then incubated in 70 U/mL of deoxyribonuclease I (Sigma-Aldrich) in phosphate-buffered saline (PBS) agitated on an orbital shaker for 2 h at 37°C. Sections were rinsed in DI water (2×) for 5 min and terminally sterilized in a solution of 0.2% peracetic acid and 4% ethanol in DI water on an orbital shaker for 2 h. Scaffolds were sequentially rinsed for 5 min, 15 min, 40 min, and 1 h in DI water, and pH balanced in PBS (pH 7.40) for 24 h. Scaffolds were stored in PBS at 4°C for a maximum of 2 weeks until use.
Estimation of flow velocities
GFP+ HL-60 cells were passed through the flow chamber at a constant flow rate while time lapse imaging was conducted. The objective (5×) was focused at a position halfway between the imaging window and the lumenal HUV surface in the z-direction. HL-60 cells passing through the flow field were imaged at various increments from the center of the channel to the side wall. Velocity was calculated using AxioVision software by measuring the distance traveled by the same cell in two consecutive frames and dividing it by the time elapsed. N=10–20 cells were measured at each zone presented.
Platelet adhesion (acellular scaffolds)
With the HUV mounted into the flow chamber, whole blood was perfused across the HUV surface at a wall SS of 2 dynes/cm2, which was calculated according to the Hagen–Poiseuille equation:
where μ is viscosity, Q is mean volumetric flow rate, and b and h are the base width and channel height, respectively. A longpass emission filter (>530 nm) was used to detect fluorescently labeled platelets using RNA binding acridine orange (Molecular Probes; 460/650 nm). Platelets were perfused continuously over a 5 min period, and images were captured every 15 s for a dynamic observation of aggregate formation. At 1 min intervals, a threshold was applied to obtain a representative black and white mask of each image with the percentage of white area corresponding to the percentage of platelet coverage. Platelet aggregate growth was quantified by measuring length in the flow direction at 1 and 5 min (n=6 aggregates).
The light intensity profiles of platelet aggregates were measured using NIH ImageJ software. Gray value (with white corresponding to the highest light intensity, and black corresponding to the lowest) was determined along a line parallel to the flow direction and traversing the middle of the aggregate with regard to its width. Light intensity profiles of seven aggregates were plotted and thresholded at 10% of the gray value range to distinguish each aggregate from the HUV background. Skewness of each thresholded aggregate was determined as a measure of symmetry; results are presented as mean±standard error. Aggregate length was normalized by rescaling each aggregate out of 100 pixels, and gray value data were discretized by averaging all points within a five-pixel length range. The plot obtained gave a global platelet aggregate light intensity profile.
Perfusion culture system
Assembled flow chambers were connected to a media reservoir fitted with a 0.22 μm filter for gas exchange. The entire system was placed in a dry incubator maintained at 37°C and 5% CO2. The flow rate through the chamber was directly modulated by the rotational speed of the peristaltic pump, which was controlled by Masterflex Linkable Instrument Control Software V3.1. The mean wall SS to which EC were exposed was calculated according to Equation (1) (assuming steady flow) as described earlier. SS amplitude was similarly calculated from the flow rates measured at the maximum/minimum pressures observed during a single pulsation. The Reynolds number (Re) was calculated according to
where Q is volumetric flow rate, ρ is the density of water at 37°C, b is the base width of the flow field, and μ is the viscosity of water at 37°C. At the maximum flow rate, the Reynolds number was calculated to be 332, indicating laminar flow. The entrance length (Le) for fully developed flow, which was calculated according to
where Re is the Reynolds number and h is the height of the flow field, was determined to be 11.96 mm. Since the viewing window was located 15 mm from the flow field entrance, the area under analysis was subjected to a fully developed laminar flow.
EC seeding
Assembled flow circuits were sterilized with a solution of 4% ethanol, 0.2% peracetic acid for 2 h and balanced with PBS (pH 7.4). Standard EC media (2% FBS) were allowed to flow through the system before seeding. EC suspensions (106 cells/mL) were inoculated into the flow field and allowed to settle, attach, and spread out on the scaffold surface for 5 h before initiating flow.
EC viability assay
EC monolayers were assessed for viability using the Live/Dead Viability/Cytotoxicity Kit for mammalian cells (Invitrogen) according to kit instructions. Briefly, scaffolds were first rinsed in PBS, and then incubated for 30 min with 2 μM calcein AM and 2 μM ethidium homodimer-1. Images were captured as described next through both the GFP and DsRed filters to visualize live and dead cells, respectively.
EC staining
At the end of each experiment, scaffolds were rinsed in PBS, formalin fixed, and co-stained using rhodamine phalloidin (RP)/4′,6-diamidino-2-phenylindole, dihydrochloride (DAPI, 3 nM; Invitrogen). Imaging was conducted as described next in fluorescence microscopy.
EC retention analysis
EC co-stained with RP/DAPI as described earlier were separately imaged through each channel using multi-dimensional acquisition. Channel images obtained through the DAPI filter were exported for analysis using NIH ImageJ software. Imaging was conducted in situ within flow chambers to avoid distortion secondary to scaffold manipulation. Scaffolds were imaged in 10 predetermined locations per experimental condition and analyzed for cell density. DAPI images were analyzed using the ITCN Automatic Nuclei Counter plugin ver. 1.6 to quantify the number of cell nuclei in each image, which was divided by the image surface area to calculate cell density. Results are presented as mean±standard deviation.
EC geometric parameter analyses
RP images obtained at 10× magnification were analyzed using the OrientationJ Measure plugin to determine actin fiber orientation with regard to the flow direction.
14
DAPI images obtained at 10× magnification were analyzed using the built-in particle analysis function of ImageJ to determine perimeter, area, and fit each nucleus with an ellipse to determine major axis orientation. The circularity (C) of each nucleus was calculated according to
where A is surface area and P is perimeter of each nucleus. The angle of the major axis was also determined with regard to the flow direction. Cells were individually analyzed within each 10× flow field to determine mean values for each geometric parameter (n=5–7 images per condition).
Neutrophil adhesion to endothelialized HUV
GFP+ HL-60 cells were differentiated into neutrophil-like cells by exposure to 1.3% dimethy sulfoxide (Fisher Scientific) for 3 days, as previously described. 15 Endothelialized HUV scaffolds were activated for 4 h by adding 1 U recombinant human tumor necrosis factor-α (TNF-α; Thermo Scientific) to the media reservoir. Flow chambers were then removed from the incubator and placed on the stage of a Zeiss AxioImager M2 upright fluorescence microscope (Fig. 2A). Suspensions (106 cells/mL) of differentiated HL-60 cells (dHL-60) were then drawn through the flow chamber at a calculated wall SS of 1 dyne/cm2 using a programmable syringe pump (Harvard Apparatus). Time lapse imaging of dHL-60 adhesion to endothelialized HUV was then performed over a 5 min period. Culture media without cells were allowed to flow through for an additional minute in order to remove non-adherent cells. Monolayers were fixed using 10% formalin and co-stained as described earlier.
For time lapse images, AxioVision software was used for frame-by-frame analysis in order to calculate firm adhesion duration and upstream/downstream rolling velocities for dHL-60 cells. Contrast enhancement was applied to each frame in order to determine a centroid and coordinate (x,y) for each cell. The distance traveled by each cell in consecutive frames was divided by the time elapsed in order to calculate mean upstream/downstream rolling velocities; only cells in steady motion were included (frames just before or immediately after firm adhesion in which the rolling velocity was changing were excluded in the analyses). Firm adhesion was determined to begin when the centroid coordinates did not change in consecutive frames; it was determined to end when the cell resumed rolling.
Scanning electron microscopy
HUV samples were fixed in 2.5% glutaraldehyde, washed in PBS, fixed in 1% osmium tetroxide solution, and progressively dehydrated in 25%, 50%, 75%. 85%, 95%, and 3×100% ethanol solutions. Samples were then critical point dried, sputter coated with gold/palladium, and imaged using a Hitachi S-4000 FE-SEM (10.0 kV).
Fluorescence microscopy
Imaging was conducted using a Zeiss AxioImager M2 upright fluorescence microscope coupled with an AxioCam HRm Rev. 3 digital camera operated by AxioVision software version 4.8.
Statistical analyses
One-way analysis of variance followed by post-hoc Tukey–Kramer HSD analyses (with the significance level set at 0.05) were conducted to compare EC density by experimental group or EC geometric parameters by time.
Results
Flow chamber design and assembly
A parallel-plate flow chamber was designed to perfuse fluid (culture media or peripheral blood) across an opaque substrate in an observable environment. Three design criteria were considered paramount: (1) that live imaging can be conducted under high magnification (40× or greater) for dynamic visualization of platelet adhesion, (2) that the device be capable of maintaining parabolic flow while accommodating scaffolds of various thicknesses, and (3) that the reagent volume required to fill the chamber be minimized to maximize use from limited volumes of peripherally drawn blood. A significant challenge was decreasing the distance between the top of the chamber and the substrate to allow the focal plane of the microscope objective to reach the scaffold surface. To accomplish this, a thin acrylic slide was bonded over two lanes forming the walls of the flow channel using clear epoxy resin (ITW Devcon 2 Ton Epoxy) to create a viewing window (Fig. 1A) with a total focal distance of 1.6 mm. With this design, a 40× Zeiss objective (LD Plan-Neofluar) with a maximum working distance of 2.9 mm was compatible for high-magnification imaging of cell adhesion within the flow chamber.

Flow chamber design. The main body design of the flow chamber is shown in
dHUV scaffolds of uniform thickness (750 μm), prepared as previously described, 7 were sliced open axially and affixed to acrylic base plates in a slightly tensed conformation using a compressible silicone gasket (Fig. 2A–C). The main body of the flow chamber was then screwed to the base plate, creating a sealed parallel plate flow channel with the bottom plate composed of the lumenal HUV surface (Fig. 2D, E). By minimizing the base width (b) and height (h) of the flow field (b 6.35×h 0.60 mm), the volume required to fill the flow channel was reduced to <300 μL, ∼20% of the volume of the native HUV vessel (average diameter 5–6 mm). No difference in mean flow velocity was observed across >90% of the channel width, indicating uniformity of flow (Fig. 1B).
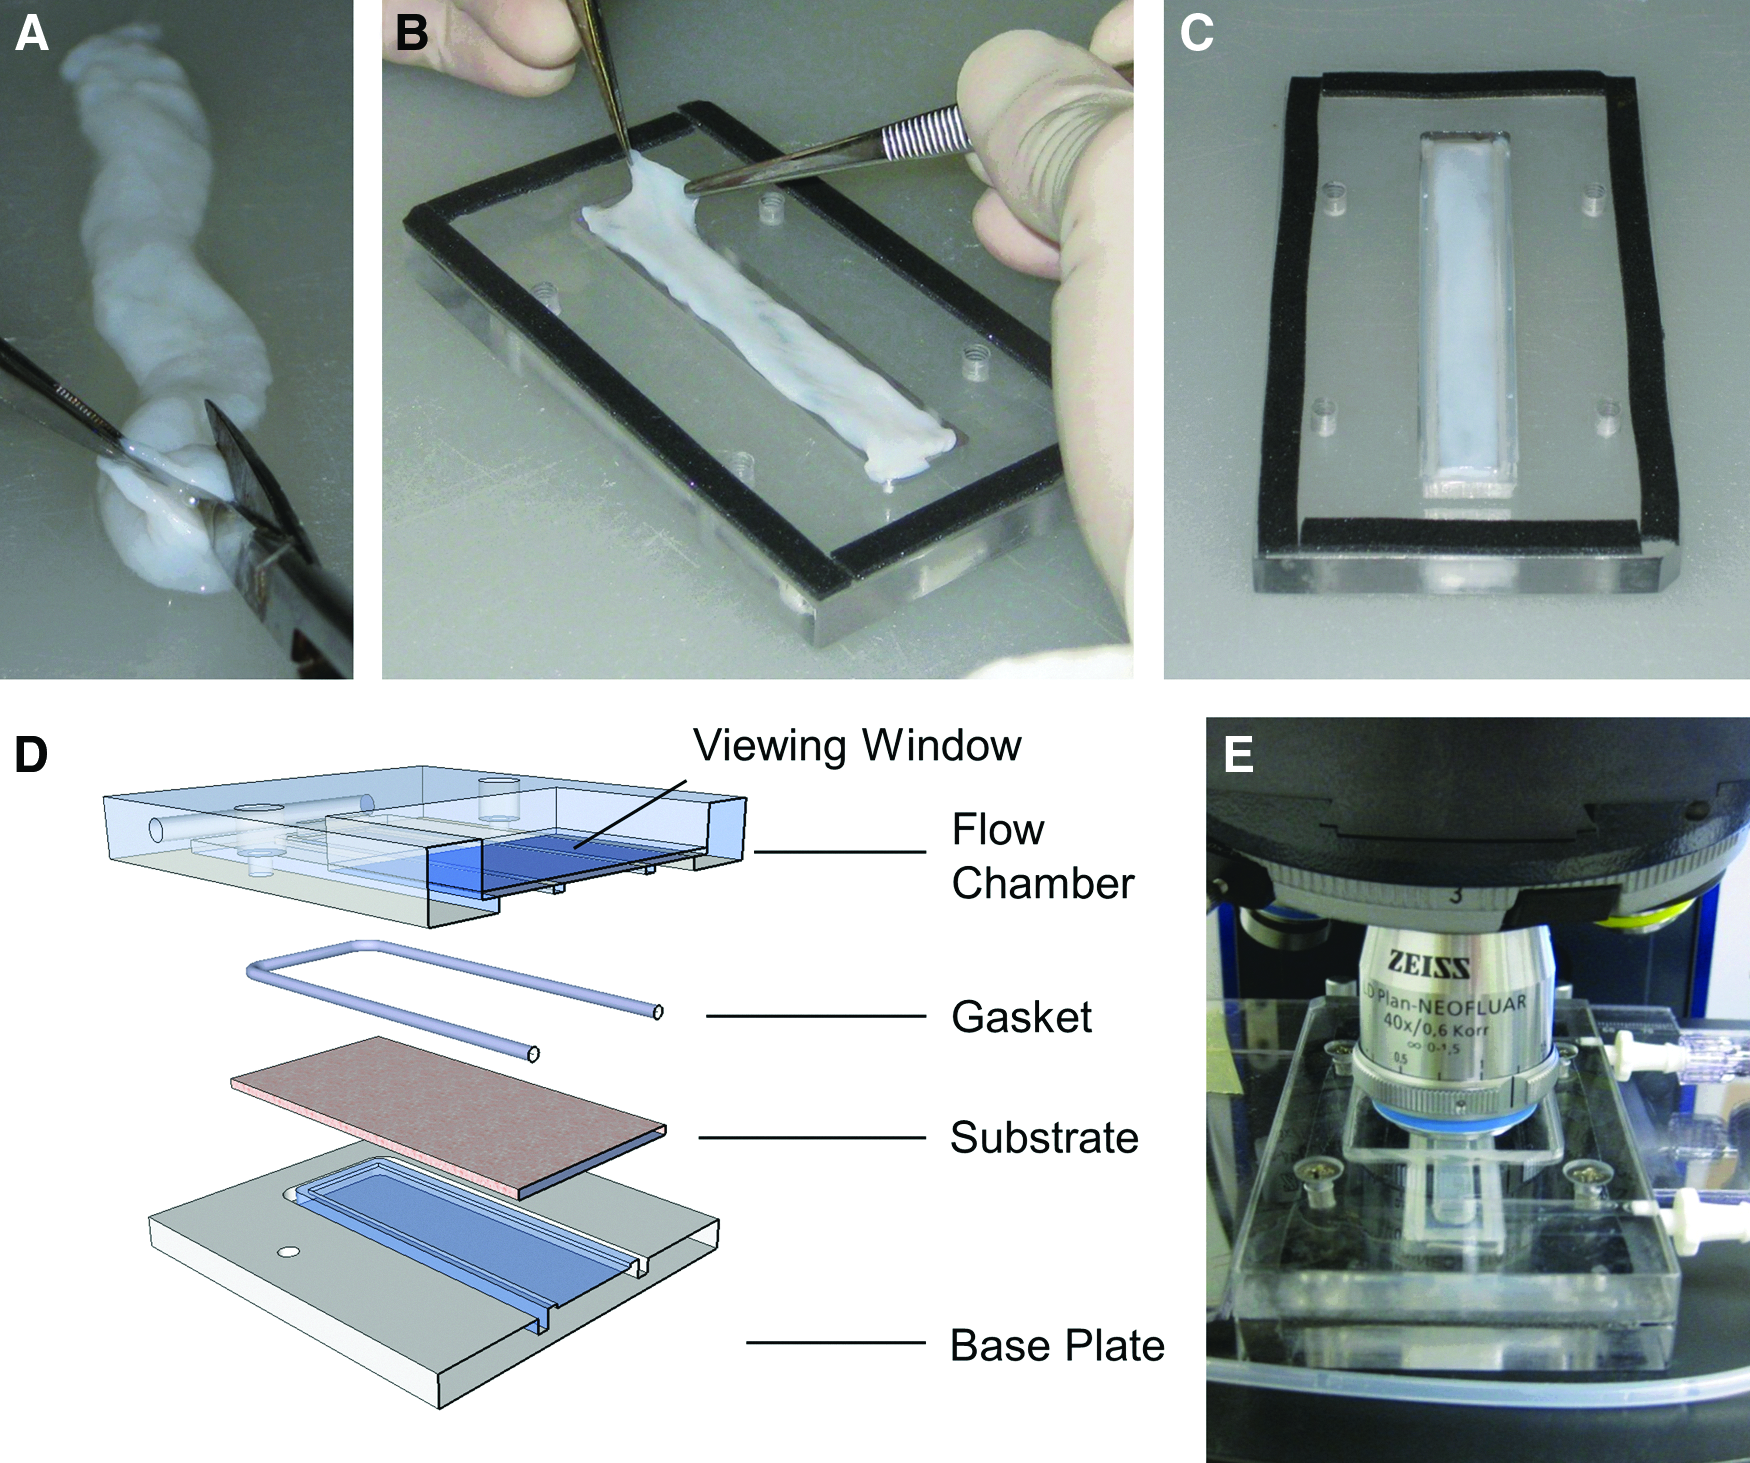
Flow chamber assembly. Decellularized human umbilical vein (dHUV) scaffolds were cut open axially
Real-time observation of platelet adhesion
As an assessment of platelet adhesion, acridine orange-labeled whole blood was perfused across the acellular HUV and visualized at 40× magnification (Fig. 3A). Platelets were shown to progressively adhere to the surface, forming aggregates that elongated in the direction of flow. Coverage reached 3.7% of the total area over the 5 min perfusion period (Fig. 4). Measurement of aggregates' length parallel to the flow direction showed an elongation of all aggregates with an average length increase from 3.4 μm at 1 min to 11.6 μm at 5 min (Fig. 4B). The mean growth rate of platelet aggregates on the HUV surface was calculated as 68%/min (Fig. 4C).

Perfusion systems for imaging initial adhesion events or extended culture under flow.

Real-time observation of platelet adhesion to acellular HUV. Whole blood was perfused across the surface of dHUV at a SS of 2 dynes/cm2. Platelet adhesion and aggregation was imaged via epifluorescence microscopy and quantified over a 5 min period
Three-dimensional profiling of platelet aggregates
After 10 min of blood flow, numerous platelet aggregates had formed on the HUV basement membrane. Z-stack imaging was conducted to characterize the geometric distribution of platelets within aggregates in the z-direction (perpendicular to the surface). Twenty-five sections of two-dimensional images were collected at 2 μm stepped depths, and a composite image was created by combining the maximal intensity profiles of each z-stack image (Fig. 5A). Since the maximal intensity of each section corresponds to in-focus platelets, the light intensity of the composite 3D image correlates with the overall shape of the observed aggregate, with white representing the maximum height and black representing the minimum (Fig. 5B). Light intensity plots and 3D profiles of platelet aggregates were created using ImageJ plug-in Interactive 3D Surface Plot v2.33 (Fig. 5B–D). 16

Flow-induced platelet aggregate geometries. Whole blood was perfused over the surface of dHUV at a SS of 2 dynes/cm2. After 10 min, 25 z-stack images were taken at 2 μm steps. A composite image of the maximum intensity areas from all 25 images is presented in
Light intensity profiles of seven aggregates were obtained and thresholded at a gray value of 100 to distinguish aggregates from the background (Fig. 6A). The skewness of the thresholded intensity profiles was then measured and showed these plots to be approximately symmetric with skewness values ranging from −0.06 to 0.2. 17 The normalized and averaged light intensity profile of the aggregates (Fig. 6B) showed a similar distribution of the data, with a skewness value of 0.07±0.05. Although the distribution was approximately symmetric, skewness data were slightly biased toward positive values, and analysis of the geometric profile of the plot in the flow direction showed a slightly more abrupt increase in light intensity upstream of the aggregate (linear increase with a slope of 3.2) with a more gradual decrease downstream (linear decrease with a slope of 2.5; Fig. 6B). In agreement with these measurements, the apex or maximal height of each platelet aggregate was typically located at the proximal (upstream) end.

Light intensity profile of platelet aggregates. Light intensity profiles of seven platelet aggregates from the composite image presented in Figure 5A were measured
Development of neo-endothelia on HUV scaffolds and adaptation to flow
Primary EC were seeded onto the lumenal surface of the HUV at an initial seeding density of 60,000 cells/cm2, which correlated with a nearly confluent density for the same cells when cultured on polystyrene. After allowing the cells to adhere and spread out over the basement membrane for 5 h, endothelia were preconditioned over a 48 h period using one of the four strategies as indicated in Figure 7A. In Group 1, EC were exposed to low SS (0.3 dynes/cm2, the minimum programmable flow rate for media exchange) for the entire period; this resulted in a high density of EC at the end of the preconditioning period (Fig. 7B). In Group 2, seeded EC were immediately exposed to high SS (6 dynes/cm2, representing approximately half the desired mean SS value), which resulted in a significant decrease in cell density compared with group 1 (1264.92±83.86 vs. 179.38±38.57 cells/mm2, p=0.000). Based on the initial seeding density (∼600 cells/mm2), this suggested that immediate exposure to high SS caused the EC to strip off the lumenal surface.

Shear preconditioning strategies for EC-seeded HUV scaffolds. dHUV grafts were cut open axially and secured in the flow chamber as described earlier. Primary EC were seeded onto the lumenal surface, and 5 h later, they were adapted to flow using various shear preconditioning strategies
To enable the EC to more gradually adapt to SS, Group 3 was designed in which the rotational speed of the pump was steadily ramped from 0.3 to 6 dynes/cm2 over the 48 h period. This resulted in improvement of the cell density when compared with Group 2, but the cell density was significantly lower than in Group 1 (1264.92±83.86 vs. 640.17±110.84 cells/mm2, p=0.000). To allow the EC additional time to mature on the HUV surface, Group 4 was designed in which the cells were cultured under low SS (0.3 dynes/cm2) for the first 24 h, and then exposed to ramped flow (0.3–6 dynes/cm2) over the second 24 h. This strategy resulted in a similar cell density as Group 1, with no statistically significant difference between these two groups (1264.92±83.86 vs. 1236.00±169.30 cells/mm2, p=0.969). Further experiments were conducted using the shear preconditioning strategy described in Group 4.
Shear conditioning of neo-endothelia
We next used the device to assess the potential of the dHUV to support an EC monolayer under physiological SS conditions for experimentally relevant time periods. Endothelia were conditioned to SS by ramping the flow rate as indicated in Figure 8A. Cytoskeletal F-actin filaments aligned parallel to the flow direction, and a significant decrease in the average filament angle relative to the shear direction was observed after flow ramping was initiated (Fig. 8C). This correlated with nucleus alignment in the flow direction (Fig. 8D). Progressive nuclear elongation was observed after physiological levels of SS had been applied (Fig. 8E). Two days after seeding, a confluent EC monolayer was developed that was able to withstand SS commonly found in small diameter arteries, confirmed by an additional day of perfusion culture. Confluent neo-endothelia were maintained under pulsatile perfusion (mean±amplitude 12±12 dynes/cm2 at 80 pulses/min) for approximately 7 days after seeding (Fig. 8B).

Maturation of endothelialized HUV scaffolds. dHUV scaffolds were affixed to flow chambers as described earlier. EC were seeded onto the lumenal HUV surface at a high concentration and gradually adapted to flow using computer-controlled peristaltic pumps. The calculated mean wall SS along the lumenal HUV surface over the culture period is shown in
Morphological comparison of endothelia cultured under static culture or flow conditions
Neo-endothelia cultured on the opaque lumenal surface of dHUV (as described above) were subjected to either pulsatile SS (12±12 dynes/cm2 at 80 pulses/min) or static culture conditions for 24 h. Scanning electron microscopy (SEM) taken from an oblique (45°) angle relative to the HUV surface show EC cultured under flow to have a significantly more flattened morphology, with less variation in height than static-cultured cells (Fig. 9A, B). This finding correlated with cellular elongation in the flow direction (Fig. 9E, F), which accounts for the reduced topographical variation between cell–cell junctions that is visible in SEM images. Calcein/ethidium co-staining confirmed a high proportion of viable cells on endothelial monolayers cultured on the HUV basement membrane, and exposure to arterial SS levels had no deleterious effect on cellular viability (Fig. 9C, D).
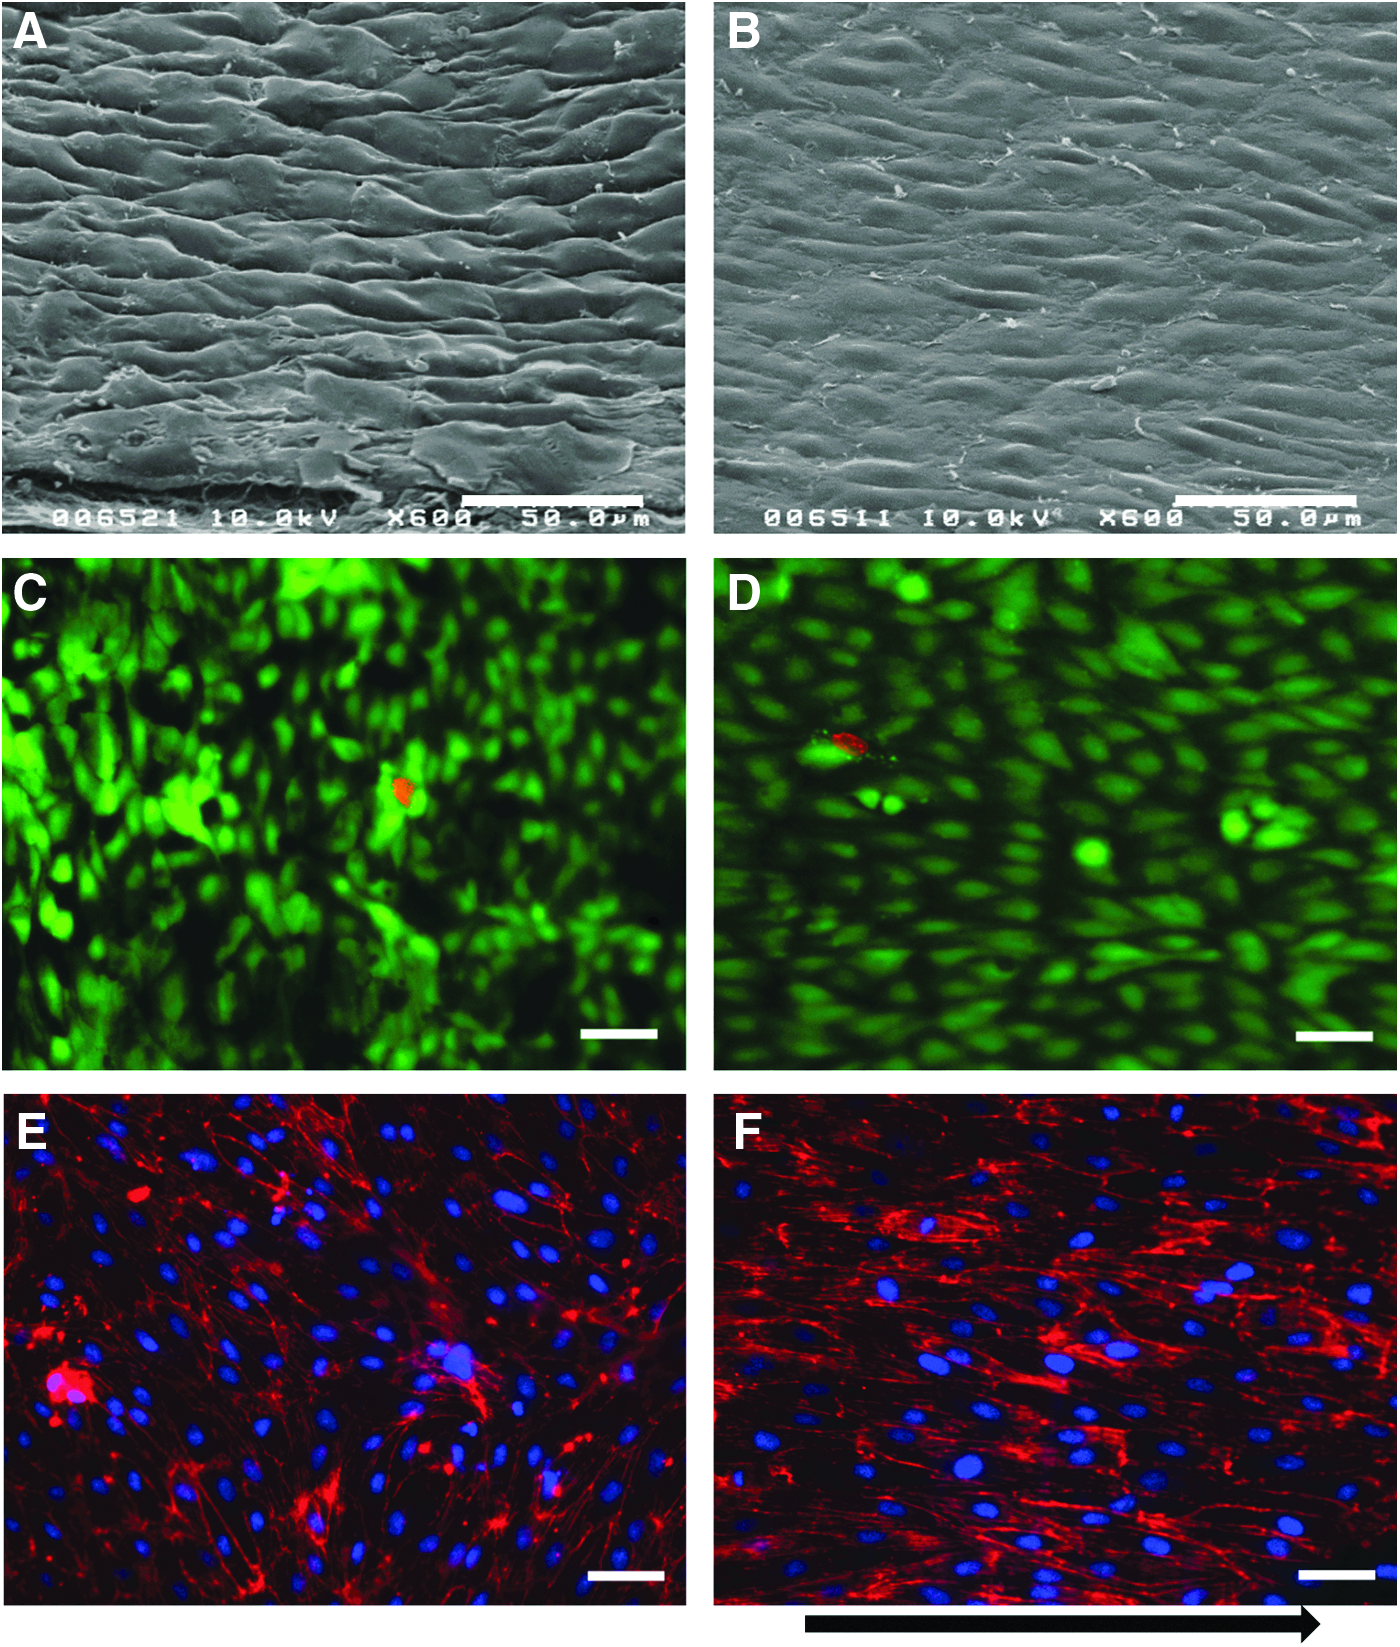
Morphological comparison of endothelia cultured under static culture or flow conditions. Processed HUV scaffolds were fit in custom-designed flow chambers as previously described. Primary EC suspensions were injected into the flow field and either cultured under static conditions
Real-time observation of neutrophil rolling on neo-endothelia
For functional assessment of neo-endothelia, we designed a system to image rolling adhesion and arrest of human leukocytes under flow. After 3 days of flow conditioning, EC monolayers were activated with recombinant human TNF-α to stimulate cell adhesion molecule expression. Time lapse imaging conducted at 10× magnification (for observing a larger surface area) captured rolling adhesion and arrest of GFP-expressing neutrophil-like dHL-60 cells over a 5 min period (Fig. 10A). Quantification of adherent cells in each frame showed a roughly linear increase that reached a plateau after 4 min. RP/DAPI co-staining confirmed the presence of a confluent EC monolayer beneath adherent dHL-60, which predominantly localized at cell–cell junctions (Fig. 10B). Firm adhesion lasted an average of 29.1±15.9 s per event, and dHL-60 rolling velocity was generally higher after firm adhesion than earlier (Fig. 10C, D).
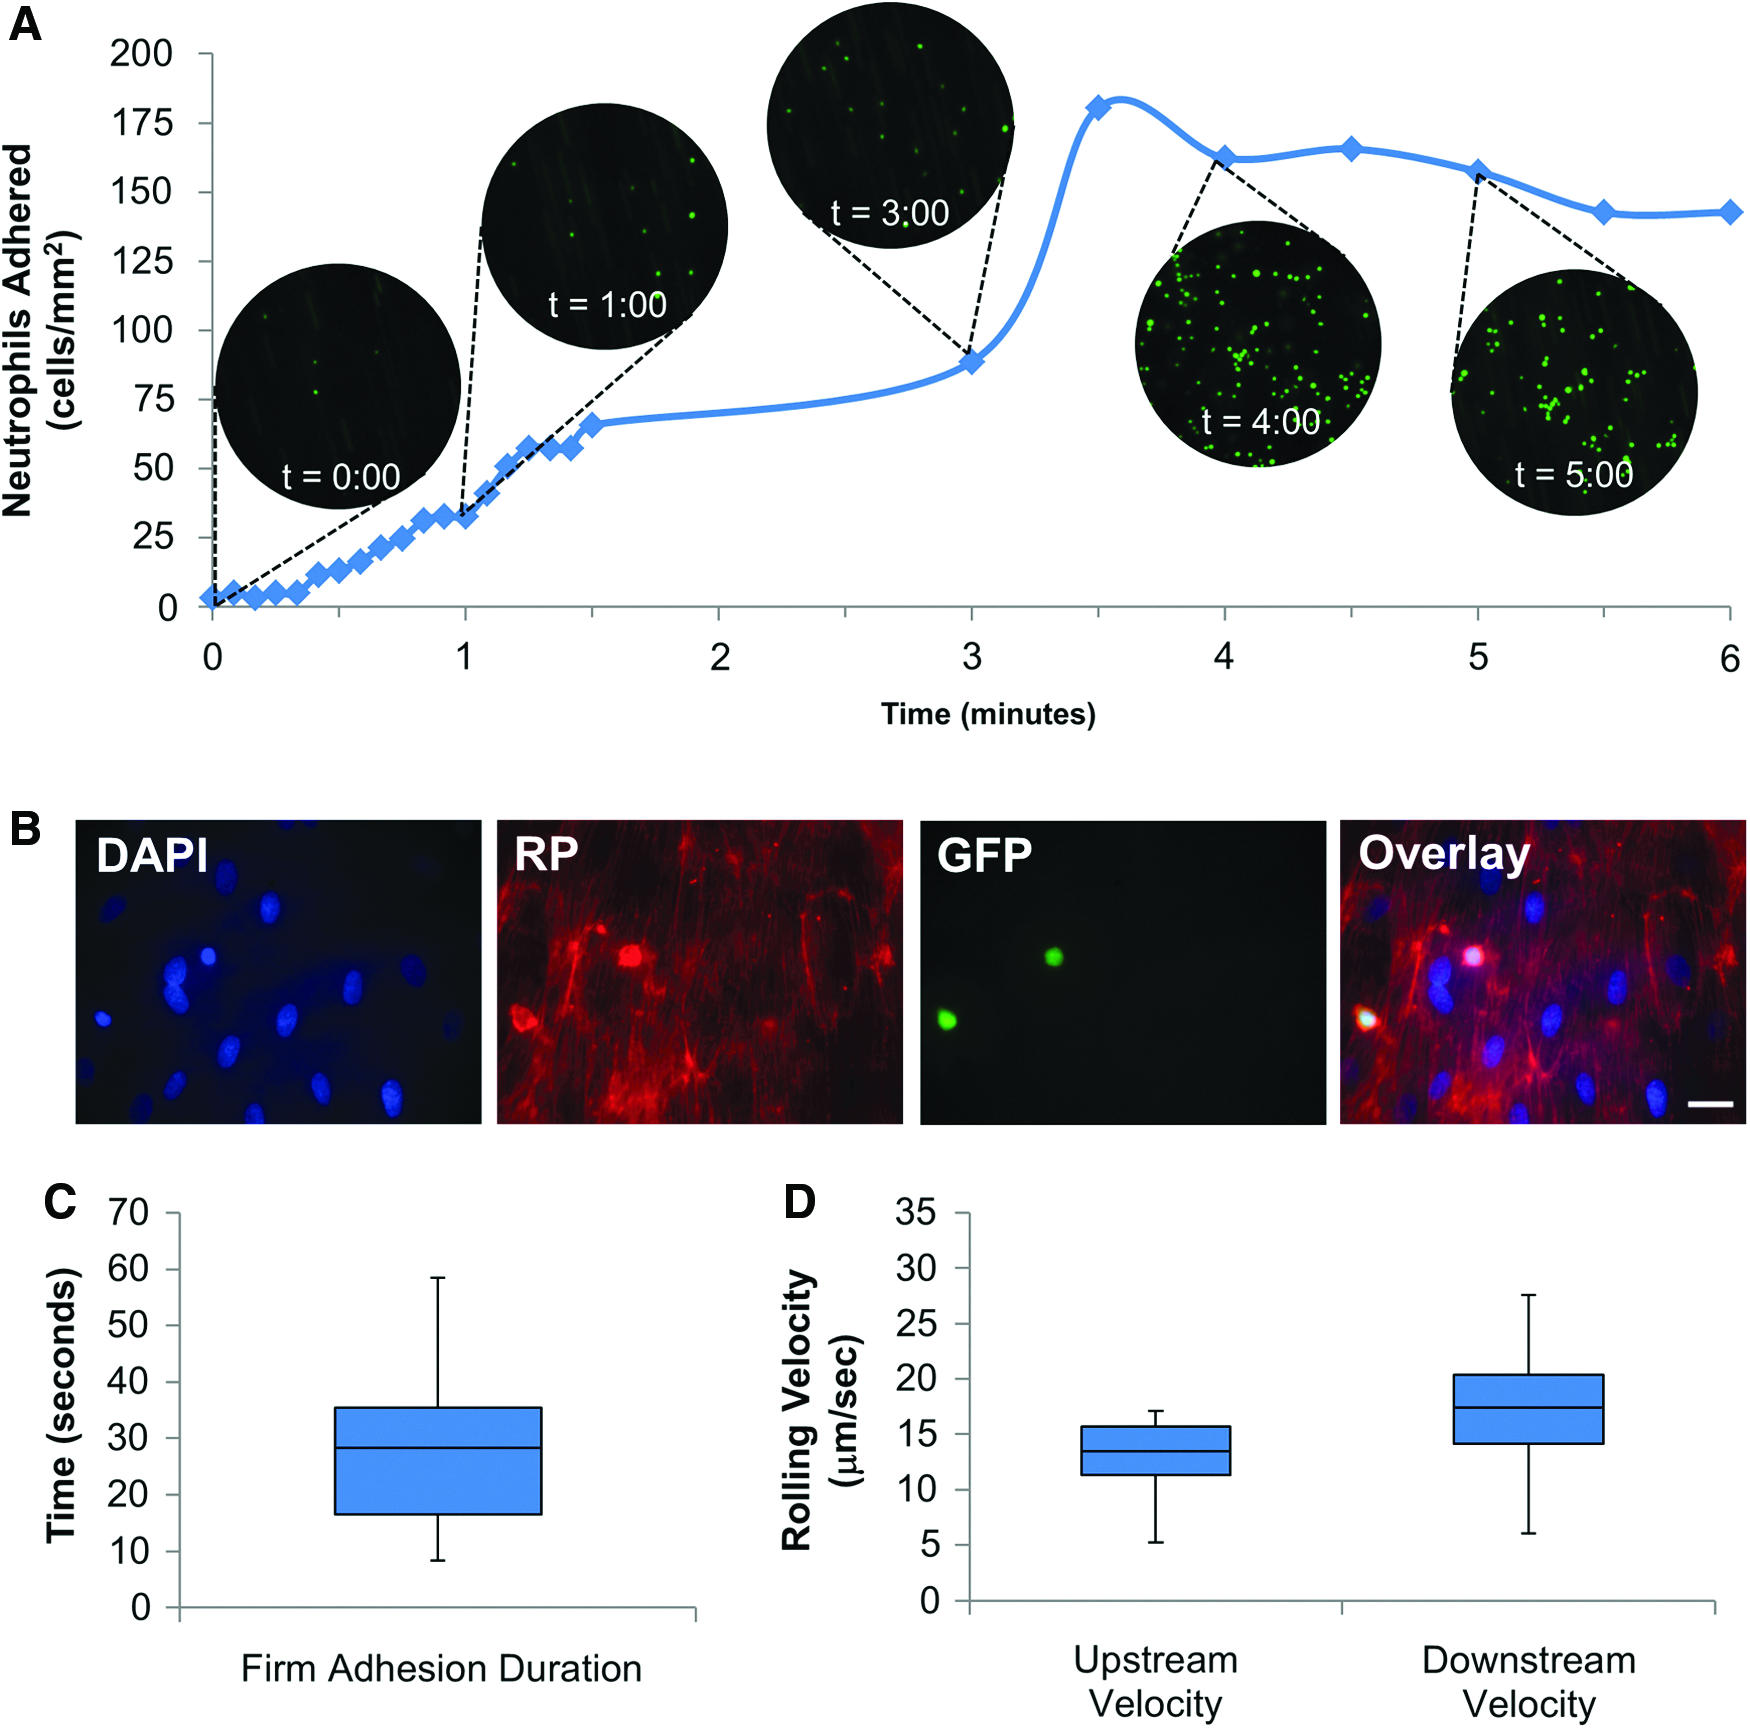
Time-lapse capture of neutrophil adhesion to endothelialized HUV scaffolds. Endothelia adapted to flow were activated with 1 U tumor necrosis factor-α. A bolus of dHL-60 was then flowed across the lumenal HUV surface at a calculated SS of 1 dyne/cm2. Time-lapse imaging captured adhesion of green fluorescent protein (GFP)+ dHL-60 cells to the activated endothelia over 5 min
Discussion
Several techniques have been developed for visualizing the dynamic events associated with platelet aggregation/leukocyte adhesion on vascular biomaterials in vitro, where biochemical factors, mechanical stimuli, and interactions with isolated cell populations can be precisely controlled. 18 Systems used for imaging isolated blood vessels/vascular grafts ex vivo are particularly suited for observing agonist-induced contraction/dilation and other whole-vessel responses, 19 but have limitations for observing intimal phenomena due to an increase in light scattering coupled with the loss of resolution associated with thicker, opaque vessels. Alternatively, harvested vessels can be opened longitudinally to directly image cells adhered to the lumenal surface, but this does not permit real-time imaging of cell accumulation under flow. 20
Parallel-plate flow chambers have been used for decades to study behavior of particular cell populations under controlled flow conditions. 8 These devices have several advantages compared with tubular ex vivo-derived or engineered vessels: lower reagent requirements, more uniform SS fields, and enhanced imaging clarity compared with intravital microscopy. To overcome the limitations associated with imaging through opaque tissue scaffolds, we designed a novel flow chamber that holds a compliant vascular biomaterial in a stable conformation such that SS across the wall can be precisely controlled. The graft is cut open longitudinally and secured between two plates, allowing the intimal surface to be directly imaged while fluorescently labeled whole blood/select cell suspensions are perfused across. This permits live imaging using conventional epifluorescence microscopy techniques. Using this design, we characterized the early binding properties of the HUV scaffold under simulated blood flow.
The HUV has several ideal properties that allow it to serve as a vascular allograft: The vessel has an adequate length (50–60 cm), is free of bifurcations, and can readily be obtained hospital delivery wards. 21 The HUV has been used in vascular reconstruction surgeries for more than 30 years, 22 and, more recently, it has been developed as an ex vivo-derived vascular scaffold for tissue engineering applications.13,23 Due to its clinical relevance, the HUV served as an excellent model to assess a vascular biomaterial for both modeling platelet/neutrophil adhesion and endothelialization under flow.
Decellularization of the HUV using SDS has previously been shown to leave behind an intact basement membrane that can be repopulated with EC. 24 Spontaneous EC ingrowth or “in situ endothelialization” rarely occurs in humans on prosthetic grafts. 25 Therefore, a goal for tissue engineered grafts is to produce a lumenal surface that is both resistant to platelet aggregation and favorable for EC regrowth. The flow chamber allows a temporal observation of EC proliferation and morphological adaptation to SS in situ. To avoid stripping EC off the HUV surface by the sudden onset of flow, cells were shear conditioned by progressively increasing flow rates until approximately physiological levels of arterial wall SS were reached. Adaptation of EC on other vascular biomaterials to physiological SS levels could similarly be optimized using this device in preparation for implantation of preseeded constructs in the aggressive arterial circulation.
Platelet adhesion/aggregation onto vascular grafts is directly related to their propensity to adsorb plasma proteins, which is dependent on surface hydrophilicity, electric charge, and chain mobility. 26 It is the combination of these factors that determines the thrombogenicity of a material and makes its in vivo performance difficult to predict. Previously, it was shown that the dHUV scaffold is resistant to platelet adhesion, though comparatively favorable for attachment of EC under static conditions. 24 However, platelet adhesion to proteins is highly dependent on local hemodynamic shear trends, and graft thrombogenicity is more accurately assessed under dynamic conditions. 27 In the present study, we observed a temporally increasing trend of platelet adhesion and aggregate formation to the processed vascular scaffold, leading to 3.7% coverage of the total surface area over a 5 min perfusion period. This shows the denuded HUV scaffold to be more prone to platelet adhesion under the shear conditions applied than was previously thought under static incubation (<1% coverage). 24 Real-time light intensity profiles showed the aggregates to have a steep height increase upstream with a more gradual decrease downstream, similar to observations made in collagen type I coated glass slides. 28 As such, this system offers a rapid method using a modified parallel plate flow chamber to assess these materials in a high throughput approach.
In summary, we have designed and characterized a novel flow chamber using ex vivo-derived vascular tissue for in vitro modeling of cell adhesion events in an environment that is more reminiscent of the natural vasculature. We have demonstrated functional uses of this device for investigating cell adhesion events during normal vascular homeostasis or in response to injury. The design presented can be used for preimplantation screening of a wide range of other biomaterials to assess blood cell interactions.
Footnotes
Acknowledgments
The authors would like to acknowledge the National Institutes of Health for funding R01-HL088207 and R01-HL088207-03S1. They thank Alan Miles for providing flow chamber machining consultation. The authors would also like to thank the Electron Microscopy and Bio-imaging Laboratory at UF for technical assistance, Christopher Cogle and the UF Clinical and Translational Science Institute for their assistance with blood draws. They also thank Dr. Cogle for contributing the GFP+ HL-60 cells for this study.
Disclosure Statement
The authors have no conflicts of interest to declare.