
Abstract
Traditional optimization of culture parameters for the large-scale culture of human embryonic stem cells (ESCs) as aggregates is carried out in a stepwise manner whereby the effect of varying each culture parameter is investigated individually. However, as evidenced by the wide range of published protocols and culture performance indicators (growth rates, pluripotency marker expression, etc.), there is a lack of systematic investigation into the true effect of varying culture parameters especially with respect to potential interactions between culture variables. Here we describe the design and execution of a two-parameter, three-level (32) factorial experiment resulting in nine conditions that were run in duplicate 125-mL stirred suspension bioreactors. The two parameters investigated here were inoculation density and agitation rate, which are easily controlled, but currently, poorly characterized. Cell readouts analyzed included fold expansion, maximum density, and exponential growth rate. Our results reveal that the choice of best case culture parameters was dependent on which cell property was chosen as the primary output variable. Subsequent statistical analyses via two-way analysis of variance indicated significant interaction effects between inoculation density and agitation rate specifically in the case of exponential growth rates. Results indicate that stepwise optimization has the potential to miss out on the true optimal case. In addition, choosing an optimum condition for a culture output of interest from the factorial design yielded similar results when repeated with the same cell line indicating reproducibility. We finally validated that human ESCs remain pluripotent in suspension culture as aggregates under our optimal conditions and maintain their differentiation capabilities as well as a stable karyotype and strong expression levels of specific human ESC markers over several passages in suspension bioreactors.
Introduction
R
Static culture of human ESCs, which is used throughout the field, is limited by the surface area as well as the potential for heterogeneous growth conditions between flasks. As a result, we and others have examined large-scale on-line suspension bioreactors as an extremely attractive culture platform.7–9 A summary of the main operating conditions reported in all publications to date utilizing stirred suspension bioreactor systems for the culture of human ESCs as aggregates is presented in Table 1 (studies utilizing microcarriers were not included). Upon review of this summary, it is evident that there is little consistency between published protocols with an incredibly wide range of stirred suspension bioreactor systems, physical parameters, and inoculation densities making an objective comparison between culture outputs extremely difficult. Some groups have reported optimization attempts for these culture systems that use stepwise experimental designs. 10 Often the first condition that yields positive results is accepted as the optimum result and no further study is pursued. Biological stirred suspension bioreactor systems are complex—each change in culture condition affects the cells, which leads us to believe that there are no straightforward solutions to process optimization within the context of cell growth. 11 There are interactions and confounding factors at play which, to date, have been largely unexplored.
ND, no data given.
Here we describe an approach to elucidate interaction effects between two main aspects of human ESC stirred suspension culture: (1) inoculation density and (2) agitation rate. These are easily controlled yet their interactions are poorly characterized and understood in the literature. The term interaction effect refers to whether the impact of one factor on the responding variable is dependent on the level of another factor (i.e., whether the changing agitation rate has the same effect on final cell numbers at different inoculation densities). We used a two-factor, three-level (32) full factorial design resulting in nine conditions run in duplicate leading to 18 total experimental runs. Two-way analysis of variance (ANOVA) indicated both input variables as having significant effects on the culture parameters of interest (fold expansion, maximum cell density, and exponential growth rates) with the agitation rate showing the strongest effect. Interactions between the two input variables were also observed with the largest interaction observed with exponential growth rates. Subsequently, results from our initial factorial experiment were used to determine an optimum agitation and inoculation density for one cell output variable (fold increase [FI]). Using the optimal agitation rate and inoculation density for a second cell line yielded similar FI, maximum cell density, and growth rate illustrating reproducibility of the protocols. We also show maintenance of essential ESC characteristics after several passages when using these conditions.
Materials and Methods
Static feeder-free maintenance of human ESC lines
Both H1 and H9 (WiCell) human ESC lines were maintained in standard culture conditions (37°C, 5% CO2, 100% humidity) on BD Matrigel™ (BD Biosciences)-coated 60-mm tissue culture dishes with a complete mTeSR™1 medium as per the manufacturer's recommendations (StemCell Technologies) and passaged as small clumps via enzymatic and mechanical treatment every 4 to 5 days. Briefly, cultures were washed twice with the DMEM/F12 after which, 2.0 mL of dispase (1 mg/mL) (StemCell Technologies) was added to the dish. Cultures were treated for 7–10 min, and then dispase was removed after the colony edges lifted and the cultures were washed twice with the DMEM/F12. Next, 2.0 mL of the mTeSR1 medium was added and all colonies removed with a 5-mL pipette. Cells were replated onto Matrigel-coated dishes at a 1:6 split.
Factorial design
To determine the combined effects of different culture parameters, a two-variable, three-level factorial design was used (see Fig. 1A for a visual layout of all nine cases). This full factorial design allows for all possible combinations to be studied to determine the effect of each factor on the response variable as well as potential interactions between factors that are not detected using a stepwise approach. Values for each factor were determined through a combination of past experience within our laboratory as well as review of published protocols. As such, we aimed for a low density of 2×10⁴ cells/mL, medium density of 4×10⁴ cells/mL, and high density of 8×10⁴ cells/mL. Agitation levels were set at 80 rpm for low, 100 rpm for medium, and 120 rpm for high.

Experimental setup for factorial design with spinner flask information.
Aggregate formation for stirred suspension bioreactor inoculation
Human ESC lines maintained in static culture on Matrigel were treated with Accutase (EMD Millipore)+10 μM ROCK inhibitor (EMD Millipore) for ∼5 min to generate a single-cell suspension. Cells were removed into a 15-mL conical tube (BD Falcon) and the dishes washed twice with the DMEM/F12+10 μM ROCK inhibitor. Cells were centrifuged at 1000 rpm for 4 min, washed twice with the DMEM/F12+10 μM ROCK inhibitor, and finally resuspended in mTeSR1+10 μM ROCK inhibitor. Two 100 μL samples were taken for cell counts to determine the total cell number. The single-cell suspension was replated into an untreated 60-mm culture dish and allowed to aggregate for 4 h in static conditions. After 4 h, the small aggregates (measured as 50–80 μm, data not shown) were seeded into the suspension bioreactor flasks into a working volume of 100 mL at an agitation rate of 100 rpm.
Stirred suspension bioreactor culture
As described above, H9 cells were dissociated into a single-cell suspension and allowed to aggregate before inoculation. Stirred suspension bioreactors were then inoculated at low (∼2×10⁴ cells/mL), medium (∼4×10⁴ cells/mL), and high (∼8×10⁴ cells/mL) densities (based on initial cell counts for the entire dish before aggregation, subtracting the fraction of single cells remaining after 4 h assuming a relatively even distribution of aggregate sizes). No medium changes were carried out during the culture period. Long-term suspension cultures were passaged every 6 days via enzymatic dissociation with Accutase and new cultures initiated through the same aggregation process as described above.
Determination of cell number and viability
For cell counts, each stirred suspension bioreactor was removed from the incubator and placed on a magnetic stir plate in a biosafety cabinet to ensure continuous mixing. A 2.0 mL sample was taken, while the stirred suspension bioreactor was still on the plate. Each sample was first placed in a 35-mm tissue culture dish for photomicrographs and aggregate measurements (via Zeiss Axiovision software). Cell aggregates were dissociated into a single-cell suspension via treatment with 0.25% Trypsin-EDTA (Invitrogen) for 8 min at 37°C after which, all cells were gently pipetted five times and the DMEM+15% fetal bovine serum (FBS) added to deactivate the trypsin. Subsequently, two 100 μL samples (with each condition in duplicate resulting in 4 counts per condition) were taken for counting via the trypan blue exclusion method. The exponential phase cell growth rates were calculated as
where 1 and 2 indicated the start and end of the exponential growth phase as determined through logarithmic plots of the entire growth curve (typically between 48 to 96 h in culture). FI was calculated as
In these cases, Xo was the viable inoculation cell density, x1 was the viable cell density at the start of exponential growth, x2 was the viable cell density at the end of exponential growth, XM was the peak viable cell density, t1 was the time at the start of the exponential growth phase, and t2 was the time at the end of the exponential growth phase. Cell counts were not carried out until 48 h in culture so as not to disturb initial acclimatization of cells to the suspension conditions.
Calculation of shear stress
The maximum shear stress that was present in the fluid in suspension was determined for all three agitation rates as per Sen et al.12,13 The maximum shear stress was calculated as
where τMAX is the maximum shear stress (Pa), ρ is the medium density (kg/m3), ν is the kinematic viscosity (m2/s), and ɛ is the power dissipation per unit mass, which is calculated as
where VL is the working volume within the stirred suspension bioreactor (m3) and P is the power input (W). Power input was estimated as follows:
where N is the agitation rate (rotations per second), Di is the impeller diameter (m), and NP is the power number as per Nagata.
14
The power number is dependent on vessel geometry as well as the Reynolds' number, which for the stirred suspension bioreactor used in this study is calculated as a function of the agitation rate and impeller diameter:
All values for vessel geometry used in these calculations are shown in Figure 1B.
Immunocytochemistry
Static cultures
This protocol applies to pluripotent cells replated from suspension bioreactor-generated aggregates as well as in vitro differentiation via embryoid body (EB) formation. Cells were fixed in 4% paraformaldehyde (PFA) (Malinckrodt), washed three times with 1× phosphate-buffered saline (PBS), permeablized with 0.1% Triton-x 100 (Sigma Aldrich) for 15 min at room temperature, and then washed three more times with 1× PBS. Next, samples were incubated with PBS containing 10% FBS (Invitrogen) to block nonspecific binding of antibodies for 30 min at room temperature. For pluripotent cultures, primary antibodies against Nanog, Oct4, SSEA-4, TRA-1-60, and TRA-1-81 (Millipore) were diluted to a working concentration (1:100 dilution) in PBS+10% FBS, added to the samples, and kept at 4°C overnight. Similarly, for differentiation cultures, primary antibodies against β-III-tubulin, α-smooth muscle actin, and α-fetoprotein (Sigma Aldrich) were diluted to the working concentration (1:400 dilution) in PBS+10% FBS, added to the samples, and kept at 4°C overnight. For both conditions, after three washes with 1× PBS, the secondary antibody, Alexa Fluor 546 (Invitrogen), was diluted to a working concentration (1:200 dilution) again in PBS+10% FBS, added to the samples, and then incubated at room temperature for 2 h. Finally, three more washes with 1× PBS were carried out and 1.0 mL 1× PBS added to each well for imaging.
Aggregates
Aggregate samples were taken on day 4 of the third passage in suspension culture and fixed in 4% PFA, washed three times with 1× PBS (centrifuging at 300 g for 3 min after each wash), and permeabilized with 0.75% Saponin (Sigma Aldrich) for 30 min at room temperature. After three more washes, 1× PBS+10% normal goat serum (NGS) (Invitrogen) was added to the cell pellet and the full volume split equally into 3 microcentrifuge tubes. The first set of primary antibodies Oct4 (1:100 dilution; BD Biosciences), Sox2 (1:100 dilution; Millipore), and Nanog (1:100 dilution; Santa Cruz) were added one per tube, and then incubated at 37°C for 2 h. After three washes with 1× PBS, the corresponding secondary antibodies of Alexa Fluor 594 (Oct4 and Sox2) and Alexa Fluor 488 (Nanog) (all 1:100 dilution; Invitrogen) were diluted to a working concentration in PBS+10% NGS and incubated for 2 h at 37°C. These steps were repeated for a second set of primary (TRA-1-60, TRA-1-81, and SSEA4—all 1:100 dilution; Millipore) and secondary antibodies (Alexa Fluor 488 for TRA-1-60 and TRA-1-81, Alexa Fluor 594 for SSEA4—all 1:400 dilution; Invitrogen). The nuclear stain ToPro-3 (Invitrogen) was then added at a 1:500 dilution to the cultures for 30 min at 37°C. Three final washes were carried out, after which, the aggregates were mounted on slides using a 9:1 solution of glycerol:PBS. Spacers were adhered to the slide before mounting to avoid compressing the aggregates and distorting subsequent images. Slides were analyzed using a Zeiss LSM 700 confocal microscope with 488-, 555-, and 639-nm filters.
Flow cytometry
Cell aggregates were dissociated into a single-cell suspension via trypsinization (as previously described for cell counts) after which, they were fixed with 4% PFA and washed three times with 1× PBS. Cells were then permeabilized with 0.75% Saponin (Sigma Aldrich) for 15 min at room temperature. After two washes with 1× PBS, cells were then resuspended in PBS+3% bovine serum albumin for 30 min at 37°C. The cell suspension was then split up into microcentrifuge tubes and the following antibodies were added to each: Oct4-Alexa Fluor 488 conjugate, Nanog-FITC conjugate, Sox2-FITC conjugate, SSEA4-PE conjugate, TRA-1-60-FITC conjugate, and TRA-1-81-FITC conjugate (all Millipore; 1:200 dilution in a total volume of 100 μL). Mouse IgG Alexa Fluor 488, mouse IgG1 FITC, mouse IgG2b FITC, mouse IgG3 PE, and mouse IgM FITC were used as isotope controls for the primary antibody isotypes. Samples were incubated for at least 60 min at 37°C after which, they were washed three times with 1× PBS and resuspended in 200 μL PBS, and then stored at 4°C in the dark until analyzed. Flow cytometric analysis was performed with a BD FACSAria III at the University of Calgary Flowlab.
Karyotype analysis
Karyotype analyses of both human ESC lines were carried out using the G-banding method. In brief, cells were incubated with 0.1 μg/mL colcemid (Sigma Aldrich) at 37°C for 60 min, trypsinized, resuspended, and incubated in 0.068 M KCl for 20 min at room temperature, and then fixed with 3:1 methanol:glacial acetic acid three times and dropped to make the spread of chromosomes on the slides. The dried slides were baked for 90 min at 80°C, treated with 0.05% Trypsin (Invitrogen) for 30 s to 1 min, and then stained with the Giemsa and Leishman's solution (Sigma Aldrich). 15 At least 10 metaphase spreads were analyzed for human ESCs grown in each culture condition.
In vitro differentiation
Aggregates from suspension culture were dissociated into single cells and replated on 60-mm agar-coated tissue culture dishes in a differentiation medium consisting of the DMEM (Invitrogen), 15% FBS, 10 μM ROCKi, 1 mM L-glutamine (Invitrogen), 0.1 mM β-mercaptoethanol (Invitrogen), and 1 mM nonessential amino acids (Invitrogen). After 8–10 days, EBs were harvested and replated in the same medium without ROCKi onto gelatin-treated 35-mm dishes or four-well plates to encourage attachment. Replated EBs were fixed at 48, 96, and 144 h and stained for immunocytochemical analysis of early differentiation markers for each germ layer.
Statistical analysis
Data are presented as a mean value±one standard deviation on either side of the mean to encompass ∼70% of all values. SYSTAT 12 (Systat Software) was used to conduct either one-way or two-way ANOVA with subsequent Tukey's post hoc testing on data with a significant result indicated as p<0.05. Excel was used to generate the first order surface response plots for the factorial experiment results.
Results
Cell growth, aggregate diameters, and corresponding shear values
The primary motivation for culture of stem cells in stirred suspension bioreactors is the potential to reproducibly generate large numbers of cells in a short time frame under controlled conditions (i.e., scaled-up production). As such, the main experimental readouts of interest in this study were the viable cell numbers for each of the 9 conditions. Figure 2A shows the resulting growth curves with viable (live) cell concentrations and percentage viability for each condition grouped by agitation rates. Figure 2B–D also includes photomicrographs over the course of the experiment as well as box and whisker plots indicating an aggregate diameter. At the lowest agitation rate (80 rpm), cells inoculated at all three inoculation densities failed to thrive. By 96 h, large aggregates began to break up into smaller irregular fragments, which were reflected in the box and whisker plots showing a large number of outliers as well as either a constant or decreasing mean aggregate diameter and in the case of high inoculation density, by 120 h, there were few viable cells present (Fig. 2B). While the mean aggregate diameters remained between 100 and 200 μm, it is possible that the low agitation rate was insufficient to keep the aggregates suspended, and therefore, the cells would not have been exposed to a homogeneous environment (insufficient mixing of nutrients). Similarly, cells inoculated at all three inoculation density levels at the high agitation rate (120 rpm) failed to thrive. In this case, however, the results suggest that the shear stress may have been too high since the average diameter in the medium and high inoculation density cases were relatively unchanged as were the overall cell numbers. We observed a great deal of single cells and debris within the culture, which was another indicator of excessive shear forces (Fig. 2D). The midrange agitation rate of 100 rpm yielded the most positive results with respect to cell numbers and viability. After day 5, the range of values for the diameter increased dramatically; the cause of this is uncertain since the average aggregate diameter holds steady at about 200 μm (Fig. 2C).
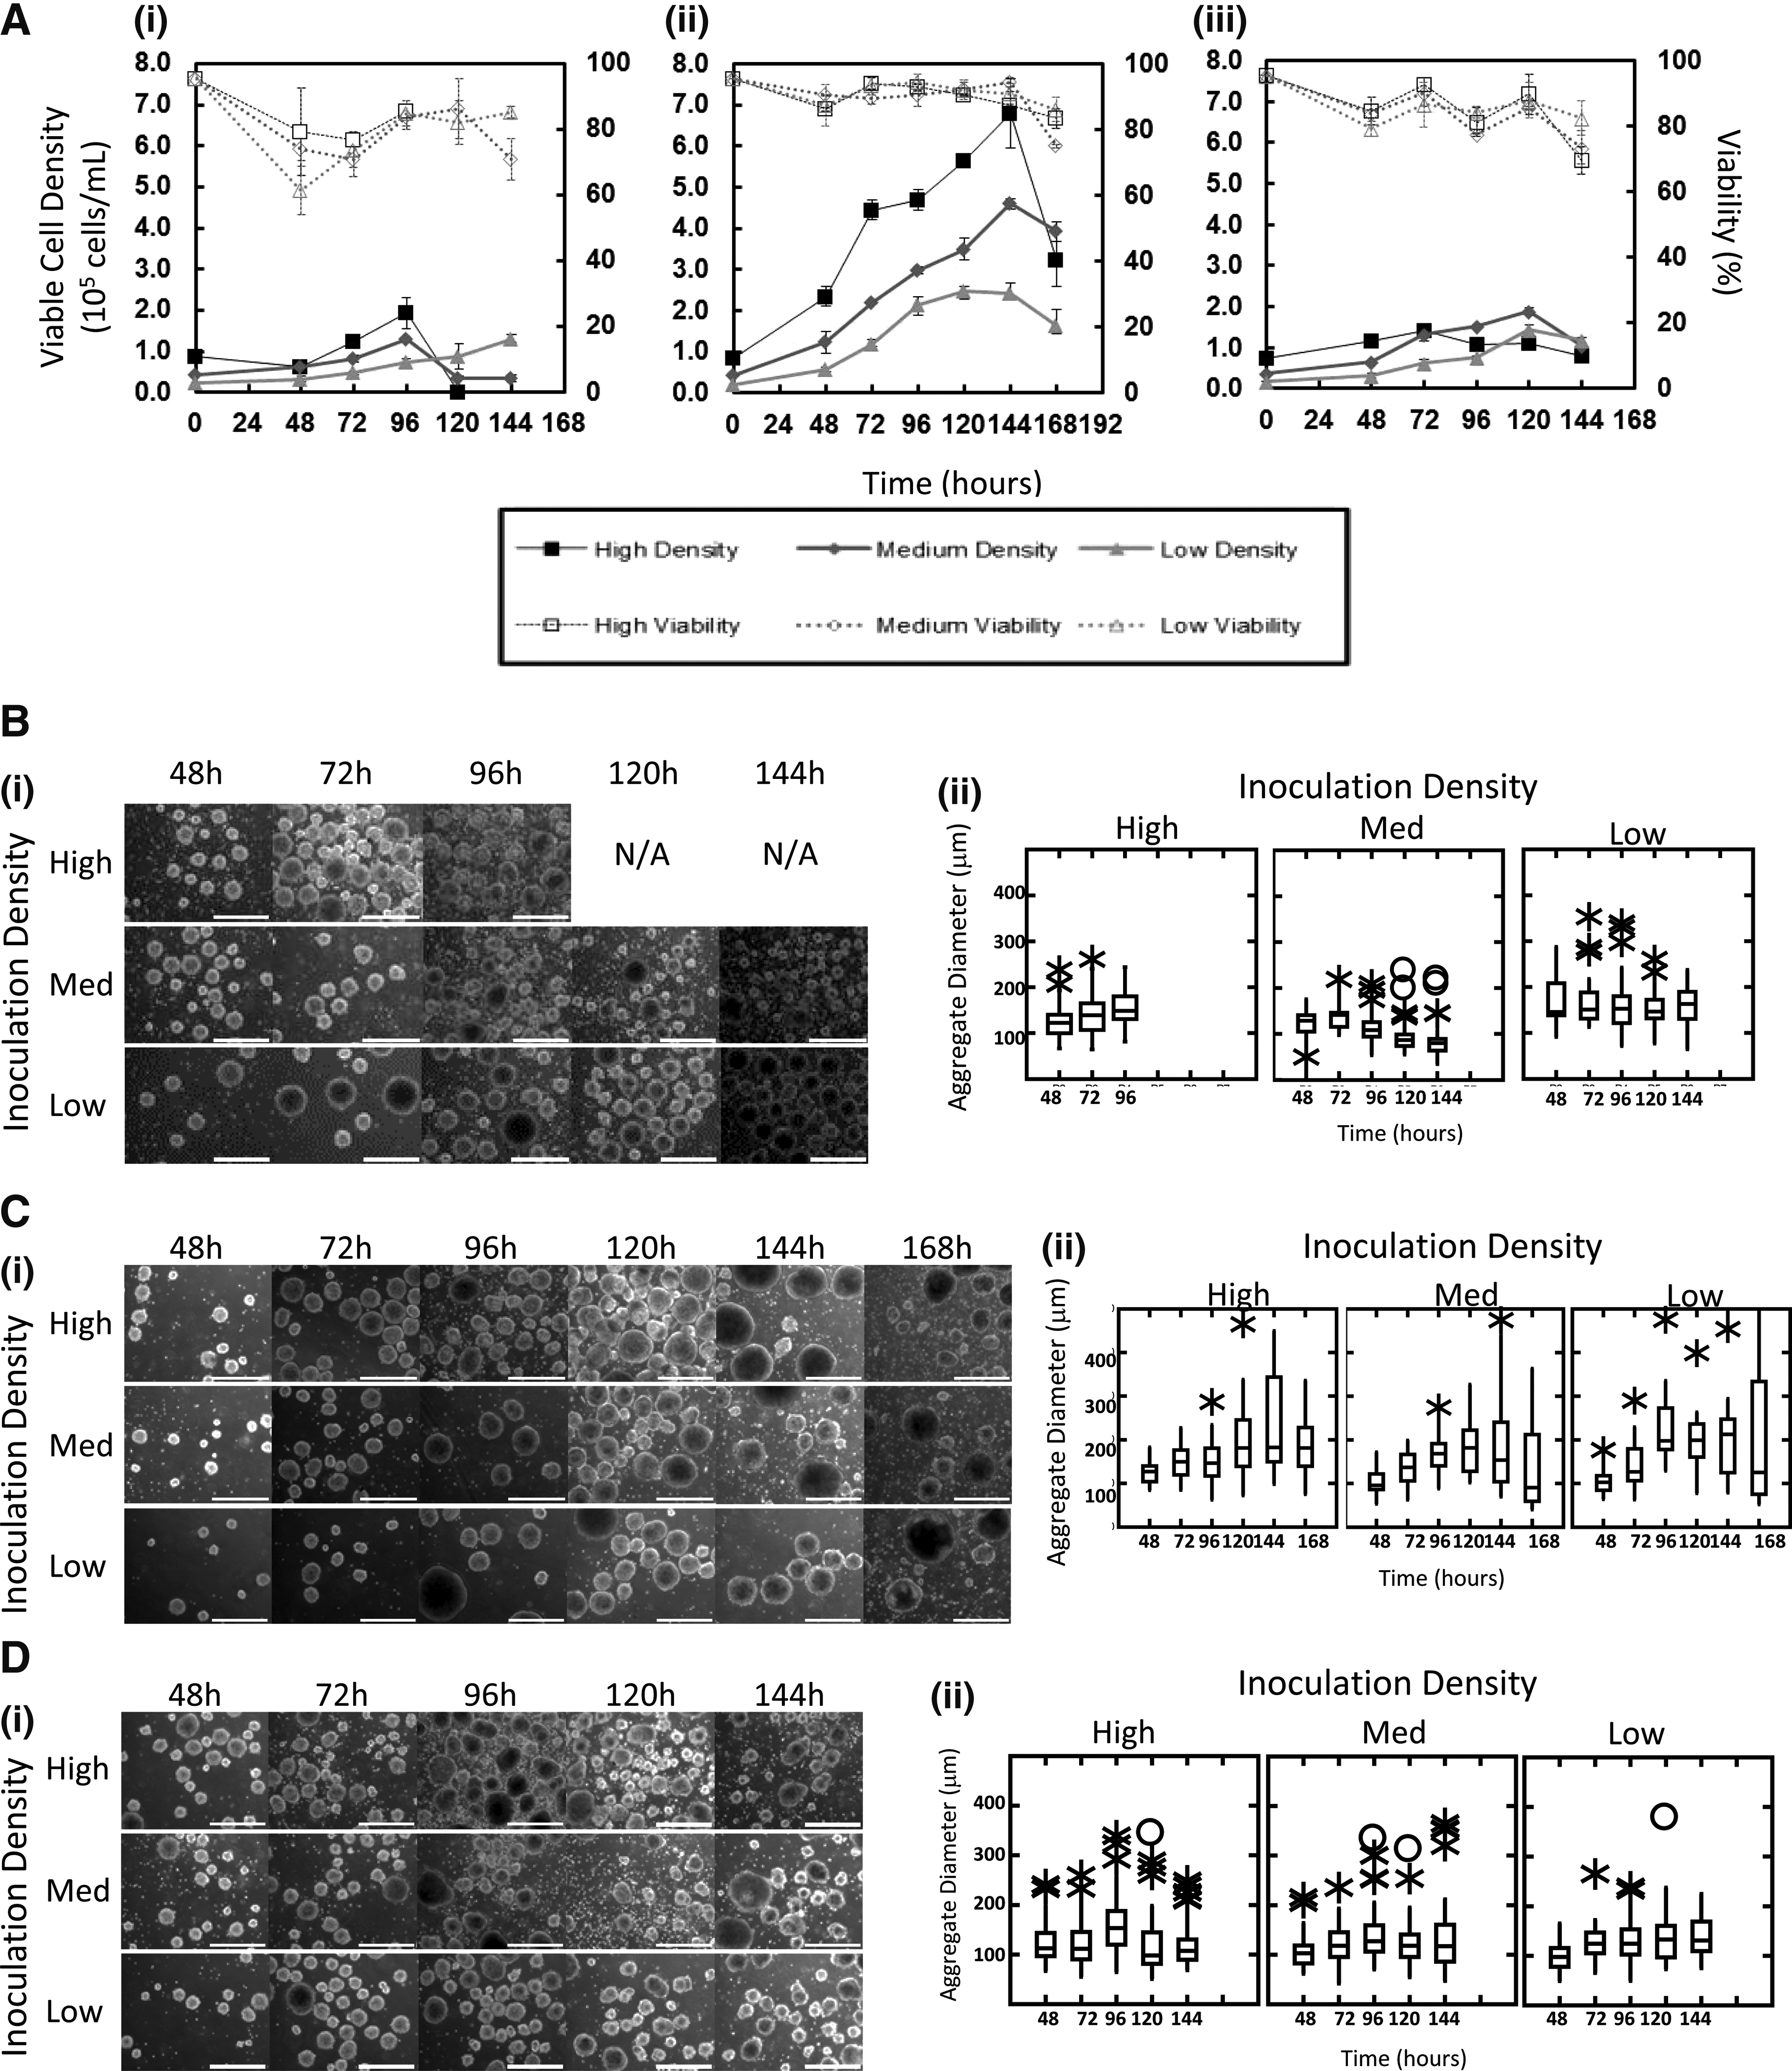
Factorial design of experiments and resulting cell numbers and morphology.
The current study was completed by using a particular vessel and impeller geometry, and for the results to be more applicable to other systems, engineering parameters such as the maximum shear stress, power-input per unit mass, and the Reynolds number need to be determined. 16 We have previously studied the effects of the agitation rate and media viscosity on the growth of murine neural stem cell aggregates in the same bioreactor system.12,13 We found that the maximum aggregate size correlated with the power dissipated per unit mass and that the shear stresses in the stirred suspension bioreactor would not be expected to cause damage to the cells below 100 rpm. Using these correlations for the stirred suspension bioreactors used in the current study, we determined Reynolds numbers, power dissipation per unit mass of medium, and maximum shear stresses at each agitation level as shown in Table 2.
Calculated culture properties and two-way ANOVA results
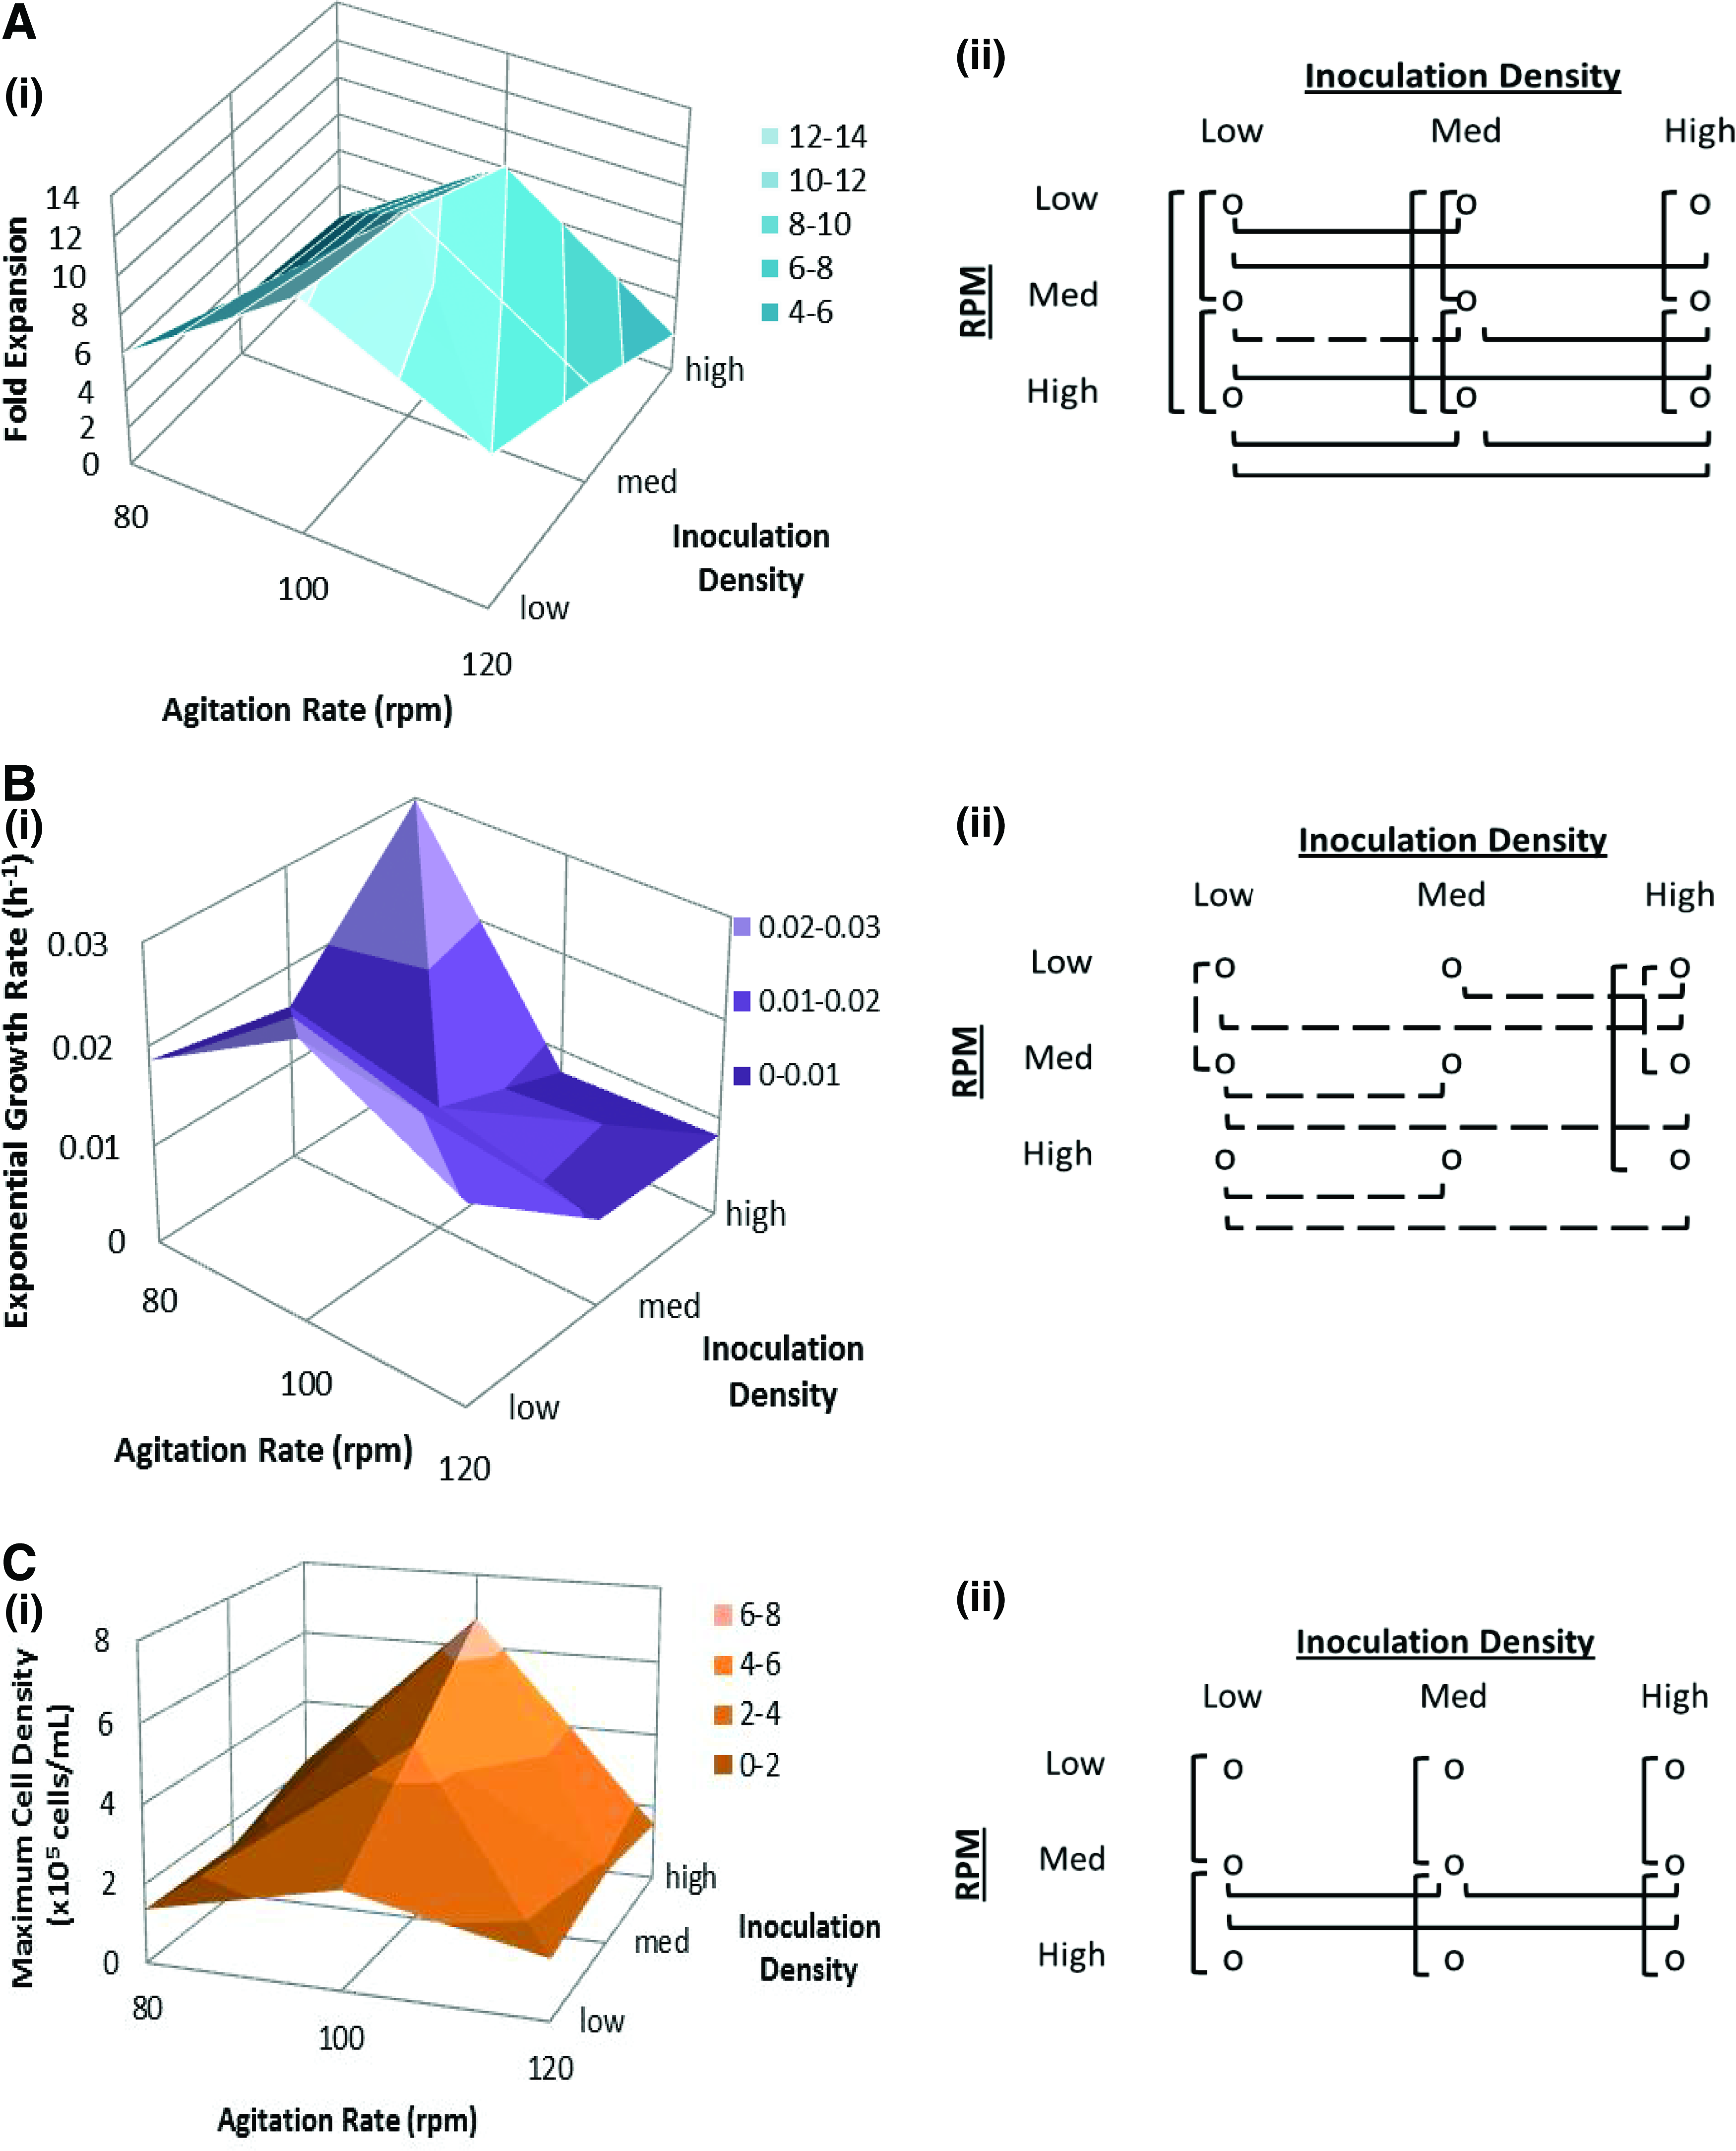
Basing culture success on cell density or cell number alone fails to take into account cost and time variables. A larger starting population would be expected to yield higher final numbers; however, it also takes more time and materials (and therefore higher cost) to generate this initial population, which is why, perhaps, the overall FI (final viable cell density/inoculation viable cell density) may be a better measure of culture performance. In addition, cell growth kinetics may be of interest since optimizing growth rates (and hence, doubling times) will ensure faster production of cells, which can be a controlling variable for designing scalable cost-effective processes. These values are all easily determined from the cell growth curves. They have been presented in Figure 3 as first order average value surface plots to illustrate the main effects of both culture variables studied [part (i) of Fig. 3] on the specific output variable. Additionally, two-way ANOVA were conducted on data sets for each of the three output parameters. Initial ANOVA results indicated significant differences within each effect group as well as between the groups for each of the three output variables investigated. Tukey's post hoc analyses were run to determine where within each group the significant differences occurred so as to verify the main effects. Results of the Tukey's analyses are illustrated as specific pair comparisons for each output parameter [Part (ii) of Fig. 3]. A solid line indicates p<0.001, a dashed line indicates p<0.05, and the absence of a line indicates no significance.
Calculated culture properties and statistical analysis.
For FI, Figure 3Ai shows a ridge along the medium agitation rate (100 rpm) with an apparent peak at low inoculation density (FImax=12.23). The two-way ANOVA resulted in p<0.001 for both inoculation density and agitation rate as well as for the combined effect of both. Post hoc analyses showed significant differences in 16 of 18 possible comparisons (p<0.001 for 15 comparisons, p<0.05 for one comparison), which are equally distributed between the two variables as shown in Figure 3A (ii). From this we can conclude that inoculation density and agitation rates are both main effectors on FI. Exponential growth rates (μ), on the other hand, vary a great deal with no visible trend between conditions (Fig. 3Bi). Low agitation rates and high inoculation density resulted in the maximum growth rate of μ=0.0298 h−1. ANOVA indicates that while statistically both variables have a significant effect on the exponential growth rate, we suggest that the inoculation density is the main effector as there were more significant differences detected over the inoculation density than for the agitation rate as illustrated in Figure 3B(ii). In Figure 3Ci, the presented surface plot for maximum cell density (Xmax) appears to follow a similar trend to that for FI as the medium agitation rate (100 rpm) condition resulted in the greatest cell density across all inoculation densities (Fig. 3Ci, peak at high inoculation density, Xmax=6.8×10⁵cells/mL). Statistical analyses indicated that the effect of varying agitation rates at each inoculation density is similar (columns) showing significant effects between low/medium and medium/high, which we interpret to indicate that the agitation rate is the main effect on maximum cell density. Conversely, the inoculation level did not have significant effects on the maximum cell density when agitation rates were too high or too low—it only showed a significant effect at the medium agitation rate. This example of the effect of one input factor being different on output depending on the level of the second input factor leads to the concept of interaction effects.
Interactions between input factors
To further elucidate the effects of inoculation density and agitation rate, interaction graphs for each output variable were generated (Fig. 4). As previously mentioned, interactions exist if the impact of one of the input factors varies depending on the level of the second input factor. If the plotted lines for each condition are parallel, there are no interactions. However, if the lines cross over or follow different trends over each level, we conclude that there are, in fact, interactions between the factors.
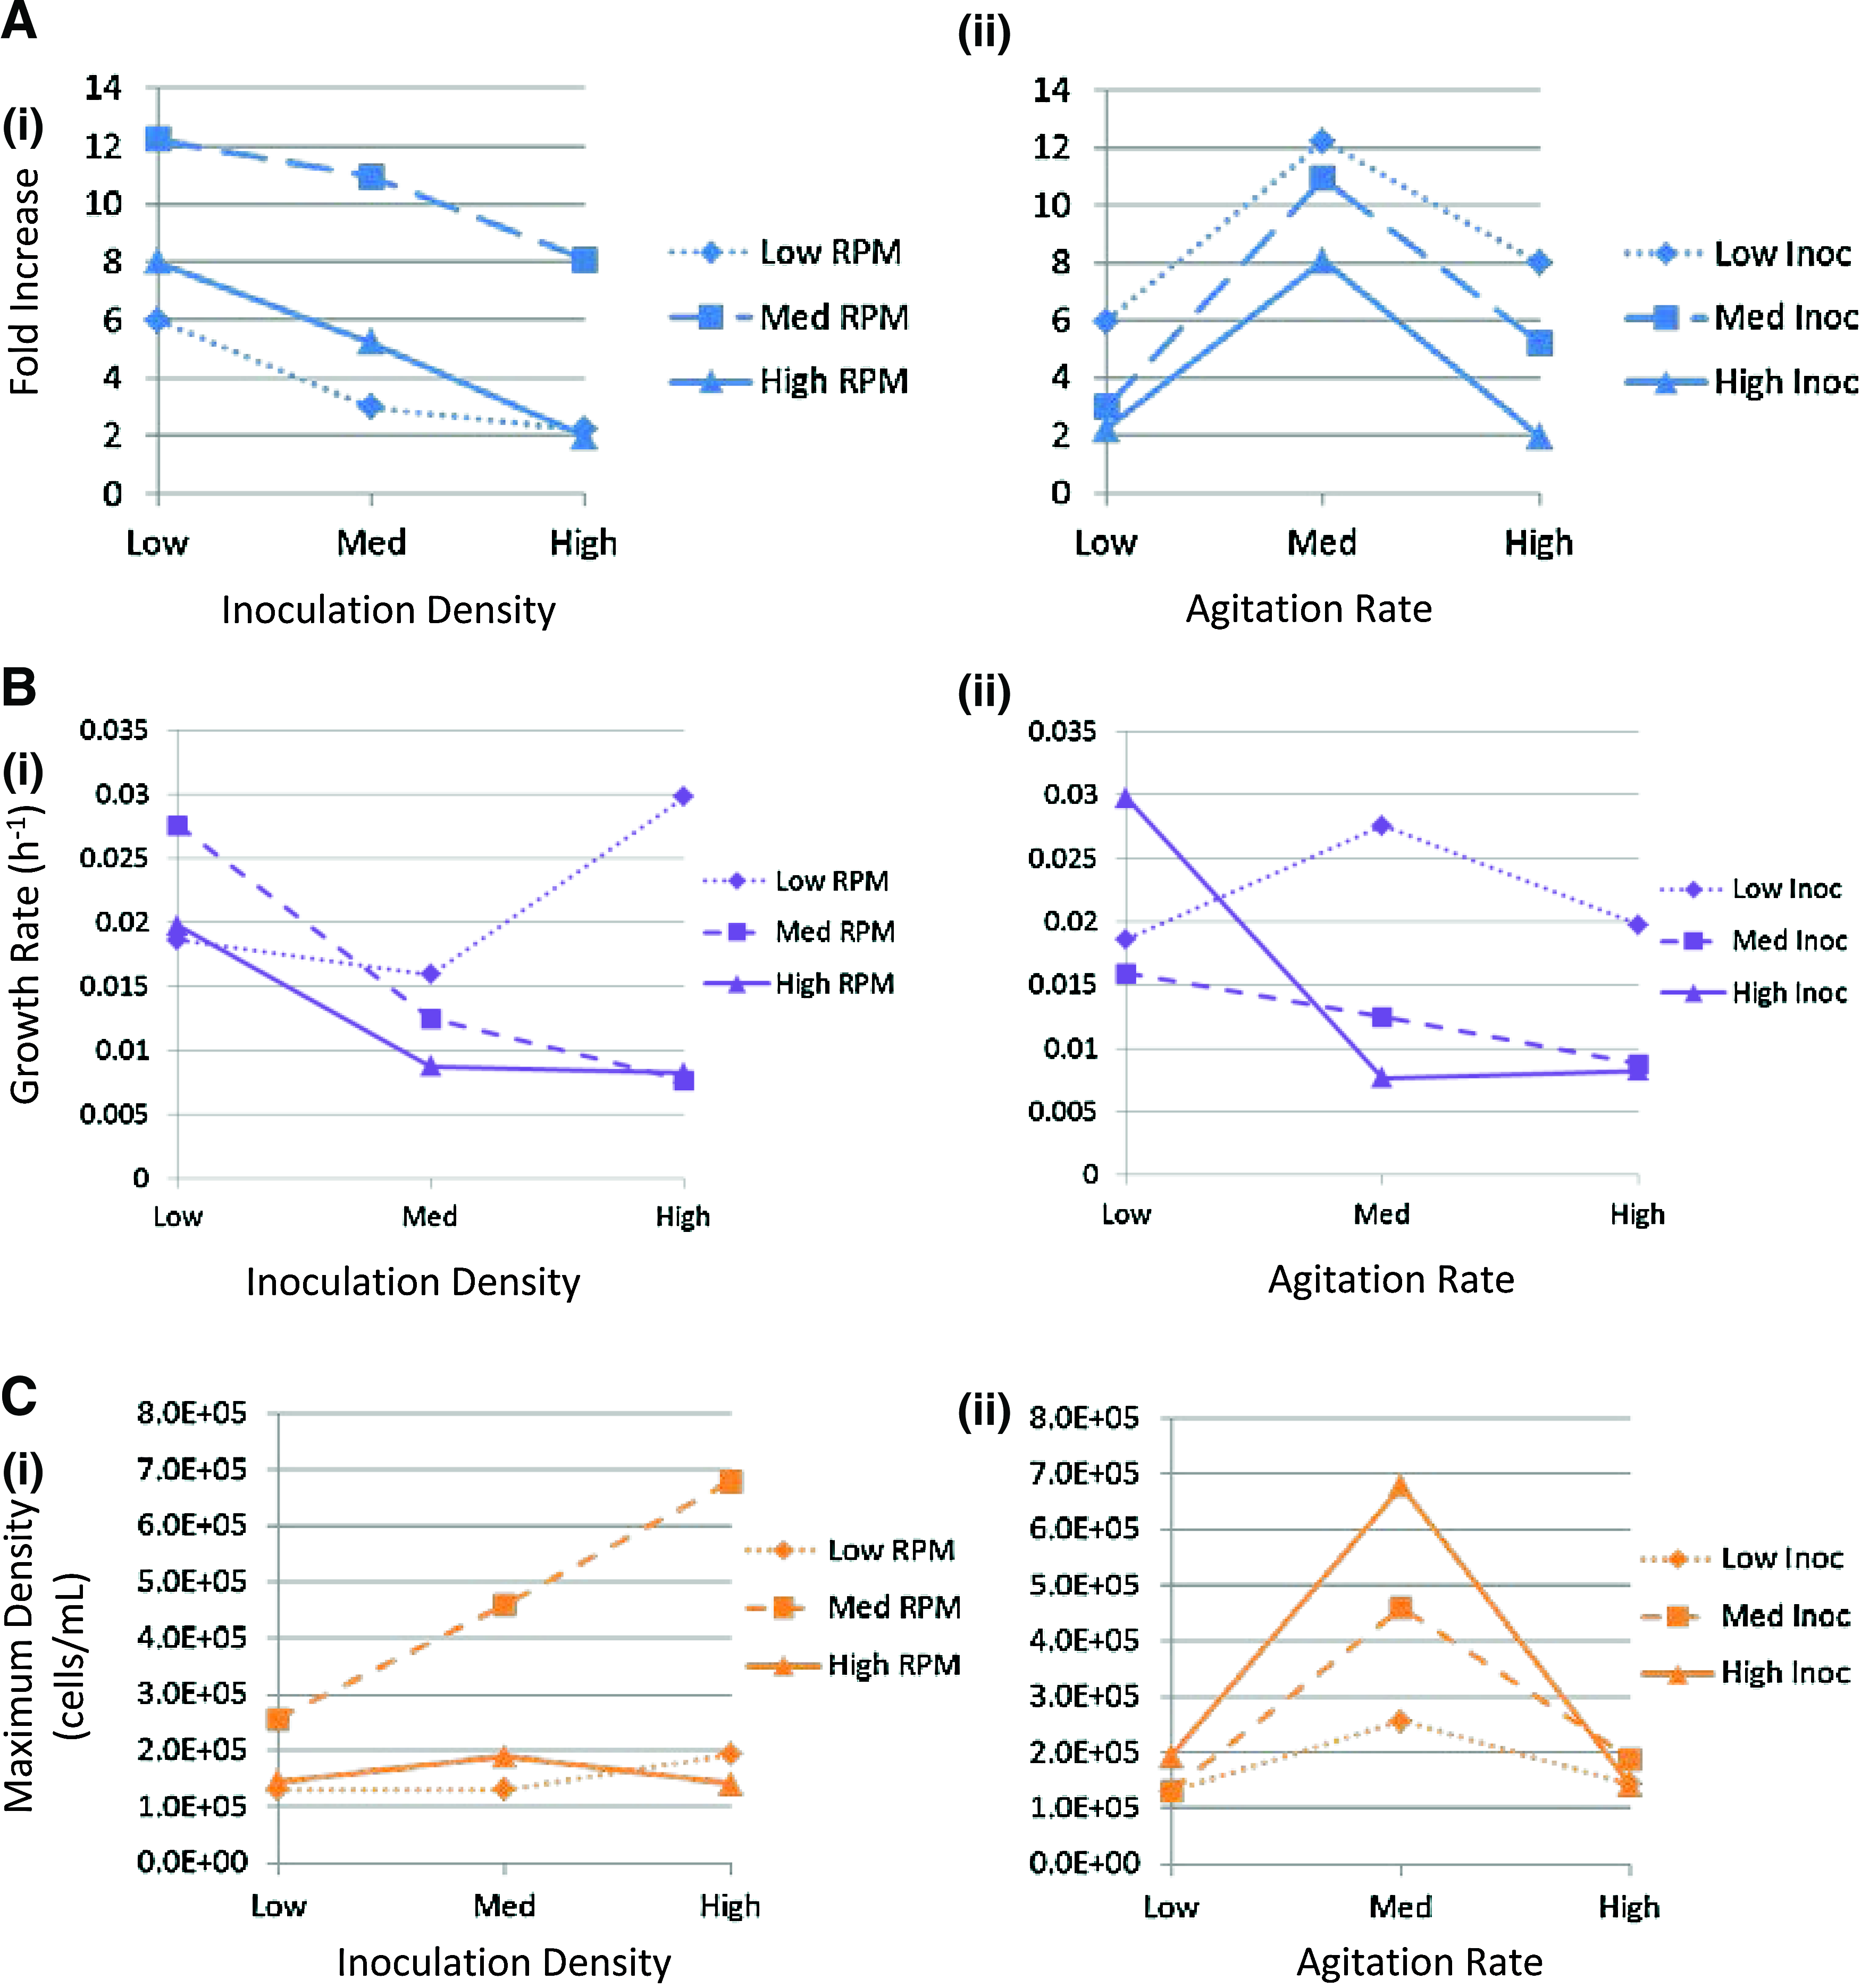
Interaction plots for each calculated culture property grouped by
For FI (Fig. 4A), the graphs illustrate no substantial interaction as the trends are parallel.
The exponential growth rate (Fig. 4B); in contrast, substantial interactions with very different trends over each condition level. Varying the inoculation density had a similar effect at both the medium and high agitation conditions [Fig. 4B(i)], however, there was a completely different effect at the low agitation rate, where the growth rate increased with higher inoculation densities. Furthermore, the varying agitation rate resulted in completely separate trends over the three inoculation levels [Fig. 4B(ii)]. These results suggest that optimizing culture for exponential growth rates cannot be carried out in a stepwise manner since the agitation rate and inoculation density do not follow consistent trends. Finally, for maximum cell density, varying the agitation rate shows similar trends between each inoculation density [Fig. 4C(ii)] with slight crossover of the lines at the low and high points interpreted as interactions at those levels. The effect of inoculation density shows a markedly different effect at medium agitation compared to low and high [Fig. 4C(i)]. As such, varying inoculation densities when using an extremely low or high agitation rate would not show a large difference in maximum cell density illustrating again that stepwise optimization has the potential to miss out on the true maximum values for peak cell concentrations.
Optimum condition characterization
When designing scale-up protocols, the goal is to maximize culture output and minimize culture input and startup costs. As such, FI is an appropriate output parameter. In this case, optimum conditions from the factorial run were determined to be the medium agitation rate (100 rpm) and low inoculation density (2.0×10⁴ cells/mL). To validate these conditions, we cultured two cell lines (H1 and H9), each in duplicate stirred suspension bioreactors at these conditions. The results shown in Figure 5 indicate similar growth rates between the two cell lines (H9=0.030±0.0052 h−1, H1=0.029±0.0050 h−1, p=0.83). However, the FI and maximum cell densities showed significant differences between the two cell lines (FI H9=11.63±0.45, H1=10.9±0.44, p=0.021, and maximum cell density Xmax H9=2.4×10⁵±0.09×10⁵ cells/mL, H1=2.18×10⁵±0.08×10⁵ cells/mL, p=0.022). This was not unexpected as these cell lines have slightly different growth kinetics between them in static conditions as well. It should be noted that the absolute values of FI, maximum cell density, and exponential growth rate for H9 presented here are similar to those determined in the factorial experiments demonstrating the reproducibility of our protocols. Flow cytometry data for the two cell lines indicated high expression of Oct4 (H9=98.1%, H1=99.3%) and Nanog (H9=97.2%, H1=96.9%) during the first passage in suspension. After validation of the culture protocol, both cell lines were continued through three successive passages in stirred suspension. At each passage, aggregates were dissociated with Accutase and ROCKi into a single-cell suspension, counted, and then allowed to aggregate for 4 h in static conditions, before being inoculated at the same level into fresh media in a new suspension bioreactor. On day 4 (96 h) of the third passage, aggregate samples of both H9 and H1 lines were taken for immunocytochemistry and stained for Oct4 and TRA-1-60, Sox2 and TRA-1-81, and Nanog and SSEA4 [Fig. 6 A(i), B(i)]. Both cell lines showed strong expression of each set of markers when merged with the nuclear stain. These results in conjunction with flow cytometry data for the same markers [Fig. 6 A(ii), B(ii)] indicated high levels of Oct4 (ranging from 92.5% to 99%) and Sox2 (ranging 98.4% to 99.6%) in both H1 and H9 cell lines. Nanog expression was lower in the H1 cell line (ranging from 54.6% to 89.5%), however, it has been noted that this particular marker is transient in expression. 17 SSEA4 was maintained above 90% in the H1 line and above 80% in the H9 line. TRA-1-60 and TRA-1-81 were expressed at lower levels (64.8% to 91.3% and 79.6% to 85.9%, respectively); however, the International Stem Cell Initiative reported mean values of percent positive for TRA-1-60 and TRA-1-81 in 44 cell lines were ∼80% for both markers indicating our results were within acceptable ranges for the H9 line. 18 The H1 line had levels of TRA-1-81 ranging from 66.5 up to 81.2% which, although lower than H9, levels are in line with what other groups have shown after more than 3 days in suspension culture. 19
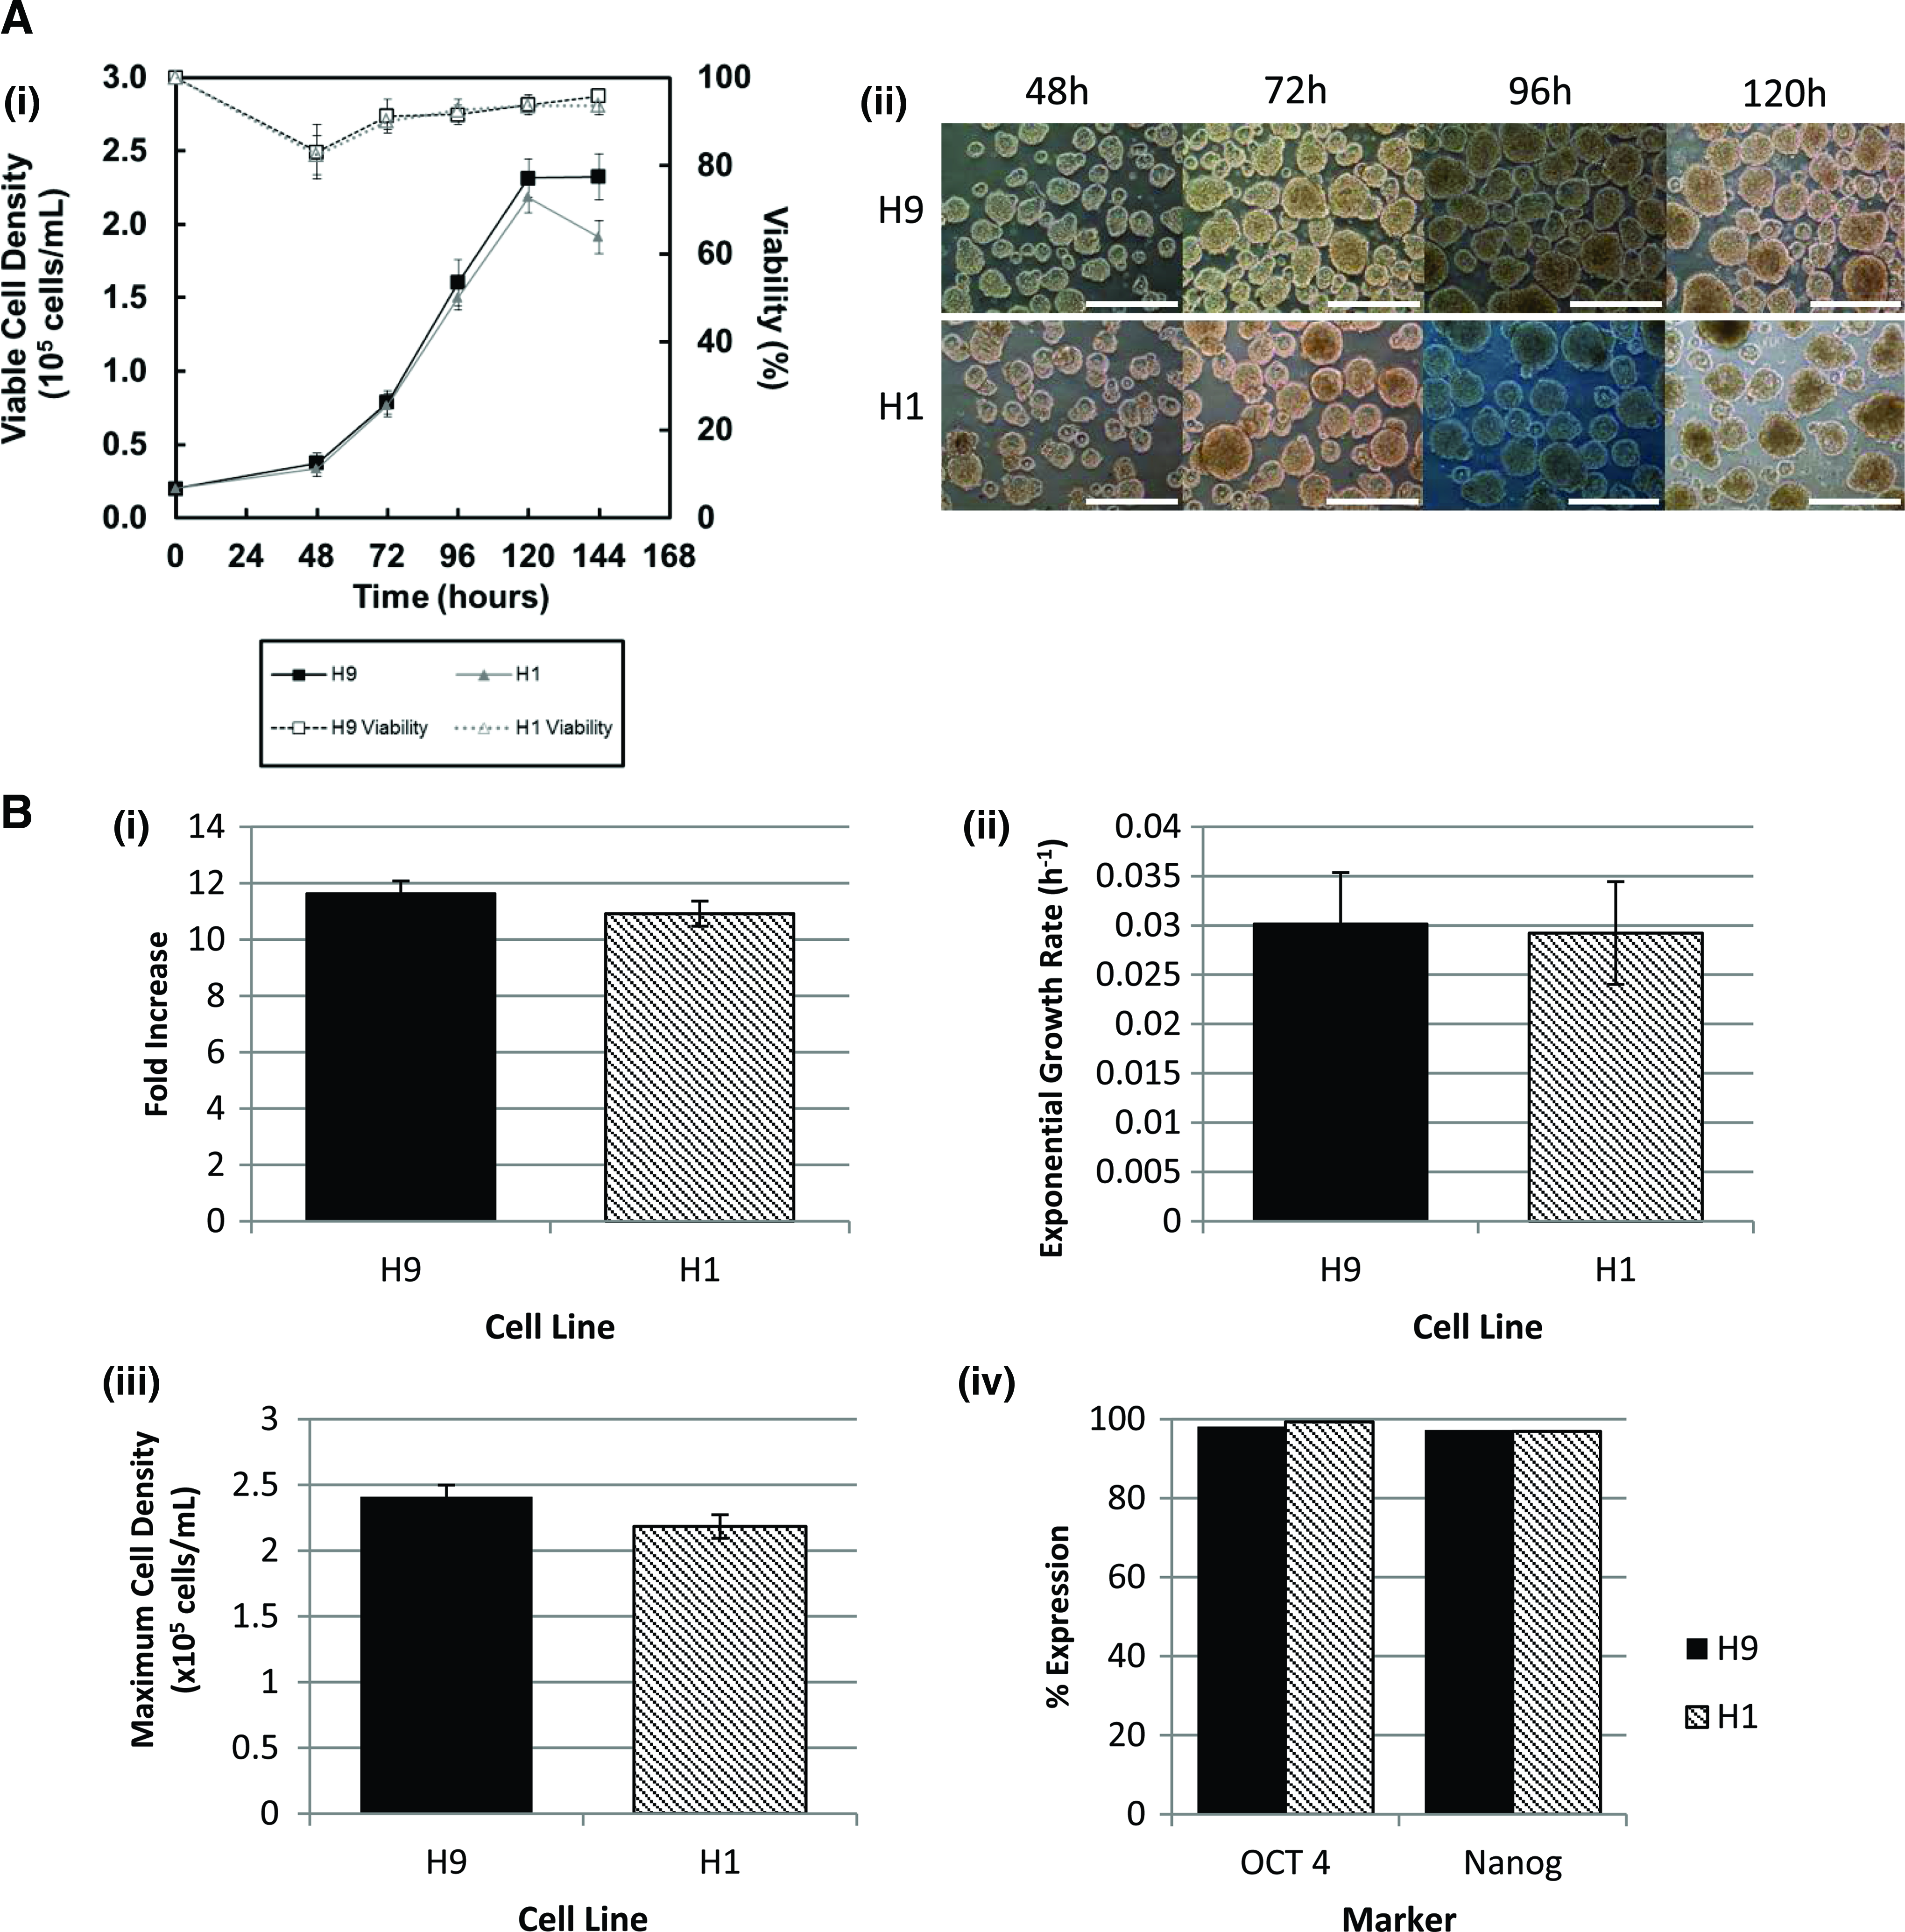
Best-case conditions for fold expansion rerun with both H9 and H1 cell lines.

Measures of pluripotency of aggregates in suspension culture.
After three passages in suspension conditions, ESCs were harvested, dissociated, and replated as single cells into static maintenance conditions. After 4 days, the static cultures were fixed and stained for standard pluripotency markers. The cell populations showed strong expression for each of Oct4, Nanog, SSEA4, TRA-1-60, and TRA-1-81 (Fig. 7A). Additionally, both cell lines maintained normal karyotype after the entire process (Fig. 7B). Finally, cells harvested from suspension conditions successfully generated EBs in static culture (data not shown). When the EBs were replated in the serum containing medium (DMEM+FBS) and allowed to undergo further spontaneous differentiation, expression of markers of early differentiation for each of the 3 germ layers was observed, again demonstrating the retention of pluripotency characteristics (Fig. 7C). This was observed for both cell lines.

Cells retain pluripotent characteristics as well as normal karyotype.
Discussion
In 2008, Kirouac and Zandstra published an insightful and comprehensive review mapping out the necessary steps for the successful development of cell-based therapies. 11 Phases included discovery (including characterization), process optimization (including process modeling and bioprocess development), production (including scale-up or scale-out methods), and final therapeutic delivery. Unfortunately, it appears that many studies related to the scale-up of human ESC cultures have attempted to bypass several steps associated with the process optimization phase by moving straight from cell characterization to scaled-up culture. Relationships between parameters and cell output are rarely quantified and there is wide variation in how these results are presented in the literature as illustrated in our initial review of protocols.
The current study was designed as a factorial experiment allowing for effects of culture parameters on cell kinetics to be mapped out showing first order relationships between the two main variables. However, not all results were expected. First, as the inoculation density increased, the FI went down, regardless of the agitation rate. We hypothesize that this was due to the fact that the cells at the higher inoculation density grew faster initially (at 80, 120 rpm, the peak cell density is much earlier at high inoculation densities than at low inoculation densities; Fig. 2), and then reached a limitation due to the buildup of a metabolite or a critical aggregate size. The reported exponential phase growth rate presented in Figure 3 would not take into account any time the cells were still growing, but not at an exponential rate. The peak exponential growth rate, which we observed for the low agitation (80 rpm)/high inoculation density case, may also in part, be explained by examining the growth curve seen in Figure 2B. This culture was the only one to experience a drop in cell density over the first 48 h, meaning that the exponential growth rate was only calculated after 48 h, while the FI was calculated using the inoculation cell density. This means the two values do not correspond to the same time period. We have observed this previously for cultures of murine ESCs in suspension bioreactors, where lower inoculation densities result in higher FI in cell numbers. 20 In addition, inoculation densities that are too low or too high result in an overall decreased cell proliferation either due to lack of critical autocrine signals (too low cell density) or buildup of metabolites (too high cell density). The same general trend applies for agitation rates, where high agitation, although resulting in increased oxygen transfer and mixing, would also result in higher shear stress values. Conversely, the lower agitation rates, although gentler on the cells, would result in less oxygen transfer and larger aggregates. This was observed in murine ESCs at 60 rpm, 20 but we did not use agitation rates this low in the current experiment. Overall, the growth kinetics (FI, exponential growth rate, and maximum cell density) were quite similar for the low and high agitation rates for most inoculation densities. This may, in part, be due to the above-mentioned effects on oxygen transfer and physical forces on the cells. Although outside the scope of the current study, there may have been other mechanotransduction mechanisms at work in our system, which we are still investigating. We have observed, at least for murine ESCs, that shear forces in the bioreactor can act to increase the expression of pluripotency factors. 21 This may, in part, explain the slight discrepancies between flow cytometry results and immunocytochemistry images for the best case run. The immunocytochemistry photographs are maximum intensity projections of the aggregate surfaces, whereas the flow cytometry results are from a total cell suspension (aggregates dissociated into single cells). The cells on the interior of the aggregates may not have had the same expression of these markers as cells on the surface. We have previously published results for murine ESCs, where we show that the shear forces present in stirred suspension bioreactors can influence the expression of pluripotency markers. 21 Since cells on the surface have a higher exposure to shear, then these markers would have greater visibility in a photomicrograph, but could have lower expression upon analysis like FACs that includes all of the cells in the aggregates.
Following the factorial approach, our best case scenario ultimately resulted in an overall FI between 11 and 12 over 6 days, which is much larger than the majority of reports as listed in Table 1 (between 2 and 6 FI), on par with Krawetz et al. (12-fold over 6 days) 15 and less than Amit et al. (17.7 over 6 days, however, this was stated as unpublished data with no information on agitation rates). 26 It is unfortunately difficult to objectively compare the overall efficiencies between published protocols and this study without more details on spinner flask geometries, related shear rates as well as overall cell viability all of which are not typically reported.
Having shown that inoculation density and agitation rates were indeed main effectors on growth kinetics, further studies can build from these values and more complicated factorial designs (composite designs) can be carried out based on a greater number of input variables to develop polynomial response surface models.22–24 This could lead to the development of a mathematical/predictive computer model to identify critical system features or control points that we are not currently aware of within suspension systems. In summary, the work presented here will hopefully serve as a starting point for thorough, multifactorial optimization when developing bioprocesses for stem cell expansion and differentiation.
Conclusions
The work presented here is one of the first investigations into interaction effects of culture variables within stirred suspension bioreactor culture of human ESCs. We showed through completion of a full factorial design that there are, in fact, substantial interaction effects between two input variables—inoculation density and agitation rates. This suggests for the first time that stepwise optimization of stem cell bioprocesses is not an appropriate approach when considering scaled up production for regulatory approval. This has implications across all the bioprocess designs, not just human ESCs. All cell types considered for large-scale production would benefit from a thorough investigation into the interaction effects to optimize culture output.
Footnotes
Acknowledgments
M.M.H. would like to thank Laurie Kennedy (University of Calgary Flow Cytometry Lab) for help running samples as well as Krishna Panchalingam (University of Calgary, PPRF) for help with the immunocytochemistry protocols for cell aggregates as well as technical support with the confocal microscope. M.M.H. was funded by Natural Sciences and Engineering Research Council of Canada (NSERC) and Alberta Innovates—Technology Futures (AITF). Funding came from NSERC and the Canadian Institutes of Health Research (CIHR) through a Collaborative Health Research Project (CHRP) grant.
Disclosure Statement
No competing financial interests exist.