
Abstract
A quantitative analytical method was proposed for measuring cell co-migration, which was defined as two or more cells migrating together. To accurately identify and quantify this behavior, cell migration on fibroin substrates was analyzed with respect to intercellular distance. Specifically, cell size was characterized by major diameter, and then, based on these measurements and cell center data, a specific threshold distance for defining co-migration was determined after analyzing cell motion using the Voronoi diagram method. The results confirmed that co-migration occurrences of rounded cells were significantly more stable on fibroin than on ProNectin substrates under the present experimental conditions. The cell co-migration analysis method in this article was shown to be successful in evaluating the stability of cell co-migration and also suggested the presence of “critical distance” where two cells interact on fibroin substrates. With further research, the cell co-migration analysis method and “critical distance” may prove to be capable of identifying the aggregation behavior of other cells on different materials, making it a valuable tool that can be used in tissue engineering design.
Introduction
C
Fibroin is one of the component proteins in silk produced by Bombyx mori silkworms, and is widely used in biomedical applications. 2 Moreover, in the field of tissue engineering, many researchers have investigated fibroin's ability to be used as a regenerative scaffold for various tissues, such as bone tissue3,4 and cartilage.5–7 Kawakami et al. used fibroin sponges as scaffolds for chondrocyte cultivation and demonstrated that initial chondrocyte aggregation in fibroin sponges led to enhanced cartilage tissue formation. 7 Additionally, in a previous study by the authors, the collective behavior of cells on fibroin substrates was investigated, and it was observed that fibroin was able to both enhance cell–cell interactions during cultivation and control the speed of cell aggregation behavior during cell migration. 8 From both scientific and engineering viewpoints, the understanding of cell–cell and cell–substrate interactions is important for clarifying and regulating cell aggregation and subsequent tissue formation. However the mechanisms by which matrices (e.g., fibroin) influence events such as cell aggregation remain yet to be clarified.
Cell aggregation has been observed in many studies,8–12 but a number of these studies have been qualitative and highly researcher dependent. A few studies, however, have been successful in applying quantitative evaluation methods to cell behavior analysis.8,10,13 In a previous study, the authors evaluated chondrocyte aggregation on fibroin substrates using Voronoi diagram analysis, 8 which proved to be successful in identifying global cell aggregation behavior. However, the Voronoi diagram technique was insufficient for evaluating the specific behavior of individual cells during aggregation, because the technique focuses on the overall spatial distribution of cells rather than individual cell behavior during aggregate formation. In mass animal locomotion studies, that is, schools of fish or flocking birds, many researchers have focused on the distances between neighboring members to both evaluate and recreate observed behavior. 14 Therefore, cell–cell distance and its dynamic changes may be useful for characterizing the cell aggregation process. By understanding the distance over which cells interact with adjacent cells, it may be possible to gain insights into the mechanisms of cell aggregation. In this study, chondrocyte behavior on fibroin substrates was quantitatively evaluated by focusing on the distances between neighboring cells. Specifically, the motion of cell pairs that maintained an intercellular distance of D μm, termed co-migration, was evaluated.
Materials and Methods
The motion of cell pairs maintaining an intercellular distance of D μm, which we have termed co-migration, was recorded and analyzed for various threshold distances (D). To define a range of D values, the major diameters of a random sample of cells were measured, as cell size can affect the cell–cell distance when two cells are in contact with each other. Then, to verify co-migration as a method for evaluating cell aggregation behavior, cell distribution analysis was performed using the previously validated Voronoi diagram approach. The results of the co-migration analysis and the results of the Voronoi diagram analysis were then compared using correlation analysis, and values of D that demonstrated good correlation were identified. Using these criteria, the chondrocyte aggregation behavior on fibroin substrates was investigated in detail with respect to the rate of cells participating in co-migration and the time over which cell co-migration occurred.
Cell preparation
Chondrocytes were aseptically harvested from the proximal humerus, distal femur, and proximal tibia of 4-week-old Japanese white rabbits (Oriental Bio Service), and passaged once prior to experimentation, as described previously. 8
Substrate plate preparation
To create fibroin-coated plates, a fibroin aqueous solution was prepared as described previously. Briefly, degummed silk fibroin fibers of B. mori cocoons were dissolved in 9 M lithium bromide aqueous solution at room temperature, and then the solution was dialyzed against pure water. The concentration of fibroin in the water solution was determined by colorimetric method and was prepared to be 1% (w/v). Before coating the fibroin substrate, 35 mm glass bottom dishes (Asahi Techno Glass) were washed with acetone and completely dried at 50°C. Culture dishes were soaked in fibroin solution for 1 min at room temperature, and then dried at 50°C. The dishes were immersed in 80% methanol solution for 1 h, and dried again at 50°C.
ProNectin is a 75-kDa protein polymer genetically engineered using a repeated peptide segment of GAGAGS originating from fibroin, and using a cell attachment epitope containing the RGD peptide sequence from fibronectin.15,16 An RGD sequence is the minimum unit of the cell–substrate adhesive activity ligand, and alters cell fate through integrin-mediated binding. Therefore, to create a nonaggregating control group, protein-coated plates were prepared using ProNectin F (Sanyo Chemical Industries) according to the manufacturer's instructions. Briefly, stock solution was diluted to 10 μg/mL in phosphate-buffered saline (PBS). Culture dishes were then soaked in the diluted solution for 5 min at room temperature. Afterward, the culture dishes were washed twice with PBS.
Time-lapse observation and cell trajectory acquisition
Passaged chondrocytes were suspended in Leibovitz's L-15 medium (Invitrogen) containing 10 vol% fetal bovine serum (Nichirei Biosciences, Inc.), 1 vol% antibiotic mixture (Nacalai Tesque), and 0.2 mM ascorbic acid (A8960; Sigma-Aldrich), and 1.0×10⁵ cells were seeded in 2 mL of cell suspension medium at a concentration of 5.0×10⁴ cells/mL (∼1×10⁴ cells/cm2).
Each dish was enclosed in a culture chamber (MI-IBC-IF; Olympus) in a humidified atmosphere at 37°C and placed on an inverted phase contrast microscope (IX-81; Olympus). During a 24-h culture period, time-lapse phase contrast images were captured every 10 min by a CCD camera (DP70; Olympus). Five movies were captured for the respective fibroin and ProNectin groups.
Every cell captured during the time-lapse observation was manually tracked using MTrackJ, an ImageJ (National Institutes of Health) tracking plugin. 17 Position data for all the cells was measured by the MTrackJ tracking function and was recorded in spreadsheets to calculate the distances between each pair of cells and to quantify cell distribution.
Measurement of cell size and circularity
Cell diameters and circularity were evaluated by using ImageJ. Cells on each substrate were randomly chosen with respect to culture time and cell location and each cell's profile was outlined manually. Subsequently, the major diameters of each outline (maximum Feret's diameters) were measured (n=25; for each movie). The maximum Feret's diameter, also known as the maximum caliper diameter, is the longest distance between two points on an object. 18 Cell circularity was measured using the formula 4π(area/perimeter2). A circularity value of 1 indicates a perfect circle, while a circularity value approaching 0 indicates an increasingly elongated polygon.
Cell distribution quantitation
A geometrical model based on a Voronoi tessellation, derived by Marcelpoil et al., 19 was used to characterize spatiotemporal changes in the chondrocyte aggregation behavior. According to cell position information, each snapshot image was partitioned into N regions (Voronoi cells), where N was the number of cells in sight. The disorder of the Voronoi cell area (area disorder) was calculated using the equations of Marcelpoil et al. 19 In a previous study by the authors, increasing area disorder values were observed for increasing chondrocyte aggregation on fibroin substrates. 8
Evaluation of cells participating in co-migration
Co-migration rate was then evaluated by measuring the Euclidean distances between cells, and cells located less than a threshold distance D apart were recorded using R (The R Foundation for Statistical Computing). A grouping assay of moving objects was performed (Appendix), and the rates at which the cells participated in co-migration were calculated.
Then, to clarify which cell–cell distance was appropriate for characterizing aggregation behavior, the association between Voronoi diagram analysis and the rate of cells participating in co-migration (co-migration rate) was investigated, and the values of D that showed good correlation were identified.
Evaluation of rate of cells participating in co-migration and aggregation behavior
To look at the differences between cell aggregation behavior on fibroin and ProNectin substrates, the co-migration rates on each substrate were evaluated with respect to various threshold time values (T). ProNectin substrates were used as a nonaggregating control group, and the average of the co-migration rates for each substrate were compared.
Evaluation of time over which cell co-migration occurred
Focusing on the time over which cell co-migration occurred, the stability of the cell–cell contacts on each substrate was evaluated. In practice, some cells moved into/out of frame during the time-lapse observation, leading to a reduction in accuracy. Therefore, the Kaplan–Meier estimator was used, and out of frame cell data was referred to as censored data. In addition, cell pairs that emerged simultaneously because of frame entrance or mitotic divisions were excluded in this analysis.
Statistical tests
The Kaplan–Meier estimator was used to calculate the survival function for cell co-migration data for the fibroin and ProNectin groups, and a statistical comparison of the survival function was done using the log-rank test. The difference between cell diameter or circularity on fibroin and ProNectin was analyzed using the Mann–Whitney test. All tests were performed with a significance level of 0.05.
Results
Formation of cells with a rounded shape on fibroin substrates
Figure 1 shows chondrocyte images during cultivation. On the ProNectin substrate, most of the cells were elongated, and few cells were found to be in contact with each other. On the fibroin substrate, however, many chondrocytes maintained a rounded shape and participated in cell aggregation. The average cell number observed on fibroin and ProNectin substrates ranged from 79–155 to 80–157 cells per frame, respectively. There was no significant difference in cell density observed between on fibroin and ProNectin substrates.
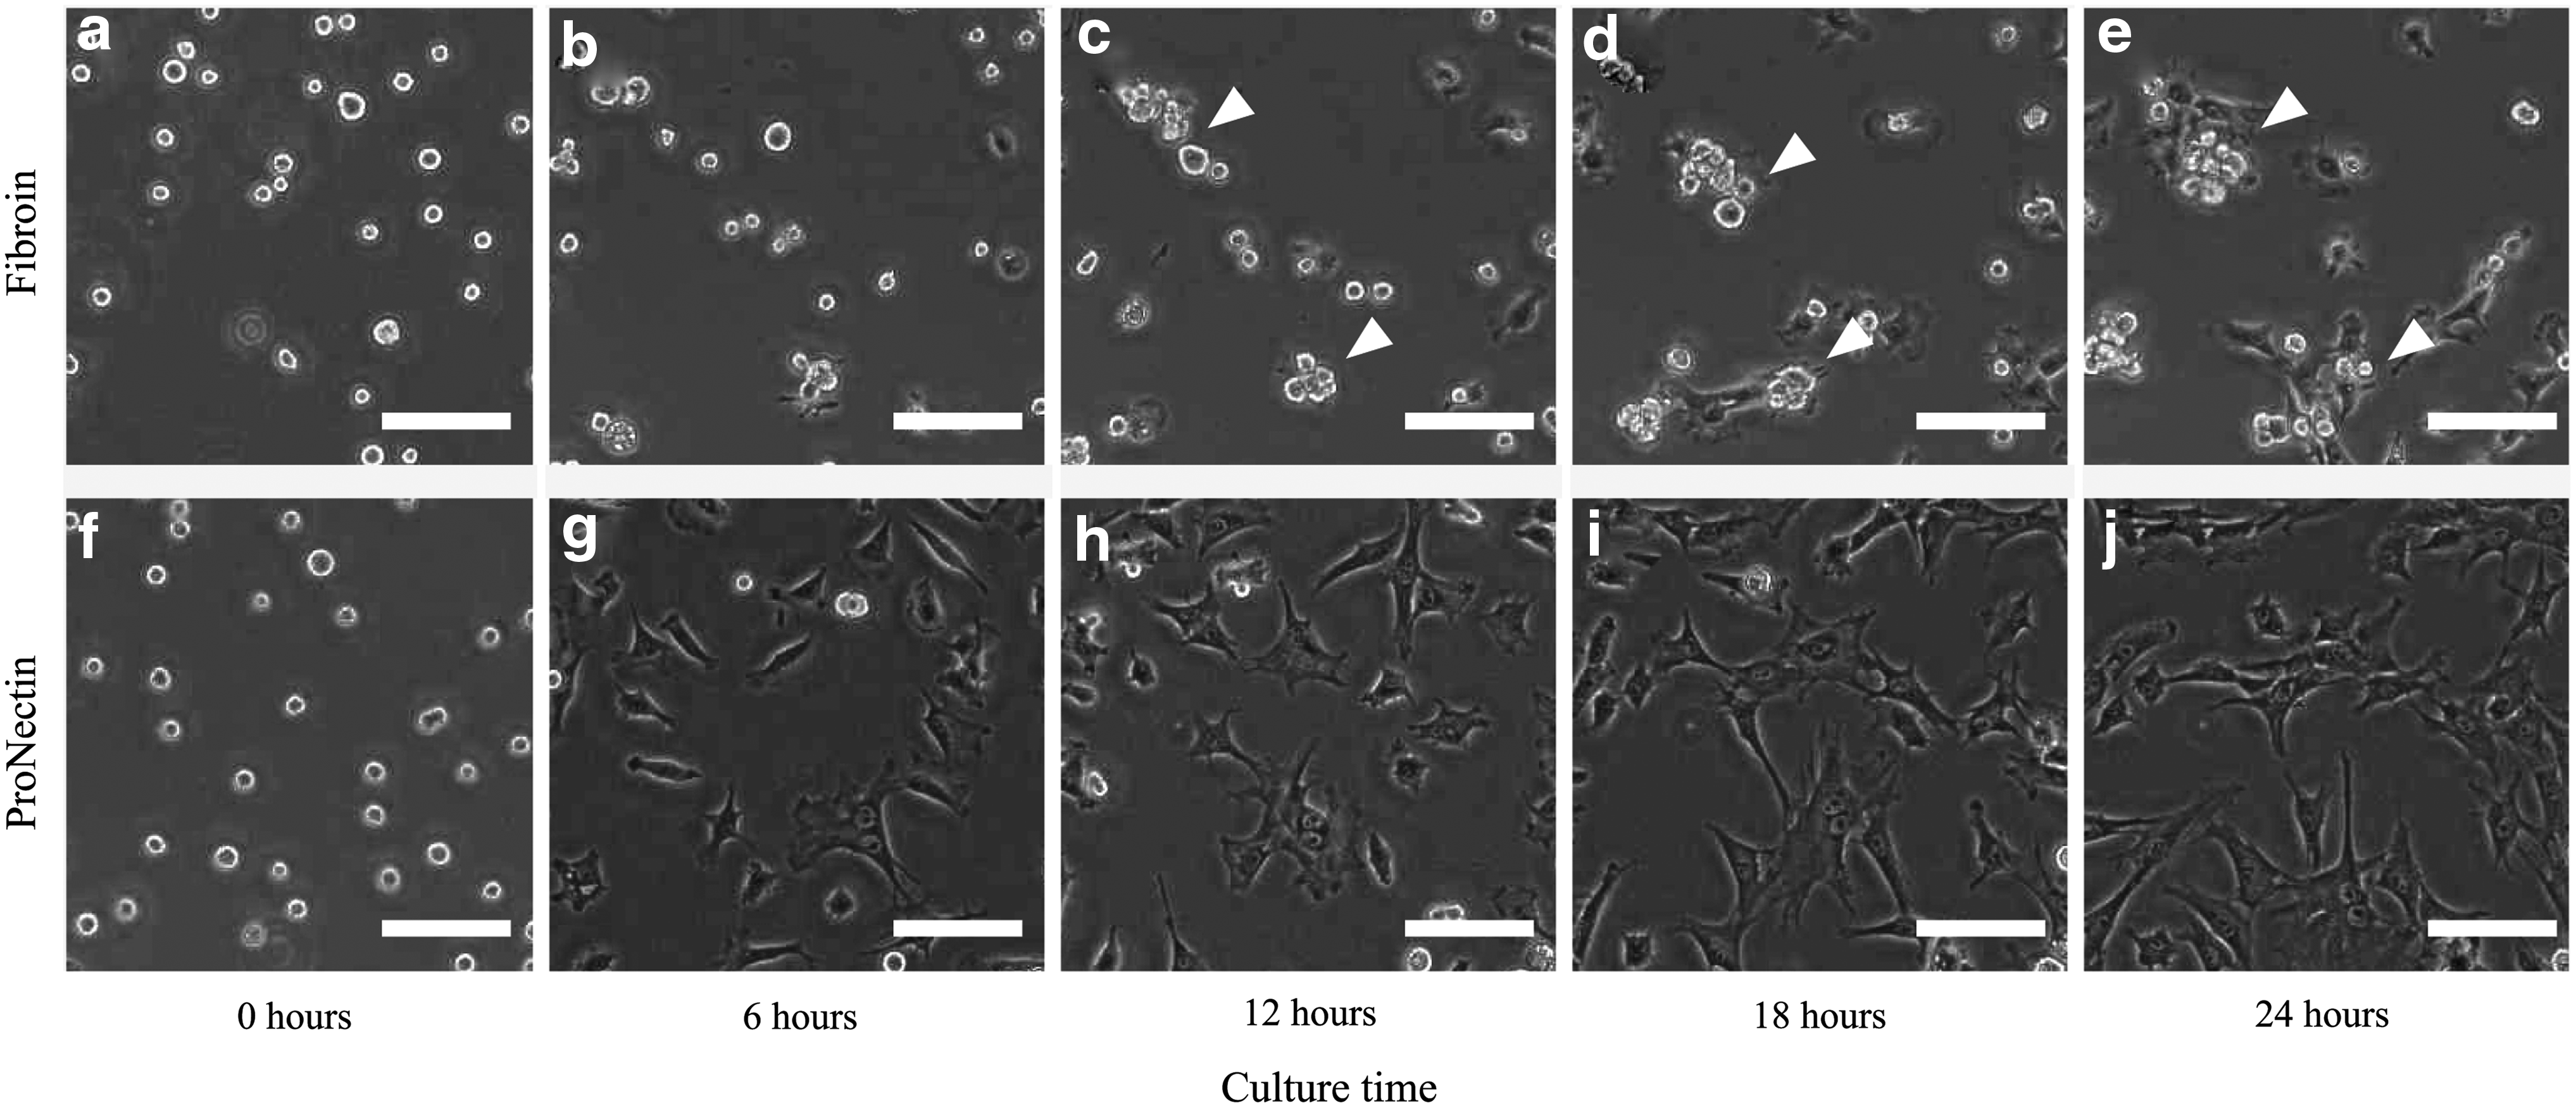
Phase contrast images of chondrocytes cultured on wild-type fibroin
The recorded major diameters of the cells are shown in Figure 2. On fibroin substrates, the major diameters of the cells ranged from 11.7 to 107.7 μm. On the other hand, in the ProNectin group, major diameter values (range: 12.1–124.3 μm) were larger than those on the fibroin substrates. In addition, the cell circularity increased with decreasing major diameter. On fibroin substrates, many cells were less than 20 μm in diameter, and the peaks for cell diameter were located in the range of 10–20 μm, which seemed to indicate a rounded cell shape. The major diameters of 90% of the cells were smaller than 59.0 μm on the fibroin substrates, and smaller than 72.0 μm on the ProNectin substrates.
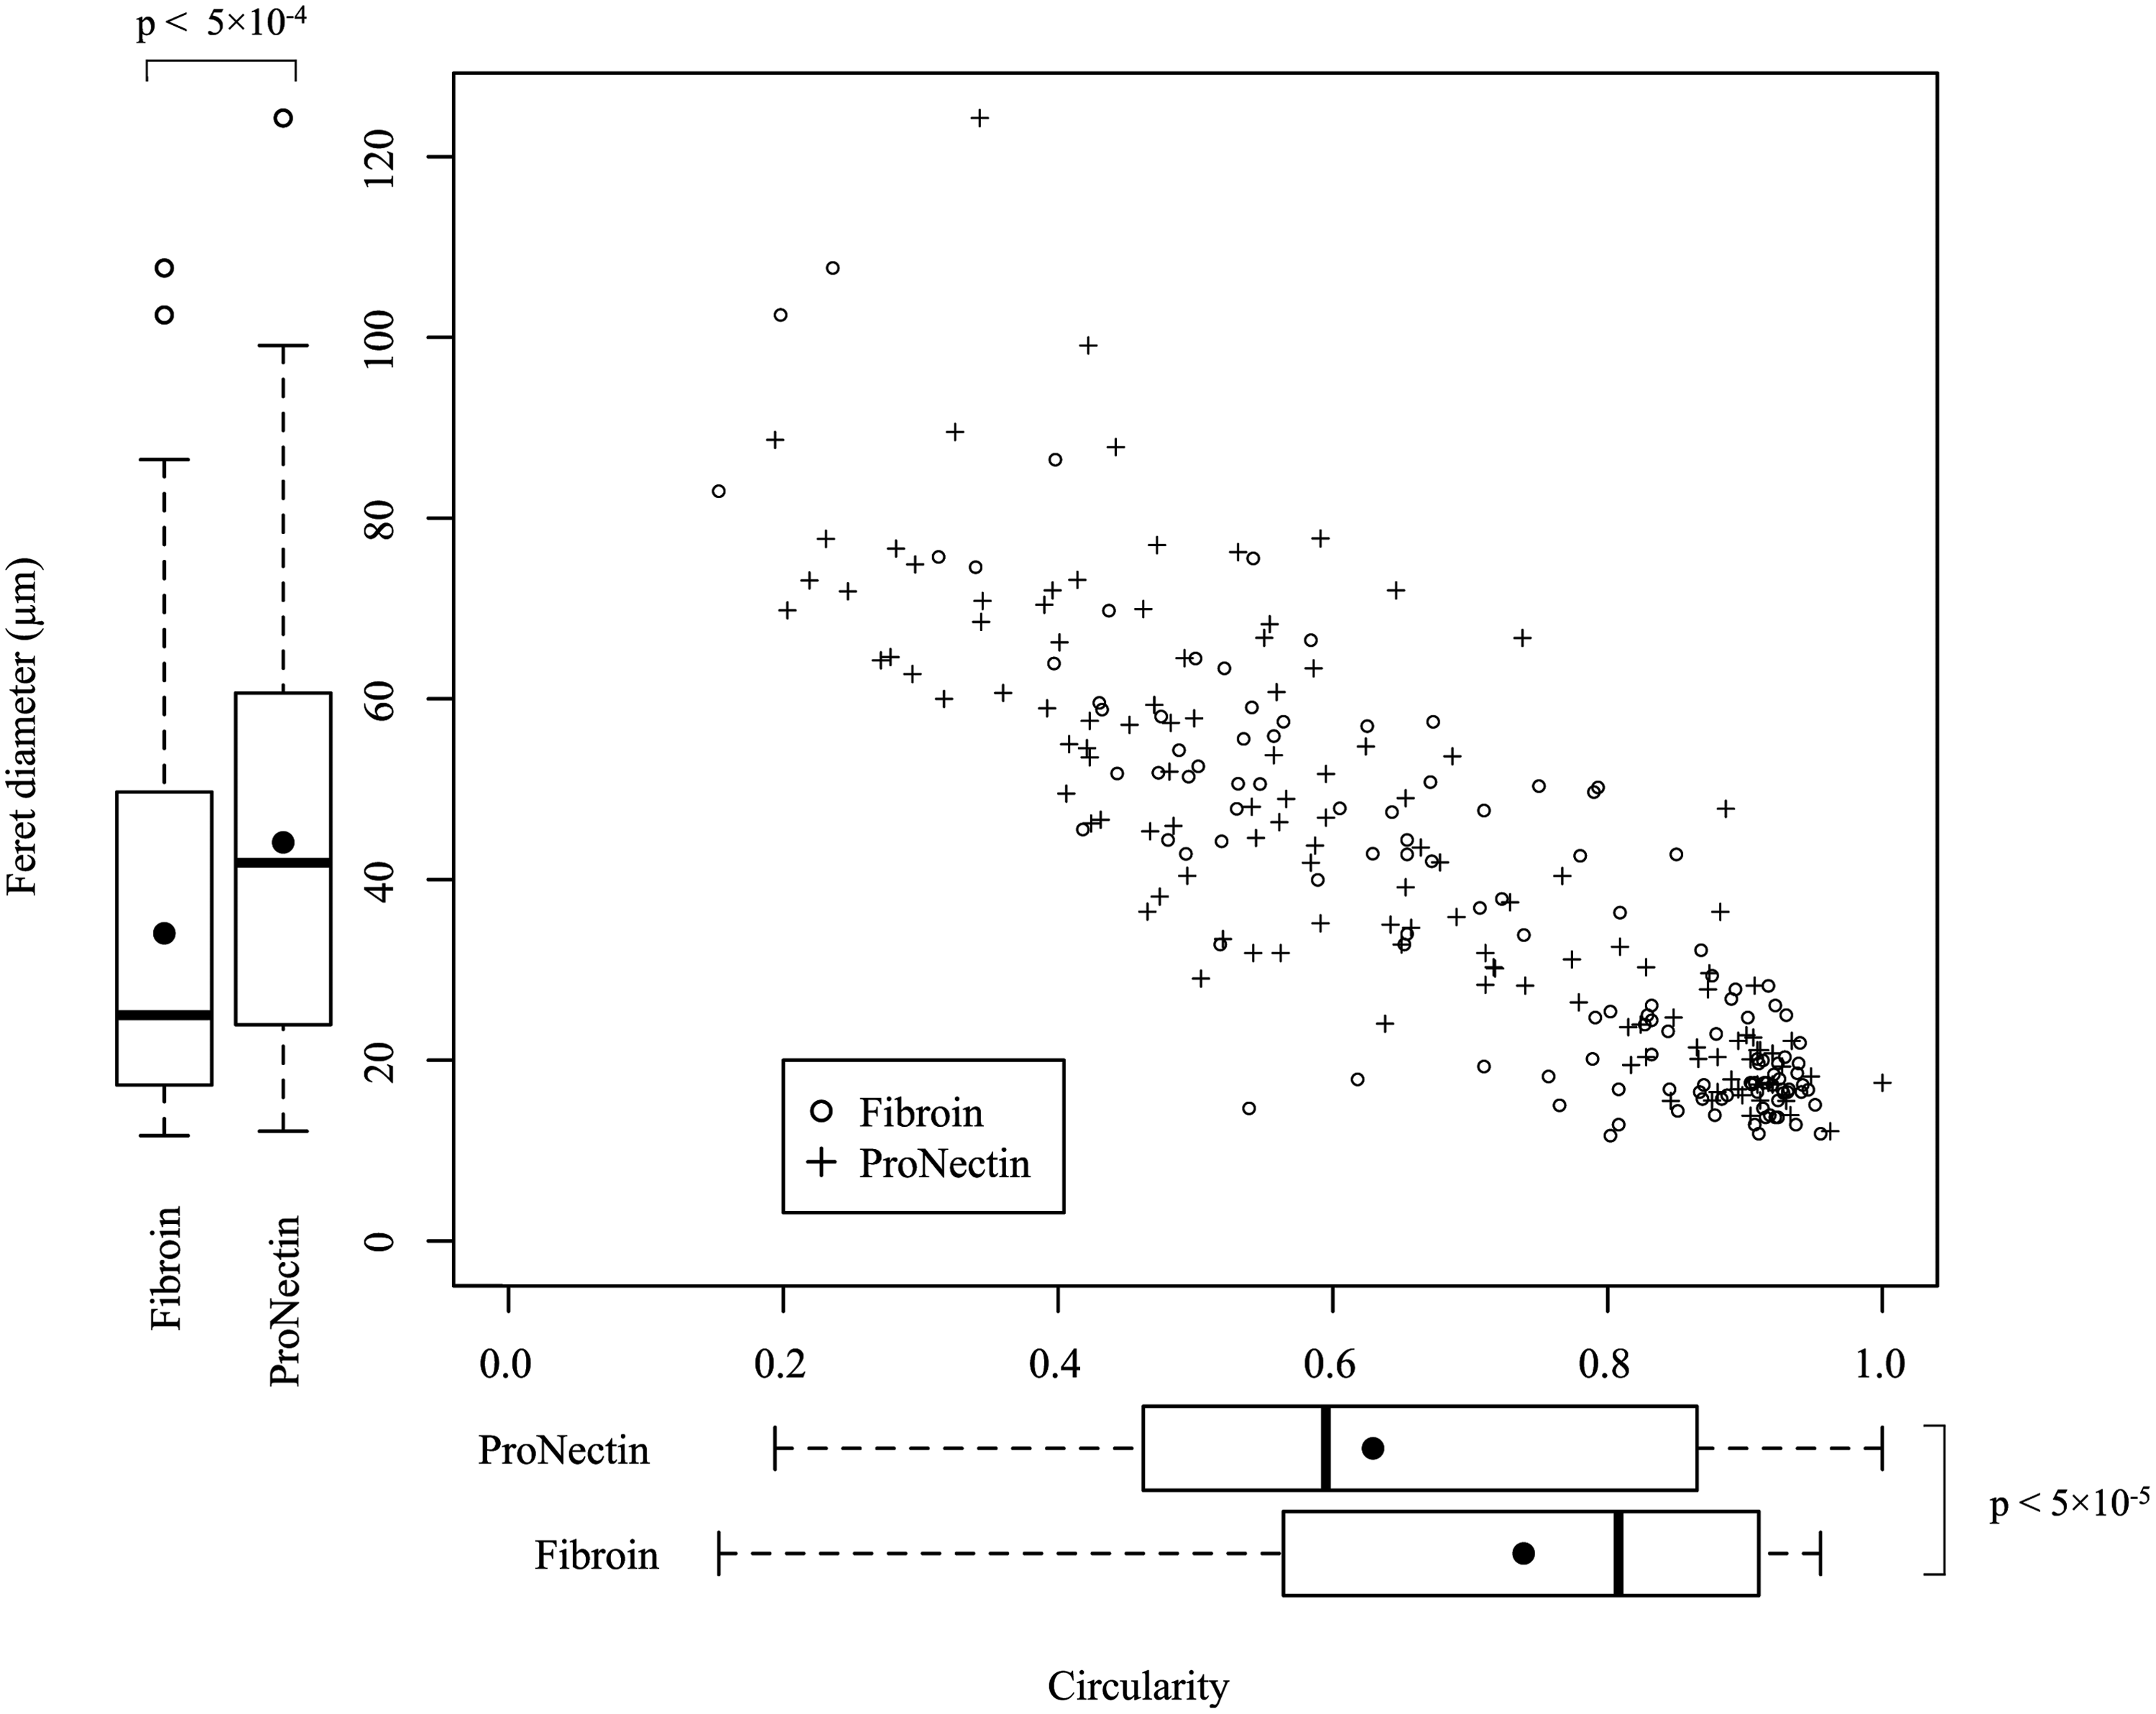
Vertical and horizontal box plots show maximum Feret's diameter and circularity of cells on each substrate, respectively. Dots and lines in boxes indicate the mean value and median value, respectively. The negative correlation between cell diameter and cell circularity was seen for fibroin and ProNectin substrates. There was a peak at 20 μm in the density function of cell diameter on fibroin substrates. p-values=0.05 or lower were considered as statistically significant using the Mann–Whitney test (n=125 for each group; 25 cells per video).
Correlation between Voronoi diagram analysis and cell–cell distance evaluation
A Voronoi diagram cell aggregation assay was performed, and the area disorder value, which represents the degree of cell aggregation, was compared with the cell co-migration rates as measured by various threshold times T and threshold distances D. Figure 3a shows the time-dependent changes in area disorder for chondrocytes grown on each substrate. The area disorder values in the ProNectin group showed little change over 24 h. However, the area disorder values for the fibroin group gradually increased in a time dependent manner. Looking at the standard deviations from Figure 3, the degree of cell aggregation varies widely in response to the observation location.
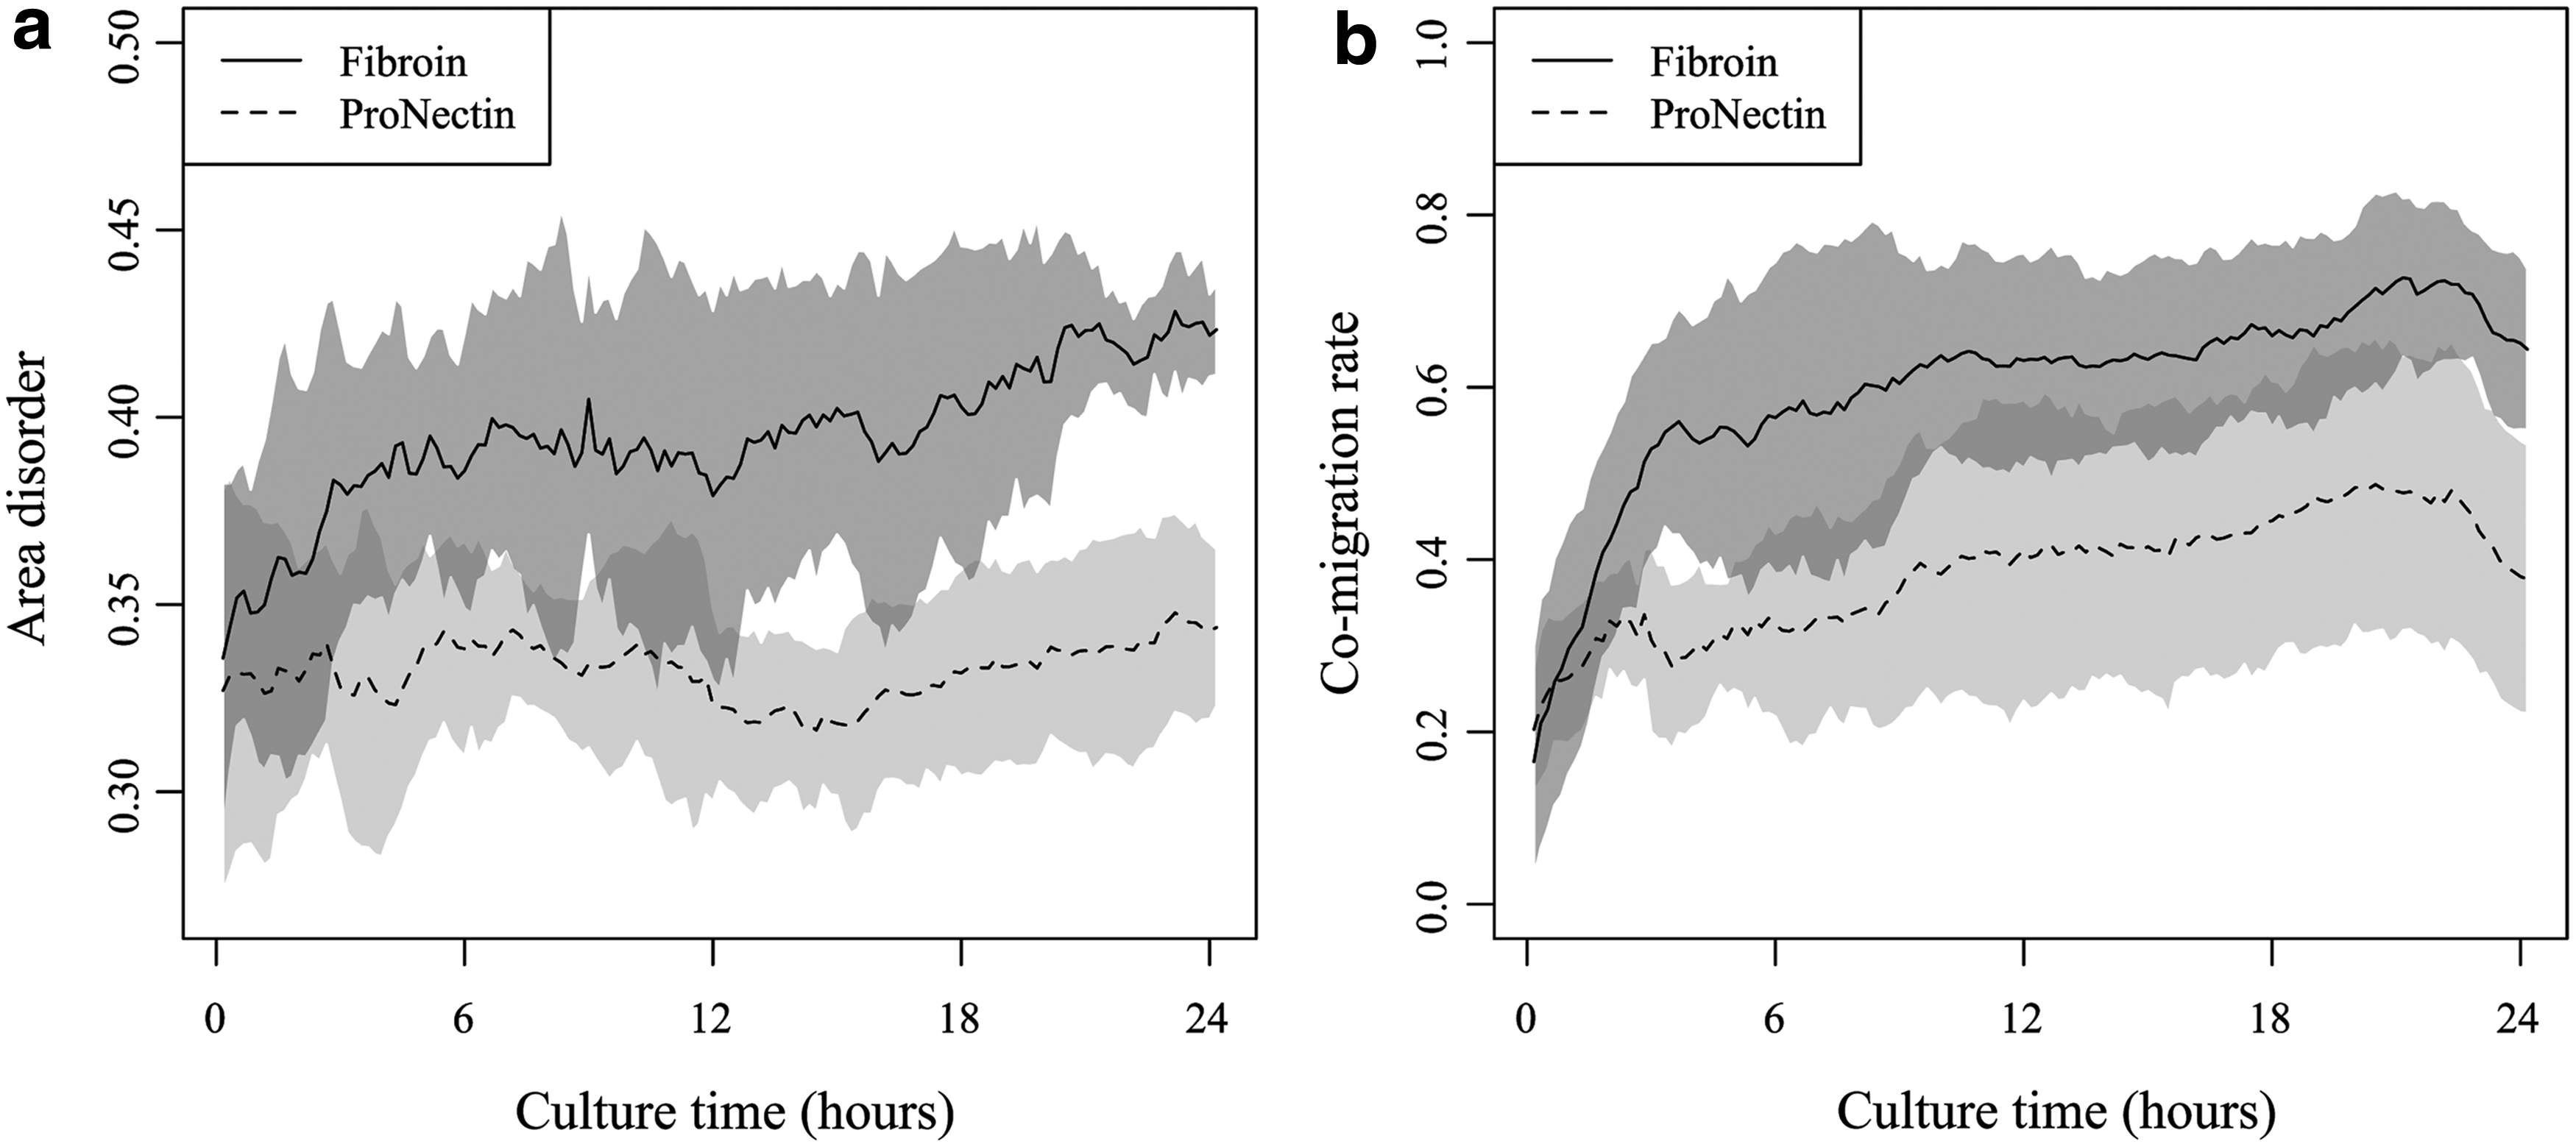
Time-dependent changes in area disorder values
Figure 3b shows an example of the time-dependent changes in the co-migration rate (calculated for D=40 μm and T=110 min). Figure 4 shows the results of the correlation coefficients for a different (D, T) threshold set. The correlation coefficient (range: −1.0–1.0) was used to measure how well the co-migration rate agreed with the cell aggregation rate (as measured by area disorder), with values close to 1 indicating good agreement. In the fibroin group, the correlation coefficients ranged from −0.05 to 0.76, and a high value of correlation between the area disorder and the co-migration rate (more than 0.7) was observed for low D and T conditions (range: 22–58 μm and 0.16–6.50 h, respectively) In contrast, high correlation values were not observed on the ProNectin substrate (range: −0.46–0.54). Moreover, the highest correlation value between the co-migration analysis and the Voronoi diagram analysis was observed for T=110 min. From these results, the T value (hereafter, 110 min) was used for evaluating cell co-migration rates (in Fig. 5) and measuring survival rate for co-migration (in Fig. 7).
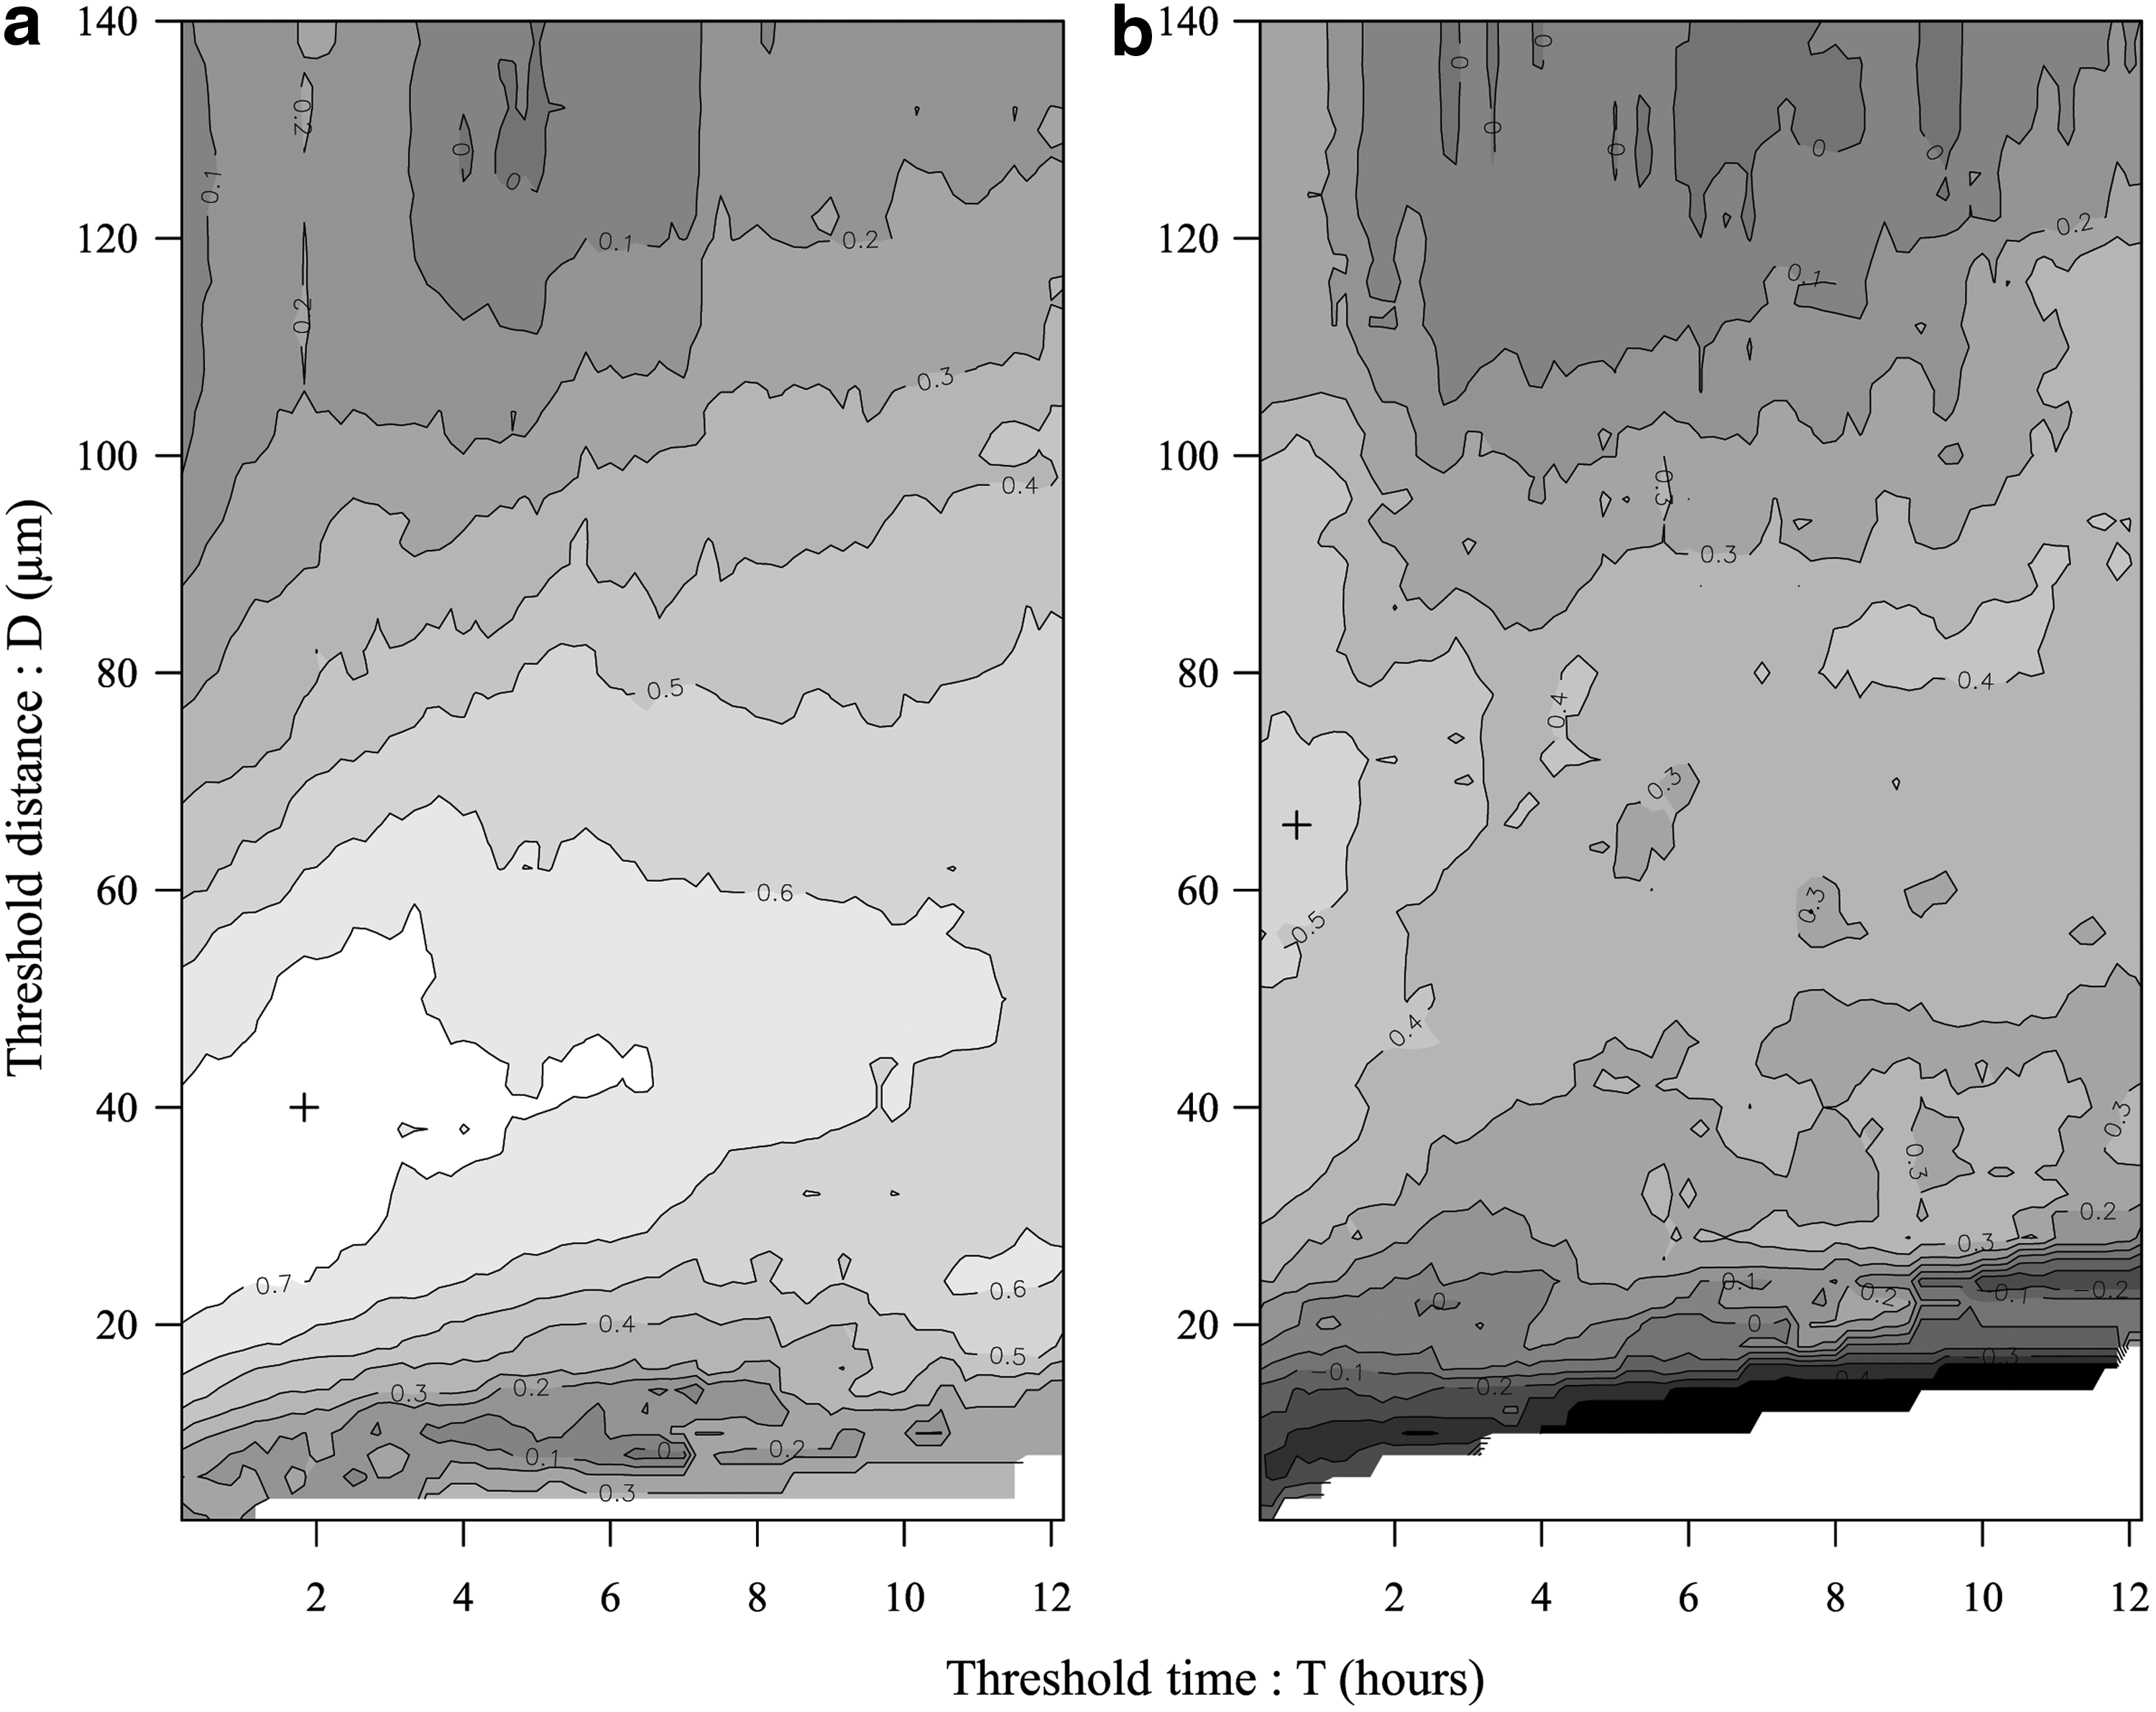
Correlation coefficients between area distribution and co-migration rate data were plotted for the fibroin
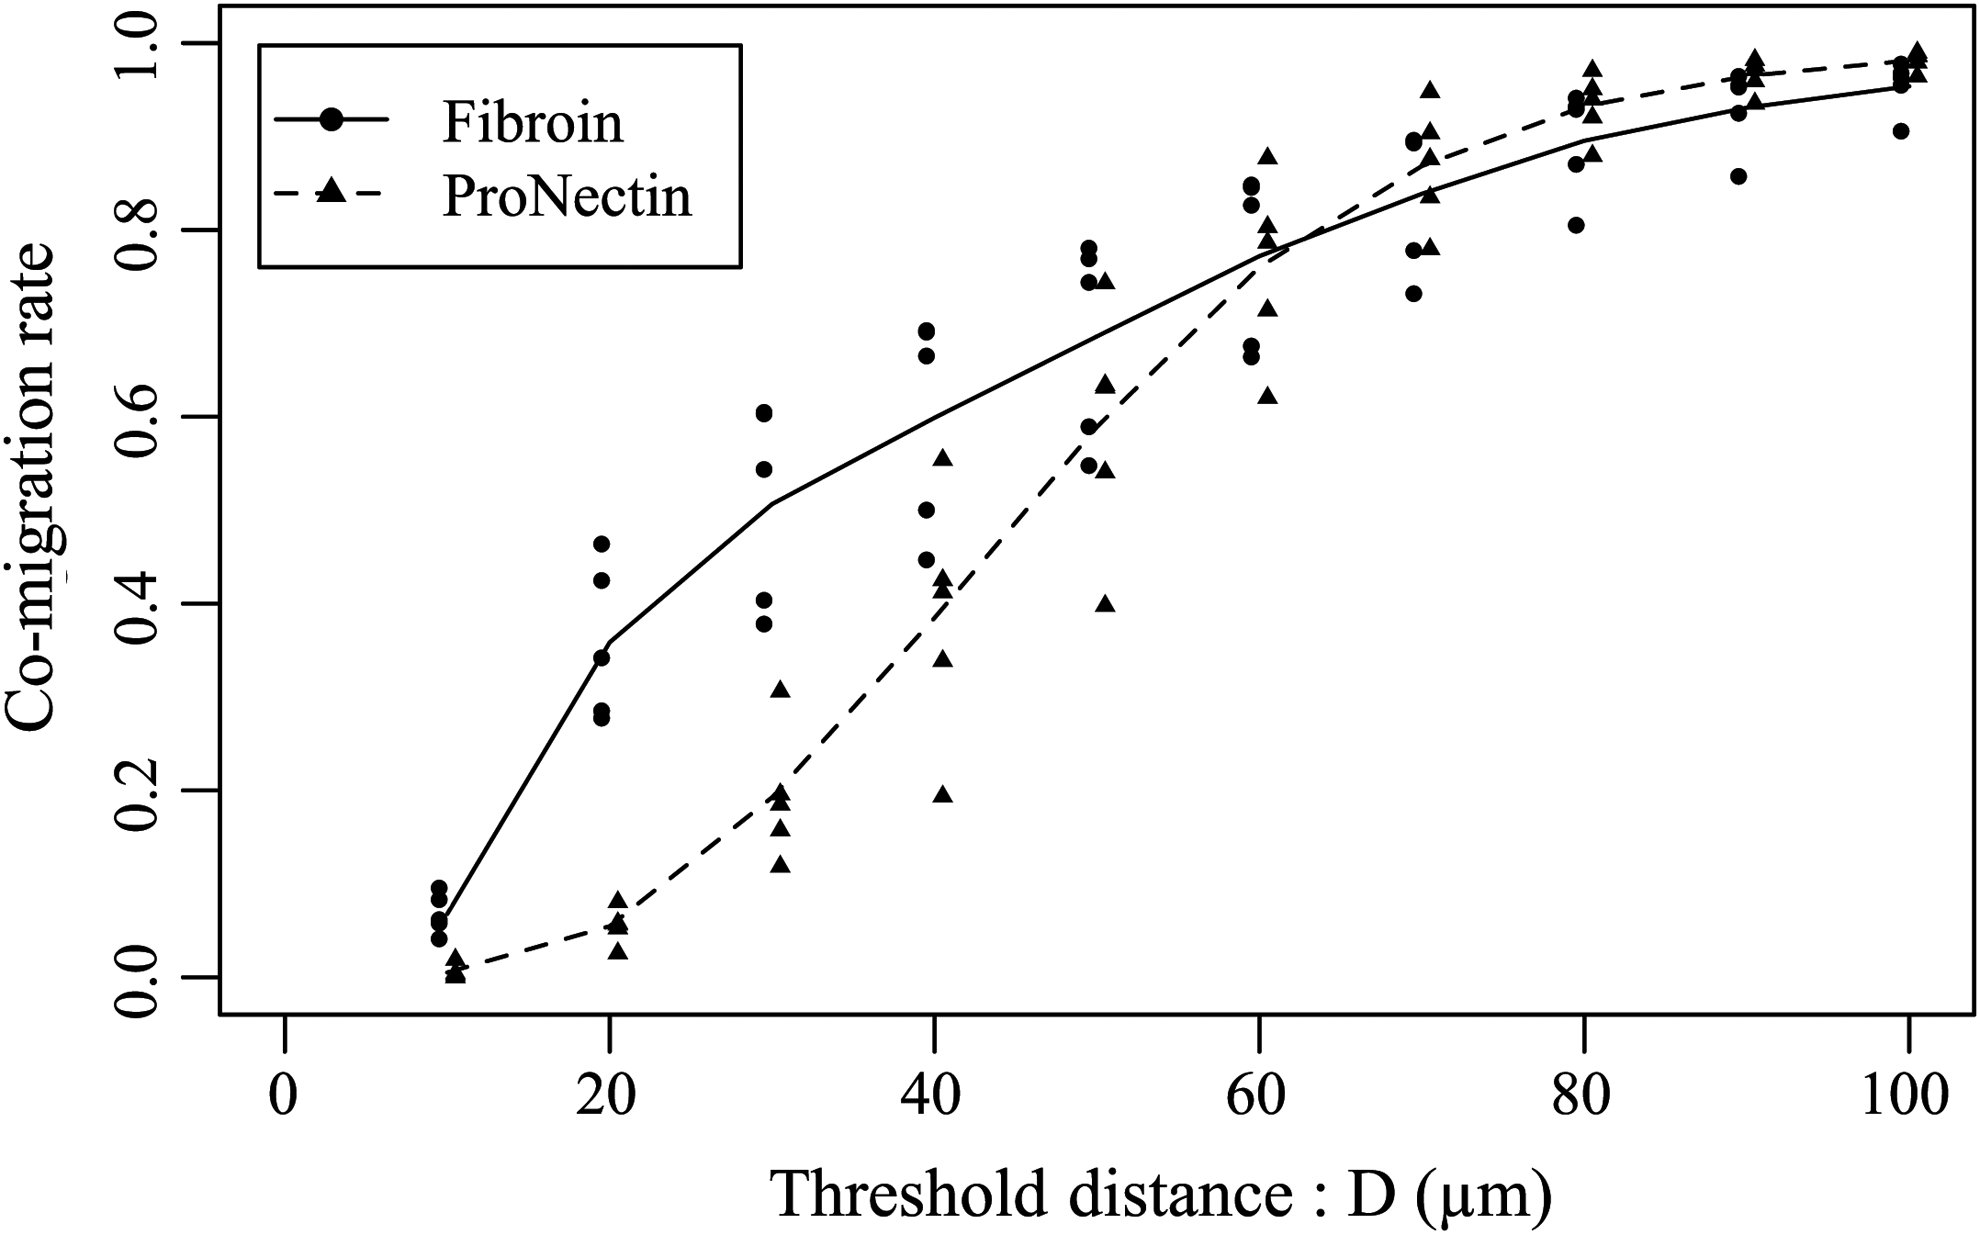
The co-migration rate for the condition of T=110 min. Horizontal axis indicates the threshold distance D. The solid line represents the mean co-migration rate for the fibroin group for different conditions of D, and the dotted line is for the ProNectin group, respectively. The co-migration rate for the fibroin group increased when D≤30 μm. For the ProNectin group, cell co-migration rate did not increase when D≤20 μm. This tendency was independent of T.
The differences in cell co-migration between the fibroin and ProNectin groups
The average rate at which chondrocytes formed aggregates on the fibroin and ProNectin substrates was estimated for T=110 min (in Fig. 5). In both groups, increasing cell co-migration rates were observed for increasing threshold distances. However, for D values between 20 and 50 μm, values for co-migration rate were generally higher for fibroin substrates than for ProNectin substrates. For D values 60 μm and above, however, there was very little difference in the calculated co-migration rates for the two substrates. The increases in co-migration rate for fibroin substrates for values of D less than 60 μm were observed irrespective of T value (data not shown). Similarly, irrespective of duration time, no difference in co-migration rate was observed between the fibroin and ProNectin substrates for D values greater than 60 μm. This seems to suggest that cells exhibited different interaction behavior on fibroin and ProNectin substrates at intercellular distances of D=10–60 μm. Thus, this range of D was adopted to estimate the probability of cell co-migration on fibroin and ProNectin substrates.
The duration time of co-migration (the time during which two cells remain within D μm of each other) was evaluated to investigate the stability of cell co-migration on fibroin and ProNectin substrates. Figure 6 shows the estimated survival functions for cell co-migration in each group. Sample sizes for this analysis are described in Table 1. For example, under the condition of D=30 μm (Fig. 6c, solid line), 14.3% of cell pairs remained close to each other for 6 h on fibroin substrates (95% confidence interval: 13.0%–15.7%). In contrast, on ProNectin substrates, only 5.8% of cell pairs engaged in co-migration for 6 h (95% confidence interval: 4.4%–7.7%), and no cell co-migration was maintained for more than 15 h (Fig. 6c, dotted line). Interestingly, it was found that under the condition of D=60 μm, co-migration duration times were longer for the ProNectin substrates than for the fibroin substrates (Fig. 6f ). In Figure 7, the probability values of co-migration occurring for 110 min were plotted as a function of D. On the ProNectin substrates, the survival of cell pairs exhibiting co-migration behavior increased with D value (dotted line). For the fibroin group, the estimated probabilities of cell co-migration increased with increasing D value up until D=30 μm. However, for D values greater than 30 μm (solid line) no increase in co-migration probability was observed. This tendency was also independently observed for T value (data not shown). Comparing estimated probabilities of cell co-migration for fibroin and ProNectin for values of D≤30 μm, a significantly higher proportion of cell co-migrations survived on fibroin than on ProNectin substrates. Assuming that two cells are located close to each other (intercellular distance: 30 μm), the diameters of these cells would be shorter than this intercellular distance. Taking this assumption into consideration, more co-migrations of small rounded cells survived on fibroin than on ProNectin substrates under the present experimental conditions.
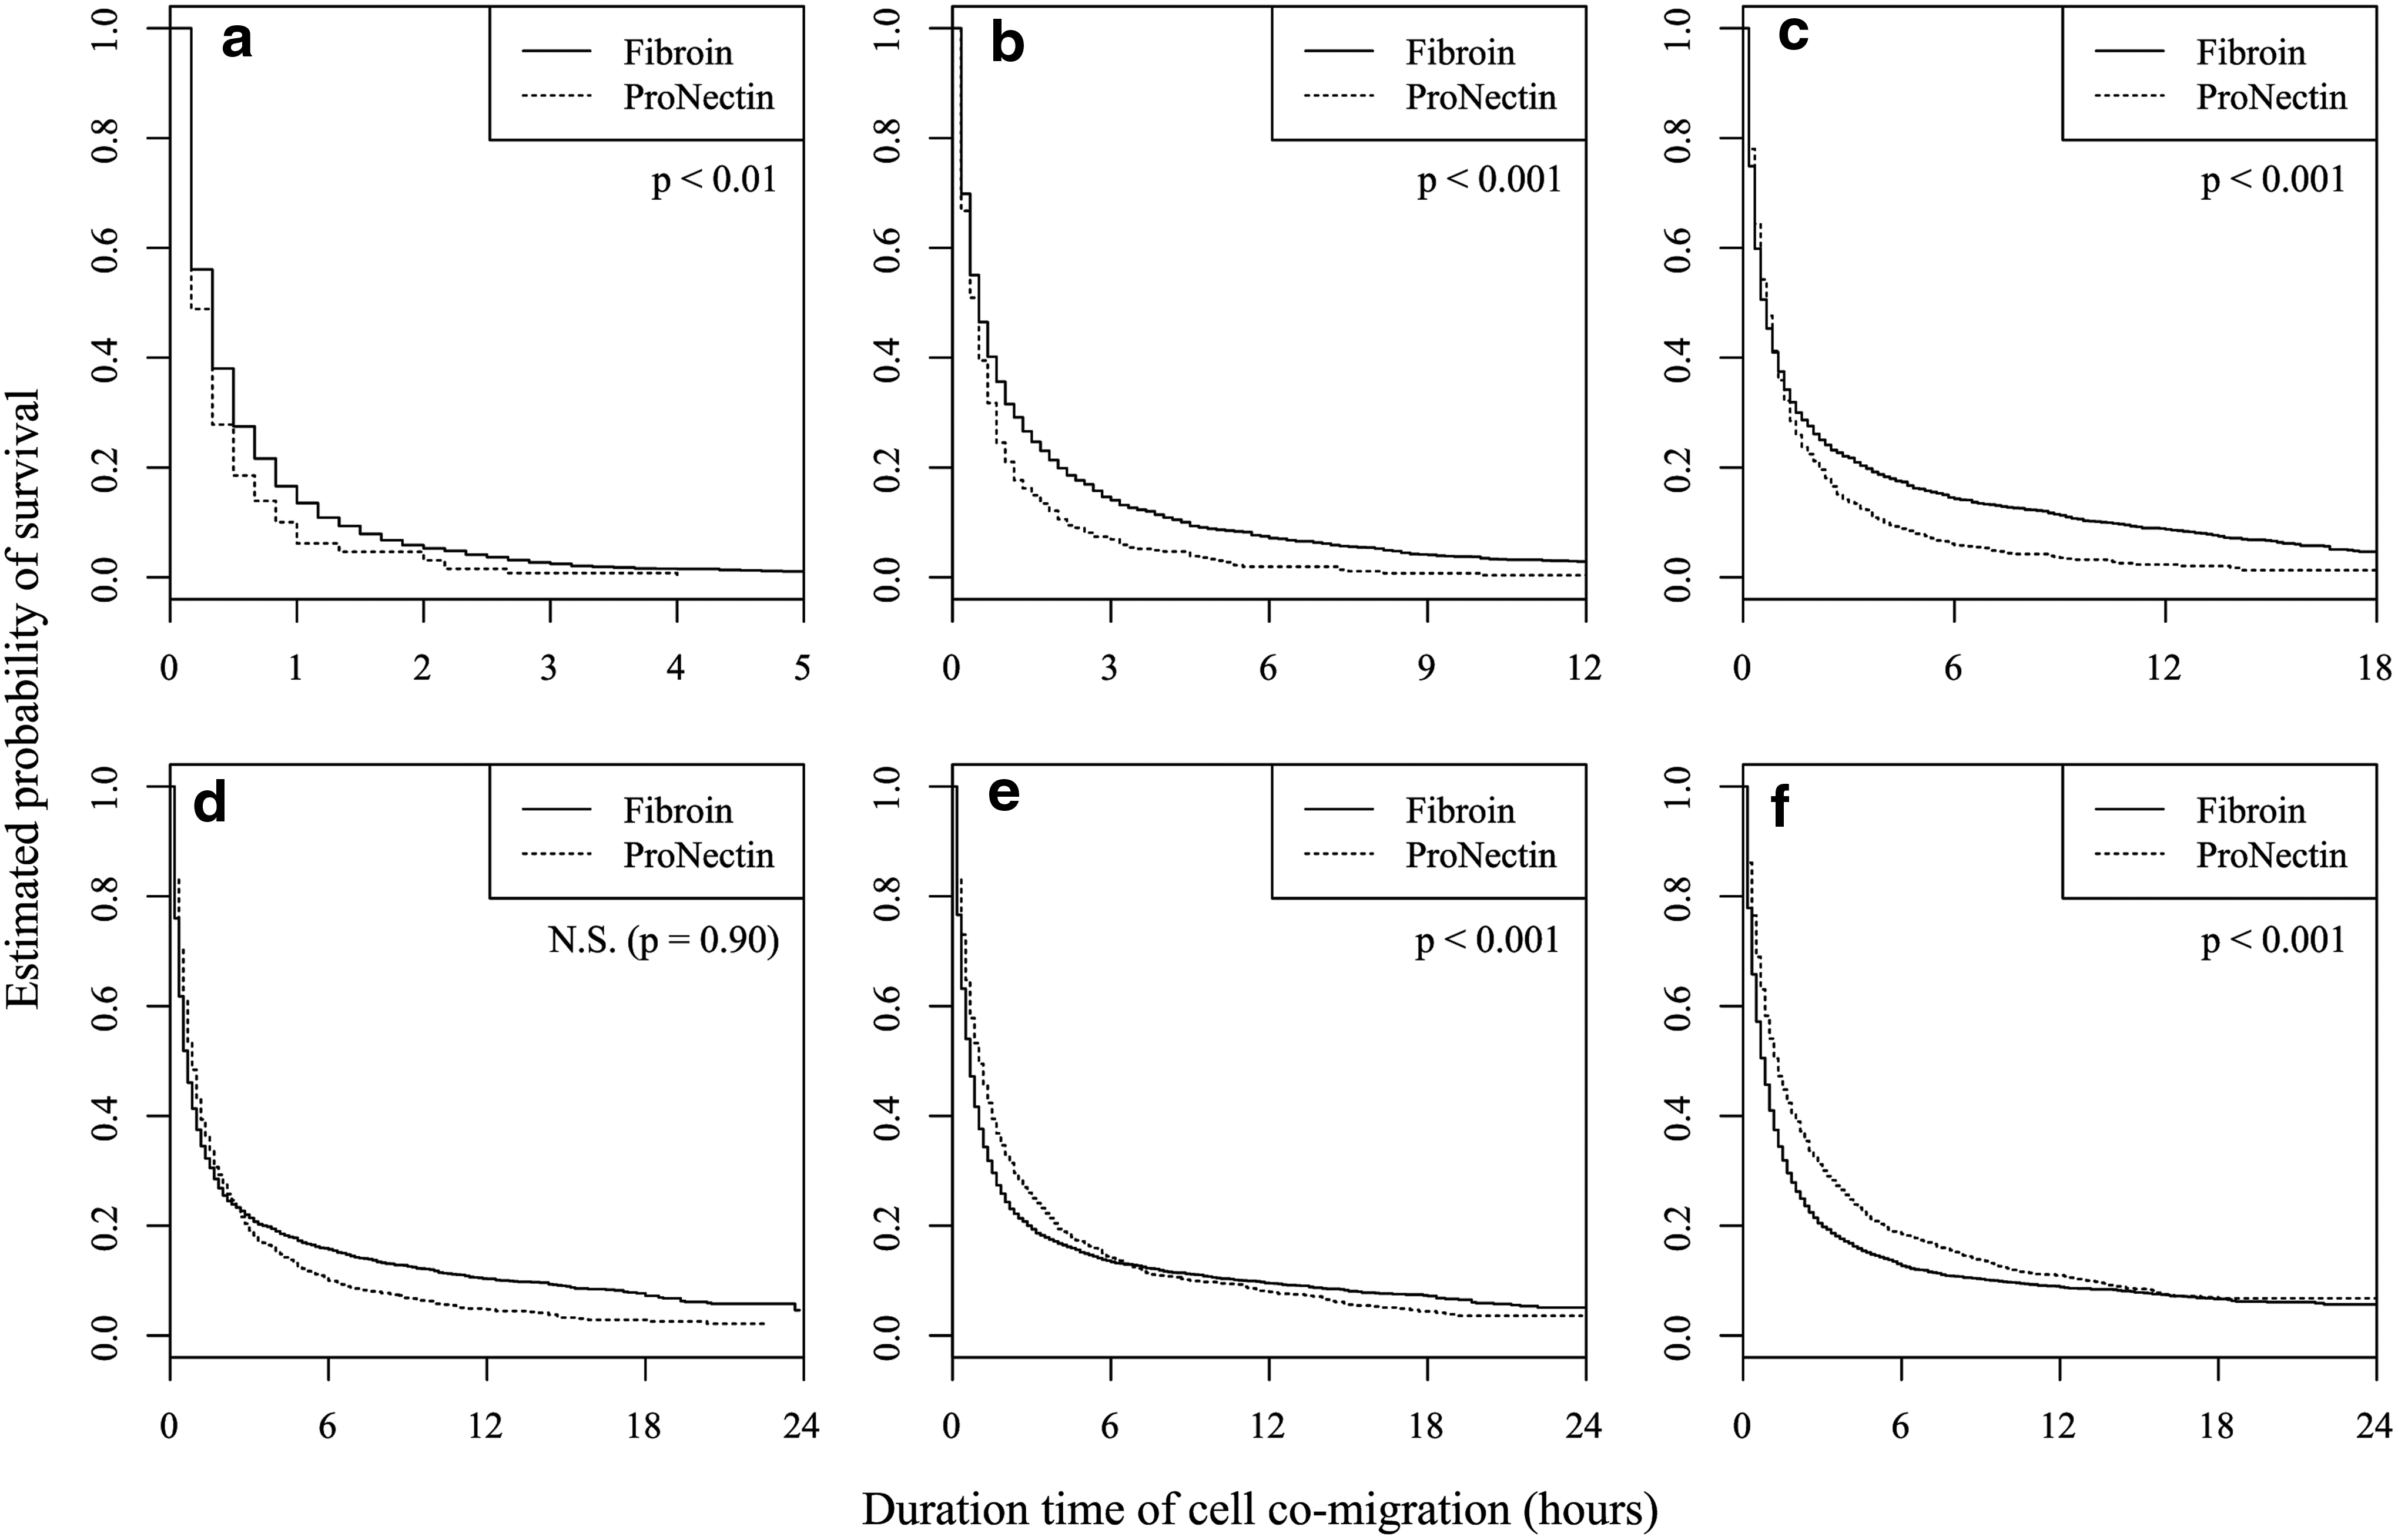
Kaplan–Meier survival curves of cell co-migration among all cell co-migration occurrences on fibroin substrates (solid lines) and on ProNectin substrates (dotted lines). The vertical axes represent the proportion of cell co-migrations that survived the duration time, represented by horizontal axes. The plot range of duration time varied from 5 to 24 h to avoid crowded figures. These survival functions were estimated for the following conditions:

The probability that cell co-migration survived for 110 min among all cell co-migration occurrences on fibroin (solid line) and ProNectin substrates (dotted line). Horizontal axis indicates the threshold distance D. The error bars indicate 95% confidence intervals. On ProNectin, the survival of cell pairs exhibiting co-migration behavior increased with D value. However, on fibroin, the estimated probabilities of cell co-migration increased steeply with D≤30 μm, but did not change for D≥30 μm. This tendency was independent of T.
Discussion
Various types of experimental techniques (e.g., microscopic observations, imaging techniques, protein or gene analyses, etc.) have been carried out in the fields of tissue engineering. However, less attention has been given to cell behavior characterization techniques, despite the fact that cell-tracking techniques have been studied extensively. One promising technique is Voronoi diagram analysis, which many researchers have used for identifying spatio-temporal behavior of cell populations.8,19–22 However, the Voronoi diagram technique was insufficient for evaluating the specific behavior of individual cells. In this study, by using co-migration analysis, the different cell behavior was evaluated at a cellular level between on fibroin and ProNectin substrates.
Cell aggregation behavior is widely considered to be a primary event in this tissue formation process. In this study, a quantitative analytical approach was introduced to describe cell co-migration. The major cell diameter for the various chondrocyte populations was found to be greater than 10 μm and less than 130 μm for both the fibroin and ProNectin groups (Fig. 2). From these results, a range of threshold D values of 2–180 μm, which sufficiently included suspicious cell–cell distances, were used in evaluating co-migration rate for chondrocytes on both substrates. Further Voronoi diagram analysis revealed that threshold distances larger than 60 μm were inappropriate for cell aggregation evaluation on fibroin substrates (Fig. 4). Figure 5 also demonstrated that the difference in co-migration rates for fibroin and ProNectin substrates were most clearly seen for threshold distance D values between 10 and 60 μm. From these results, the cell co-migration rate and the duration of cell co-migration were analyzed for D=10–60 μm.
Quantitative results of cell co-migration on fibroin and ProNectin substrates using a grouping method
The estimated co-migration rates revealed different distance-dependent cell behavior for the fibroin and ProNectin groups for D=10–60 μm, while almost no differences in co-migration rate were observed for D≥70 μm (Fig. 5). One possible reason for this is that a threshold distance of more than 60 μm is too large to measure cell co-migration occurrences for the present cell seeding density. Interestingly, the estimated co-migration rate was measured to be about 60% for every (D, T) threshold set, which showed a strong positive correlation (more than 0.7, Fig. 4) with the Voronoi diagram analysis. Thus, about 60% of chondrocytes on the fibroin substrates were thought to form aggregates in this study.
The survival functions for cell co-migration also showed different distance-dependent behavior between the fibroin and ProNectin groups (Figs. 6 and 7). In the present study, the diffusion coefficient for chondrocyte migration was higher for the fibroin group than for the ProNectin group (data not shown). Hashimoto et al. also reported that a fibroin surface was able to enhance NIH 3T3 cell migration. 23 Assuming that rapid migration leads to quick detachment of cells, the duration time of cell co-migration should be shorter on fibroin than on ProNectin. Looking at the duration time results, cell co-migration on fibroin was less stable than on ProNectin substrates for D≥40 μm, which was in accordance with this assumption. Interestingly, however, using a threshold distance of D≤30 μm lead to the opposite result, with the duration of cell co-migration appearing to be more stable on fibroin than on ProNectin (Fig. 7). Reinhart-King et al. have shown that cells can detect and respond to substrate strains created by the traction of a neighboring cell over a distance of about 30 μm. 13 The present results confirmed that different cell–cell interactions were observed within a certain intercellular distance (tens of microns) for fibroin and ProNectin groups and the different mechanical traction of substrates may lead to different cell–cell interactions on these two substrates. Additionally, Sevilla et al. have shown that fibronectin fibrils polymerized into the extracellular matrix influences the shape of cell-assembly on collagen substrates. 12 To investigate the effect of substrates on cell co-migration occurrences, it is necessary to inspect these mechanical or biochemical factors in further studies.
The survival functions for cell co-migration on fibroin substrates changed only when D was less than 30 μm, which may suggest that intercellular interaction is different when adjacent cells are inside or outside of 30 μm and that 30 μm may be a “critical distance” for regulating cell–cell communication on fibroin substrates. In other investigations, hyperbolic models have been used to investigate self-organized biological aggregations, and it has been shown that a model that contains spatial range for three social interactions (i.e., attractive, alignment, and repulsive) can regulate aggregation behavior. 24 Additionally, Bonnet et al. investigated the cluster formation of epithelial tissue by using global attractive potential, in which cells attract one another in cell aggregate formation. 25 Therefore, it may be desirable to investigate cell–cell attractive interactions with respect to cell–cell distance for distance-dependent aggregation of cells on fibroin.
The difference between aggregation behavior of cells on fibroin and ProNectin substrates
In a previous study, Kambe et al. measured the changes in actin polymerization, focal adhesion formation, and adhesive force generation of chondrocytes on fibroin and ProNectin, and they showed that the substrates had a different influence on cell morphology and adhesiveness. 26 In the present study, chondrocytes expanded significantly more on ProNectin than on fibroin, which indicated that fibroin substrates might have lower cell–substrate adhesiveness than ProNectin. Reinhart-King et al. investigated cell–substrate and cell–cell adhesiveness for various densities of the RGD-ligand, and found that cell–cell contact became weak on substrates conjugated at higher densities of the ligand.13,27 Moreover, Ryan et al. reported that decreasing substratum adhesiveness might slow cell aggregation spreading over the substrate. 28 These results suggest that low cell–substratum adhesiveness on fibroin probably led to the stable cell co-migration seen on fibroin substrates in this study.
Improvement desired for further study
There are several improvements desired for further study. It is necessary to investigate the validity of using the Kaplan–Meier estimator in further studies. Specifically, the assumption for the Kaplan–Meier plot was not sufficiently supported due to the fact that cell co-migration events were selected from combinations of cell pairs. This sampling procedure could bias the estimation of co-migration survival. It is also necessary to investigate the effect of cell shape because the diameter of cells can have an influence on threshold distance. Moreover, the results in the present study were only useful to evaluate the cell aggregation on fibroin substrates. Therefore, more improvement is necessary before the method will be applied to other cells or substrates.
A quantitative technique for measuring cell migration is still necessary, because cell behavior is too “noisy” to distinguish qualitatively. The specific threshold distance proposed in this article provides information for cell aggregation behavior, and the measurement of duration time for cell co-migration has made it possible to investigate cell–cell interaction quantitatively. In this respect, the grouping approach introduced in this study provides an easy and systematic way to evaluate the spatio-temporal behavior of cells on regenerative materials, and it may be one promising method for tissue-engineering design.
Conclusion
A quantitative method for evaluating cell aggregation behavior was introduced to describe the mechanisms by which fibroin matrices influence cell behavior. Using the proposed method, the Kaplan–Meier results indicated that co-migration instances of rounded cells (less than 30 μm in diameter) were significantly more stable on fibroin than on ProNectin substrates under the present experimental conditions. It was also suggested that ∼60% of chondrocytes on fibroin substrates formed cell aggregates under the present experimental conditions. Additionally, the results suggested that the grouping method used in this study is a suitable method for investigating tissue regeneration processes.
Footnotes
Acknowledgments
The authors thank Hiroaki Takagi from Nara Medical University and Takashi Sozu from Kyoto University for enlightening discussions, and Alex Turner from Kyoto University for helping to improve the article. The authors thank the Institute for Frontier Medical Sciences of Kyoto University for use of their facilities. This work was supported by the Grant-in-Aid for Creative Scientific Research from the Japan Science and Technology Agency and the Agri-Health Translational Project from the Ministry of Agriculture, Forestry, and Fisheries, Japan.
Disclosure Statement
No competing financial interests exist.
Appendix: Grouping of Moving Objects
Based on cell–cell proximity, the degree of cell aggregation was analyzed using the Grouping Method for Moving Objects, a quantitative evaluation method for analyzing the collective behavior of moving objects. Figure A1 displays the conceptual diagram of this method. In this analysis, two thresholds: a threshold time (T) and distance (D) were used. Each cell was considered a moving node and these nodes were grouped using the following process.
To estimate cell aggregation behavior, the rate of cells demonstrating stable co-migration was calculated as cell co-migration rate. This co-migration rate value would increase if more cells aggregated and more cell–cell contacts were formed.
Figure A2 shows the process of cell co-migration analysis. From cell images (Fig. A2a), every position of the cell was tracked (Fig. A2b), and the distance between every cell pair was calculated (Fig. A2c). Figure A2d shows an example of intercellular transition and the shaded areas represent the collision of cell i with cell j. If the duration time t of the collision was larger than the threshold time T, the cells i and j were defined as co-migrating cells and co-migration rate was evaluated. In the estimation of duration time, quantitative accuracy can be reduced by several experimental factors. Due to cell proliferation, two cells can adhere to each other soon after cell division. However, this cell colocalization was influenced not only by cell aggregation but also by the cell proliferation process. In addition, the limit in time frame or microscopic field may also reduce the accuracy. Therefore, in the Kaplan–Meier estimation, cells soon after undergoing cell division or going into frame were excluded, and out of frame cell data was referred to as censored data.