
Abstract
During development, cell fate specification and tissue development are orchestrated by the sequential presentation of soluble growth factors (GF) and extracellular matrix (ECM) molecules. Similarly, differentiation of stem cells in vitro relies upon the temporal presence of extracellular cues within the microenvironment. Hydrodynamic culture systems are not limited by volume restrictions and therefore offer several practical advantages for scalability over static cultures; however, hydrodynamic cultures expose cells to physical parameters not present in static culture, such as fluid shear stress and mass transfer through convective forces. In this study, the differences between static and hydrodynamic culture conditions on the expression of ECM and GF molecules during the differentiation of mouse embryonic stem cells were examined at both the gene and protein level. The expression of ECM and GF genes exhibited an early decrease in static cultures based on heat map and hierarchical clustering analysis and a relative delayed increase in hydrodynamic cultures. Although the temporal patterns of specific ECM and GF protein expression were comparable between static and hydrodynamic cultures, several notable differences in the magnitudes of expression were observed at similar time points. These results describe the establishment of an analytical framework that can be used to examine the expression patterns of ECM and GF molecules expressed by pluripotent stem cells undergoing differentiation as 3D multicellular aggregates under different culture conditions, and suggest that physical parameters of stem cell microenvironments can alter endogenous ECM and GF expression profiles that may, in turn, influence cell fate decisions.
Introduction
P
Hydrodynamic culture systems for PSCs are increasingly being used for scale-up purposes and have demonstrated influence over the fate of differentiating PSCs.10–13 The use of continuous microfluidic perfusion devices, for example, can alter extracellular matrix (ECM) remodeling processes and cause mouse ESCs to spontaneously differentiate. 14 Furthermore, the expression profile of extracellular molecules has been shown to be dynamically modulated during ESC differentiation in a rotary orbital culture system. 15 Altogether, previous studies suggest that ECM and growth factor (GF) molecules comprising the microenvironment play a key role in directing stem cell fate, but the differences in endogenous matrix production and expression of relevant molecules elicited by simple changes in hydrodynamics in differentiating PSCs have yet to be elucidated.
Thus, the objective of this study was to evaluate the expression profile of endogenous matrix molecules and soluble factors within the 3D PSC aggregates undergoing embryoid body differentiation. PCR arrays were used to probe the gene expression profiles of mouse ESC spheroids undergoing differentiation in either static or hydrodynamic culture environments using the same size vessel and cell density. In addition, the protein expression of selected molecules of interest was probed to further evaluate how environmental changes introduced by different culture systems can affect spatial and temporal modulation of key ECM and GF molecules.
Methods
ESC and EB culture
Undifferentiated mouse ESCs (D3 line) were cultured feeder free on tissue culture-treated polystyrene plates (Corning, Inc.) coated with 0.1% gelatin (Mediatech) in Dulbecco's modified Eagle's medium (DMEM; Mediatech, Inc.) supplemented with 15% fetal bovine serum (Hyclone), 100 U/mL penicillin (Mediatech), 100 mg/mL streptomycin (Mediatech), 0.25 mg/mL amphotericin (Mediatech), 2 mM L-glutamine (Mediatech), 1× MEM nonessential amino acid solution (Mediatech), 0.1 mM 2-mercaptoethanol (Fisher Scientific), and 1000 U/mL leukemia inhibitory factor (LIF, ESGRO; Millipore). Cells were fed every other day and routinely passaged every 2–3 days before reaching 70% confluence. ESCs were trypsinized using a 0.05% trypsin-EDTA (Mediatech) solution into a single cell suspension and aggregates were formed by seeding 4×10⁵ cells/mL (in 10 mL total) in a differentiation medium, consisting of ESC media without LIF. For static culture, cells were seeded onto 2% agarose-coated 100×15 mm bacteriological-grade polystyrene Petri dishes (BD). For hydrodynamic cultures, cells were seeded onto uncoated Petri dishes and maintained on a rotary orbital shaker at 40 rpm. Ninety percent of the media was exchanged every other day by gravity-induced sedimentation in a 15-mL conical tube. Suspension cultures were maintained through 14 days of differentiation. Phase images of EBs were acquired during the course of static and rotary culture with a Nikon TE 2000 inverted microscope (Nikon, Inc.) with a SpotFLEX camera (Diagnostic Instruments, Inc.).
Histology
EBs were collected after 7, 10, and 14 days of culture, washed twice with PBS, fixed in 10% formalin for 30 min, washed three times in PBS, and resuspended in HistoGel (Richard-Allan Scientific). Samples were then dehydrated in a series of graduated alcohol solutions (70–100%) and xylene, embedded in paraffin, and cut into 5-μm sections using a rotary microtome. Slides were then stained with hematoxylin and eosin and coverslipped.
Quantitative reverse-transcription polymerase chain reaction
RNA was extracted from undifferentiated ESCs and EBs at days 7, 10, and 14 of differentiation (n=3 for each sample) using the RNeasy Mini Kit (Qiagen). First-strand cDNA synthesis was performed using the SuperArray RT 2 First Strand kit (SABiosciences) using 1 μg of input RNA per sample, followed by real-time PCR using the Mouse ECM and Adhesion Molecules array or Mouse Growth Factors array and SuperArray RT 2 qPCR Master Mix (SABiosciences), as per the manufacturer's recommended protocol. First-strand synthesis and real-time PCR were performed using a MyCycler and MyiQ real-time thermal cycler (BioRad), respectively.
Gene expression analysis
Fold changes in gene expression were analyzed using the ΔΔCt method of quantitation, whereby samples of EBs from different time points (days 7, 10, and 14) were compared relative to undifferentiated ESC values after individual sample values were normalized to internal GAPDH levels. Average fold change values obtained from the ECM and GF arrays were input into the array analysis software Genesis (Release 1.7.5). 16 Hierarchical clustering was then performed across both genes on log2-transformed data using average linkage clustering. The clustering was visualized through a heat map and dendrogram, with green indicating decreased expression compared with ESCs and red indicating increased expression with the color intensity corresponding to the magnitude of decreases or increases. Significant gene expression changes between each time point were depicted with a branch schematic, with increasing or decreasing slopes representing positive or negative fold changes, respectively, while nonsignificant changes were illustrated as horizontal lines. Additionally, statistically significant genes were used to create Venn diagrams to identify similar and unique genes between static and rotary culture groups that were increased or decreased compared with undifferentiated ESCs. 17
Immunostaining
EB samples were fixed for 30 min in a 10% formalin solution, rinsed twice in PBS, and embedded in HistoGel, followed by sucrose cryoprotection and OCT infiltration under vacuum at room temperature for 24 h. EB samples were then frozen in OCT at −80°C, cut into 8-μm-thick sections (Microm Cryo Star), and transferred to Superfrost Plus Micro Slides (VWR). For immunofluorescent staining, slides were acetone fixed, blocked, and permeabilized in a buffer containing 2% donkey serum with 0.05% Triton X, and then incubated with the collagen II (1:200; Abcam), collagen III (1:100; Abcam), collagen IV (1:80; Millipore), fibronectin (1:30; Millipore), or vitronectin (1:50; Abcam) primary antibody in a blocking/permeabilization buffer at 4°C overnight. Samples were then rinsed with PBS three times for 5 min each and incubated for 1 h at room temperature with the donkey anti-rabbit fluorescently tagged AlexaFluor 594 (Molecular Probes; Invitrogen) secondary antibody (1:200), followed by three PBS rinses. Nuclei were counterstained using Hoechst (10 μg/mL) fluorescent dye, and slides were coverslipped with Fluoromount-G (Southern Biotech). Samples were imaged using a Nikon 80i upright microscope and a SPOT Flex camera (Diagnostic Instruments, Inc.).
Protein quantification
Proteins retained within EB samples (n=3 for each sample) were collected using the T-PER Tissue Protein Extraction Reagent (Thermo Scientific) with protease inhibitors (Calbiochem; Millipore). The total protein content of EBs was analyzed using a bicinchoninic acid (BCA) assay kit (Thermo Scientific). Absorbance readings were taken using the Molecular Devices SpectraMax M2e microplate reader and SoftMax Pro v5 microplate data acquisition software. Enzyme-linked immunosorbent assay (ELISA) kits were used to quantify the amount of GFs retained within EBs, specifically BMP-4, IGF-2, and VEGF (DuoSet; R&D Systems). ELISAs were performed according to the manufacturer's instructions; briefly, a MaxiSorp™ Immuno 96-well plate (Nunc; Thermo Scientific) was adsorbed with a capture antibody overnight, blocked for 1 h with 0.2 μm filtered 1% bovine serum albumin (BSA, Fraction V; Millipore), and incubated with a 100 μL EB protein sample followed by a biotinylated detection antibody for 2 h each. The concentrations of capture and detection antibodies used were dictated by the DuoSet protocol for each protein: 2 and 1 μg/mL for BMP-4, 4 μg/mL and 200 ng/mL for IGF-2, and 400 and 100 ng/mL for VEGF, respectively. The T-PER Tissue Protein Extraction Reagent (Thermo Scientific) was used as the diluent for the standard curve samples. The amount of analyte was assessed using the colorimetric reaction of peroxidase and tetramethylbenzidine with an absorbance reading at 450 nm. Absorbance values for each EB sample were compared with the standard curve to establish the protein analyte content, which was normalized to the total protein content.
Statistics
Statistical analysis for individual genes and ELISA data were performed using Systat software with a two-way ANOVA. The equality of variances was determined using a Levene's test followed by Tukey's post hoc analysis for samples with equal variance and a Dunnett's T3 post hoc analysis for samples with unequal variances. For collective analysis of all genes in the array, expression fold-change comparisons of individual genes across time points were evaluated using a one-way ANOVA with subsequent post hoc Tukey analysis to determine significance (p<0.05). Significant differences in expression fold change between consecutive time points were depicted with a branch schematic for all genes from the array, with increasing or decreasing slopes representing positive or negative fold differences, respectively, while nonsignificant differences were represented by horizontal lines.
Results
EB morphology in static and rotary environments
Morphological differences of EBs formed by static and rotary cultures were observed through phase imaging and histology throughout differentiation (days 7, 10, and 14 postformation). Static EBs of variable sizes were irregularly shaped and tended to form large aggregates over time (Fig. 1A–C, G–I), whereas rotary EBs remained more homogeneous in both size and morphology throughout the course of differentiation examined (Fig. 1D–F, J–L). Although the cellular morphologies of the EBs appeared generally similar in both conditions, the larger static EBs appeared to form necrotic core regions (Fig. 1H, indicated by *) that were not frequently observed in the rotary EBs. In addition, EBs in rotary environments exhibited a more compact and homogeneous cellular organization and a smooth, continuous cellular exterior than those cultured in static conditions.
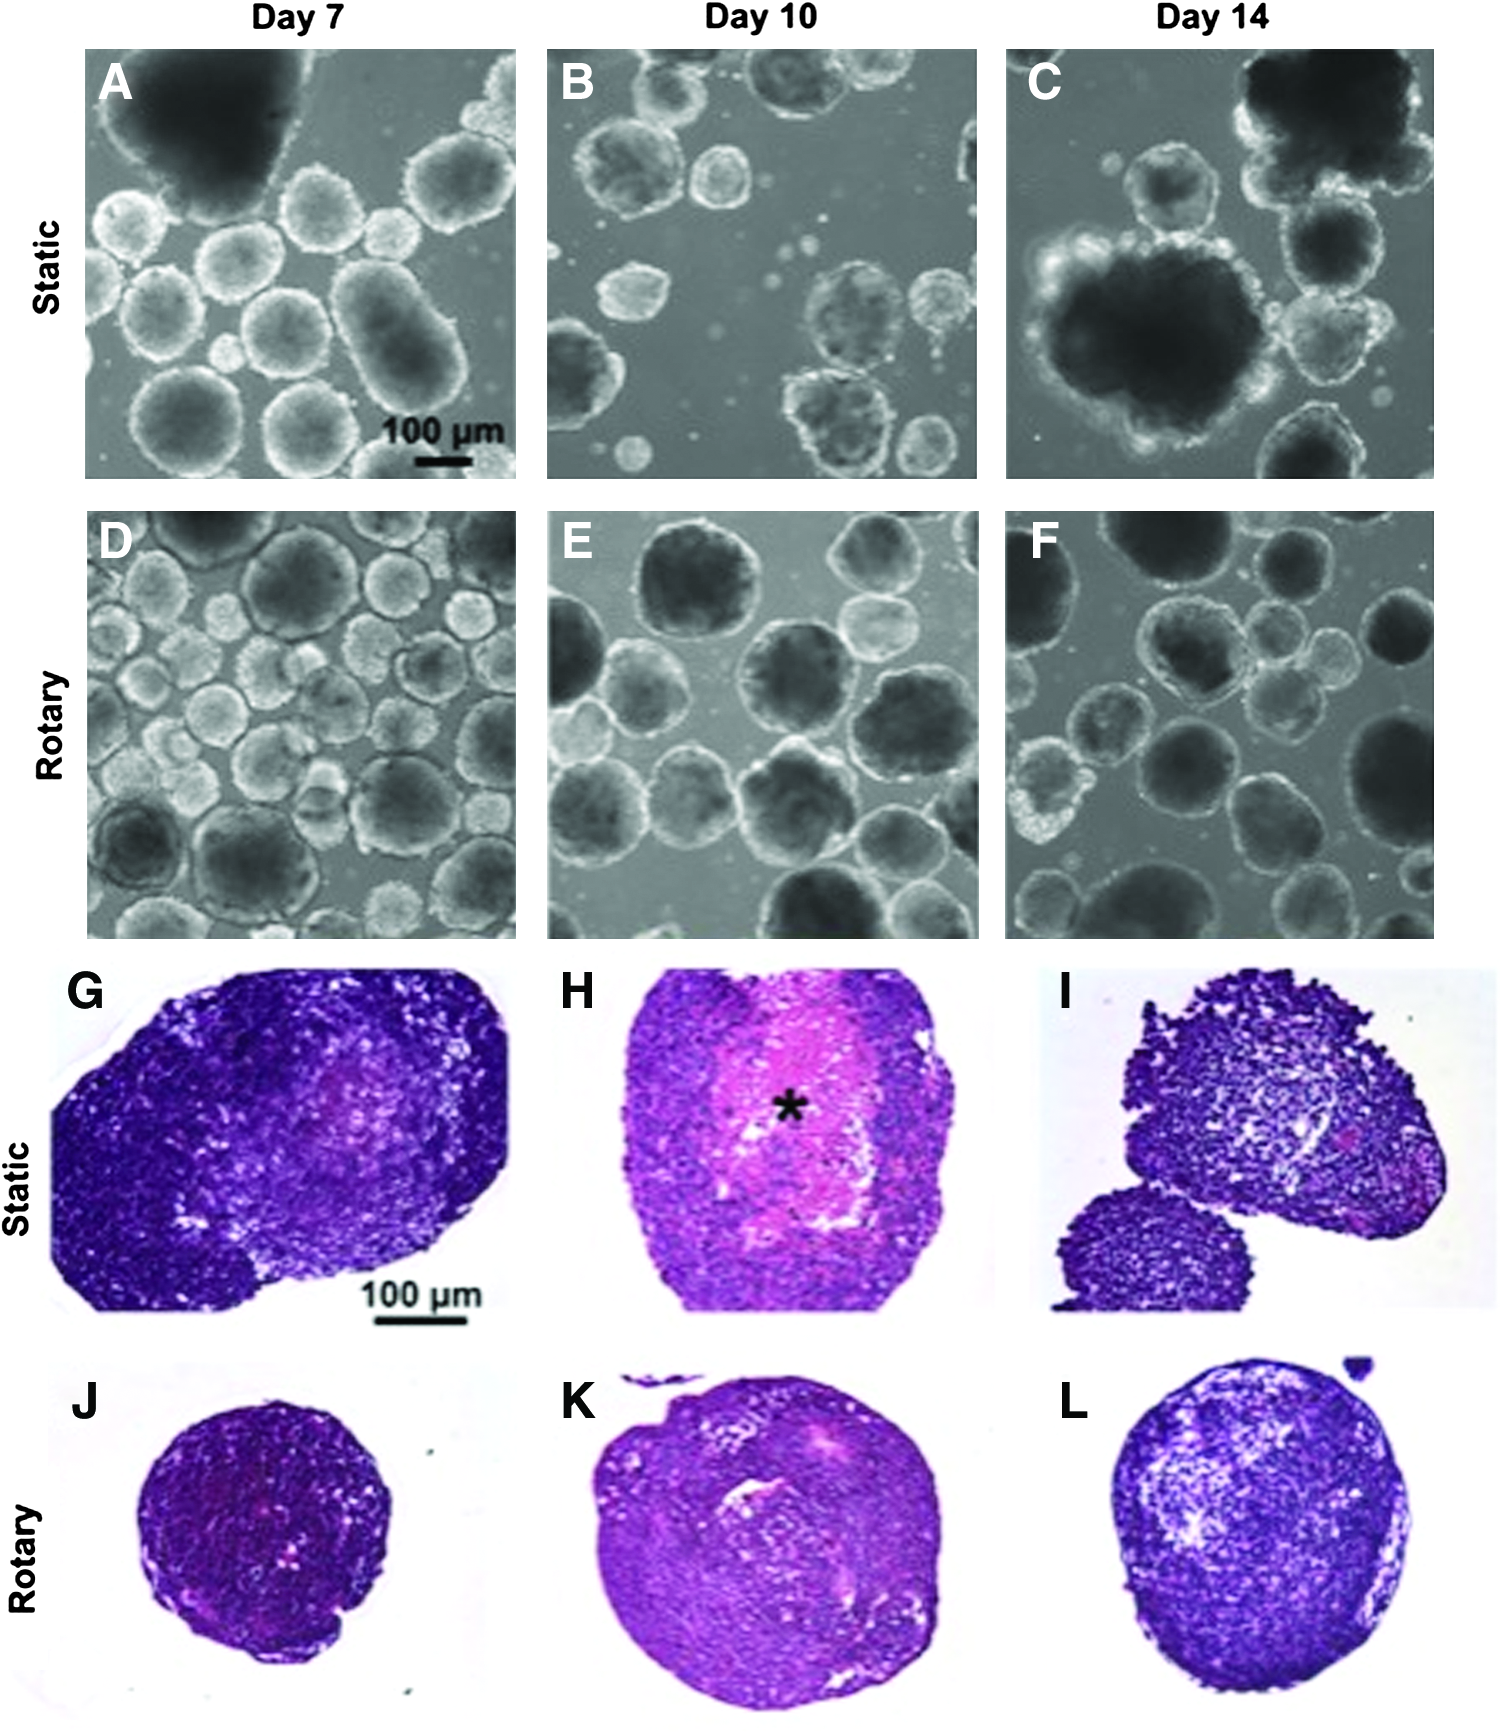
Time course of embryoid body (EB) differentiation formed by static and rotary culture. Hematoxylin and eosin staining of differentiating EBs at days 7, 10, and 14 of differentiation reveal the cross-sectional EB cellular morphology. Static EBs were irregular
ECM and GF gene expression in static and rotary environments
Based on heat map and hierarchical clustering analysis, ECM and GF genes exhibited an early decrease in static cultures (Fig. 2A) and a relatively delayed increase in rotary cultures (Fig. 2B), suggesting that hydrodynamic conditions alter the kinetics of ECM and GF gene expressions. Four distinct trends were identified from the heat maps of gene expression: consistently increasing over time (red), decreasing initially but gradually increasing thereafter (purple), largely unchanged (blue), or reduced at all time points relative to undifferentiated ESCs (green) (Fig. 2). Interestingly, despite variances in the number of genes represented within each of these different groups, many genes (e.g., Vtn, Postn, Igf1, Igf2, Col2a1, Col1a1, Col4a1, Vegfa, and Spp1) fell in similar clustering groups in both static and rotary culture conditions (Supplementary Fig. S1 and S2; Supplementary Data are available online at
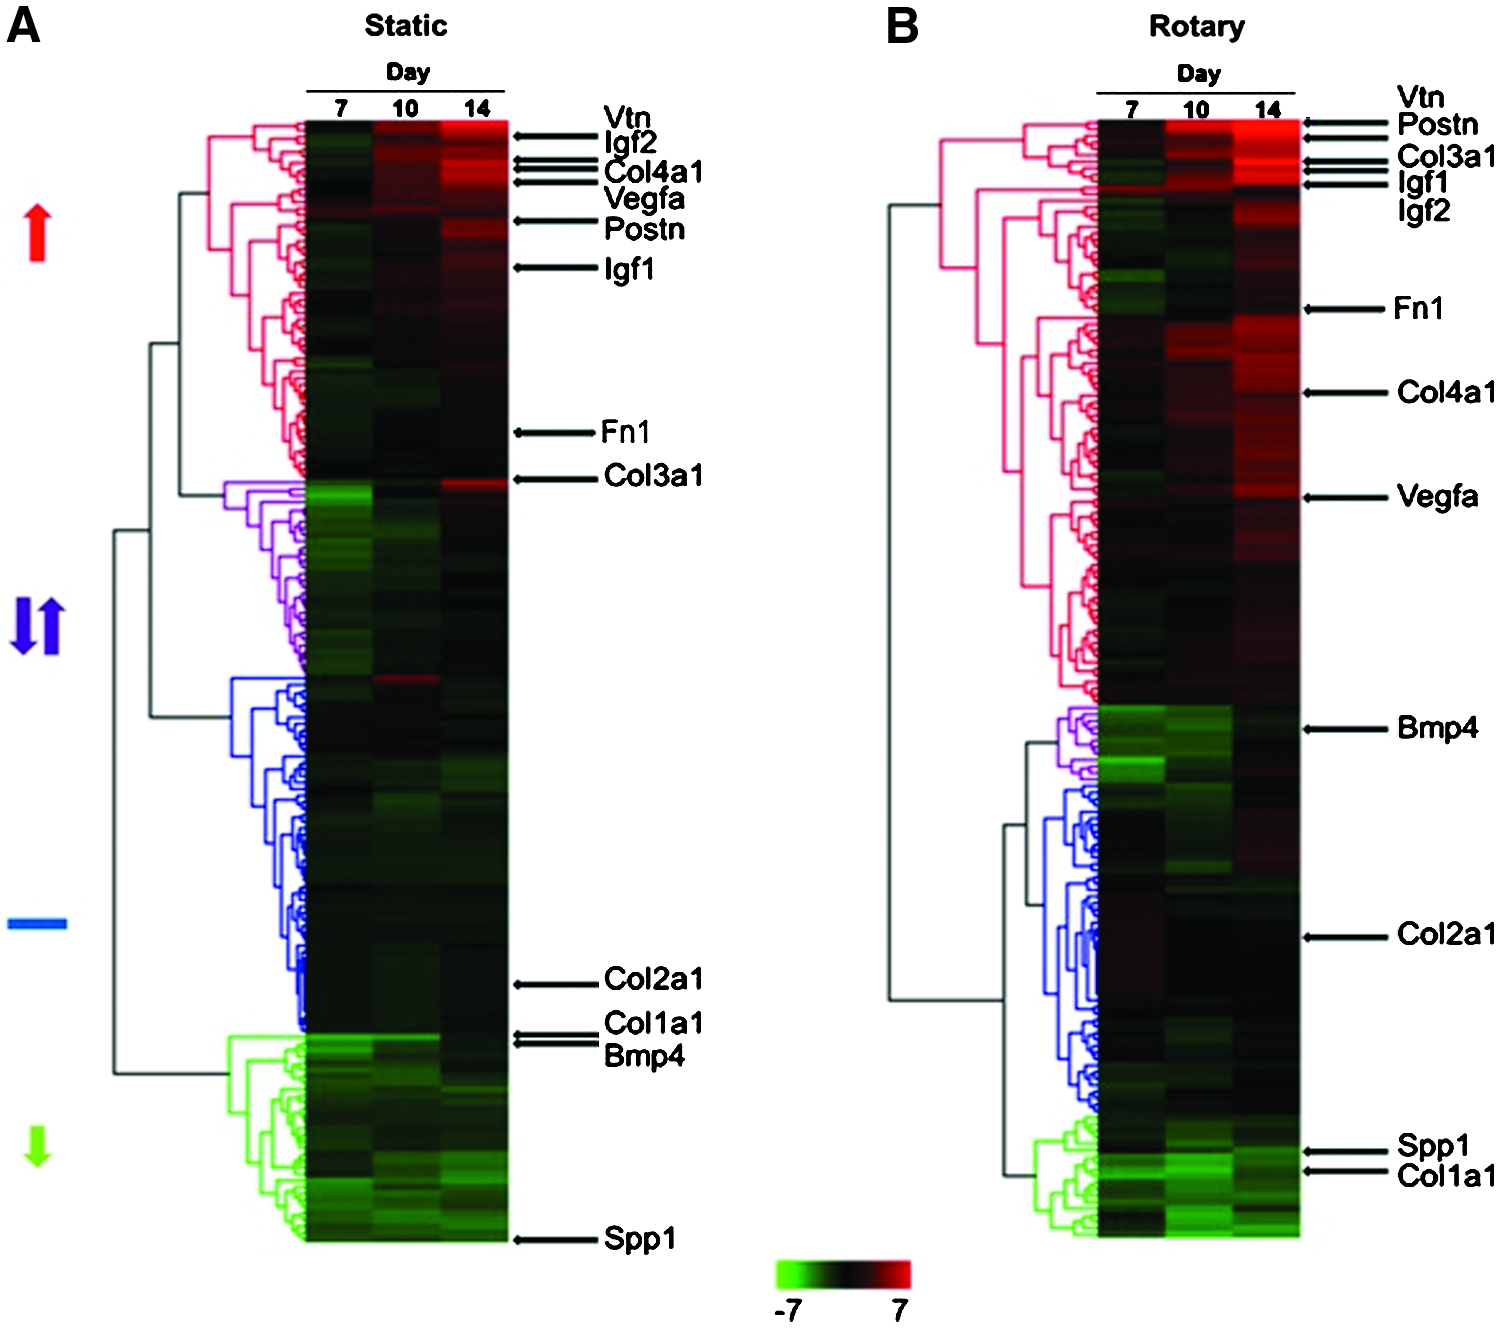
Heat map of gene expression of EBs from static
To examine the significance of individual gene expression changes over the course of differentiation, parallel one-way ANOVAs were performed (Fig. 3). Significant changes in gene expression between each time point were depicted with a branch schematic (Fig. 3A, B). A large number of genes (43.9% in static and 62.0% in rotary) did not significantly change by day 10, however, during the final stage of the time course (day 10 to 14), 45.7% (78/171) of genes in rotary culture significantly increased, compared with only 25.3% (43/171) in static conditions. Furthermore, while the expression of a similar number of genes remained unchanged throughout the examined time course between both static and rotary systems (31.6% and 33.9%, respectively), 50.0% of genes exhibited a decrease in expression by day 7 in static culture compared with only 16.4% in rotary culture. Interestingly, although some molecules (e.g., Col3a1, Postn, Vtn, Igf1, Vegfa, Col1a1, and Spp1) ultimately maintain the same pattern of expression through day 14 regardless of the culture system, the significant expression changes of other genes (e.g., Bmp4, Igf2, Col4a1, Fn1, and Col2a1) varied over time, suggesting that hydrodynamic forces can modulate selective gene patterns. Overall, the number of genes that significantly increased in expression grew as EB differentiation progressed, while the number of genes that significantly decreased was reduced in both static and rotary cultures (Fig. 3C, D). Importantly, the relative percentages of genes that were significantly increased and decreased varied considerably depending on the culture system and correlated with heat map expression patterns (Fig. 2).
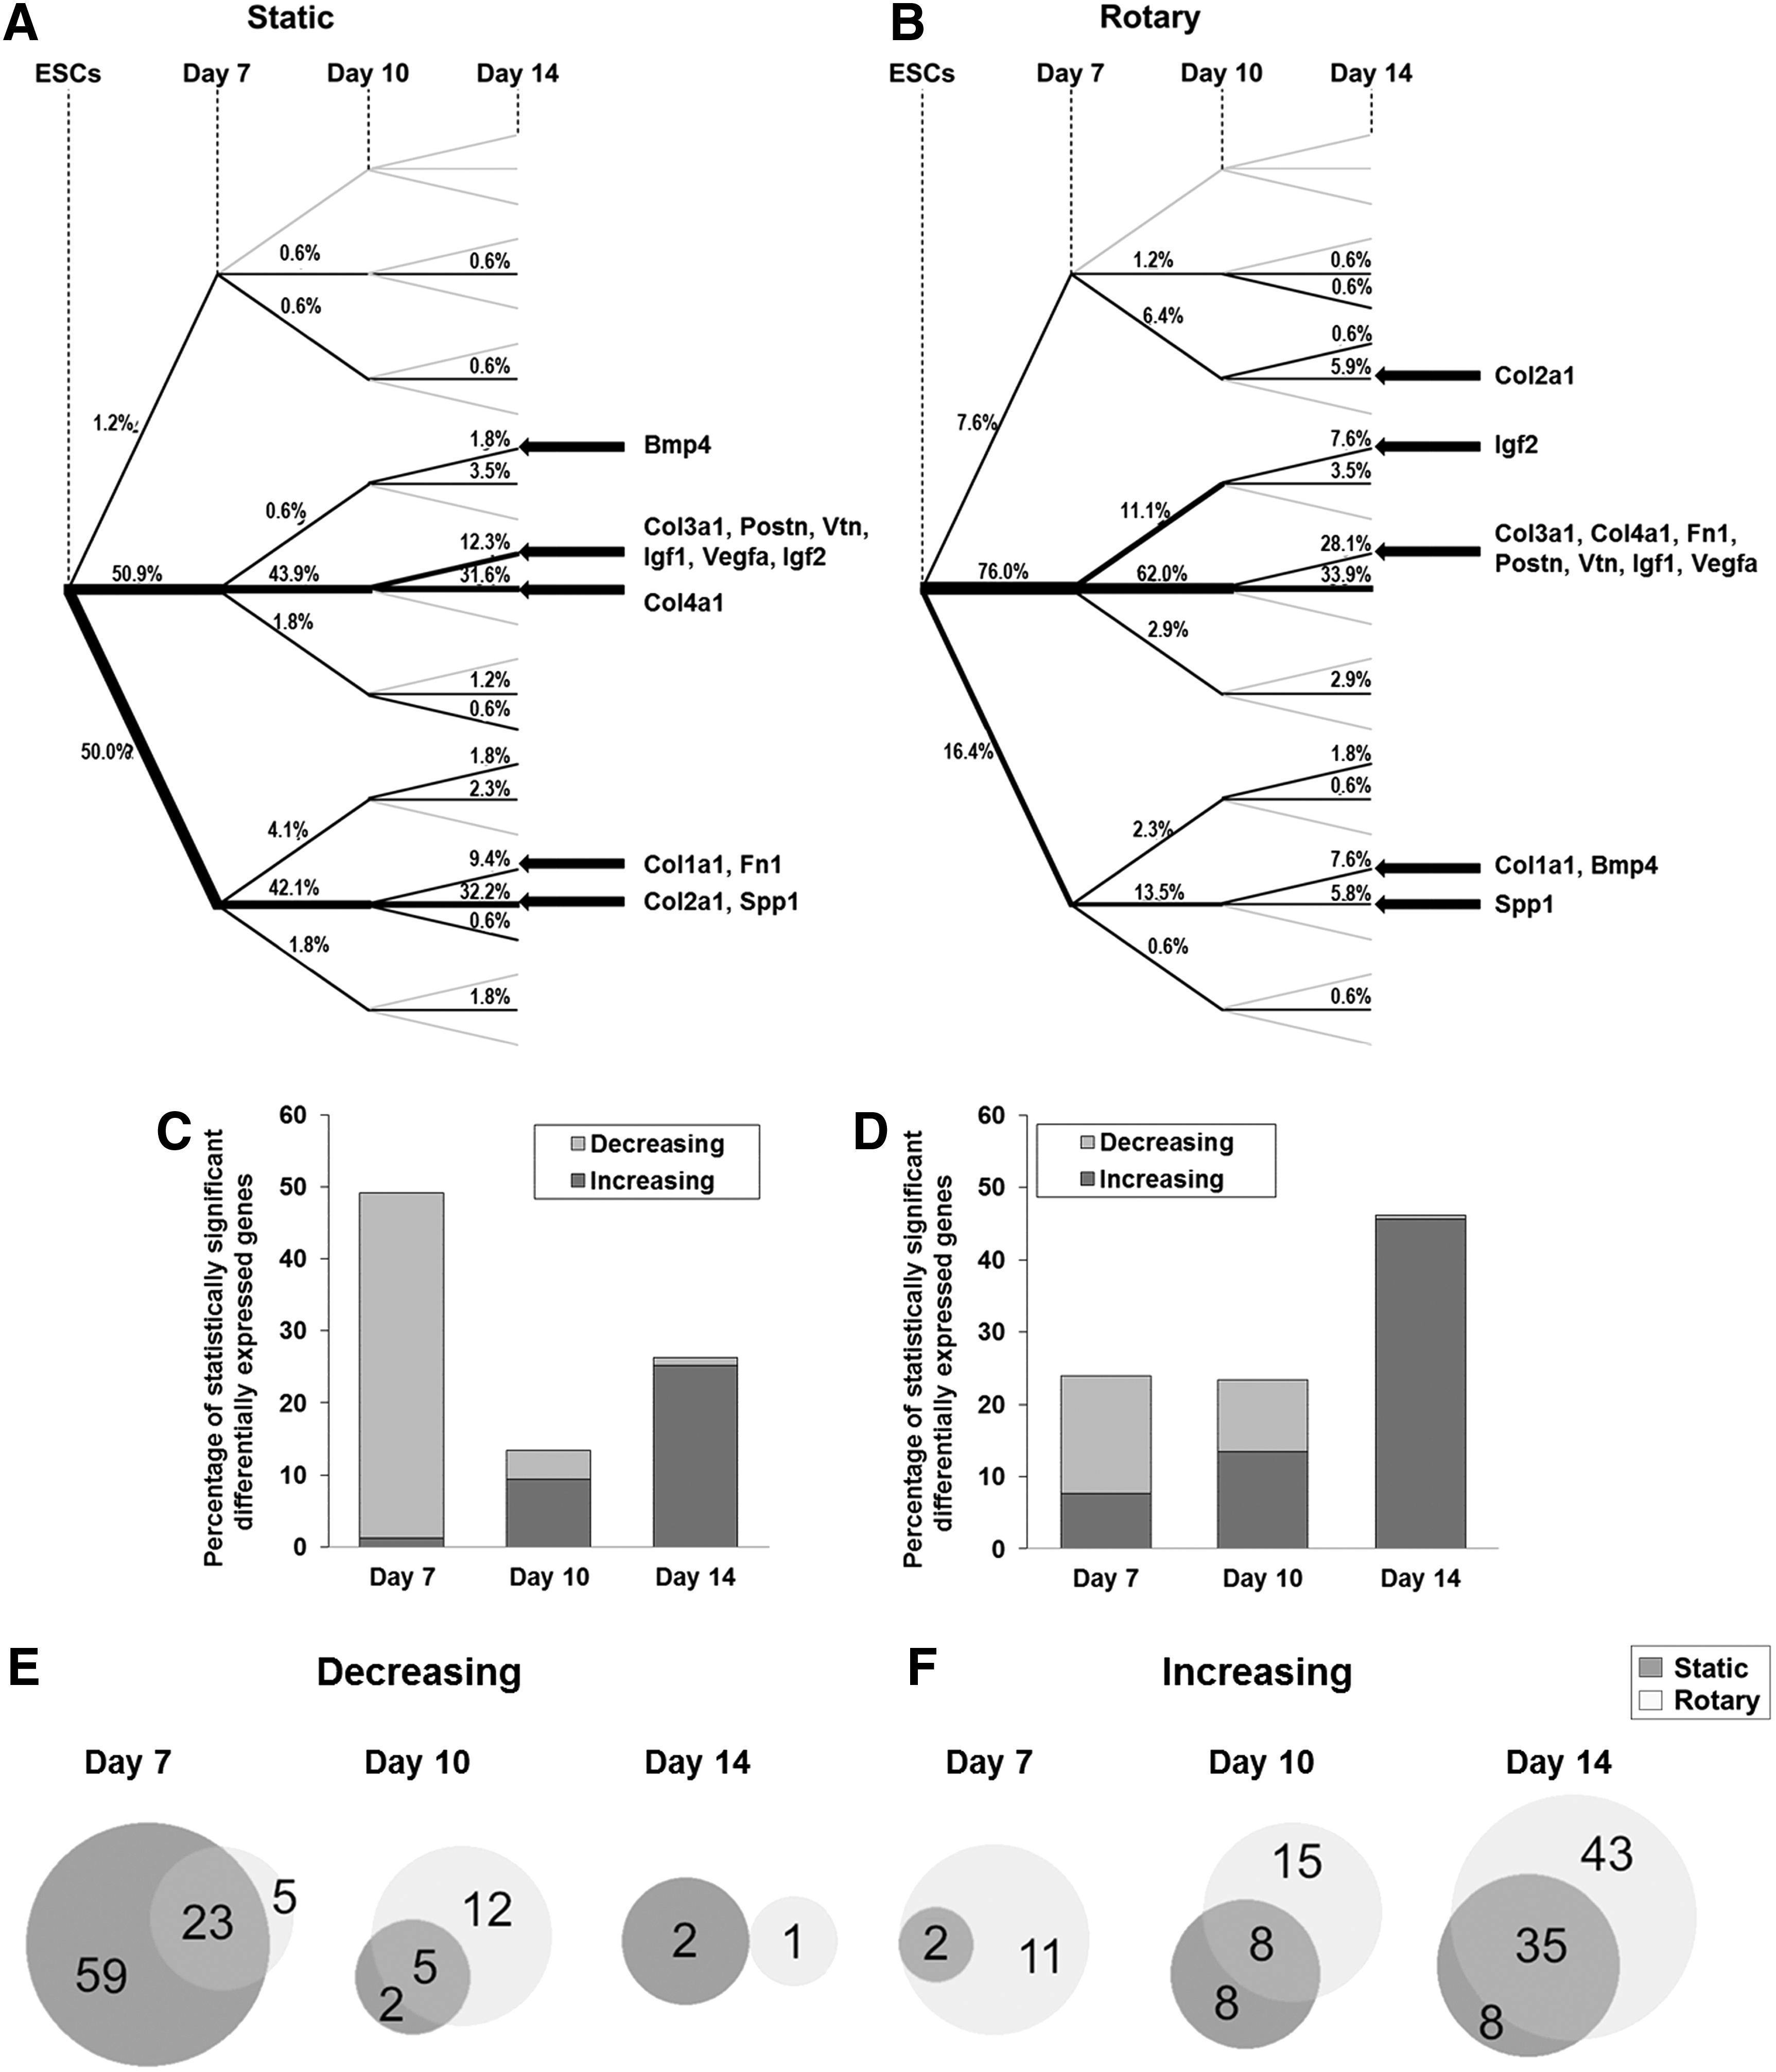
Gene expression analysis of static and rotary cultures at day 7, 10, and 14. ANOVAs were performed across each time point for individual genes from both extracellular matrix (ECM) and GF arrays. Results are depicted using a tree schematic
Relationship between differentially expressed genes in static and rotary environments
The patterns of significant gene expression changes between static and rotary cultures were also compared using Venn diagrams (Fig. 3E, F). In general, many of the genes that exhibited a significant decrease in expression at day 7 in static cultures were similarly decreased in rotary cultures (23/87 genes; e.g., Bmp4, Col1a1, and Spp1) (Fig. 3E). Likewise, there were a high number of similar genes in both culture systems that were significantly increased at day 14 compared with ESCs (35/86 genes; e.g., Bmp4, Col1a1, Col3a1, Postn, Fn1, Igf1, Igf2, Vegfa, and Vtn) (Fig. 3F). Several patterns emerged when examining groups of functionally related genes that were differentially expressed in static or rotary cultures; for example, a decrease of many ECM protease genes (Adamts and Mmp) in static cultures at day 7 was contrasted by an increase of several protease genes in rotary cultures at the same time point (Supplementary Fig. S3). Furthermore, several ECM protease (Mmp) and protease inhibitor (Timp) genes were significantly increased at day 14 in rotary cultures, but not in static cultures, suggesting increased remodeling of the ECM in hydrodynamically cultured EBs. Correspondingly, an increase in expression of many ECM genes was observed in rotary EBs at day 14. Day 7 EBs demonstrated decreased expression of cell–cell and cell–matrix adhesion genes (including Cdh, Itgam, Itgax, and Itgb1 in static, Itga5 in rotary, and Icam, Itga3, Itgal, Itgb3, and Itgb4 in both) compared with the starting ESC population. However, integrin receptor genes were significantly increased at day 14 of culture (including Itgax in static, Itga2, Itga3, Itgb4 in rotary, and Itga4, Itgb1, and Itgb3 in both). The expression of several prosurvival GF genes capable of regulating apoptosis (Il4, Il6, Il7, Bdnf, and Gdnf) 18 was decreased in static cultures by day 7, but not decreased under rotary conditions. Although several GFs involved in cell differentiation and morphogenesis (Bmp4, Bmp5, Bmp6, Csf1, Vegfa, Bdnf, Fgf10, Igf1, Igf2, and Tgfb1) were increased in both environments at day 14, rotary cultures exhibited increased expression of many additional GF genes involved in both differentiation and development (Bmp1, Bmp3, Fgf13, Fgf15, Fgf18, Fgf3, Tgfa, Tgfb2, Tgfb3, and Vegfc), suggesting more robust morphogenesis in rotary compared with static environments.
In addition, to simplify the magnitudes of changes induced by the culture environments, different classes of ECM and GF genes also demonstrated temporal modulation (Fig. 4). Both culture conditions exhibited decreased expression of collagen I (Col1a1) compared with undifferentiated ESCs (0.05- to 0.6-fold change; Fig. 4A), whereas collagen III (Col3a1) and IV (Col4a1) expression increased over time (13- to 166-fold increase by day 14, Fig. 4C, D). Collagen II (Col2a1) increased in rotary day 7 samples (2.3-fold) (Fig. 4B), but otherwise, the levels were similar to undifferentiated cells at all other time points examined. Gene expression of periostin (Postn) and vitronectin (Vtn) increased over the time course examined (Fig. 4E, F), whereas osteopontin (Spp1) gene expression remained reduced relative to undifferentiated ESCs (Fig. 4G), as did fibronectin (Fn1) expression (with the exception of rotary culture at day 14) (Fig. 4H). The most significant hydrodynamically modulated difference was evident in vitronectin expression (Fig. 4F) at early time points (day 7, 10) with increased expression in rotary cultures (1.4- to 63-fold increase in rotary versus 0.3- to 4.3-fold in static). In addition, expression of collagen II (Fig. 4B) in rotary cultures at day 7 and collagen III (Fig. 4C) at day 14 was significantly increased compared to all other conditions. The expression of GF genes (Bmp4, Igf1, Igf2, and Vegfa) generally increased over time (Fig. 4I–L). Furthermore, although significant differences were observed between time points, Bmp4 expression was reduced (Fig. 4I) relative to ESCs throughout the time course, while expression of vascular endothelial growth factor-a (Vegfa), insulin-like growth factor-1 (Igf1), and insulin-like growth factor-2 (Igf2) increased 5- to 47-fold by day 14.
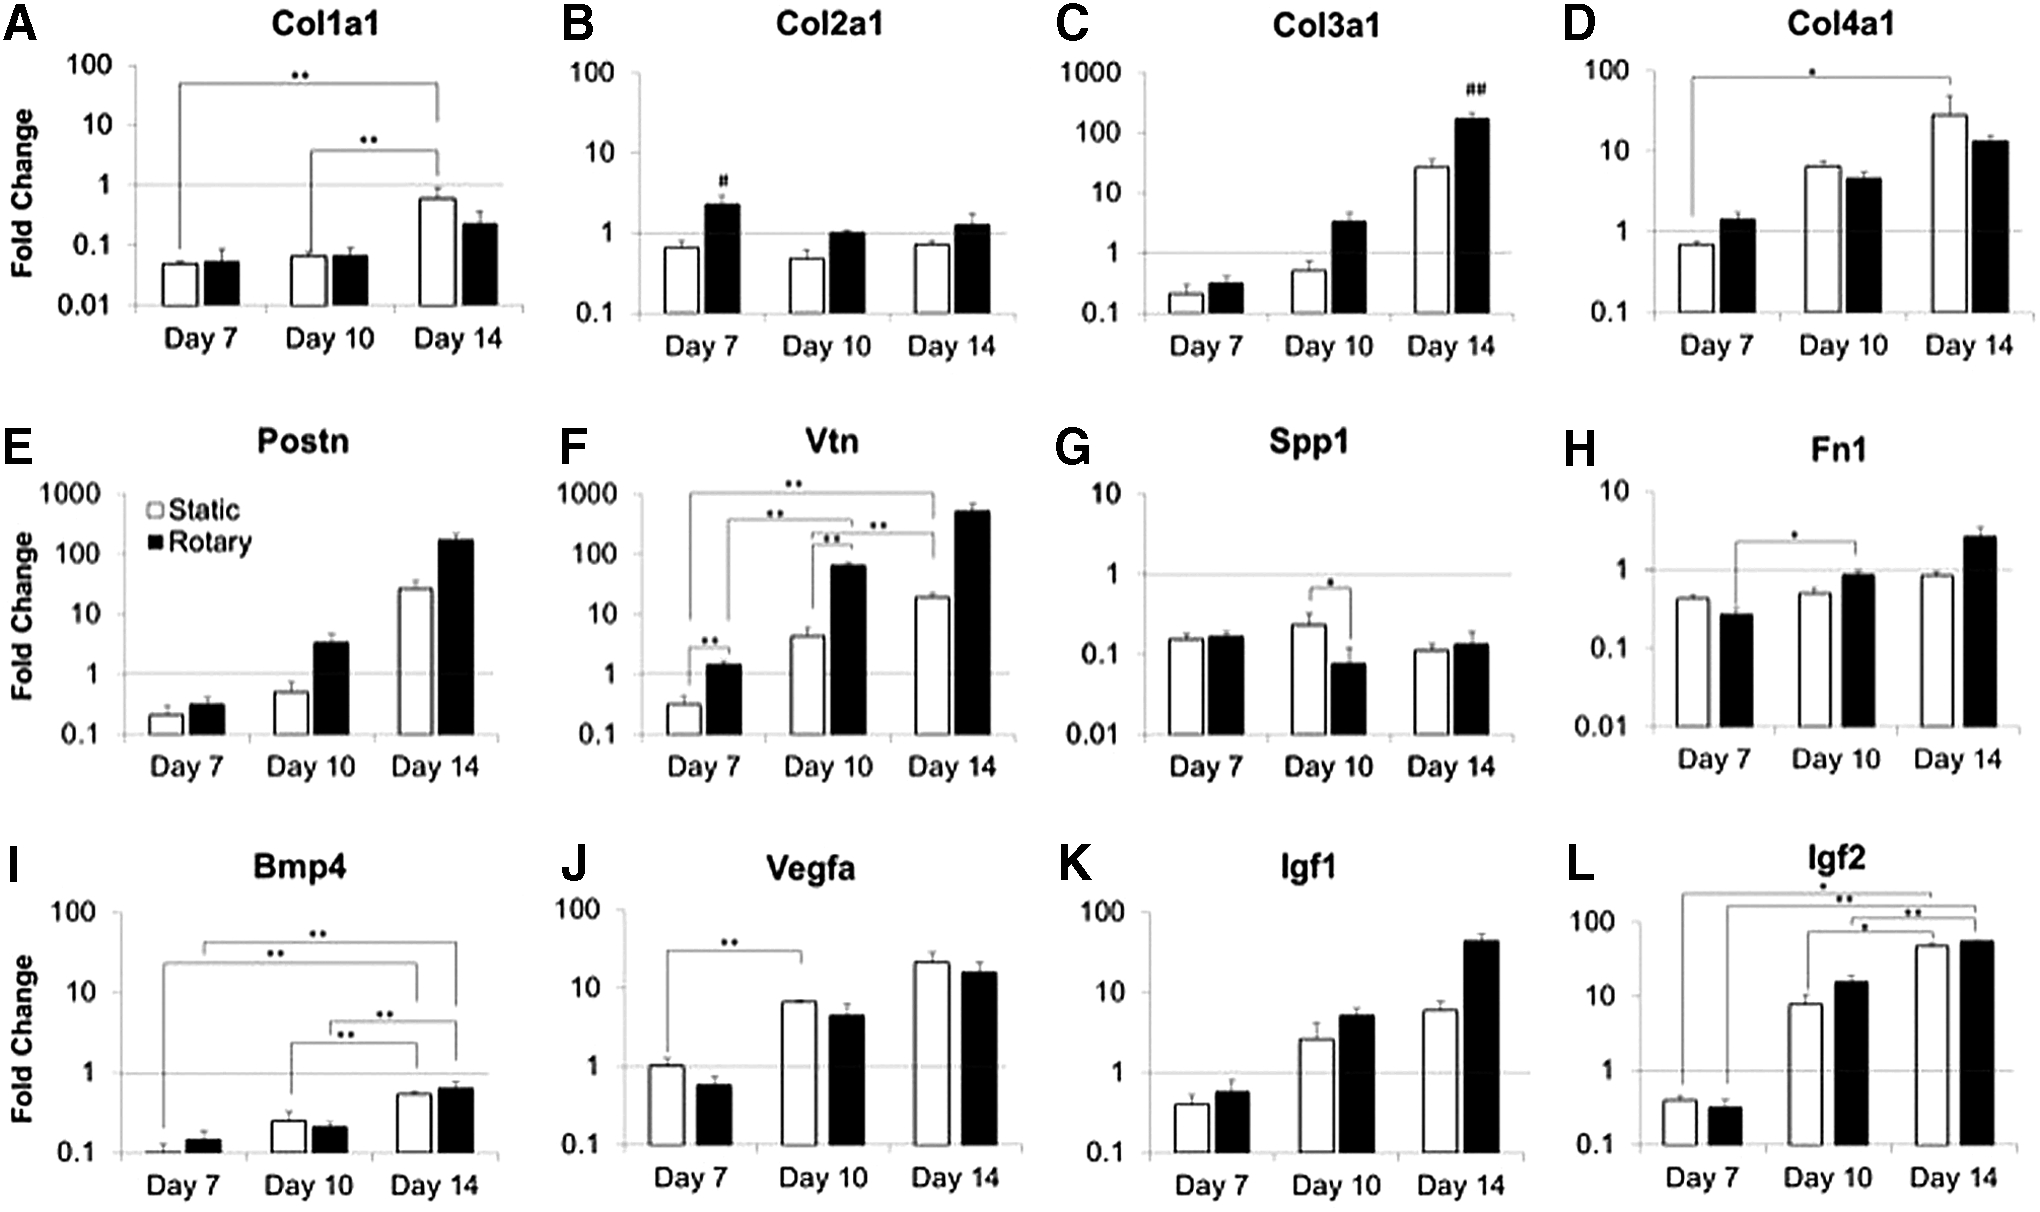
Different classes of extracellular matrix (ECM)
ECM and GF protein expression in static and rotary environments
Based on the differences in gene expression profiles described above, the expression of several ECM proteins was examined by immunostaining. Overall, staining demonstrated low levels of ECM molecules collagen II and III (Supplementary Fig. S4), and staining for collagen I was not evident in EBs differentiated under the conditions described above (data not shown). Temporal patterns of collagen IV, fibronectin, and vitronectin staining were consistent with gene expression results, exhibiting increased ECM throughout the time course in both static and rotary conditions (Fig. 5). However, the ECM (collagen IV, fibronectin, and vitronectin) in static culture was localized primarily at the exterior of EBs at day 7, becoming more evident throughout the entire cross section at day 10. Rotary cultures followed this same general pattern; however, the ECM (particularly vitronectin) was deposited on the exterior of EBs at both early time points and was not distributed throughout the entirety of EBs until day 14, demonstrating differences in hydrodynamic modulation of the ECM between culture conditions.
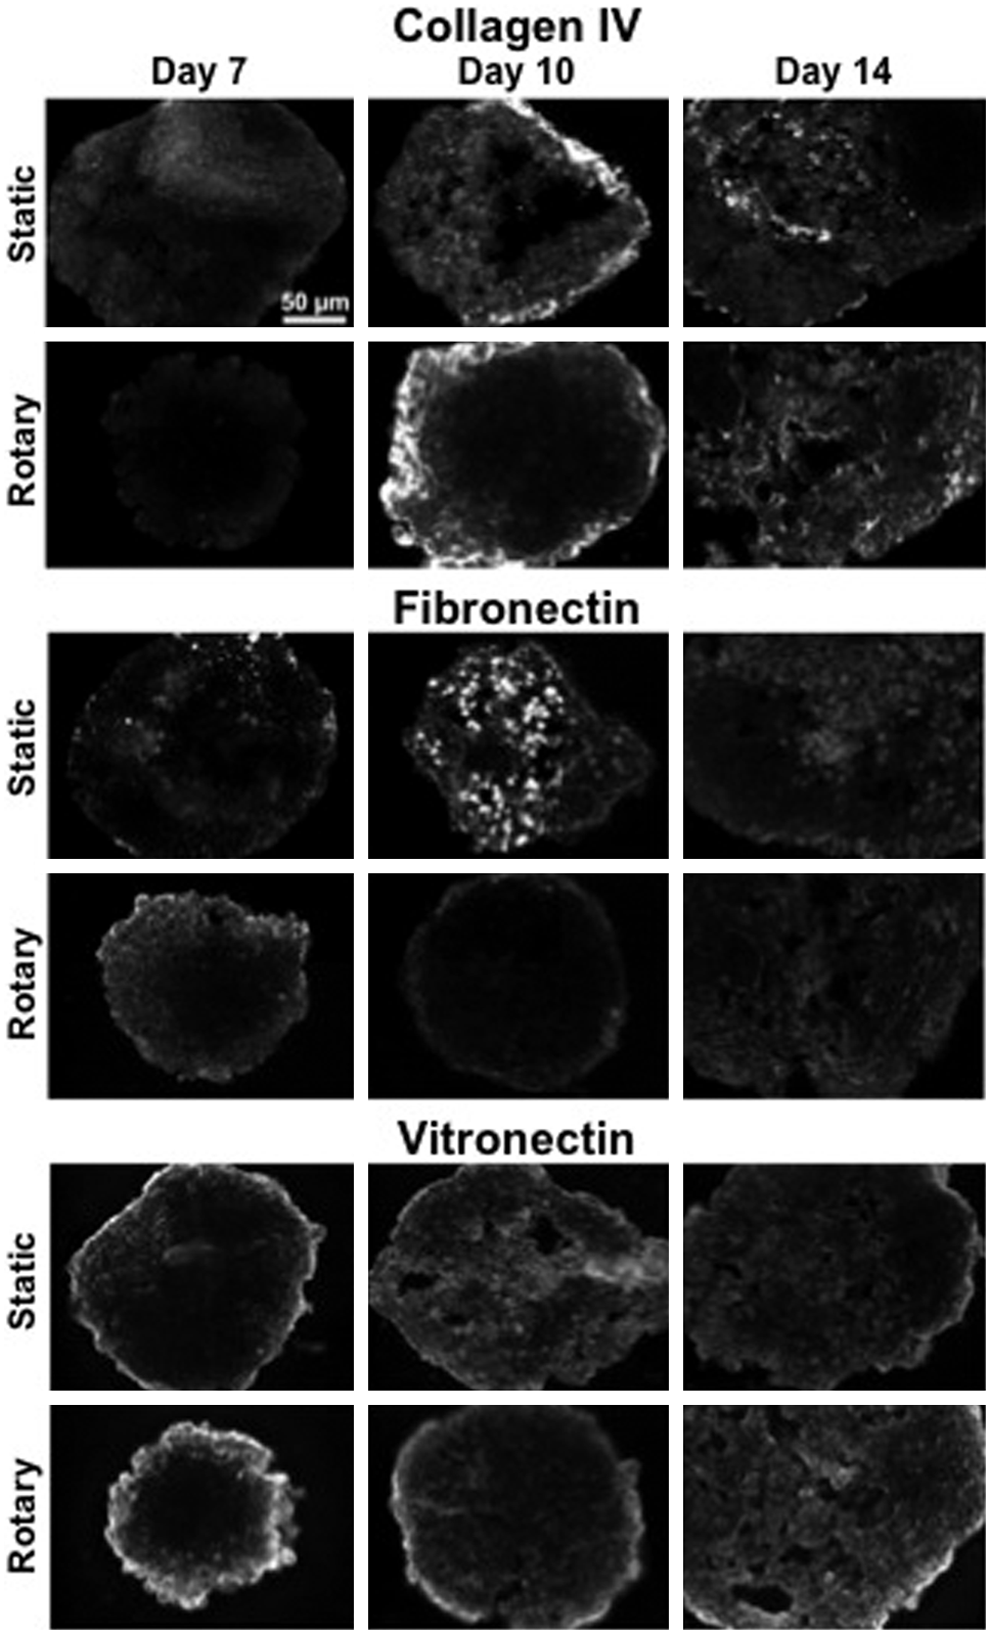
Expression of select ECM proteins. The temporal patterns of ECM expression of collagen IV, fibronectin, and vitronectin were similar between static and rotary cultures. However, ECM in rotary conditions appeared more organized and evident throughout EB cross sections than in static cultures, particularly at day 14 time points.
Additionally, protein expression of select GFs that are known to have roles in ESC differentiation and proliferation and exhibited increasing gene expression throughout the time course were measured by ELISA (Fig. 6). Protein expression of BMP4 (Fig. 6A), and VEGF (Fig. 6B) in static cultures generally increased over the time course examined, but was consistently lower compared with rotary conditions, and only the expression of BMP4 increased significantly by day 14 (p<0.01, static conditions). In contrast, rotary conditions exhibited more dynamic protein expression of these GFs, with increased expression between days 7 and 10 before decreasing from day 10 to 14. Along with differences in expression patterns, notable differences in the magnitudes of expression between static and rotary cultures as well as between time points were detected, particularly, for IGF2 expression (Fig. 6C). Both culture systems displayed a general increase in IGF2 expression over time (from 0.04±0.01 to 0.46±0.03 pg IGF2/μg protein in static and 0.29±0.03 to 0.64±0.01 pg IGF2/μg protein in rotary), but significant differences in protein levels were detected earlier (between days 7 and 10) for static conditions, and later (day 14) in rotary conditions, highlighting the effects of varying hydrodynamic conditions on endogenous GF expression by EBs.
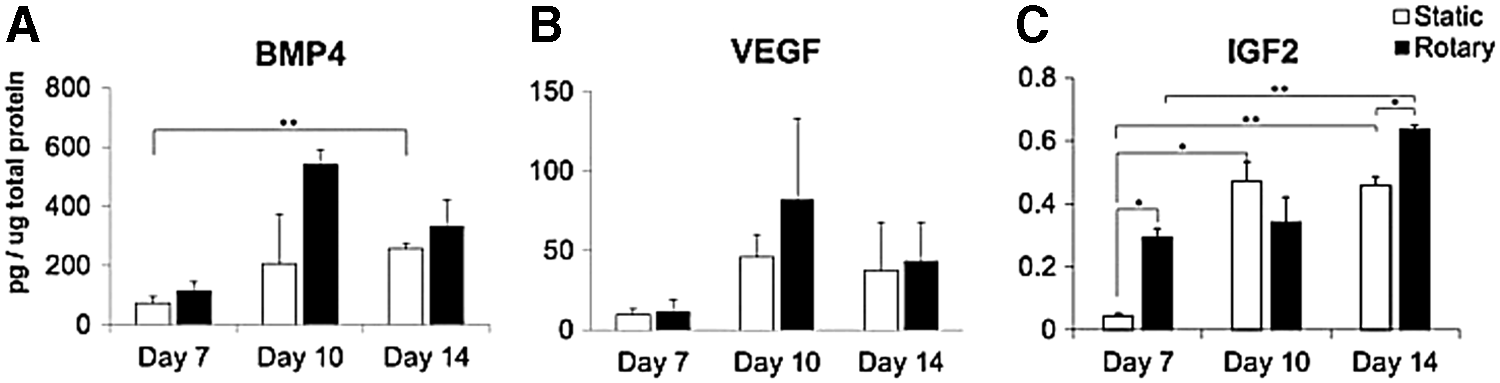
Protein expression of select GFs. Protein expression of GFs BMP4
Discussion
In this study, the effects of hydrodynamic conditions created by rotary orbital culture on the expression of the ECM and GF in EBs were investigated relative to static culture. It was revealed through global gene expression and systems analysis that select ECM and GF proteins are modulated both hydrodynamically and temporally, with results exhibiting an early decrease in gene expression in static cultures and a relatively delayed increase in rotary cultures. Further examination by immunostaining and ELISA similarly demonstrated differences in select ECM and GF proteins between the culture systems, suggesting that global environmental parameters, namely, hydrodynamic forces, can alter the expression patterns of both matrix molecules and GFs of differentiating PSC multicellular aggregates.
EB differentiation is commonly used as a model of embryonic development and morphogenesis based upon the differentiation potential of PSCs and the ability of 3D multicellular aggregates to emulate the native structure of emerging tissues compared with 2D culture environments.4,19,20 A number of different methods for EB formation and differentiation exist, with recent improvements in controlled EB formation and maintenance of uniform sizes achieved by microtechnologies alone or in combination with hydrodynamic culture systems.13,21,22 Regardless of the specific methods used, EBs generally exhibit a similar loss of pluripotent markers before progressive expression of differentiated phenotypes is observed. Accordingly, our results suggest a pattern of ECM and GF gene expression that temporally corresponds well to the known sequence of embryonic developmental stages. For example, increased expression of protease (Mmp) and protease inhibitor (Timp) genes in the EB model of development (Supplementary Fig. S3) is expected since protease activity is needed to degrade ECM components during embryonic growth and tissue morphogenesis to enable cell migration and matrix microenvironment remodeling. 23 Additionally, the increase in many GFs that are abundant in embryonic environments and involved in cell differentiation and morphogenesis is recapitulated during the progressive differentiation of EBs (Bdnf, Bmp4, Bmp5, Bmp6, Csf1, Fgf10, Igf1, Igf2, Tgfb1, and Vegfa in both culture conditions at day 14). Therefore, examining the differences between static and agitated suspension culture systems for EB differentiation permits the investigation of how hydrodynamic forces alter the expression of ECM and GF molecules involved in developmental processes.
Controlled differentiation of PSCs using reproducible, scalable methods frequently includes the use of mixed/stirred bioreactor systems that could accelerate stem cell research for clinical therapies. However, hydrodynamic cultures expose PSCs to complex physical and chemical environments consisting of spatially and temporally modulated fluid shear stresses and heterogeneous mass transport, 24 which could influence cell differentiation. Hydrodynamic culture systems have previously been demonstrated to influence ESC differentiation compared with static cultures by modulating global phenotypic gene expression profiles, specific cell lineages, and endogenous signaling pathways.10–12,25 Rotary orbital culture was previously found to support increased cardiomyogenic differentiation, 10 which is consistent here with increased expression of several genes (Pdgfa, Tgfb2, Vegfc, Col5a1, Col6a1, Lama2, Lama3, Lamc1, and Vcan) involved in cardiac development relative to static culture (Supplementary Fig. S3).26–29 In this work, we have further demonstrated that hydrodynamics might influence ESC differentiation through temporal modulation of ECM and GF gene and protein expression. Although our results illustrate similar kinetic profiles between static and rotary culture systems for many of the specific genes examined, the rotary environment elicited increases in expression of a larger subset of genes throughout the time course of EB analysis. These results do not indicate that one system is better or worse than the other due to differences in matrix production, but do reflect that investigators using hydrodynamics to alter the EB size and yield should consider the effect that hydrodynamics might have on the expression of relevant molecules of interest that can impact PSC differentiation.
Most attempts to control stem cell fate involve direct manipulation of environmental factors such as soluble molecules, ECM, cell–cell adhesions, and mechanical forces.5,30–33 As the relative effects of different microenvironmental parameters on stem cell fate are increasingly discovered, 34 it becomes important to understand how modulation of endogenous ECM and GF expression can be achieved by engineering physical forces such as hydrodynamics to direct stem cell differentiation. As indicated by the results of this study, the augmented number of genes increased in rotary environments at day 14 compared with static (Fig. 3E, F), and more specifically, the increased expression of many GF genes involved in angiogenesis (Pdgfa, Pgf, Tgfa, and Vegfc) and morphogenesis (Bmp1, Gdf11, Pdgfa, Tgfb3, Vegfc, and Zfp91) (Supplementary Fig. S3) reflects varying differentiation pathways between the two environments. The results presented here highlight potential differences elicited by simple hydrodynamic alterations, but further investigation to illuminate specific pathways involved in EB differentiation and the inherent differences between the static and hydrodynamic systems will allow for improved manipulation of the microenvironment and potentially increase the efficacy of directed differentiation protocols.
The synergistic effects of soluble factors, matrix molecules, and physical forces are emerging as critical regulators of stem cell morphogenesis and differentiation.34–36 In this study, we demonstrated that ECM and GF temporal profiles of 3D PSC environments can be modulated by hydrodynamic forces. Whereas we have examined the effects of hydrodynamic modulation on ECM and GF production, elucidating whether hydrodynamics could also be modulating how these molecules persist within the microenvironment due to differences in mass transport remains a relevant question. 37 The results presented herein lay the groundwork for future studies to more precisely define the causal relationships between hydrodynamic culture parameters, endogenous ECM and GF production, and the resulting observed changes in differentiated phenotypes arising within EBs.
Conclusion
We have characterized ECM and GF gene and protein expression of differentiating mouse ES multicellular aggregates in static and rotary culture systems. Our results indicate that the overall temporal expression of ECM and GF genes was generally similar between static and rotary cultures, with a decrease in expression at the earliest time point examined and an increase over time compared with ESCs; however, several notable differences were observed in the number of differentially expressed genes and the magnitudes of expression between static and rotary cultures or between time points. Overall, the results of this study suggest that modulation of ECM and GF composition of 3D PSC microenvironments can be controlled by hydrodynamic culture conditions, which can be used in scalable suspension culture systems to direct the differentiation of PSCs to specific cell lineages.
Footnotes
Acknowledgments
Financial support was provided by funding from the National Institutes of Health (EB007316). RN was supported by an NSF Graduate Research Fellowship. The authors are grateful for usage of core facilities provided by the Parker H. Petit Institute of Bioengineering and Bioscience. The authors would like to thank Marissa T. Cooke and Dr. Tracy Hookway for critical review of the article and Dr. Priya R. Baraniak for helpful discussions during the preparation of this work.
Disclosure Statement
No competing financial interests exist.
References
Supplementary Material
Please find the following supplemental material available below.
For Open Access articles published under a Creative Commons License, all supplemental material carries the same license as the article it is associated with.
For non-Open Access articles published, all supplemental material carries a non-exclusive license, and permission requests for re-use of supplemental material or any part of supplemental material shall be sent directly to the copyright owner as specified in the copyright notice associated with the article.