
Abstract
Silk is a versatile and established biomaterial for various tissue engineering purposes. However, it also exhibits strong autofluorescence signals—thereby hindering fluorescence imaging analysis of cells and proteins on silk-derived biomaterials. Sudan Black B (SB) is a lysochrome dye commonly used to stain lipids in histology. It has also been reported to be able to quench autofluorescence of tissues in histology and has been tested on artificial biomedical polymers in recent years. It was hypothesized that SB would exert similar quenching effects on silk, modulating the autofluorescence signals, and thereby enabling improved imaging analysis of cells and molecules of interests. The quenching effect of SB on the intrinsic fluorescence properties of silk and on commercial fluorescent dyes were first investigated in this study. SB was then incorporated into typical fluorescence-based staining protocols to study its effectiveness in improving fluorescence-based imaging of the cells and proteins residing with the silk-based biomaterials. Silk processed into various forms of biomaterials (e.g., films, sponges, fibers, and electrospun mats) was seeded with cells and cultured in vitro. At sacrificial time points, specimens were harvested, fixed, and prepared for fluorescence staining. SB, available commercially as a powder, was dissolved in 70% ethanol (0.3% [w/v]) to form staining solutions. SB treatment was introduced at the last step of typical immunofluorescence staining protocols for 15–120 min. For actin staining protocols by phalloidin toxin, SB staining solutions were added before and after permeabilization with Triton-X for 15–30 min. Results showed that ideal SB treatment duration is about 15 min. Apart from being able to suppress the autofluorescence of silk, this treatment duration was also not too long to adversely affect the fluorescent labeling probes used. The relative improvement brought about by SB treatment was most evident in the blue and green emission wavelengths compared with the red emission wavelength. This study has showed that the use of SB is a cost and time effective approach to enhance fluorescence-based imaging analyses of cell-seeded silk biomaterials, which otherwise would have been hindered by the unmodulated autofluorescence signals.
Introduction
S
Tyr and Trp are aromatic amino acids with well-established excitation and emission spectral properties and have been widely used as intrinsic fluorescent probes in fluorescence spectroscopy to study conformations of proteins. 9 In this regard, studies have reported the use of endogenous fluorescence signals from silk (also termed autofluorescence) to relate to its structural conformational changes.8,10 Georgakoudi et al. reported the endogenous fluorescence spectral prints of three different forms of silk (e.g., in solution, gel, and sponge-like scaffold forms) and correlated the differences in the spectral profiles of the three forms with the degree of silk fibroin structural conformational changes. 10
Such autofluorescence behavior, although exploited to be a tool for research analysis as described in the preceding paragraph, is also concurrently a hindrance for tissue engineering applications. This is because silk exhibits strong autofluorescence signals across a broad spectrum of wavelengths, which interfere with fluorescence imaging analysis of fluorescently tagged cells and proteins on silk-derived biomaterials. Fluorescence microscopy is an instrumental analysis technique for tissue engineering applications, as it is a convenient approach that allows for multiple signals from different antibodies (and hence different proteins and targets of interest) to be simultaneously viewed and analyzed in a singular image. 11 This allows for colocalization studies to take place, and a better assessment and analysis to be made on the performance of the biomaterial in relation to its intended function. The issue with autofluorescence in fluorescence microscopy is, however, not distinctive to silk. Fixation-induced autofluorescence and naturally occurring autofluorescence in mammalian tissue sections from the kidneys, brain, and livers are routinely described in the literature.12–16 Artificial polymeric biomaterials, such as poly(urethane) and poly(lactic acid-co-glycolic acid), have also been reported in the literature to exhibit autofluorescence behaviors, which interfere with detection analysis of fluorescently tagged targets. 17
The methods described in the literature that addresses this autofluorescence issue include the use of photobleaching,15,16 borohydride addition, 13 and treatment with quencher dyes, such as Pontamine Sky Blue, 18 Trypan Blue, 19 and Sudan Black B (SB). Of these, one of the most successful and effective methods is the use of low concentration SB.12,14,15 SB is a lysochrome dye originally used in histology to stain lipids.20,21 In a recent study by Jaafar et al., SB was used to successfully quench the undesirable autofluorescence signals from artificial biomedical polymers and thereby improved fluorescence imaging analysis. 17 It is hypothesized that SB will have a similar quenching phenomenon on silk and hence can improve fluorescence-based imaging analysis involving silk-based biomaterials.
The success of SB as a useful autofluorescence quencher for imaging purposes hinges on the condition that it does not adversely affect the signals from commercially available fluorescent dyes used in staining protocols. Hence, part one of this study was dedicated to (1) investigate the duration of SB treatment on several immunofluorescent labels and (2) conduct an in-depth study on the effect of SB treatment duration and juncture of treatment introduction on fluorescence staining of actin by fluorescently conjugated phalloidin toxin. Phalloidin is a member of the phallotoxin family of toxins extracted from a poisonous mushroom strain Amanita Phalloides. 22 It is a low-molecular-weight peptide and has high binding affinity to filamentous actin (F-actin). 22 Fluorescent derivatives of phalloidin was reported in the literature from as early as the 1970s 22 and is commercially available today in several forms.
The aims of the second part of the study were (1) to study the suppressing effects of SB on the intrinsic fluorescent signals of the silk biomaterials and (2) to investigate any improvement to fluorescence analysis brought about by SB treatment. Fluorescence spectroscopy was conducted for the former, whereas the latter was demonstrated by staining for F-actin as per described earlier and also for common proteins of interests, such as collagen and fibronectin on cell-seeded silk-based biomaterials.
Materials and Methods
Preparation of silk fibroin solution
B. mori silk was obtained from collaborators as yarns consisting of silk fibers. Such fibers have the silk protein fibroin of interest in the structure core and coated with a glue-like protein sericin that serves to bind the silk fibroin core fibers together.2,23 Silk yarns were first degummed to remove the unwanted sericin, before being dissolved and dialyzed with modified protocols adapted from the literature.3,6 To elucidate briefly, degumming was first conducted in boiling solutions of 0.02 M Na2CO3 (Sigma Aldrich). The degummed yarns were then washed with dH2O to remove any residual Na2CO3 before being air-dried and then subsequently melted in 9.3 M lithium bromide (Sigma Aldrich) for 4 h at 60°C to obtain 20% (w/v) silk fibroin solutions. Dialysis of the silk fibroin solution was then carried out against dH2O for 48 h using SnakeSkin™ dialysis tubing (10,000 MWCO; Thermo Fisher Scientific) to remove lithium bromide ions. Known volumes of the purified silk fibroin stock solution were then dried in a freeze dryer (Epsilon 1–4; Martin Christ GmbH), and the residual solids were weighed to obtain its concentration after dialysis. The purified silk fibroin stock solution was then either kept at 4°C as a solution or freeze-dried in a freeze dryer (Epsilon 1–4; Martin Christ) to be kept as a solid sponge at room temperature for further steps.
Preparation of silk-based biomaterials
Silk films were fabricated using a modified protocol in the literature 3 by evaporating a thin layer of 5% (w/v) silk fibroin solution on 24-well culture plates (Greiner Bio-One GmbH) overnight, before adding absolute methanol (Fisher Chemical) for β-sheet formation to render the film insoluble in an aqueous environment.
Electrospun mats were obtained using modified protocols in the literature3,6,24 by first dissolving freeze-dried silk solution sponges in 1,1,1,3,3,3-hexafluoro-2-propanol (HFIP; Sigma) to form a 10% (w/v) silk polymer solution. The silk polymer solution was then loaded into a 5-mL syringe (Nipro) and placed onto a syringe pump (KD-Scientific) set at a flow rate of 1 mL/h. The silk polymer solution was subsequently ejected from a 18G hypodermic needle (pre-grinded to have a flat tip) that was subjected to a high voltage of 12 kV (Gamma High Voltage Research). Using a top–down setup, 24 the silk polymer solution, upon leaving the charged syringe needle, formed a whipping polymer jet, which gets evaporated of HFIP, as it gets collected on a grounded (Gamma High Voltage Research) metal platform set 10–20 cm away. Glass coverslips were placed on the collecting platform, and the electrospun mats were collected directly onto the glass slips for further steps of the study. After placing the mats in a fumehood overnight to evaporate any residual HFIP, absolute methanol was added to induce β-sheet formation to render the mats insoluble in an aqueous environment for cell culture.
Composite sponge–fiber scaffolds consisting of silk sponge embedded with fibers were fabricated by fixing fine silk yarns to the bottom of a standard 90-mm Petri dish, on which 10 mL of 5% (w/v) silk fibroin solution was added with gentle swirling to ensure uniform coverage. The Petri dishes with the silk fibroin solution and fibers were then freeze-dried in a freeze dryer (Epsilon 1–4; Martin Christ GmbH) for 16 h to remove water content to obtain the composite sponge–fiber scaffold consisting of silk fibers encased within a silk sponge. Absolute methanol was then added to allow for β-sheet formation for the sponge component.
Cell culture
Rabbit adipose-derived mesenchymal stem cells (ASCs) of passages 5–6 were used for all the cellular experiments in the study. ASCs isolated from the fat pads were processed as previously described. 25 Briefly, adipose tissues were isolated by 0.1% w/v type I collagenase (Invitrogen) digestion, followed by plating in culture flasks. Unless otherwise stated, cell cultures were conducted in a medium consisting of low-glucose Dulbecco's modified Eagle's medium (Invitrogen) supplemented with 10% fetal bovine serum (Hyclone, Thermo Fisher Scientific) and 1% penicillin/streptomycin (PAN-Biotech GmbH). All cultures were maintained in a humidified 5% CO2 incubator at 37°C.
Five groups of fluorescence staining experiments were conducted to address the objectives of this study. They were as follows: group I—effect of SB on fluorescent probes conjugated to secondary antibodies; group II—effect of SB on fluorescent probes conjugated to phalloidin toxin; group III—effect of SB treatment on F-actin staining with silk films and electrospun mats; group IV—enhancing colocalization imaging of F-actin and fibronectin on silk electrospun mats; and group V—improving resolution of proteins and cells on composite silk sponge–fiber scaffolds.
For groups I and II, ASCs were seeded at a density of ∼5×10³ cells/cm2 on 24-well tissue culture polystyrene culture plates (Greiner Bio-One GmbH). This addresses the first part of the study involving the effect of SB treatment and duration on fluorescent probes. These samples did not contain any silk biomaterials to avoid any fluorescence disturbances in assessment. Plates were sacrificed for assessment after (1) 3 days for staining protocols involving collagen type I detection (group I) and (2) 1 day for staining protocols involving just F-actin detection (group II). The culture medium for group I was further supplemented with 50 μg/mL ascorbic acid (Wako) to improve extracellular matrix (ECM) deposition and aid in collagen type I (Col I) detection.25,26
For groups III, IV, and V, composite sponge–fibers scaffolds, electrospun mats, and silk films were sterilized by 70% ethanol (VWR International) treatment, followed by UV irradiation before cell seeding. ASCs were seeded at a density of 6×10³ cells/cm2 on the silk films, ∼1.5×10⁴ cells/cm2 on the electrospun mats, and ∼1×10⁵ cells/cm2 on the composite sponge–fiber scaffolds. The seeding densities for the latter two were higher to account for the 3D nature of the mat (∼30–40 μm thick) and composite scaffold (∼700–900 μm thick). Films and electrospun samples were sacrificed for assessment after 1 day for staining protocols involving only F-actin detection (group III) and also for staining protocols involving the detection of ECM proteins (e.g., fibronectin, group IV). Cell-seeded composite sponge–fiber scaffolds were maintained in the ascorbic acid supplemented medium for 28 days before being sacrificed for assessment (group V).
Immunofluorescence staining
ASCs from group I were first fixed with −20°C methanol for 10 min, before being washed with 1× phosphate-buffered saline (PBS) two times, 5 min each. The samples were then blocked with 1% bovine serum albumin (BSA; Sigma Aldrich) for 1 h, before overnight incubation with a primary Col I antibody (1/2000; Sigma Aldrich) in a humidified chamber at 4°C. Secondary antibodies (conjugated with Alexa Fluor 488 nm [1/400; Invitrogen] and Alexa Fluor 594 nm [1/400; Invitrogen] probes) targeting the primary antibody were then added with 4′,6-diamidino-2-phenylindole (DAPI, 0.5 μg/mL; Invitrogen) for counterstaining of the nucleus for 30 min at room temperature.
ASCs from groups II and III were first fixed in 4% methanol-free formaldehyde (Thermo Fisher Scientific) for 10 min, before being washed with 1× PBS two times, 5 min each. Intracellular F-actin staining required cell membrane permeabilization, which was carried out with 0.1% (v/v) Triton-X (Bio-Rad Laboratories, Inc.). Phalloidin conjugated with Alexa Fluor 488 nm fluorescent probes (1/100; Invitrogen) and DAPI (0.5 μg/mL; Invitrogen), which was used as a counterstain for nucleus detection, was added for 30 min at room temperature.
ASCs from group IV were fixed and permeabilized the same way as described for groups II and III. The samples were then blocked with 1% BSA for 1 h, before overnight incubation with a primary fibronectin antibody (1/100; Sigma) in a humidified chamber at 4°C. Secondary antibodies (conjugated with Alexa Fluor 594 nm [1/400; Invitrogen] probes) targeting the primary antibody were then added with DAPI (0.5 μg/mL; Invitrogen) for 30 min at room temperature.
As the composite sponge–fiber scaffolds from group V were too thick for direct fluorescence imaging as those conducted for groups I to IV, cryosectioning was undertaken to carry out analysis. Group V samples were first fixed in 10% neutral buffered formalin at room temperature overnight before being washed with 1× PBS for three times, 15 min each. Samples were then incubated with 40% sucrose overnight at 4°C before being embedded in the tissue freezing medium (Shandon Cryomatrix; Thermo Fisher Scientific) for sectioning with a cryostat (Research Cryostat CM3050S; Leica Biosystems). Sections of 20 μm thickness were then used for immunofluorescence staining. As antigen retrieval was necessary for collagen type I detection following formaldehyde fixation, this was carried out by pepsin (Roche Diagnostics Asia Pacific) digestion at 37°C for 15 min. Blocking was then carried out with 1% BSA for 1 h, before overnight incubation with the primary fibronectin (1/100) and Col I (1/2000) antibodies (both Sigma) in a humidified chamber at 4°C. Secondary antibodies (conjugated with Alexa Fluor 488 nm [1/400; Invitrogen] and Alexa Fluor 594 nm [1/400; Invitrogen] probes) targeting the primary antibodies were then added with DAPI (0.5 μg/mL; Invitrogen) for 30 min at room temperature.
All images were viewed with an inverted epifluorescence microscope (IX71; Olympus), equipped with filters (Olympus) conventionally used in fluorescence microscopy. These filters are WU filter set (excitation filter 330–385 nm, emission filter 420 nm) for DAPI (blue) viewing, WIBA filter set (excitation filter 460–495 nm, emission filter 510–550 nm) for Alexa Fluor 488 nm (green) viewing, and WIY filter set (excitation filter 545–580 nm, emission filter 610 nm) for Alexa Fluor 594 nm (red) viewing. Microscopy images were all captured using a DP70 digital color camera system (Olympus) at ISO200.
SB quenching
SB (available commercially in a powder form) (Sigma Aldrich) was dissolved in 70% ethanol to form 0.3% (w/v) working solutions, in line with published protocols, which had used SB as a quencher dye.12,17 Samples were incubated with SB for 15–120 min, at room temperature, before rinsing in 1× PBS to remove excess SB. All SB quenching were conducted at the last step of fluorescence-based staining protocols except for groups II and III, whereby in addition to introducing SB after fluorescence staining, SB treatment was also introduced before the permeabilization and fluorescence staining steps to investigate the possibility of introducing SB treatment earlier in the staining process.
Scanning electron microscopy
Scanning electron microscopy (SEM) was conducted on cross sections of cell-seeded samples from group V and on acellular electrospun mats used for groups II, III, and IV to correlate the structures seen on the fluorescence images with SEM imaging. Before SEM, group V samples were first fixed in 4% methanol-free formaldehyde (Thermo Fisher Scientific) for 1 h, before being washed with 1× PBS for three times, 15 min each. The samples then underwent progressive dehydration by saturating them in 70% ethanol for 1 day, followed by 100% ethanol overnight. Samples were then placed in a critical point dryer (Autosamdri®-815 Series A; Tousimis) for preservation of the surface structure. All samples (including the electrospun mats) were placed in a gold coat sputter (Jeol) before being viewed using scanning electron microscopes from JEOL (JSM-5610/JSM6510; Jeol).
Fluorescence spectroscopy and statistical analysis
Fluorescence intensities of untreated and SB-treated silk films and electrospun mats were read using a microplate reader (PHERAstar Plus; BMG Labtech) with the following three filter sets: blue filter set (excitation: 340 nm/emission: 460 nm), green filter set (excitation: 485 nm/emission: 520 nm), and red filter set (excitation: 545 nm/emission: 610 nm). Fluorescence spectral measurements between controls (no SB treatment) and SB-treated groups (5, 15, 30, 60, and 120 min SB treatment) were all conducted either in one plate or back-to-back and normalized to the highest fluorescence to account for day-to-day variations and random background spectral noises from the instrument. Statistical analysis of the spectral data was conducted using a one-way analysis of variance (ANOVA) test with post hoc Tukey correction using OriginPro9 (OriginLab). p<0.05 was taken as significant.
Results
SB treatment does not detrimentally affect signals from fluorescent probes
The success of SB as a useful autofluorescence quencher for imaging purposes hinges on the condition that it does not adversely affect the signals from the fluorescent probes used in the first place. Hence, the duration of SB treatment on the signal strength of commercial Alexa Fluor fluorescent probes was investigated. For comparison purposes, SB-treated sample images were taken at the same exposure time and ISO as the respective controls with no SB treatment. Each set (comprising the experimental groups and the control group) of images was also taken within a single imaging session to avoid variances in lamp strength and fluorophore bleaching. No silk was used in this part of study as any effect on the signal strength of the fluorescent probes is to be accounted for solely by SB treatment. It can be seen in Figure 1ai–av that SB treatment of up to 2 h did not detrimentally affect the signals of the fluorescent probes of DAPI and the immuno-tagged Alexa Fluor 488 nm. The same can be observed for the immuno-tagged Alexa Fluor 594 nm probes as seen in Figure 1b.

Effect of Sudan Black B (SB) treatment duration on fluorescence intensity of secondary antibodies conjugated with
Further to introducing SB at the end of staining protocols as commonly published, the introduction of SB before fluorescence staining was investigated in Figure 2. SB treatment was chosen to be added before the cell membrane permeabilization step to avoid any possible destruction of the intracellular actin due to the ethanol-based SB staining solution. When compared with the control (No SB treatment, Fig. 2c), it can be seen that SB treatment affected the signal strength of the Alexa Fluor 488 nm fluorescent probe attached to the phalloidin toxin (Fig. 2a, b). Introducing SB treatment before permeabilization and fluorescence staining (Fig. 2a) resulted in stronger signals from the probes compared with after permeabilization and fluorescence staining (Fig. 2b). A duration of up to 30 min SB treatment did not further decrease the fluorescent signals significantly as what was already suppressed with a 15 min SB treatment duration in the before permeabilization and fluorescence staining groups (Fig. 2a), whereas the contrary was observed in the after permeabilization and fluorescence staining groups (Fig. 2b, 30 min treatment vs. 15 min treatment). Images in Figure 2ai, 2aiii, 2bi, 2biii, and 2c were taken at the same exposure time and ISO parameters (DAPI: ISO200, 1/50 s; 488 nm: ISO200, 1/2 s) for comparison purposes. It must be noted that the green signals seen in the SB-treated samples (albeit weak) could be made stronger by increasing either the ISO or the exposure time of the microscope digital camera to clearly show the structure of the actin filaments if needed. This is demonstrated in Figure 2aii, 2aiv, 2bii, and 2biv (DAPI: ISO200, 1/50 s; 488 nm: ISO200, 1 s), which shows signals of considerable equal strength as that of the control (Fig. 2c) taken at a shorter exposure time.

Effect of SB treatment duration on phalloidin toxin conjugated Alexa Fluor 488 nm (green) probes, when introduced before permeabilization with Triton-X
SB treatment effectively suppresses endogenous fluorescence signals from silk biomaterials
The suppressing effects of SB treatment on the intrinsic fluorescence signals of silk films and silk electrospun mats were first quantitated by fluorescence spectroscopy. From Figure 3, results indicated that for typical fluorescence-based assessments of silk films and electrospun mats, a red emission wavelength fluorescent dye (e.g., Texas Red, TRITC) would be more preferable, given that the silk materials displayed much lower intrinsic fluorescence values in the red wavelength compared with the green and blue wavelengths. It is, however, still important to improve imaging in the latter two wavelengths, given the need for nucleus counterstaining and colocalization studies. Five minutes of SB treatment significantly brought down the intrinsic fluorescence values of silk films (Fig. 3a) and silk mats (Fig. 3b). Longer SB treatment durations did not brought about further suppression of endogenous fluorescence signals from the silk films (Fig. 3a) but did so with the electrospun mats (Fig. 3b). There were three other significant drops in endogenous fluorescence intensities in the electrospun mats group (Fig. 3b) with respect to no SB treatment—after 30, 60, and 120 min of SB treatment.

Quenching effect of SB treatment on the autofluorescence intensities of silk films over the
SB treatment improves imaging resolution of cells and proteins on silk biomaterials
Cells were then seeded on the silk-based biomaterials and stained fluorescently with and without SB treatment to investigate the use of SB in improving fluorescence microscopy imaging. From Figure 4a and b, it can be observed that SB treatment played a more important role in improving imaging in the electrospun mats rather than the silk films. This is due to the relatively weaker endogenous fluorescence signals exhibited by the silk films compared with the signals from the DAPI and Alexa Fluor 488 nm probes—enabling effective thresholding to be conducted even without SB treatment (Fig. 4a). However, in cases where the endogenous fluorescence signals are relatively strong in relation to the DAPI and Alexa Fluor probes (Fig. 4b, control group), SB treatment effectively improved imaging by suppressing the intrinsic signals coming from the silk material itself and thus enabling effective thresholding to be conducted to eliminate the background signals (Fig. 4b, SB treated groups). For actin staining by phalloidin toxin on electrospun mats (Fig. 4b), introducing SB treatment before permeabilization and fluorescence staining (rather than after) resulted in stronger Alexa Fluor 488 nm and DAPI probe-specific signals, as can be seen in differences shown in the before and after groups of images in Figure 4b. Prolonged SB treatment durations did not necessarily translated to better images, as shown in the 30 min treatment images compared with the 15 min treatment images (Fig. 4b). This is due to the slight decrement in signal strength of the DAPI and Alexa Fluor 488 nm probes due to the SB treatment. These are in line with the results reported in Figure 3, which reported no significant decrement in endogenous intensities between 15 and 30 min of SB treatment duration.

Effect of SB treatment duration and juncture of introduction on microscopy images of adipose-derived mesenchymal stems cells (ASCs) seeded on silk films
Apart from improving imaging of intracellular actin labeled with a fluorescent-labeled phalloidin toxin, SB is also suitable for use in improving imaging analysis of immunostained proteins and DAPI-labeled cells in conjunction with phalloidin (Fig. 5). Fibronectin, an important cell adhesion and migration mediator,27,28 was chosen as the protein of interest to be studied in colocalization with F-actin and the nucleus of cells seeded on the silk electrospun mats. SB treatment enabled a much clearer view of the locations of fibronectin (stained with a primary fibronectin antibody and conjugated with a Alexa Fluor 594 nm secondary antibody), F-actin (stained with a Alexa Fluor 488 nm-conjugated phalloidin toxin), and the cell nucleus (stained with DAPI) compared with the control group with no SB treatment (Fig. 5)—where the nonspecific background signals (especially in the DAPI wavelength) masked the signals from the F-actin and fibronectin. The blue lines observed in the No SB group in Figure 5 (inset) correspond to the electrospun fibers of the electrospun mat, as depicted in an SEM format shown in Figure 6a. SB treatment suppressed the blue wavelength signals, and the resultant composite image of the electrospun fibers of the SB-treated electrospun mat appeared as a purplish color (Fig. 5, 15 min SB inset) instead, aiding in the discretion of protein, actin, nucleus, and mat within a single image. Due to the reported literature on the detrimental effect of SB treatment on immunocytochemistry-based staining, 12 SB treatment was carried out after permeabilization and fluorescence staining.
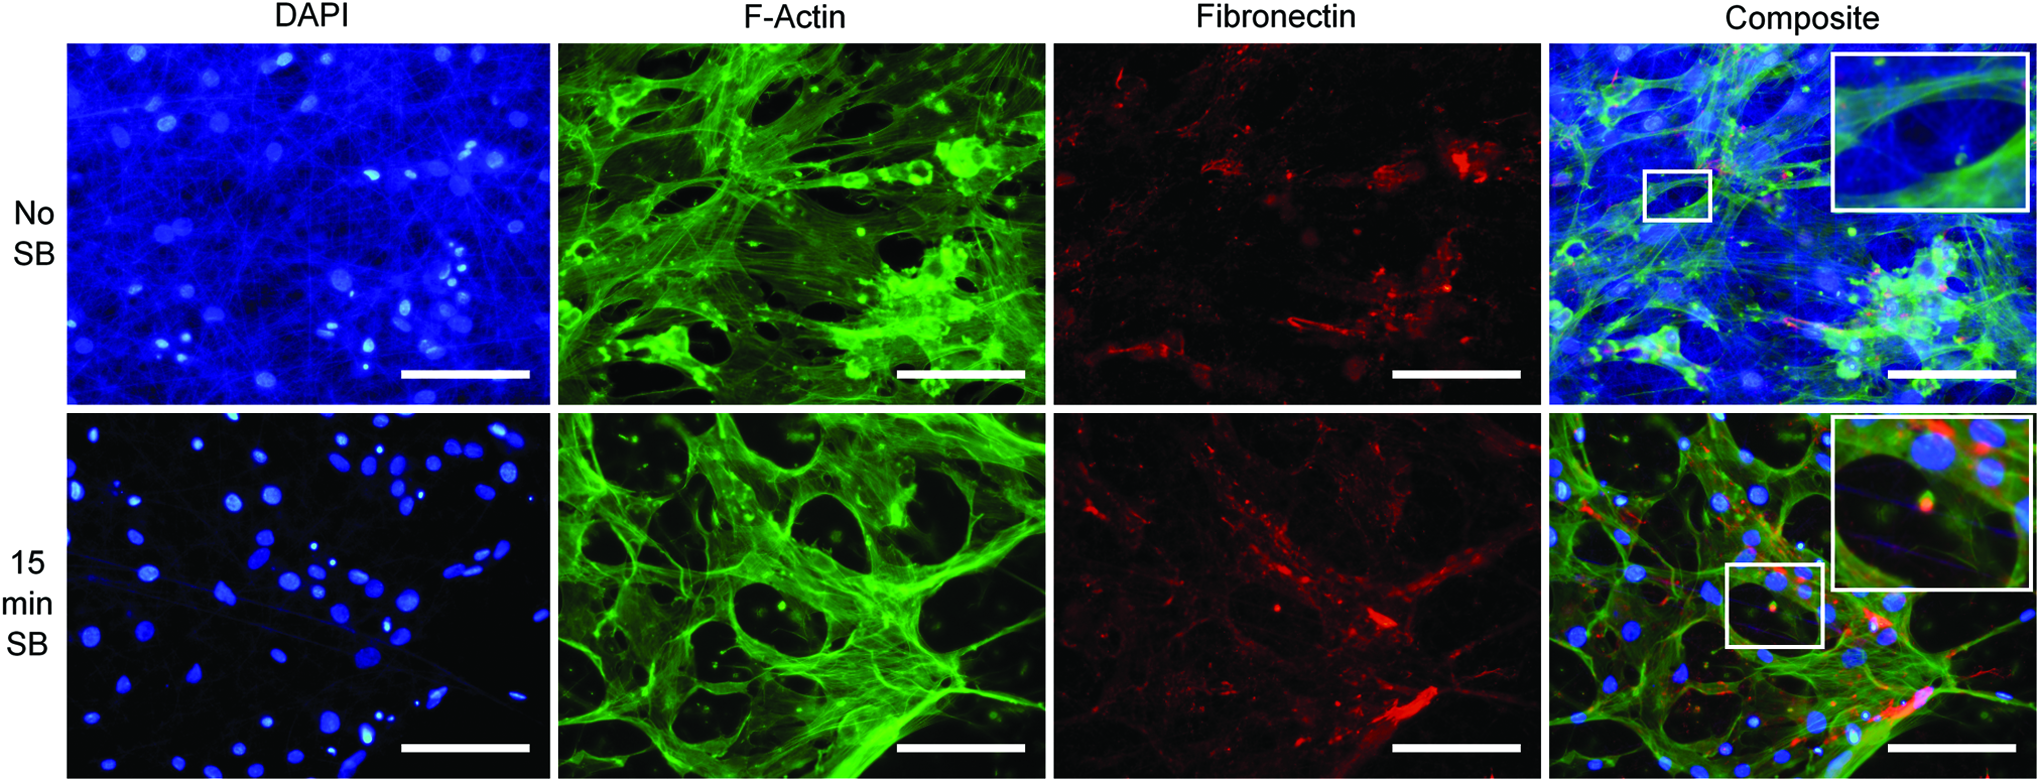
Triple staining fluorescence images of ASCs seeded onto silk electrospun mats with and without SB treatment. F-actin was stained with phalloidin toxin conjugated with Alexa Fluor 488 nm probes, fibronectin was tagged with a primary mouse fibronectin antibody, and conjugated with an anti-mouse Alexa Fluor 594 nm secondary antibody. Cells were counterstained with DAPI. Blue lines in No SB composite image (inset) and purple lines in 15 min SB composite image (inset) correspond to electrospun silk fibers. Scale bars: 100 μm. Color images available online at
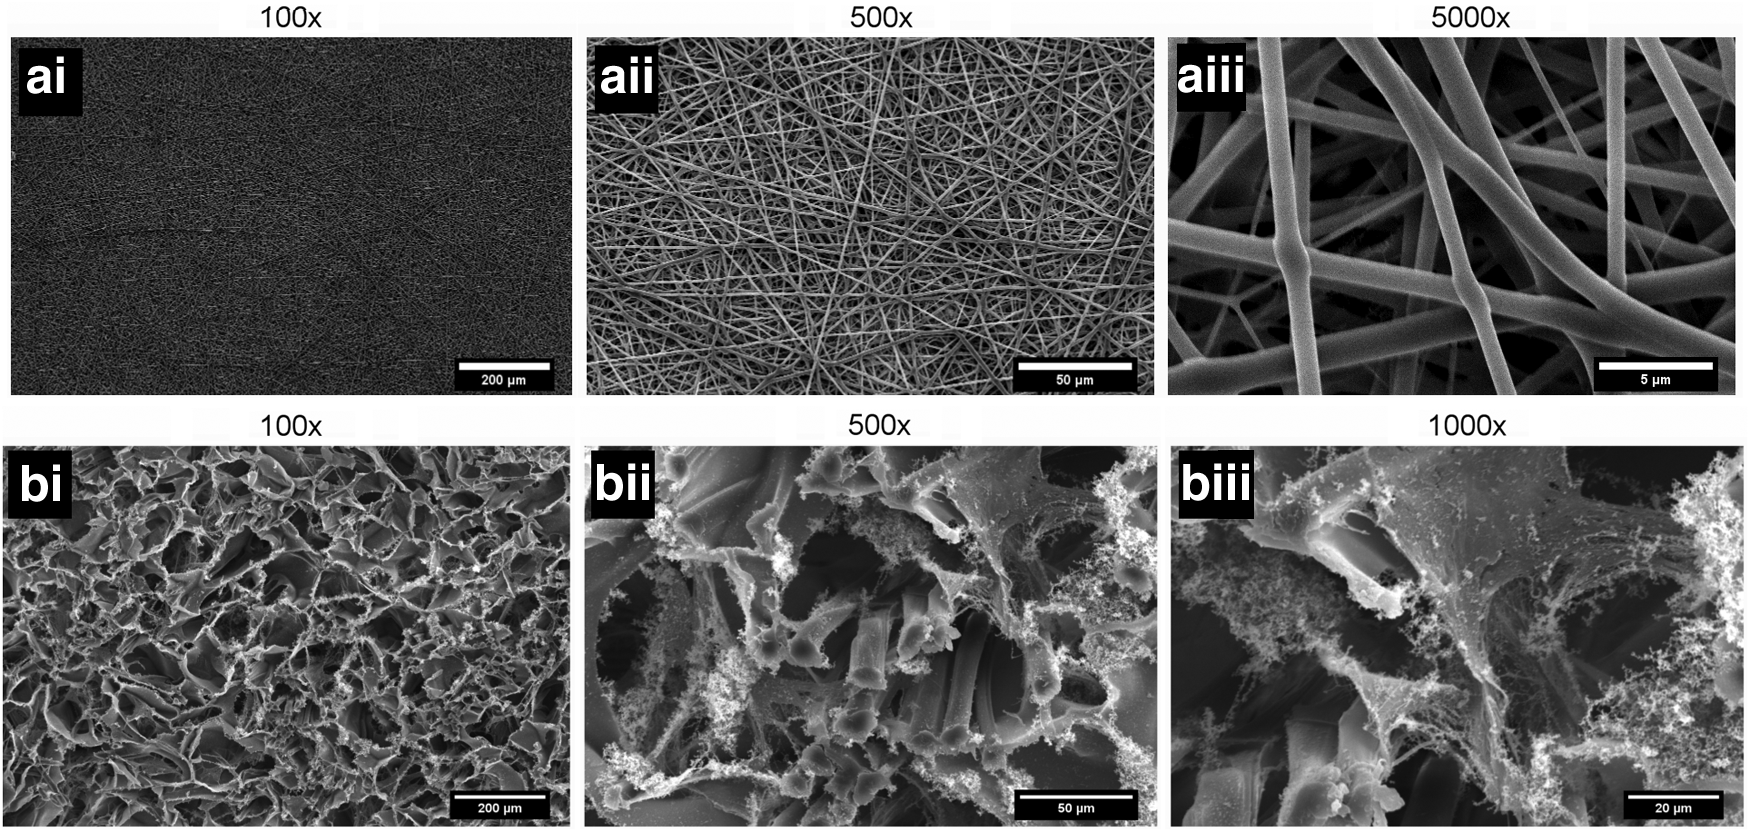
Low- and high-magnification scanning electron microscopy (SEM) images of electrospun silk mats
Figure 6b depicts the ECM deposited by ASCs after 28 days of culture on the sponge–fibers composite scaffolds. It can be observed from the SEM images the close proximity of the ECM deposited with the silk sponge and silk fibers. With this information, sponge–fibers composite scaffolds after 28 days of culture were sectioned and stained for common extracellular proteins, such as collagen type I and fibronectin, to investigate whether SB treatment can help in identification of ECM proteins residing in close proximity with autofluorescing silk scaffolds. Figures 7 and 8 demonstrated that SB treatment indeed helped in suppressing the endogenous signals from silk that are capable of masking the signals from fluorescently tagged proteins, which would have gone unidentified (no SB groups in Figs. 7 and 8) due to its close proximity with the silk scaffolds. This is even true with proteins tagged with a red wavelength fluorescent probe (Figs. 7b and 8b), due to the strong signals from the blue wavelength in general, which masked the presence of cells and the proteins located on the silk sponges (inset images of Figs. 7b and 8b). For these cases, SB treatment played an important role by suppressing nonspecific signals in the blue wavelength, thereby creating a purplish hue indicative of the silk scaffolds and therefore highlighting the fluorescently red proteins. Interestingly, in the green wavelength (Figs. 7a and 8a), SB treatment suppressed the green endogenous signals from the silk scaffolds to an extent by which silk appears in a golden hue relative to the green signals from the immunofluorescently tagged proteins, thereby helping to distinguish clearly the locations of the proteins (inset images of Figs. 7a and 8a).
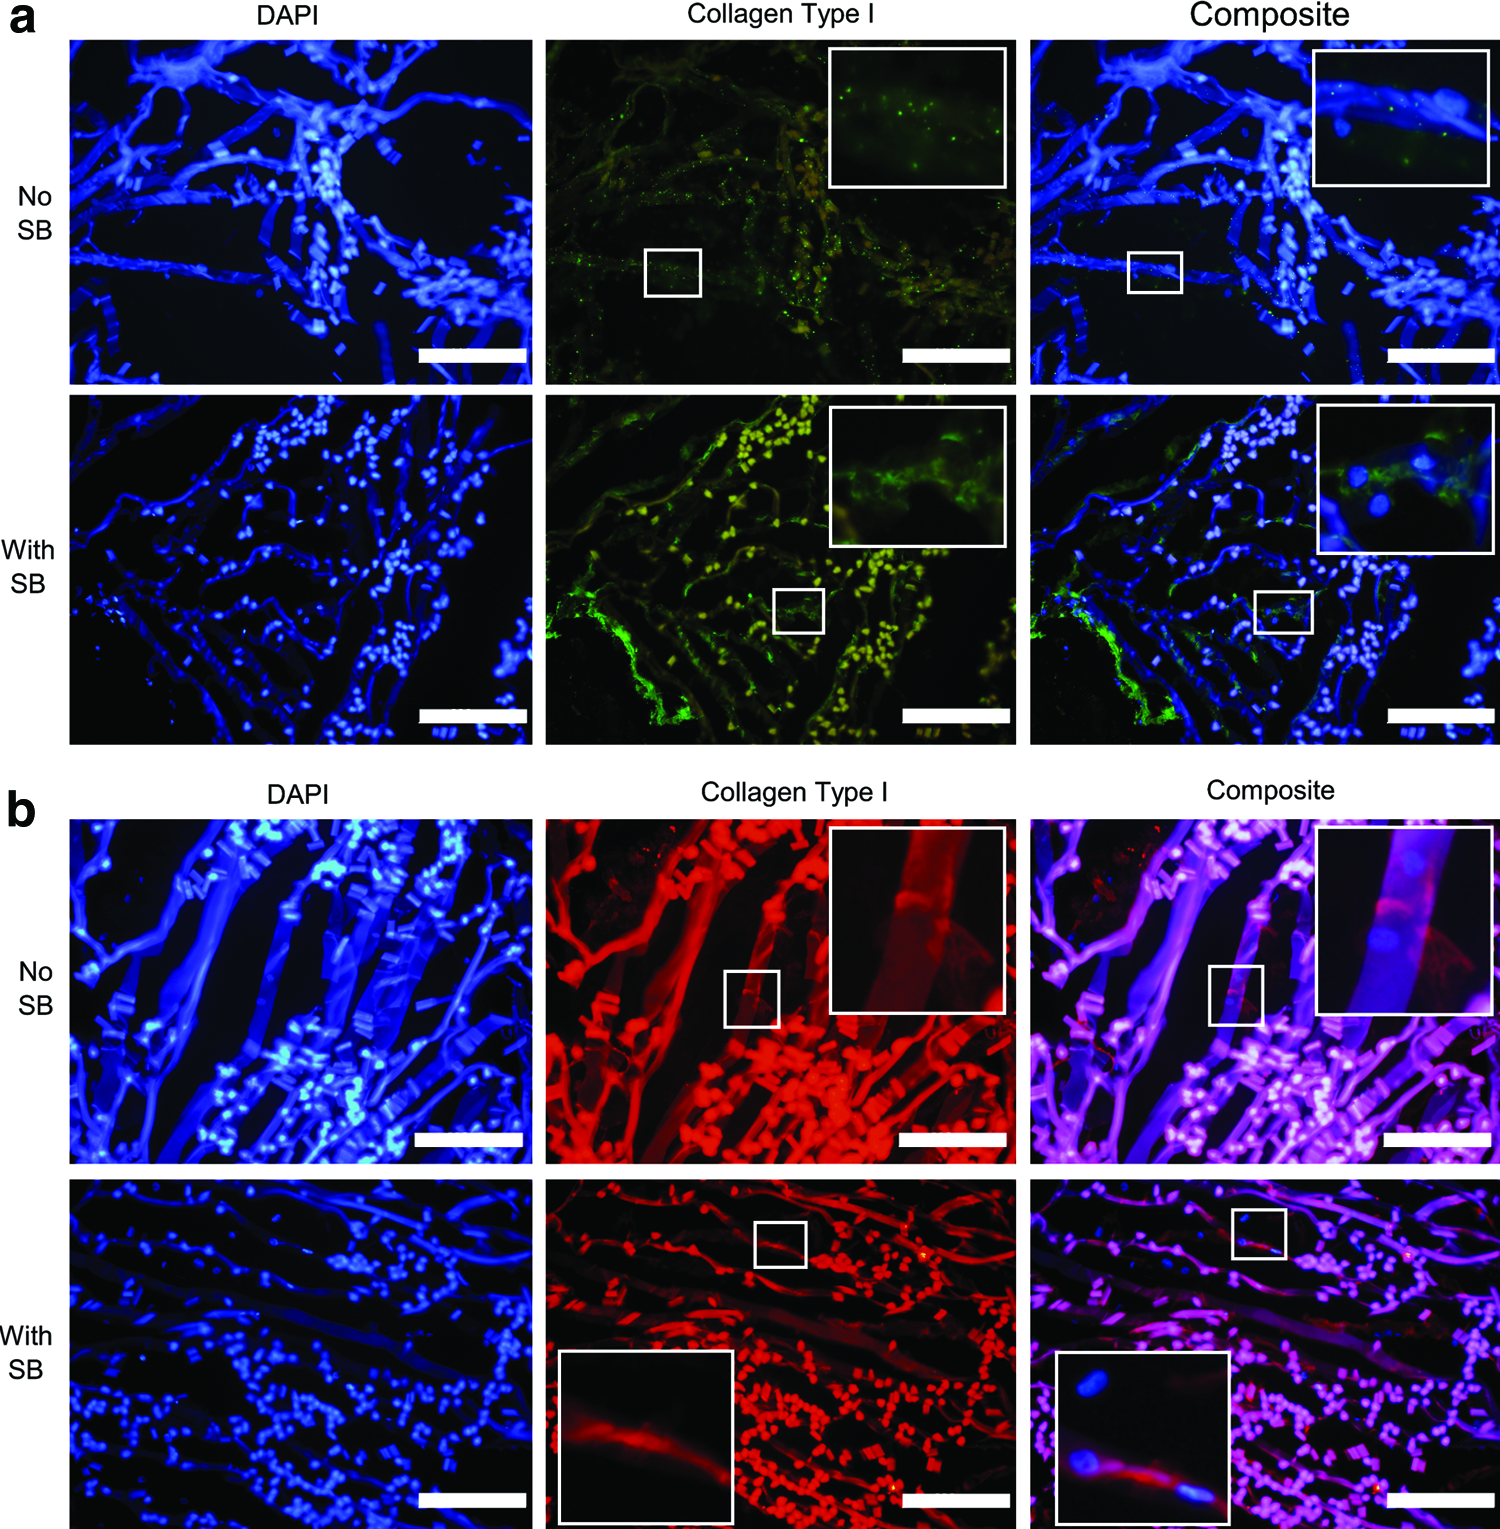
Immunostained fluorescence images of cell-seeded sponge–fiber composite scaffolds cryosectioned at 20 μm per section and tagged for collagen type I and secondarily conjugated to Alexa Fluor 488 nm
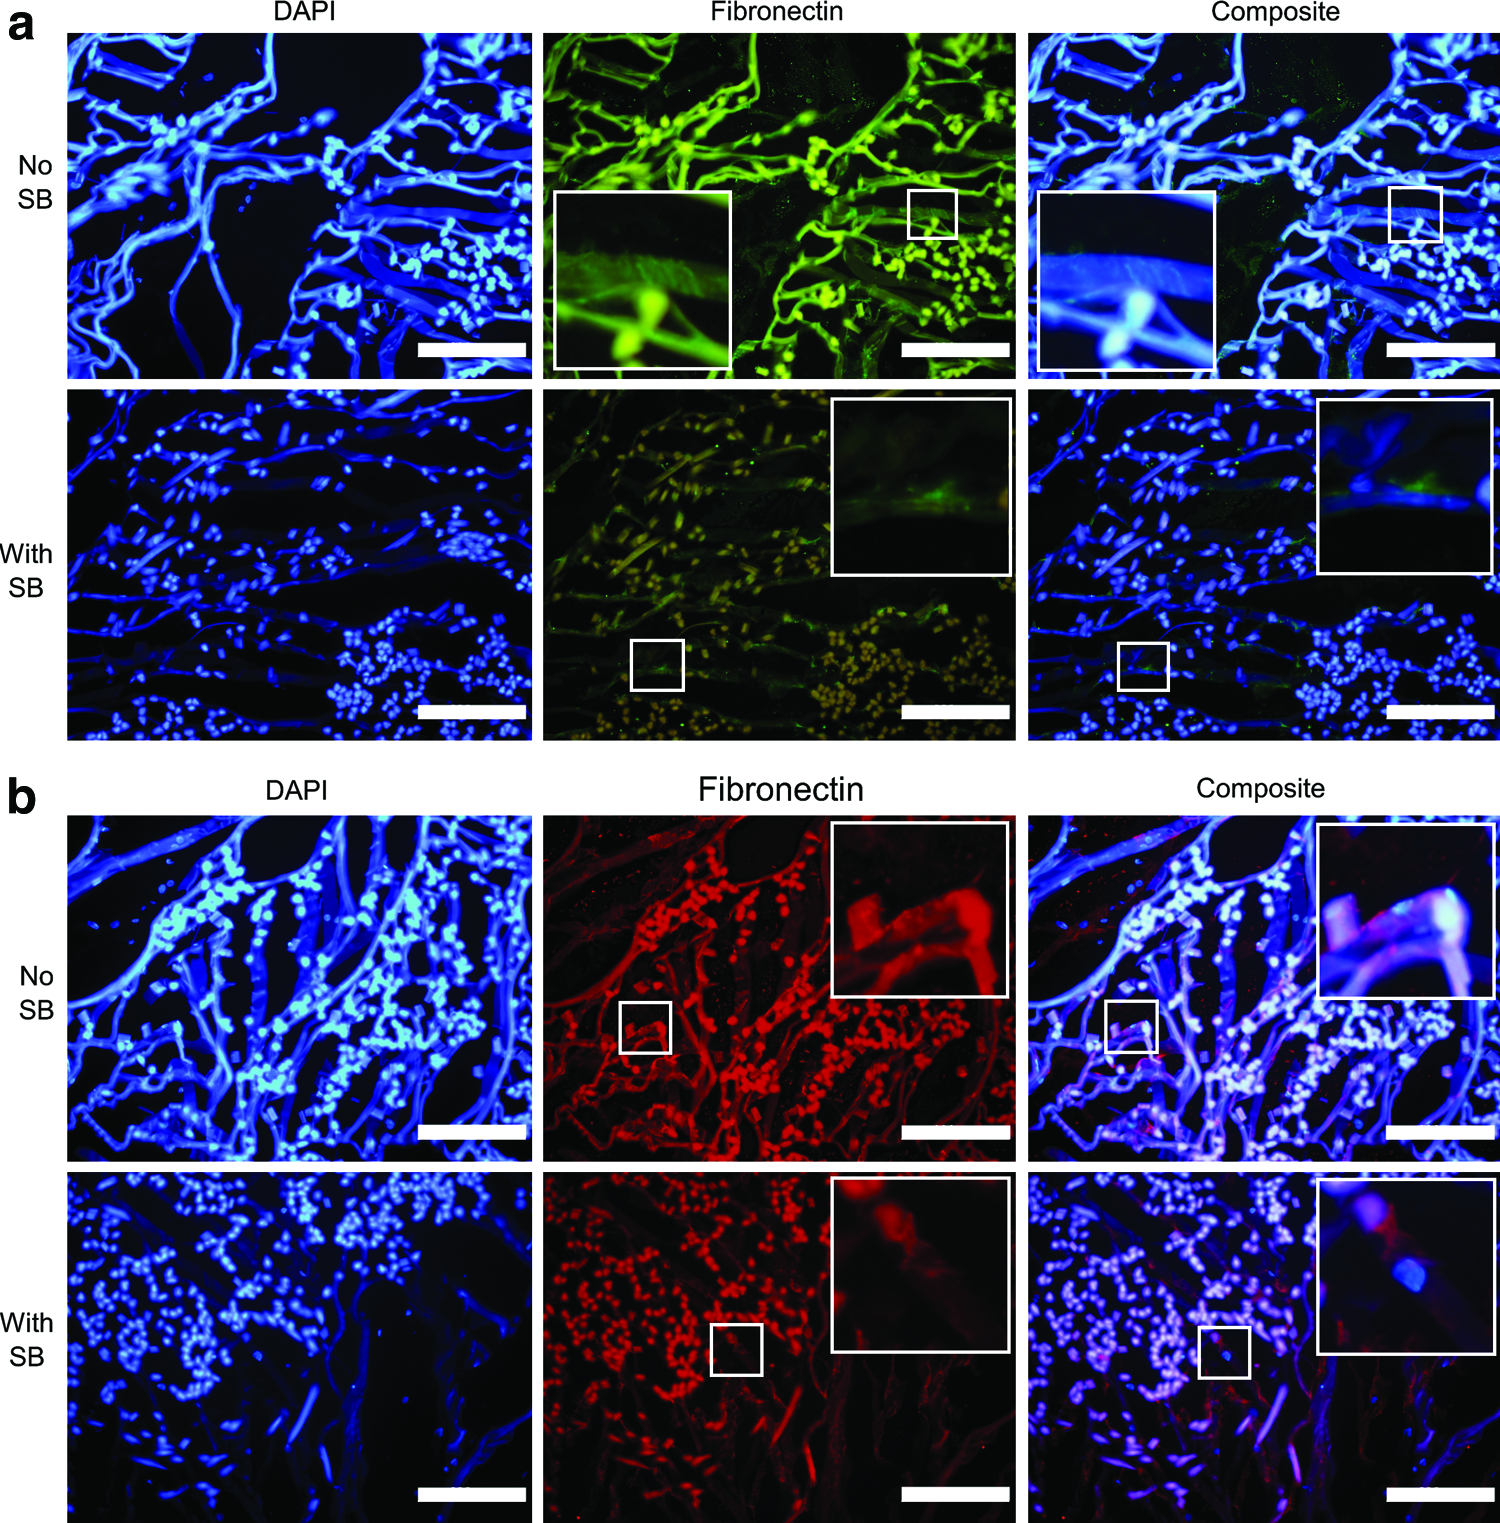
Immunostained fluorescence images of cell-seeded sponge–fiber composite scaffolds cryosectioned at 20 μm per section and tagged for fibronectin and secondarily conjugated to Alexa Fluor 488 nm
Discussion
In one of the first articles that described the use of SB to quench autofluorescence signals from tissues sections, Schnell et al. carried out a dose-dependent study of SB concentration on the detrimental effect that SB might have on immunofluorescent labelling. 12 Although Jaafar et al. 17 mentioned the need for adjustment of treatment duration depending on the staining specimen thickness, no study has conducted a time-dependent investigation on the resultant effects of SB treatment on the signals from fluorescent probes. Hence, part one of this study was dedicated to investigate the duration of SB treatment on the effects of the signal strengths from fluorescent probes. In this study, for the purpose of such an assessment (Figs. 1 and 2), samples were prepared to not contain any autofluorescing materials present to avoid confounding effects. This is a further improvement to the dose-dependent study carried out by Schnell et al. in 1999, where samples used to carry out the dose-dependent effects on immunofluorescent labels were spinal cord sections, which would contain to some degree some amount of autofluorescence signals. 12
Despite the presence of several literature on the quenching phenomena of SB for immunohistochemistry, the use of SB treatment to improve actin visualization has only been described in one study by Jaafar et al. 17 using a similar phalloidin approach. In that study, 17 SB treatment was introduced at the last step of staining protocol as per the methodology described in the other published literature on the use of SB as an autofluorescence quencher. In this study, we have attempted to introduce SB before the fluorescence staining for actin staining and had compared it with results obtained by introducing SB after the fluorescence staining steps (Figs. 2 and 4). As one of the pioneers using SB as a quencher dye, Schnell et al. anecdotally mentioned in their article 12 that SB added before immunofluorescence staining resulted in an unacceptably reduction of immunocytochemical labeling of monkey tissues. This might account for the reason why SB treatment was always introduced (in subsequent studies published in the literature) as the last step after fluorescence staining is completed. However, results from Figures 2 and 4 showed that for a direct fluorescence staining protocol (e.g., phalloidin toxin) where immunocytochemical labeling is not needed, SB treatment can be introduced before the fluorescence staining step to avoid suppressing the signals from the desired fluorescent probes instead, thereby giving slightly better images as can be seen in Figure 2a (vs. Fig. 2b) and Figure 4b (“before” vs. “after” groups).
Silk is a highly hierarchical protein consisting of several forms of secondary structures. They include (1) random coil structure, (2) α-helical structure, (3) silk I structure (a pre-crystallization glandular state), and (4) silk II (β-sheet) structure.2,10 The β-sheet structure is highly insoluble and happens in the crystalline region, whereas the first three kinds of structures occur in the solution state and correspond to the noncrystalline region of the silk protein. 10 As silk fibroin (from the solution state) undergoes conformational changes to become gels (semisolid state) and sponges (solid state), the proportion of the secondary structures changes such that there is a general increment in the β-sheet proportion. 10 The β-sheets can further cross-link, thereby creating a highly ordered structure, which is insoluble, and also changing the spatial locations of the Tyr and Trp residues. 10 For example, using a combination of fluorescence spectroscopy and circular dichroism spectroscopy, Yang et al. found that Trp residues, in the unfolded random coil form of the silk fibroin, are mostly located in a heterogeneous manner on the surface of the protein. The Trp residues then change their relative locations to a more homogeneous manner as the silk fibroin undergoes conformational changes from a random coil structure to a β-sheet structure. 8 The work by Georgakoudi et al. attributed the fluorescence spectral properties of silk to three components, namely Try and Trp residues and the degree of cross-linking.
The studies by Yang et al. 8 and Georgakoudi et al. 10 demonstrated that the intrinsic spectral profiles of different forms of silk are not the same and provided sufficient evidence for this study to hypothesize a difference in SB effect between different forms of silk biomaterials. Hence, to account for any possible differences in SB quenching, a range of commonly reported forms of silk biomaterials were used in this study for investigation—from highly hierarchical fibers to sponges, films, and electrospun nano mats reconstituted from extracted silk fibroin solutions using different methodology approaches. This hypothesis was validated by the quantitative differences in SB effect response showed between the film (Fig. 3a) and electrospun mat (Fig. 3b) groups, and the resultant qualitative differences are observed between Figure 4a and b.
Autofluorescence is a ubiquitous phenomenon in histochemistry. Naturally occurring autofluorescence has been widely described in the literature and was the reason that led to the discovery of SB to be an effective fluorescence quencher.12–16 Such autofluorescence in tissue sections (mostly from the kidneys, brain, and livers) have been mainly attributed to the presence of endogenous fluorophores, such as flavins and lipofuscins.12,15 Similarly, synthetic polymers have also been mentioned in the literature to exhibit autofluorescence.17,29–32 For some of these polymers with no aromatic rings in their chemical structures, it has been postulated that light scattering from the polymers might be the cause for the reflected light exhibited during fluorescence microscopy, which results in similar inhibitory effects as autofluorescence signals.17,33 In the case of Jaafar et al., 17 it was suggested that the quenching effect of SB on some of the synthetic polymers tested in their study might be attributed to SB being able to absorb large amounts of light (thereby absorbing photons scattered and emitted from the polymers itself) and reducing the amount of light scattering by having SB binding to and smoothing the polymers' surfaces to change their refraction indexes. It can be postulated that a combination of several reasons, including those described by Jaafar et al., 17 and a possible chemical interaction between SB and the aromatic Trp and Tyr residues from the silk fibroin sequences could be possible explanations for the modulatory effects of SB on silk-based biomaterials. Although not within the scope of this article, and results shown are not entirely corroborative, the differences in the effects of SB between silk materials of different forms (e.g., films vs. electrospun mats as shown in Figs. 3 and 4; stronger autofluorescence in yarns vs. sponges as observed in Figs. 7 and 8) suggest that the structure of the silk protein plays a pivotal influence on the resultant quenching effects of SB.
Compared with the immunologically inert silk fibroin core, sericin has been largely associated with eliciting immune responses in vivo.23,34,35 Hence, sericin is routinely removed from the silk fibroin before further processing to make biomaterials. In line with common practice and for relevance of applicability, silk biomaterials used in this study were all degummed to remove sericin. However, it must be noted that sericin, in recent years, have been found to be a good biomaterial, especially in the area of wound healing.36,37 Further work can be done with regard to SB treatment on sericin-based biomaterials. Silk used as biomaterials can be broadly divided into two types—mulberry and non-mulberry. Domesticated B. mori silk used in this study is of the mulberry type and is more extensively established as a biomaterial. However, the use of non-mulberry silk as a biomaterial has been increasingly reported in the literature.38,39 Given the differences in protein sequences and structures between both types, 40 further studies can be carried out to explore the effects of SB treatment on non-mulberry silk-based biomaterials as well.
Conclusion
This study has demonstrated SB to be a simple and fast method to inhibit the autofluorescence signals of silk under commonly used excitation and emission wavelengths in fluorescence-based imaging. In a duration-dependent manner, we have shown that SB treatment does not adversely affect signals of fluorescent probes, while simultaneously is being able to successfully quench the endogenous signals from silk-based biomaterials. Such a synergistic response effectively improves fluorescence imaging analysis of cells and proteins of interests residing within and on silk biomaterials. To the best of our knowledge, this is also the first time autofluorescence modulation has been reported in the literature in silk-based biomaterials in a bid to improve fluorescence imaging analysis. Given the widespread applications of silk as a tissue engineering material, and the potential of this technique being applied to other autofluorescing biomaterials (both natural and synthetic), we have demonstrated SB treatment to be a potential critical enabler in the field of tissue engineering.
Footnotes
Acknowledgments
This research was supported, in part, by the Biomedical Research Council and the Singapore National Research Foundation under its Cooperative Basic Research Grant and administered by the Singapore Ministry of Health's National Medical Research Council.
Disclosure Statement
No competing financial interests exist.