
Abstract
The effects of estrogen deficiency on bone characteristics are site-dependent, with the most commonly studied sites being appendicular long bones (proximal femur and tibia) and axial bones (vertebra). The effect on the maxillary and mandibular bones is still inconsistent and requires further investigation. This study was designed to evaluate bone quality in the posterior maxilla of ovariectomized rats to validate this site as an appropriate model to study the effect of osteoporotic changes. Forty-eight 3-month-old female Sprague-Dawley rats were randomly divided into two groups: an ovariectomized (OVX) group (n=24) and Sham-operated (SHAM) group (n=24). Six rats were randomly sacrificed from both groups at time points 8, 12, 16, and 20 weeks. The samples from tibia and maxilla were collected for micro computed tomography (μCT) and histological analysis. For the maxilla, the volume of interest area focused on the furcation areas of the first and second molar. Trabecular bone volume fraction (BV/TV, %), trabecular thickness (Tb.Th.), trabecular number (Tb.N.), trabecular separation (Tb.Sp.), and connectivity density (Conn.Dens) were analyzed after Micro CT scanning. At 8 weeks the indices BV/TV, Tb.Sp., Tb.N., and Conn.Dens showed significant differences (p<0.05) between the OVX and SHAM groups in the tibia. Compared with the tibia, the maxilla developed osteoporosis at a later stage, with significant changes in maxillary bone density only occurring after 12 weeks. Compared with the SHAM group, both the first and second molars of the OVX group showed significantly decreased BV/TV values from 12 weeks, and these changes were sustained through 16 and 20 weeks. For Tb.Sp., there were significant increases in bone values for the OVX group compared with the SHAM group at 12, 16, and 20 weeks. Histological changes were highly consistent with Micro CT results. This study established a method to quantify the changes of intra-radicular alveolar bone in the posterior maxilla in an accepted rat osteoporosis model. The degree of the osteoporotic changes to trabecular bone architecture is site-dependent and at least 3 months are required for the osteoporotic effects to be apparent in the posterior maxilla following rat OVX.
Background
O
The healing of fractures of long and axial bones has been shown to be negatively affected by osteoporosis. 4 In relation to oro-dental conditions, clinical studies have revealed positive correlations between periodontitis and estrogen deficiency,7–10 tooth loss, and osteoporosis,8,11,12 delayed alveolar bone wound healing and increased severity of residual alveolar ridge resorption caused by estrogen deficiency.13,14
The effects of estrogen deficiency on bone parameters such as size, mass, and density are site-dependent. 15 The most widely investigated sites for osteoporotic bone loss are appendicular long bones (proximal femur and tibia) and axial bones (vertebra), and the changes reflected in bone morphometric parameters are well characterized in these areas.15,16 It appears that there is an inherent genetic difference between bones of cranial and noncranial origin, 17 which is not surprising given the differences in embryological origin and mechanisms of ossification. According to Ishihara et al., bone loss following ovariectomy predominantly occurs in those areas formed by endochondral ossification, such as the distal femur, rather than in areas formed by intramembranous ossification, such as the maxilla. 18 Mavropoulos et al. also reported a reduced response in the mandibular to estrogen deficiency in rats, when compared with other skeletal sites, 19 and other animal studies have produced similar results.20,21 However, some animal studies have reported positive correlation of osteoporosis and alveolar bone changes, and periodontal bone loss.7,9,10,14 Therefore, there is a clear need to clarify the effect of estrogen deficiency on maxillary and mandibular alveolar bones. Given trabecular bone is believed to be more susceptible to be affected by estrogen deficiency than cortical bone, 22 maxillary bone, especially the porous, posterior maxillary region may be regarded as a more sensitive location for estrogen deficiency, compared with mandibular bone. 23 However, most researchers have used the rat mandible rather than the maxilla as the site of choice to study estrogen-related bone loss following ovariectomy.19,20,24–26 This may be due to the simpler geometry of the mandible, which makes it easier to determine bone volume when compared with the maxilla, which is characterized by irregular, more complicated roots and the presence of the maxillary sinus.
Traditionally, the main methods used for analyzing bone characteristics are histomorphometry and/or two-dimensional (2D) radiography (including dual-energy X-ray absorptiometry [DEXA]). DEXA mainly focuses on bone mineral density (BMD) and is not an optimal tool when used in the presence of excess adipose tissue 27 and is also a challenge with growing animals. 6 On the other hand, histological assessment has the inherent limitation of only reflecting an isolated site, rather than whole bone changes. 6 Three-dimensional (3D) micro computed tomography (μCT) analysis has been used to overcome these limitations to obtain conclusive research outcomes.1,28–30 Although 3D Micro CT has been used by a few researchers to analyze mandibular bone,31,32 it has not been used for analysis of maxillary bone changes due to the lack of method to extract the volume of interest (VOI) areas in maxilla. Therefore, this study was undertaken to compare maxillary and tibial bone morphometric parameter changes resulting from estrogen deficiency induced by ovariectomy. Micro CT and histological analysis were used to evaluate bone changes at different time points over a period from 8 to 20 weeks postovariectomy.
Materials and Methods
Animals
Forty-eight 3-month-old female Sprague-Dawley rats, weighing 232–267 g, were obtained from an animal resource center (SLAC Laboratory Animal Co. Ltd., Shanghai, China). The animals were randomly divided into two groups: an ovariectomized (OVX) group (n=24) and Sham-operated (SHAM) group (n=24). The ovariectomy operation was performed according to methods described in our previous study. 33 Briefly, the ovaries of the rats were exteriorized safely after ligature was placed at the end of fallopian tube; for the SHAM group, the same size of fats tissue near the ovaries was removed. The muscle and skin were sutured in layers. Six rats per group at different time points were sacrificed at 8, 12, 16, and 20 weeks, after ovariectomy or sham operation. One tibia and one maxilla from each animal were randomly selected for Micro CT analyses, while the contralateral bones were prepared for histological analysis. All animal research protocols were approved by the Animal Care and Use Committee of Fujian Medical University and are similar to our previous studies (Fig. 1). 33
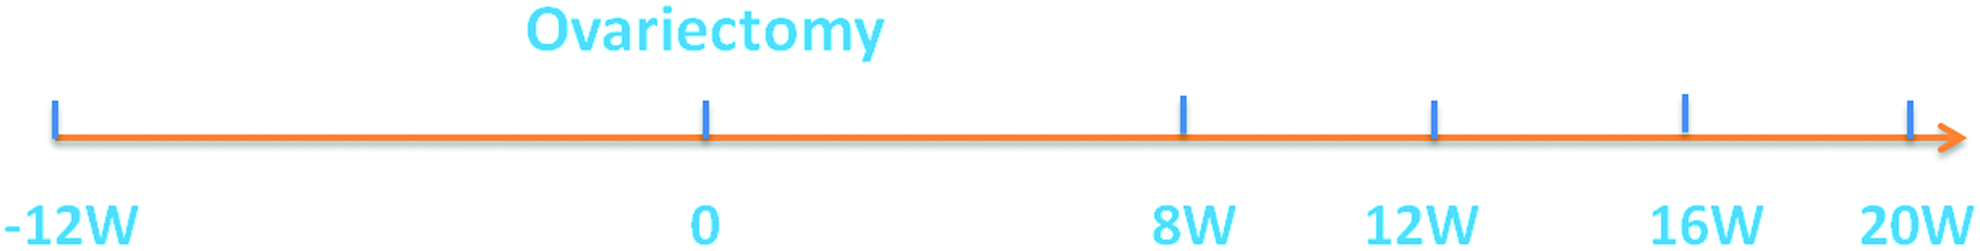
The research timeline. Animals were subjected to ovariectomy or sham surgery at the age of 12 weeks and sacrificed at 8, 12, 16, or 20 weeks after surgery. Color images available online at
Micro CT evaluation
Bone histomorphometric parameters and the microarchitectural properties of maxilla and tibia were evaluated using a micro-CT system (μCT 40; Scanco Medical AG, Bassersdorf, Switzerland). The bones were scanned at an energy of 70 kV and intensity of 114 μA, with 300 ms integration time, resulting in 16-μm isotropic voxel size. For the scanned tibia, the VOI for evaluation of bone morphometric parameters was chosen over 200 slices, starting 25 slices distal from the growth plate. The trabecular bone compartment was determined using a semi-automatic algorithm.
For the posterior maxilla, the scanned area of interest included three molars. The VOI region focused on the furcation areas of the first molar and second molars. Initially, a circle with 40 pixel (0.64 mm) diameter was selected at the most coronal aspect of the root furcation, and after a further 40 slices apically a circle was selected with 60 pixel (0.96 mm) diameter. A third circle with the same diameter was then selected after another 60 slices and eventually, the VOI was defined by morphing across the slices between these three circles, forming an irregular, conical cylinder. Trabecular bone volume fraction (BV/TV, %), trabecular thicknesses (Tb.Th.), trabecular number (Tb.N.), trabecular separation (Tb.Sp.), and connectivity density (Conn.Dens) were determined for VOI using the micro CT evaluation software SCANCO (Scanco Medical AG, Bassersdorf, Switzerland) provided the micro-CT system (Fig. 2). 34

Histology
Samples for histological evaluation were fixed after sacrifice in 70% alcohol. Further processing of the samples was carried out according to routine methods. Briefly, the samples were dehydrated in a series of graded alcohol and then embedded in methylmethacrylate (MMA) (Merck, Darmstadt, Germany) according to the manufacturer's instructions. Slices of 10–15 μm thickness were obtained using an Exakt cutting-grinding system (EXAKT Apparatebau, Norderstedt, Germany). Sections were stained using toluidine blue or Methylene Blue–Alizarin Red and scanned using Aperio microscope (Aperio, Vista, CA). Trabecular bone volume fraction (BV/TV, %) at 12 weeks was analyzed by the system's image analysis software (Aperio).
Statistical analysis
Data are expressed as means±standard deviations. One-way ANOVA was used to compare body weights and identify significant differences between tibia and maxilla at different time points in the OVX and SHAM groups. p-Values of <0.05 were considered significant.
Results
Body weight
Generally, ovariectomy resulted in weight gain. At baseline, there were no differences in weight between the two experimental groups. However, after ovariectomy, the body weights changed significantly. The weight of the animals from the OVX group was higher compared with the SHAM group at all evaluated time points (8, 12, 16, and 20 weeks respectively) (Fig. 3).
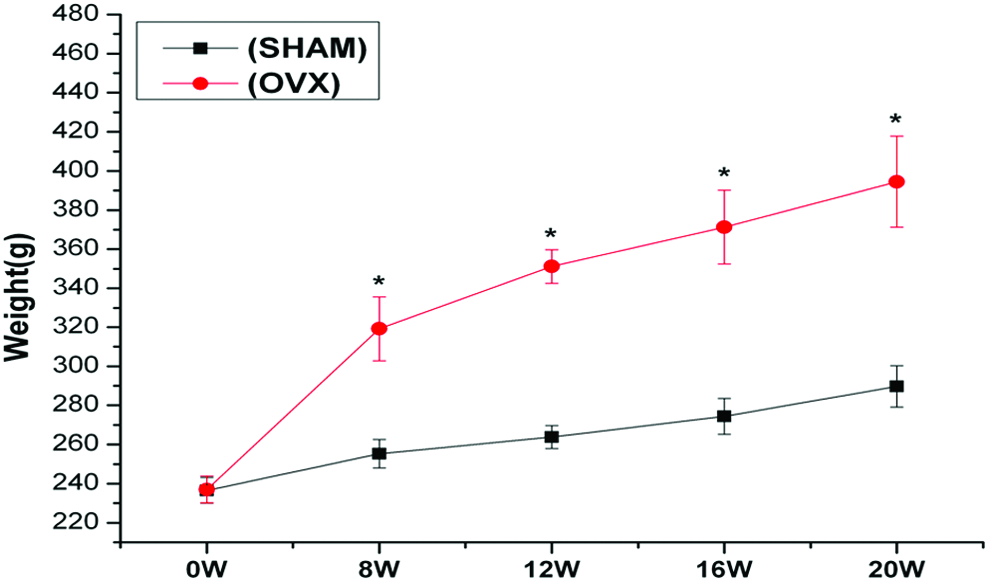
Analysis of body weights showed significantly higher body weights in ovariectomized (OVX) treated rats from 8 weeks throughout entire experimentation period. *p<0.05. SHAM, sham operated. Color images available online at
Micro CT assessment
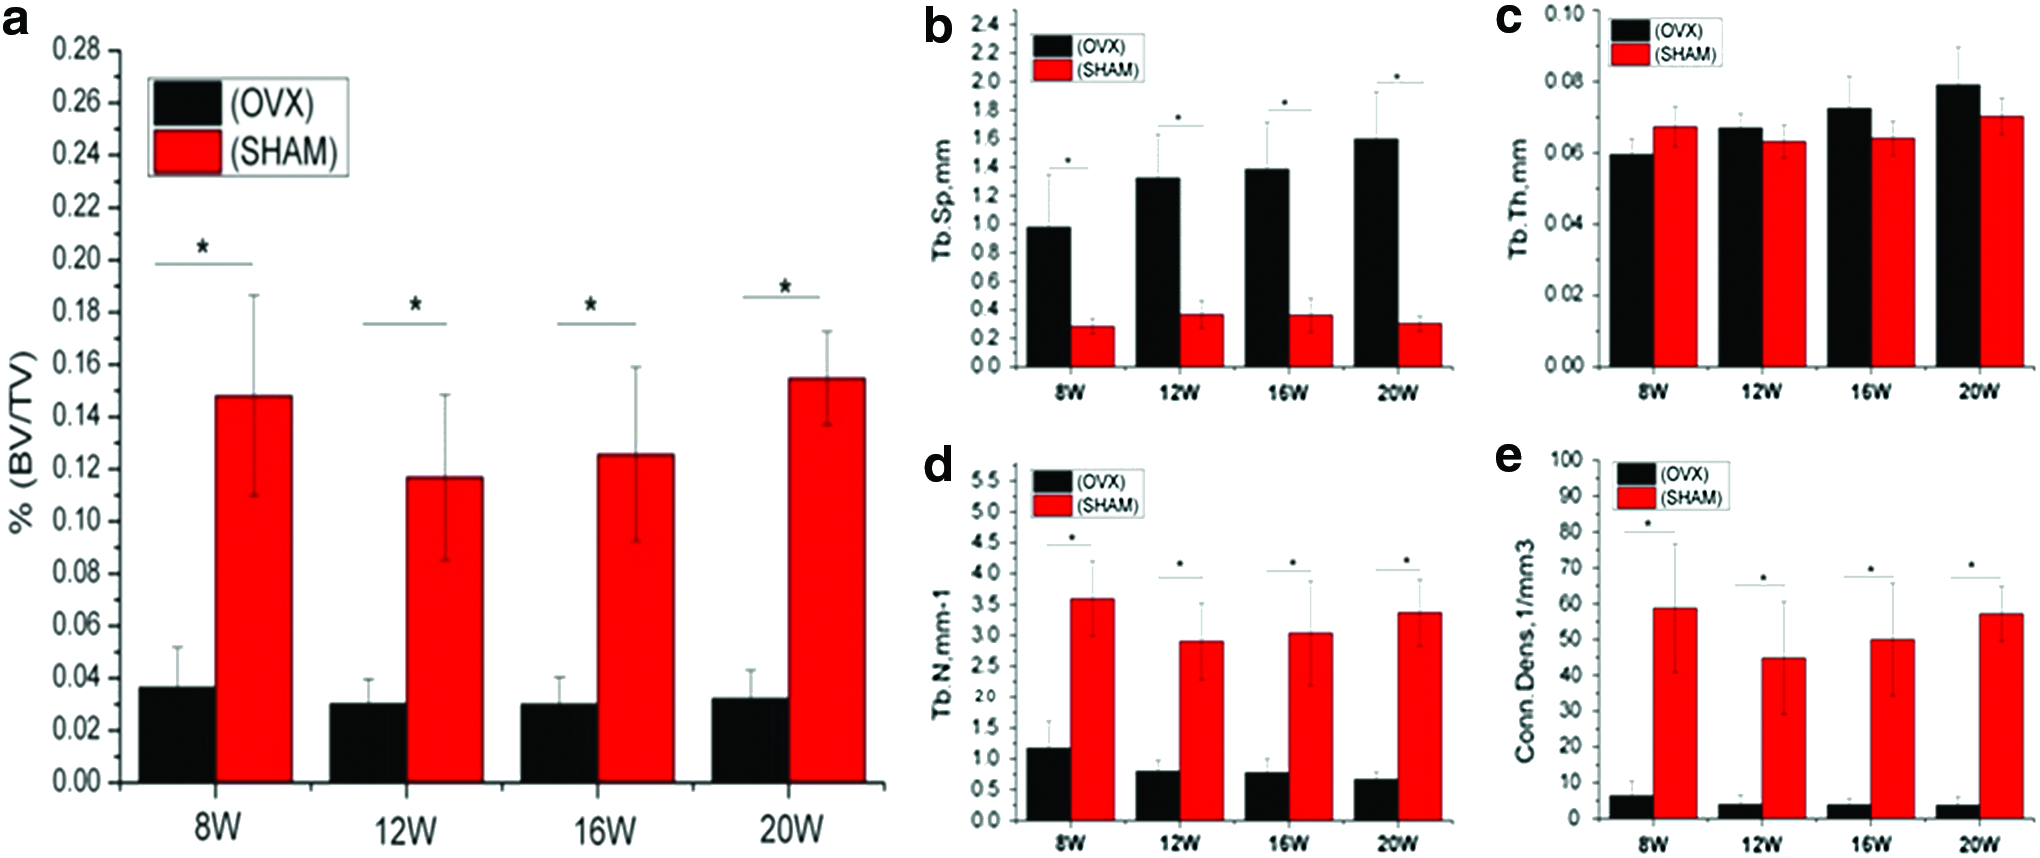
For the tibia, OVX rats had reduced quality trabecular bone structures compared with SHAM-operated rats at both 8 and 12 weeks (Fig. 4a, b). After 8 weeks, BV/TV (Fig. 5a) was significantly decreased compared with the SHAM group. The same trends were seen for Tb.N. (Fig. 5d) and Conn.Dens (Fig. 5e), as trabecular bone of the OVX group was significantly declined, compared with that of the SHAM group. For Tb.Sp. (Fig. 5b), the OVX group achieved significantly higher values than the SHAM group, while no differences were found between the two groups for Tb.Th. (Fig. 5c).

Three-dimensional micro CT
Micro CT results of tibia showed significant differences from 8 weeks for the parameters trabecular bone volume fraction (BV/TV)
In the maxilla, significant changes in bone density only occurred after 12 weeks, in contrast to the tibia where these changes were already evident at 8 weeks. The 3D images of the first (Fig. 6a, b) and second (Fig. 6c, d) molar furcation areas at 12 weeks showed more porous structure in the OVX group (Fig. 6a, c) compared with the SHAM group (Fig. 6b, d). Compared with the SHAM group, both the first and second molars of the OVX group showed significantly decreased BV/TV (Figs. 7a and 8a) from 12 weeks, and these changes were sustained through 16 and 20 weeks. For Tb.Sp. (Figs. 7b and 8b), the ovarietomy caused significant increases in bone morphometric values for the OVX group compared with the SHAM group at 12, 16, and 20 weeks. For the other parameters (Tb.Th., Tb.N., and Conn.Dens), the changes were not always consistent between the two molars at the same time points. For Tb.Th., at the first molar, the ovariectomy caused statistically significant reductions of trabecular thickness at 12, 16, and 20 weeks (Fig. 7c), but for the second molar, significant changes were only observed at 16 and 20 weeks (Fig. 8c). For Tb.N., there were significant differences at 12 and 16 weeks in the first molar (Fig. 7d), but only at 12 and 20 weeks for the second molar (Fig. 8d). For Conn.Dens, the findings were more variable. At the first molar site, the OVX group had a higher value compared with the SHAM group at weeks 8 and 16 (Fig. 7e). These inconsistent changes were also measured at the second molar site, where OVX group had a statistically significant increase in Conn.Dens at week 16 and 20 (Fig. 8e). The detailed evaluation of micro CT results was in Supplementary Tables S1–S3 (Supplementary Data are available online at
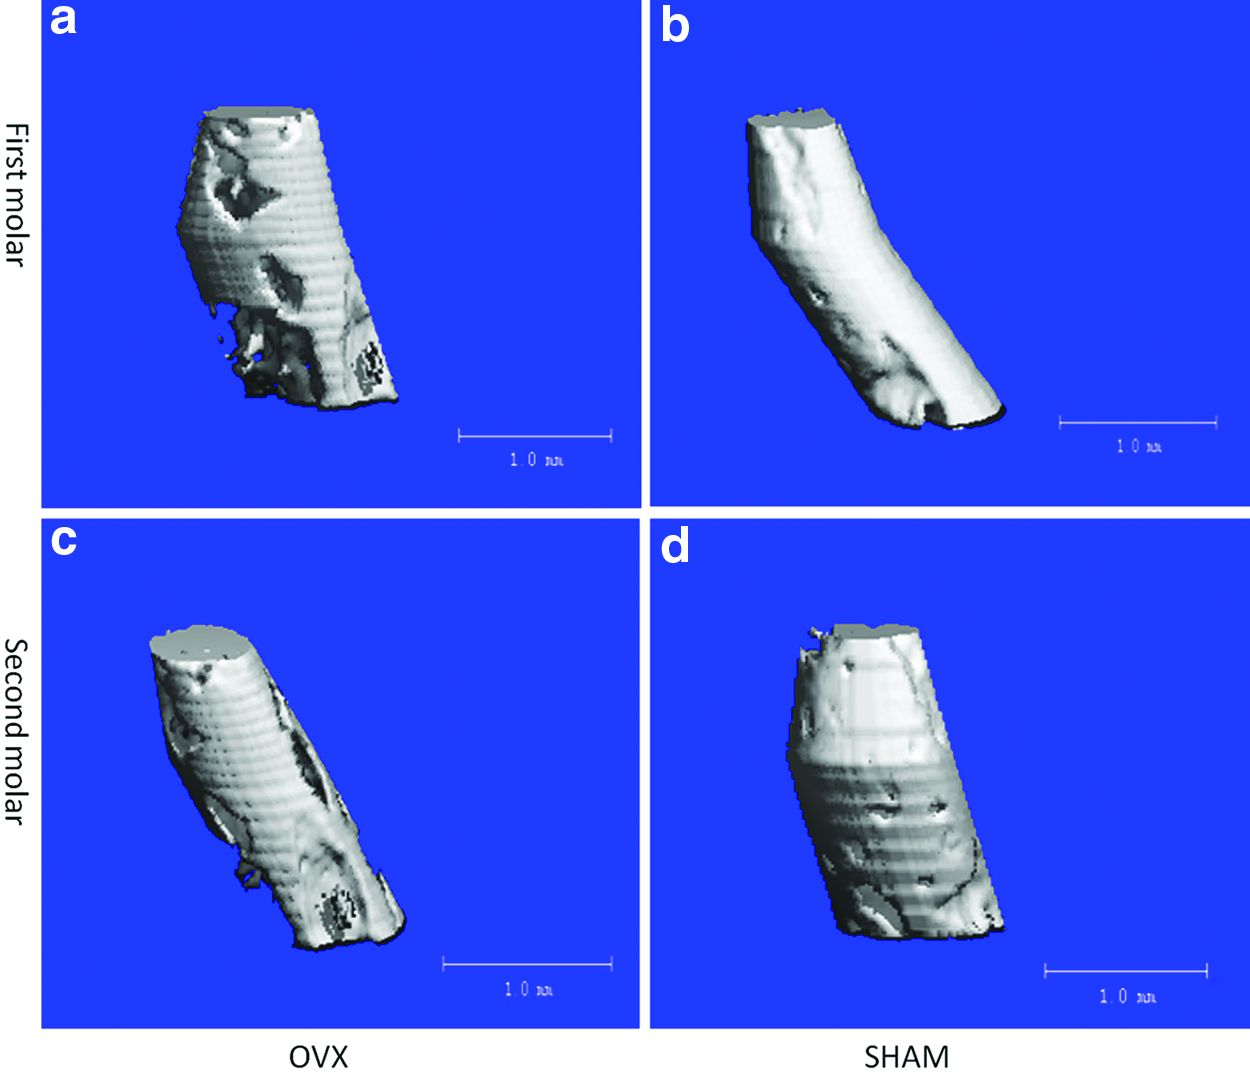
Three-dimensional micro CT images of the first molar
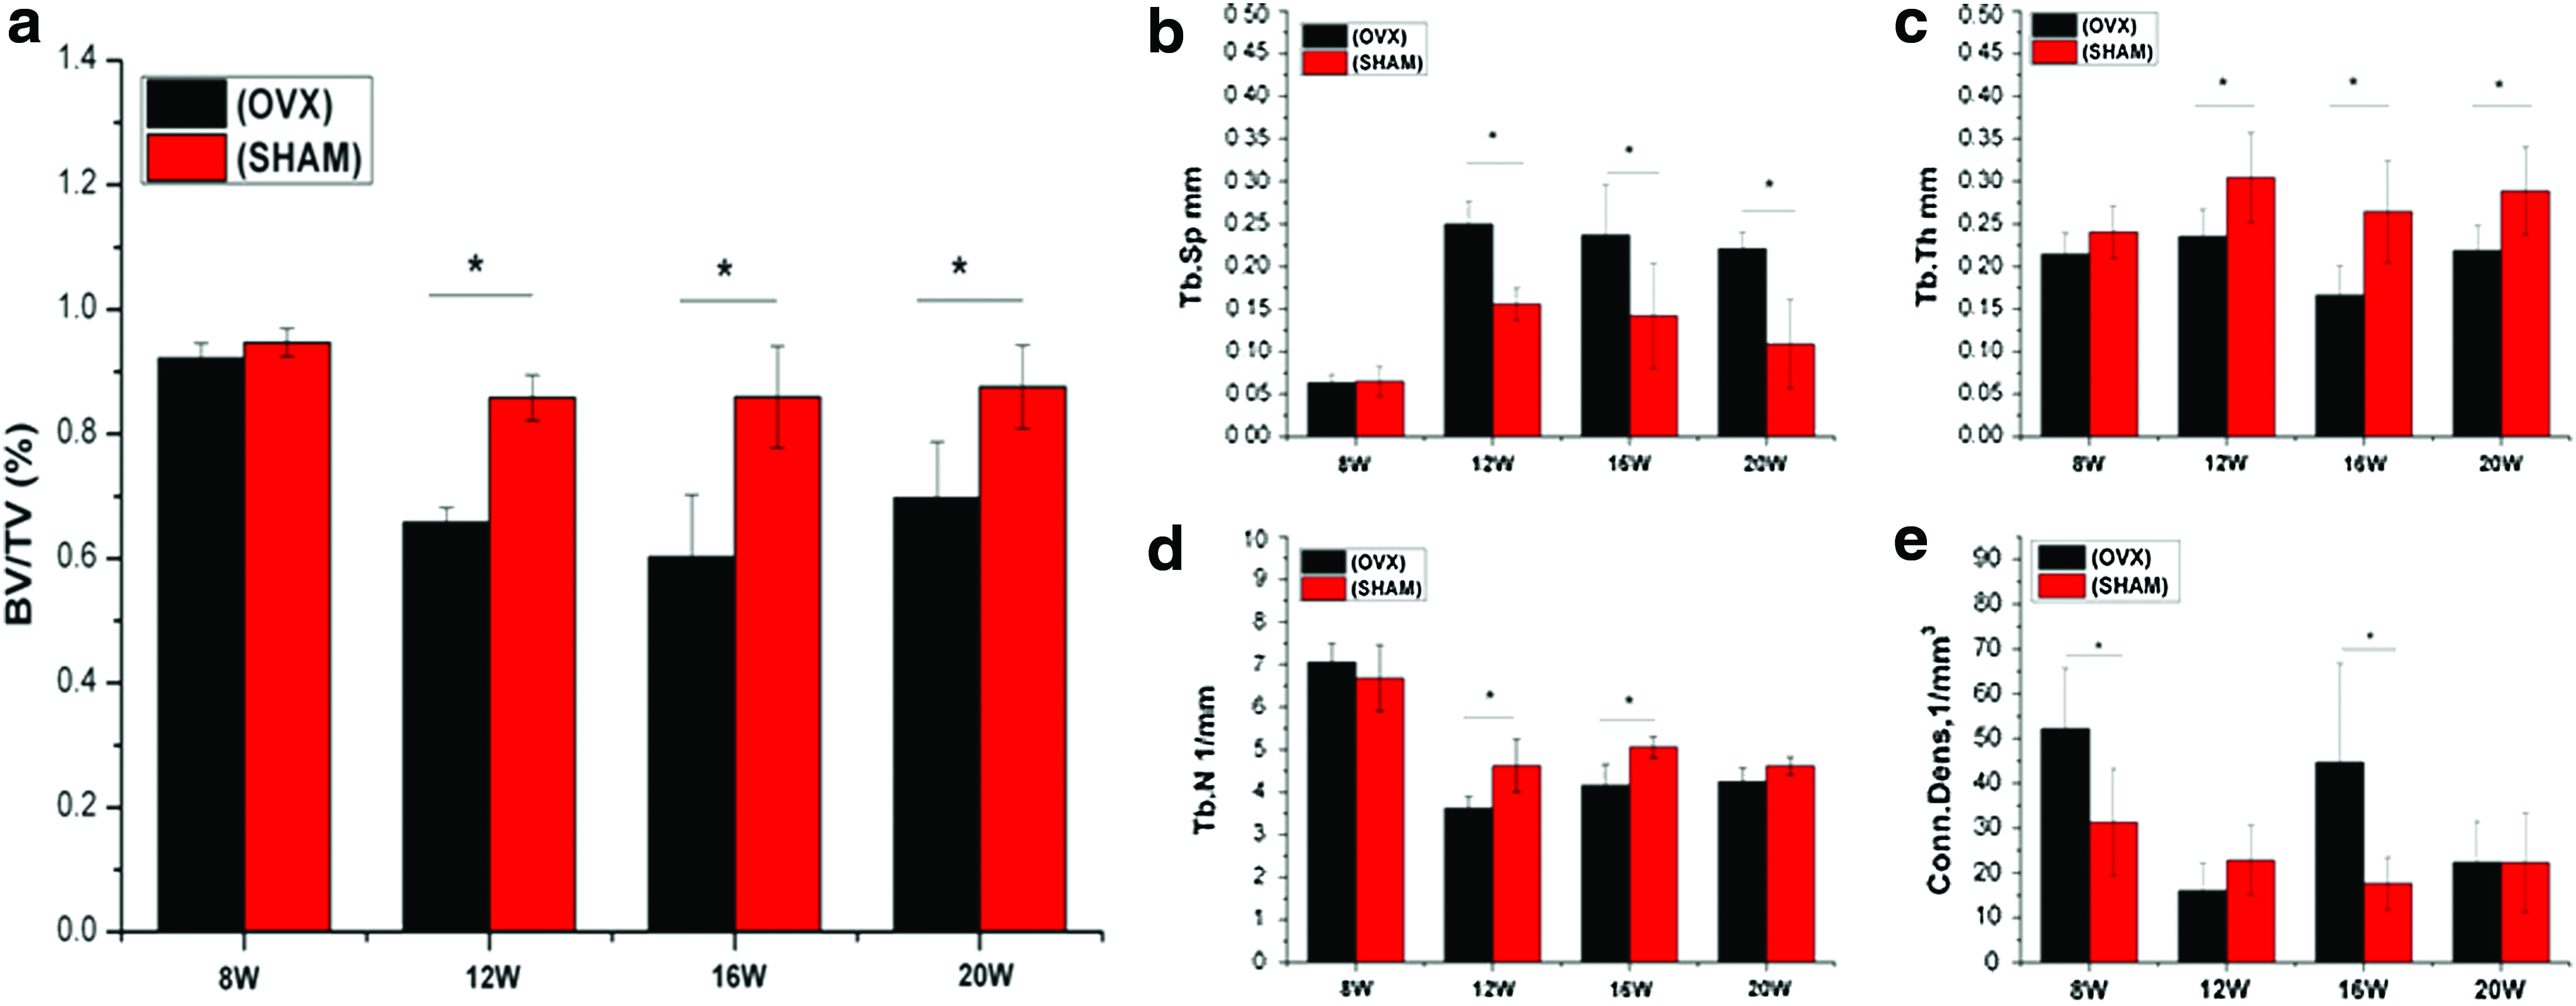
Micro CT results of first molar showed significant differences from 12 weeks for the parameters BV/TV
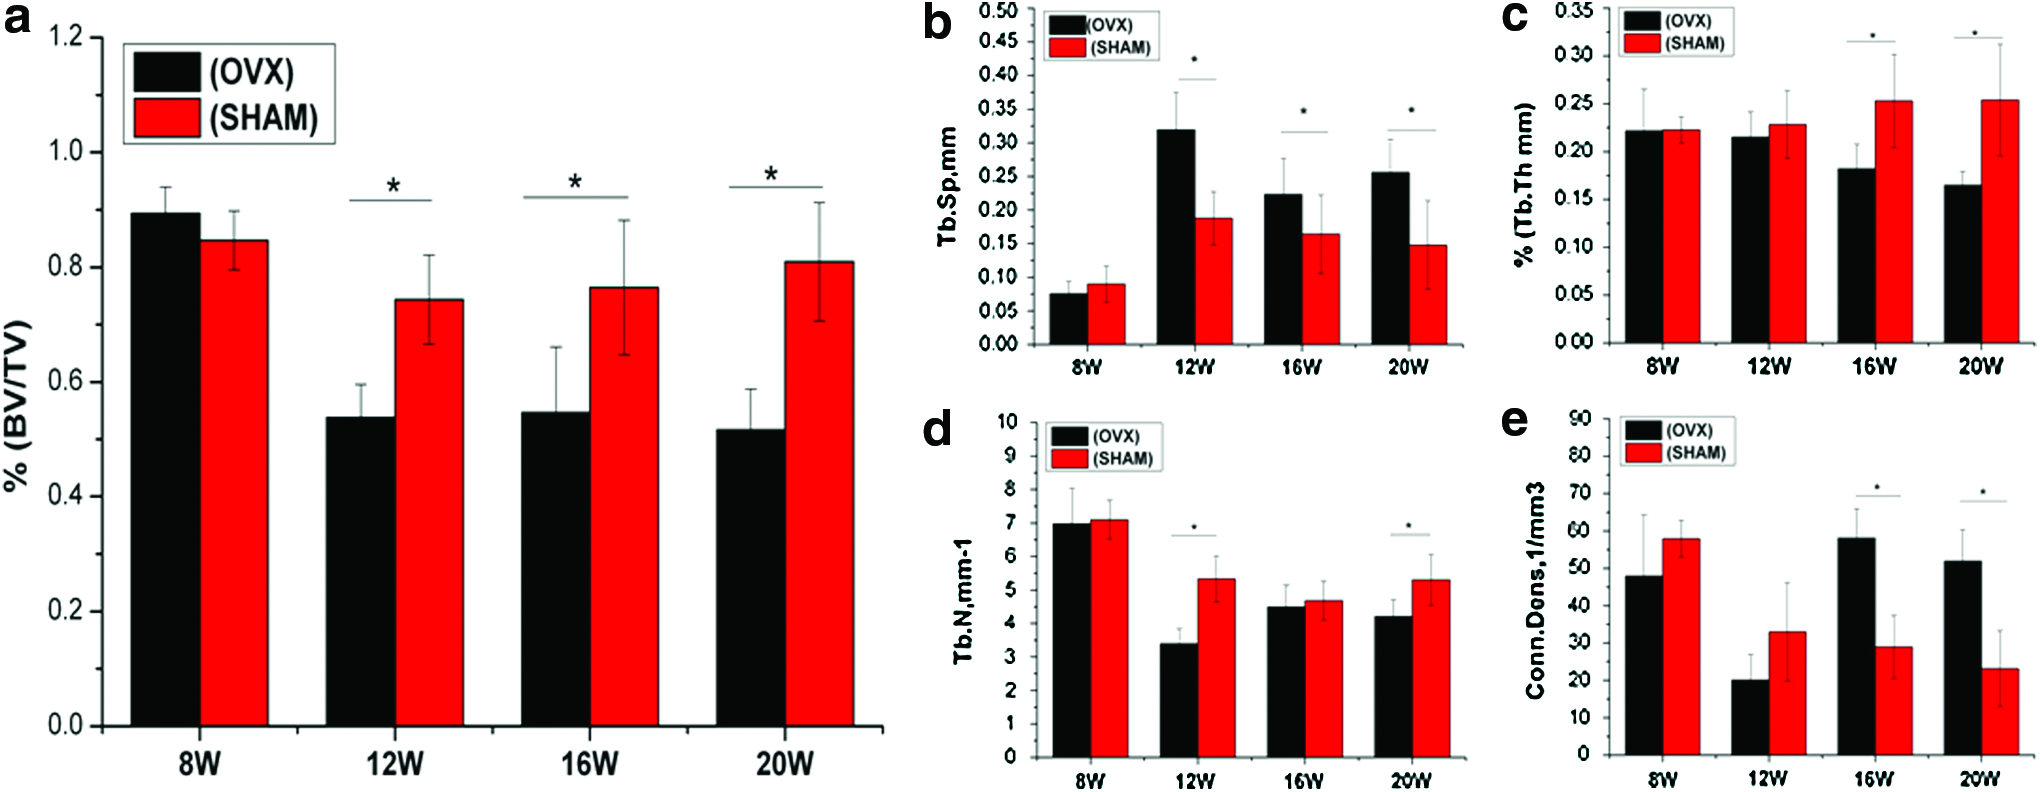
Micro CT results of second molar showed significant differences between the groups for the parameters
Histological assessment
The histology images of tibia at 8 weeks showed significantly more sparse trabecular bone in OVX rats compared with the sham group (Fig. 4c, d), which is consistent with the 3D micro CT results (Fig. 4a, b). In summary, these results provide evidence that bone loss due to estrogen deficiency induced by ovariectomy surgery affected long bone as early as 8 weeks.
The evaluation of the histology images from the maxilla showed that the trabecular bone was affected by the overiectomy operation at week 12, with the OVX group having increased bone marrow volume (Fig. 9a) compared with the SHAM group (Fig. 9b), which was consistant with the micro CT's longitudinal sections (Fig. 9c-OVX, d-SHAM) and the 3D micro CT results (Fig. 6). The analysis of trabecular bone area showed higher values for the SHAM group compared with the OVX group (Fig. 9e, p<0.05). The microscopic evaluation of histological sections highly supported the findings from micro CT.
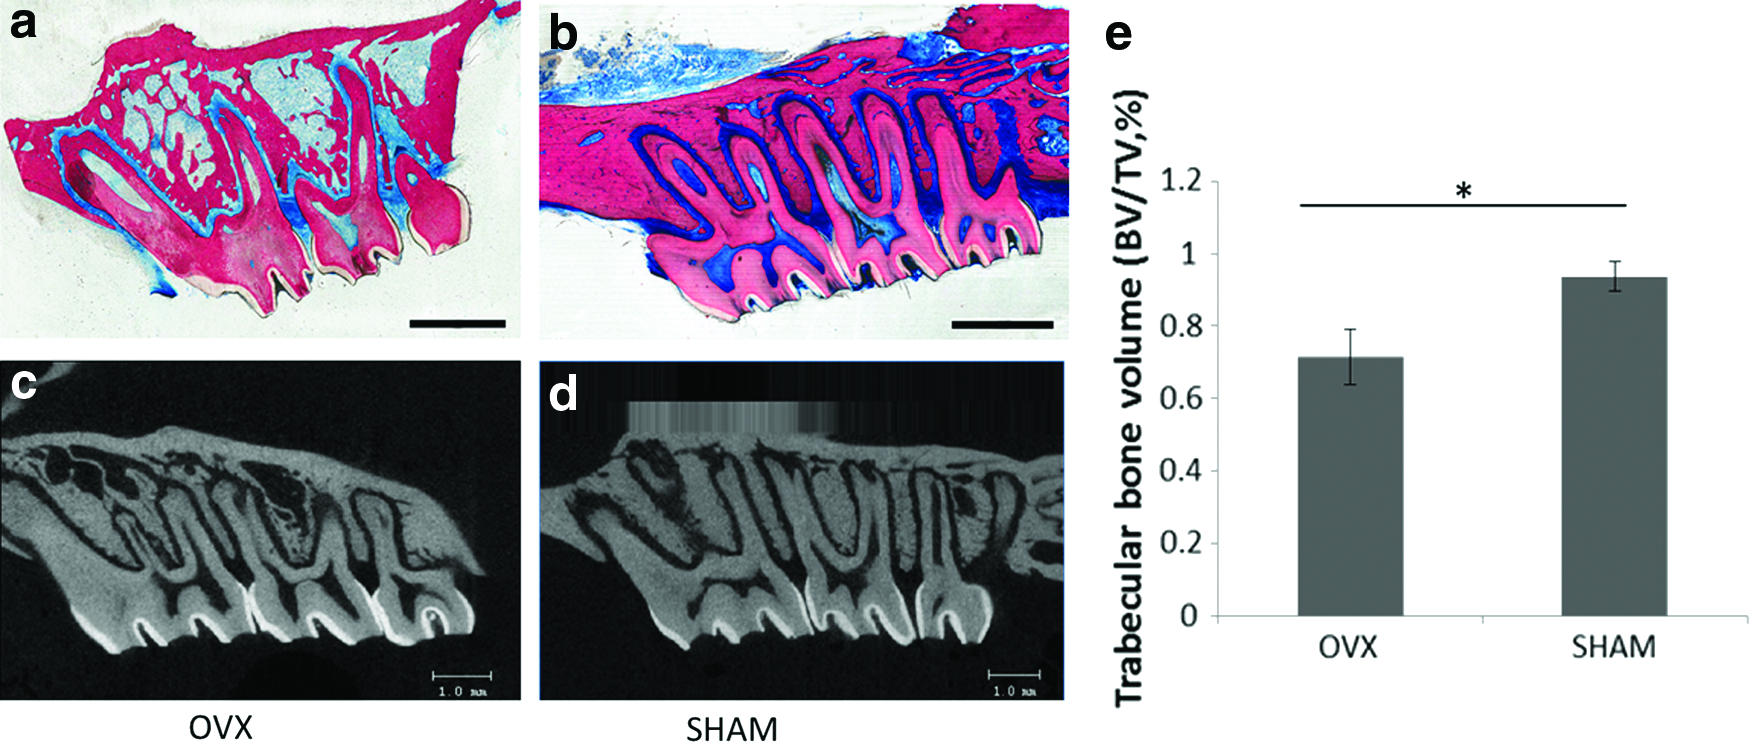
Histology images
Discussion
The impacts of osteoporosis on the dental health of patients are not clear-cut. However, the negative impacts on the dental health of patients undergoing certain treatments for osteoporosis are known. The ovariectomized rat is a frequently used model for osteoporosis recommended by the U.S. Food and Drug Adminstration (FDA) 35 owing to advantages including similar changes in bone metabolism during estrogen deficiency compared with humans, 5 easy and safe handling, and a low cost of acquisition. 6 However, the question of whether the rat's maxillary and/or mandibular bone can be used to study osteoporotic bone loss compared with the routinely used long bones or vertebrae is still a controversial issue. 36 In this study, we examined the effects of ovariectomy-induced estrogen deficiency on the bone of the posterior maxilla, with the aim of validating its suitability as a model for studying the effects of osteoporosis on oro-dental conditions and procedures.
Methods used for the analysis of bone density can be divided into destructive and nondestructive methods. Compared with the well-established method of histomorphometry, the newer nondestructive micro CT method is based on building full 3D structures of the sample. 37 The use of this method effectively avoids potential variability by observers 38 and accounts for bone parameters varying within a given specimen. 39 DEXA is another method that is regularly used to investigate bone density. But due to the low resolution and the limitation of 2D imaging, DEXA is not able to determine microstructural parameters. 21 Theoretically, the ideal way to analyze maxillary bone using micro CT would be to include the whole bone and exclude the tooth roots. However, this is very difficult to implement because of the irregular shape of maxilla and tooth roots, and the presence of the sinus and nose cavities. These difficulties may explain the lack of studies evaluating maxillary bone changes resulting from osteoporosis in the literature. The furcation area, which is entirely made up of trabecular bone, is an important site to reflect the impact of osteoporosis on bone quality. The furcation areas are also involved in periodontal disease and act as a recipient site in dental implant placement. Therefore, the furcation areas of the first molar and second molars were selected for micro CT analysis, assuming that any changes to the trabecular bone in the area would be representative of changes in the remainder of the maxilla. The third molar was not included because of the large variation of roots between animals and the difficulties to generate consistent and reproducible evaluation.
From our results, both animal weights and the trabecular bone content of the tibia in the OVX group were significantly different at the first observation time point of 8 weeks. Ovariectomy caused accelerated food intake, which resulted in body weight increase, which is consistent with other reports in the literatures. 21 Ovariectomy also caused significant tibial trabecular bone loss in the OVX group compared with the SHAM group from 8 weeks. BV/TV, Tb.N., and Conn.Dens were significantly decreased compared with the SHAM group. This meant that at 8 weeks, induction of the osteoporosis model in the tibia could be deemed as being successfully achieved, as has been described previously. 40
However, in maxilla, the decrease in bone density did not emerge until 12 weeks, as opposed to 8 weeks in the tibia. From 12 weeks in the maxillary groups, BV/TV showed a significant decrease and Tb.Sp. increased significantly in the OVX group compared with the SHAM group. The furcation areas of the first molar and second molar in the OVX group were more porous compared with the SHAM group. Histological analysis and micro CT results also showed the same trend. The apparent difference of osteoporotic effect on maxilla and tibia following ovariectomy can be explained by the different embryological origins and different ossification processes between the two anatomic locations. 19 Additionally, the asynchronism may be explained by inherent genetic differences between bone of cranial origin and bone of noncranial origin. 17 Our research clearly demonstrated that an osteoporotic state was reached in the maxilla, albeit at a delayed rate concurrently, in the long bone.
Another interesting finding is that the parameters used for the analysis of bone tissue architecture did not reveal the same changes between tibia and maxilla. In the tibia, the trabecular thickness (Tb.Th.) showed no obvious differences between the two groups. However, in the maxilla, OVX caused bone trabeculae to become significantly thinner than in the SHAM group and the differences did not emerge at the same time point in the two regions evaluated in the maxilla (between first and second molar furcation areas). Conn.Dens in the tibia of OVX animal decreased from 8 weeks, but in the maxilla, there was no regular pattern for either the first or second molar. We speculate that this could be due to the different endochondral and membranous bone formation between long bones and maxillar/mandibular bones. 19 The complexity of the masticatory force distribution between the different teeth could also result in subtle structural differences between the first and second molars.
The maxilla is an irregularly shaped bone due to the presence of the sinus and nasal cavity in the molar area, which makes the micro CT analysis challenging, because it is almost impossible to acquire a standard reproducible shape of VOI for all specimens to be analyzed. Before we chose the furcation areas for analysis, we tried to assess the entire maxilla, except for the teeth. But we found that either tissue from the VOI was incorrectly omitted, or it was otherwise very challenging to obtain a consistent shape between different rats. Consequently, we selected the furcation area for the analysis. Initially we wanted to include the molar furcation areas from all three molars, but the roots of the third molar have significantly different shapes between animals, so we only selected the first molar and second molar for our analysis. By choosing a conical cylindrical shape for our VOI in the furcation area, defined by three circles with diameters of 40, 60, and 60 pixels respectively, we were able to completely exclude the roots. However, it should be noted that this method may result in the exclusion of some trabecular bone from the analysis. While this represents a limitation of our research, it is positively comparable with limitations faced by other researchers who have previously attempted to identify the changes of mandibular bone as a result of osteoporosis, whether it was based on 2D X-ray41–43 or 3D CT.33,44,45 All of these studies were challenged by the difficulty of acquiring a standard VOI for comparison between animals and between experimental groups. We believe that the creative method developed in this study for defining the VOI in the maxilla may also be used for other applications in bones of irregular shape.
Conclusion
It appears that the trabecular bone compartment in the tibia is more sensitive than the maxilla to changes in estrogen levels as induced in rats by ovariectomy, demonstrating that the effects of estrogen deficiency on trabecular bone architecture are site-dependent and at least 3 months are required for the osteoporotic effects to be apparent in the posterior maxilla following rat OVX. A key outcome of this study is the establishment of a method to reproducibly define a standardized VOI in the posterior maxilla for the evaluation of trabecular bone morphology, which may also be used for bones with irregular shape.
Footnotes
Disclosure Statement
No competing financial interests exist.
References
Supplementary Material
Please find the following supplemental material available below.
For Open Access articles published under a Creative Commons License, all supplemental material carries the same license as the article it is associated with.
For non-Open Access articles published, all supplemental material carries a non-exclusive license, and permission requests for re-use of supplemental material or any part of supplemental material shall be sent directly to the copyright owner as specified in the copyright notice associated with the article.