
Abstract
Cartilage tissue engineering is a promising approach to resurfacing osteoarthritic joints. Existing techniques successfully engineer small-sized constructs with native levels of extracellular matrix (glycosaminoglycans [GAG] or collagen). However, a remaining challenge is the growth of large-sized constructs with properties similar to those of small constructs, due to consumption and transport limitations resulting in inadequate nutrient availability within the interior of large constructs. This study employed system-specific computational models for estimating glucose requirements of large constructs, with or without channels, to enhance nutrient availability. Based on glucose requirements for matrix synthesis in cartilage constructs, computational simulations were performed to identify the media volume (MV) and the number of nutrient channels (CH) needed to maintain adequate glucose levels within tissue constructs over the 3-day period between media replenishments. In Study 1, the influence of MV (5, 10, 15 mL/construct) and number of nutrient channels (CH: 0, 3, 7, 12 per construct) on glucose availability was investigated computationally for ∅10×2.34 mm cylindrical constructs. Results showed that the conventionally used MV 5 led to deleterious glucose depletion after only 40 h of culture, and that MV 15 was required to maintain sufficient glucose levels for all channel configurations. Study 2 examined experimentally the validity of these predictions, for tissue constructs cultured for 56 days. Matrix elaboration was highest in MV 15/CH 12 constructs (21.6%±2.4%/ww GAG, 5.5%±0.7%/ww collagen, normalized to wet weight (ww) on day 0), leading to the greatest amount of swelling (3.0±0.3 times day-0 volume), in contrast to the significantly lower matrix elaboration of conventional culture, MV 5/CH 0 (11.8%±1.6%/ww GAG and 2.5%±0.6%/ww collagen, 1.6±0.1 times day-0 volume). The computational analyses correctly predicted the need to increase the conventional media levels threefold to support matrix synthesis in large channeled engineered constructs. Results also suggested that more elaborate computational models are needed for accurate predictive tissue engineering simulations, which account for a broader set of nutrients, cell proliferation, matrix synthesis, and swelling of the constructs.
Introduction
O
While conventional culture techniques can successfully engineer small constructs (∼0.1 cm2) approaching native levels of glycosaminoglycans (GAG) and collagen,6–8 culturing large constructs for resurfacing clinically relevant defect sizes remains a challenge. 9 Consumption by cells in the construct's peripheral regions hinders the transport of nutrients critical for matrix synthesis in the inner regions, limiting the size to which functional constructs can be grown. To overcome transport limitations, several strategies have been employed for enhancing nutrient availability. Heywood et al. demonstrated that increasing media volume (MV) in cultures of small [primary bovine chondrocyte]–[alginate] constructs enhanced extracellular matrix (ECM) elaboration and homogeneity.10,11 More recently, our laboratory and others have incorporated nutrient channels into large constructs. This reduction in nutrient path length within large constructs produced tissues with higher compressive mechanical properties and improved matrix distribution over channel-free constructs, although differences in the total matrix content were insignificant.12–14 Despite these advances, our limited understanding of the specific nutrient requirements for construct synthesis compromises the application of culture strategies to larger constructs. This notion is supported by the variability of media supply rates found in the literature (Table 1).7,11,13,15–21
Culture conditions were used to calculate the daily media replenishment volume per million cells and the daily moles of glucose replaced per million cells.
JBC, juvenile bovine chondrocytes; ABC, adult bovine chondrocytes.
The aim of our study was to formulate and validate system-specific computational models for estimating the nutrient supplies needed to engineer large tissues, with or without nutrient channels. These models may account for system-specific ECM synthesis and nutrient consumption. This study focused specifically on the supply of glucose in the [juvenile bovine chondrocyte]–[agarose gel] CTE system. In our recent experimental study of cellular glucose consumption and matrix synthesis in small constructs (∅4×2.34 mm), a glucose concentration of 12.5 mM was identified as the nutrient threshold below which the ECM synthesis ceased.21,22 This threshold represented half the initial glucose concentration of 25 mM in standard cell culture media, suggesting that such standard conditions may easily lead to nutrient depletion in tissue engineering studies when the media/cell ratio is inadequate. Indeed, preliminary simulations conducted for this study suggested that our standard culture conditions fail to supply larger (∅10×2.34 mm) constructs with adequate glucose levels for ECM elaboration. Consequently, placing nutrient channels into constructs would be ineffective under those conditions, potentially leading to confounding results if nutrient levels were not accounted for.
Motivated by these insights, we investigated whether computational models, informed by this critical glucose threshold and experimentally characterized glucose consumption rates, can identify adequate levels of MV per construct to ensure optimal matrix synthesis during tissue culture for a variety of channel configurations. To this end, finite element (FE) models were first used to simulate the influences of MV and nutrient channel density on the glucose concentrations within large constructs (Study 1); in this manner, the theoretical conditions required for sufficient glucose availability were identified. Informed by Study 1, large constructs were experimentally cultured for 8 weeks under these computationally predicted suboptimal and optimal conditions, and their mechanical properties and biochemical composition were assessed (Study 2).
Methods
Study 1: nutrient simulations
Nutrient supply and consumption models were implemented in FEBio (
Constructs were modeled as being suspended within a well-stirred bath, boundary conditions representative of the experimental configuration. 14 The bath was modeled explicitly and well-stirred conditions were simulated using glucose diffusivity 1000 times higher than in the construct. 21 FE model geometries and meshes (CUBIT; Sandia National Laboratory) matched the geometries of several candidate channel and bath configurations (Fig. 1): constructs (∅10×2.34 mm) suspended within a media bath volume of 5, 10, or 15 mL (MV: 5, 10, and 15) and configured with 0, 3, 7, or 12 channels (CH: 0, 3, 7, 12), generating a total of 12 culture conditions. CH groups represent triangular packing arrangements of ∅1 mm channels that may be inscribed symmetrically within a ∅10 mm construct; the MV groups were selected such that the lowest (5 mL/construct) represented a typical media/cell ratio employed in CTE experiments (Table 1), while the highest (15 mL/construct) was predicted to supply adequate glucose according to the nutrient threshold. As these geometries exhibited both axial and radial symmetries, symmetrical representative regions (CH 0, 3, 12: 60°, CH 7: 30°; all: half-thickness) were modeled with symmetry planes (zero-flux boundaries), as shown in Figure 1 (bottom).

Experimental configuration. Theoretical models were developed for channeled constructs suspended in a well-mixed bath. Constructs (with 0, 3, 7, and 12 channels each) were modeled according to the available symmetry (axial and radial). Models featured a finite media bath, either 5, 10, or 15 mL; constructs then had either a media bath boundary conditions (lateral, top, and channel, if present, surfaces) or no flux boundary conditions (sagittal cut edges and bottom transverse plane); as shown is CH 3/MV 5 configuration. CH, nutrient channels; MV, media volume. Color images available online at
To examine how an infinitely large (or continuous) supply of fresh media would influence construct glucose concentrations, simulations were also run with a fixed 25 mM glucose concentration prescribed at the construct surface (group MV∞).
Glucose was modeled as an uncharged solute with a constant free diffusivity D0=9.2×10⁻⁴ mm2·s−1 and mixture diffusivity D=8.7×10⁻⁴ mm2·s−1
25
; the constructs had solid volume fractions of 2%, typical of freshly cast constructs. Glucose transport and supply were related through mass balance,
where cglc is the glucose concentration and
where
Study 2: experimental culture
Cell harvesting and construct casting were performed according to previous methods.
8
Briefly, cartilage was harvested from juvenile bovine carpometacarpal joints (local abattoir) and digested with type IV collagenase (Sigma-Aldrich) in high-glucose DMEM (Invitrogen) supplemented with 5% fetal bovine serum, amino acids, buffering agents, and 1% antibiotic–antimycotic (Invitrogen) at 37°C for 8 h with a total solution activity of 1000 U·mL−1.
28
Isolated primary chondrocytes were encapsulated in 2% type-VIIA agarose (Sigma-Aldrich) at a nominal density of 60×106 cells·mL−1. The cell–molten agarose mixture was cast into a custom mold (2.34 mm thick) featuring a glass slide opposite a polytetrafluoroethylene (PTFE) sheet studded with stainless steel pins arranged in the desired channel configurations of the constructs.
14
Constructs (∅10 mm) were cored from this cast layer with 0, 3, or 12 channels (groups: CH 0, 3, 12). The CH 7 constructs modeled computationally were omitted from experiments, as we determined that one intermediate CH group (CH 3) was sufficient to test the hypothesis. Constructs were cultured in chemically defined chondrogenic media supplemented with TGF-β3 for the first 2 weeks.6,8 Media consisted of high-glucose (25 mM glucose) DMEM supplemented with sodium pyruvate (100 μg·mL−1),
Mechanical, biochemical, and histological measurements
Constructs (n=5) were assessed on day 56 for mechanical properties (in unconfined compression to measure equilibrium Young's modulus, EY) and biochemical composition (for DNA, GAG, and collagen contents). For biomechanical assessment, construct dimensions were measured before an unconfined compression (10% specimen height) and relaxation (∼11,000 s); EY was calculated from the relaxed tissue load and the undeformed construct dimensions.14,28 Photographs of constructs were taken to assess the degree of channel filling and images were imported into NIH ImageJ (
Statistical analyses
Day 56 experimental measures were assessed with a two-way ANOVA (α=0.05); factors were CH, MV, and their interaction (CH×MV). Tukey's HSD post hoc comparisons were used to compare differences between groups (p≤0.05). Data are presented as mean±standard deviation.
Results
Study 1: nutrient simulations
Glucose consumption by the cells within constructs caused the projected glucose concentrations to drop throughout the construct and bath substantially below the initial concentration (25 mM), with glucose levels varying spatially throughout the constructs (Fig. 2). Channels enabled the maintenance of more homogeneous glucose concentrations, whereas channel-free constructs exhibited large concentration gradients between the construct surface and center. The temporal evolution of the minimum glucose concentration (at the construct center) is presented in Figure 3, based on average cellular consumption rate. These results show that at low media supply (MV 5), glucose concentrations were below the 12.5 mM threshold for all CH configurations as early as 40 h for CH 0 and 50 h for CH 12 after medium change. Conversely, for MV 15, glucose concentrations exceeded the threshold level throughout the 72 h of culture for all CH groups. The MV 10 group maintained the glucose levels slightly above the threshold for all CH groups at 72 h. However, when examining the effect of cell consumption rate variability (Fig. 4), results show that the MV 10 groups mostly straddle the critical threshold concentration, especially for CH 0 and 3. Only the MV 15 group consistently exceeded the glucose concentration threshold for all channel configurations.
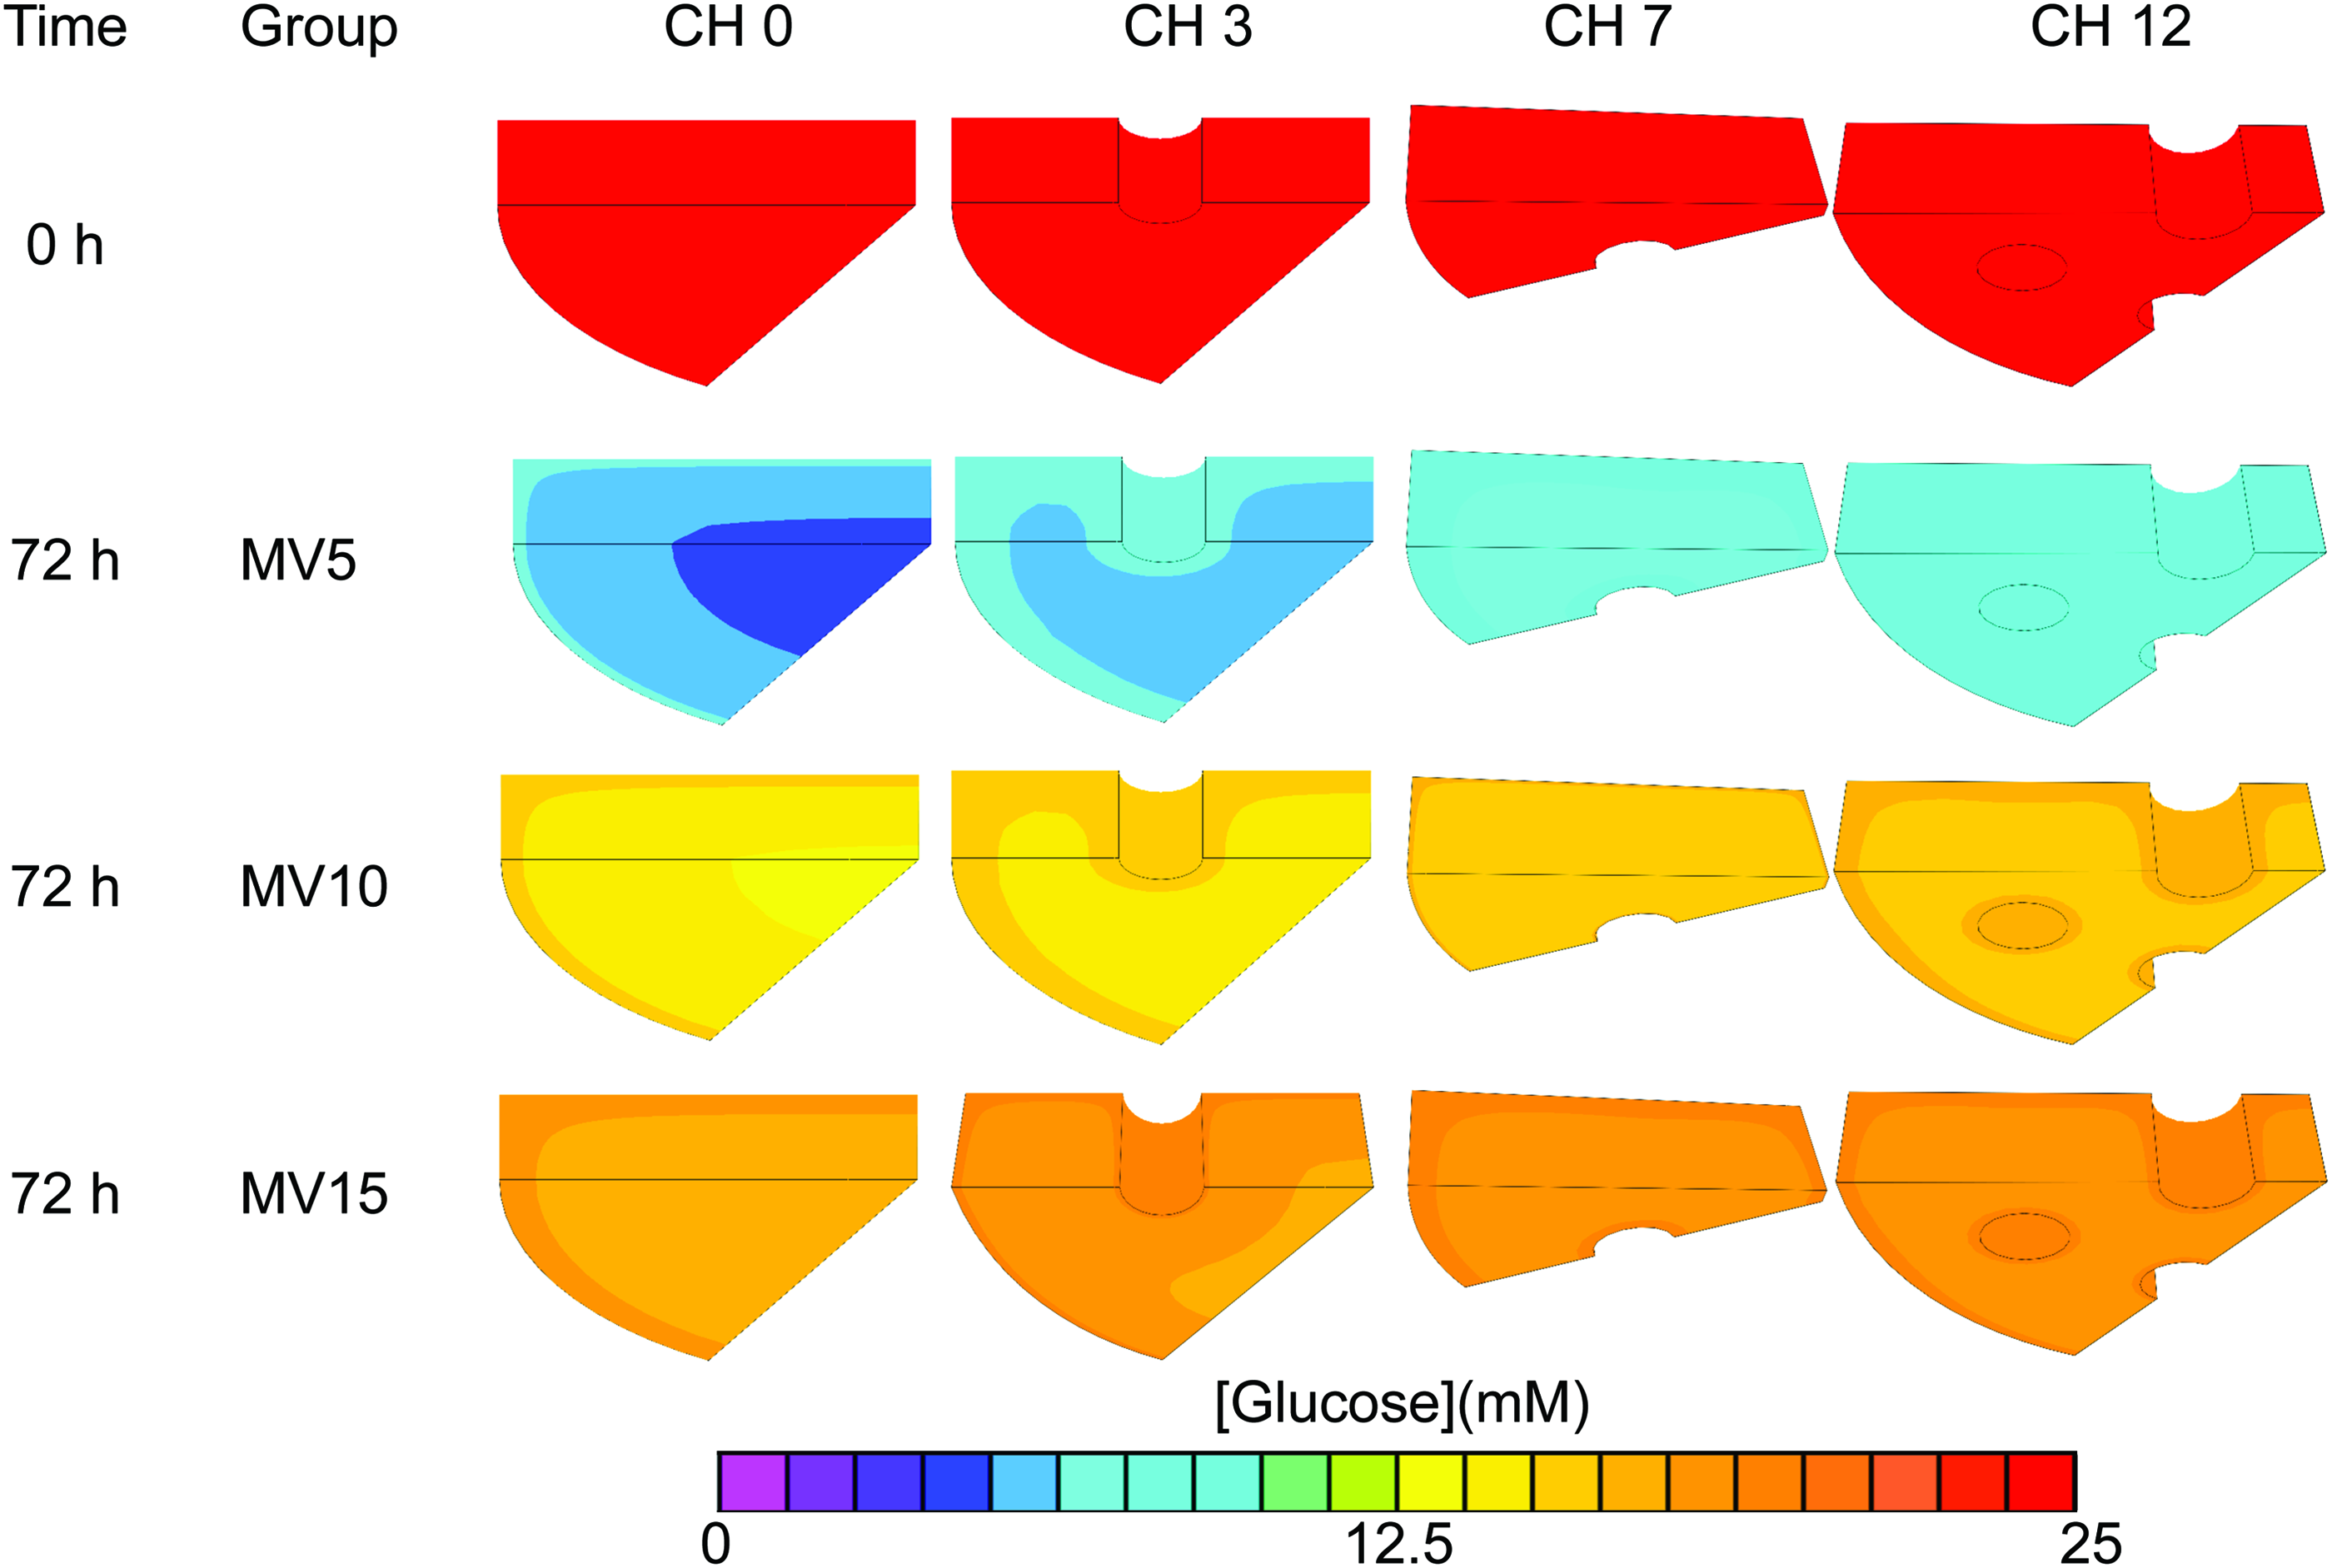
Model-predicted influence of channels (0, 3, 7, and 12 channels per construct) and media volume (MV 5, 10, 15 mL per construct) on glucose profiles within constructs after 72 h of culture. Color images available online at
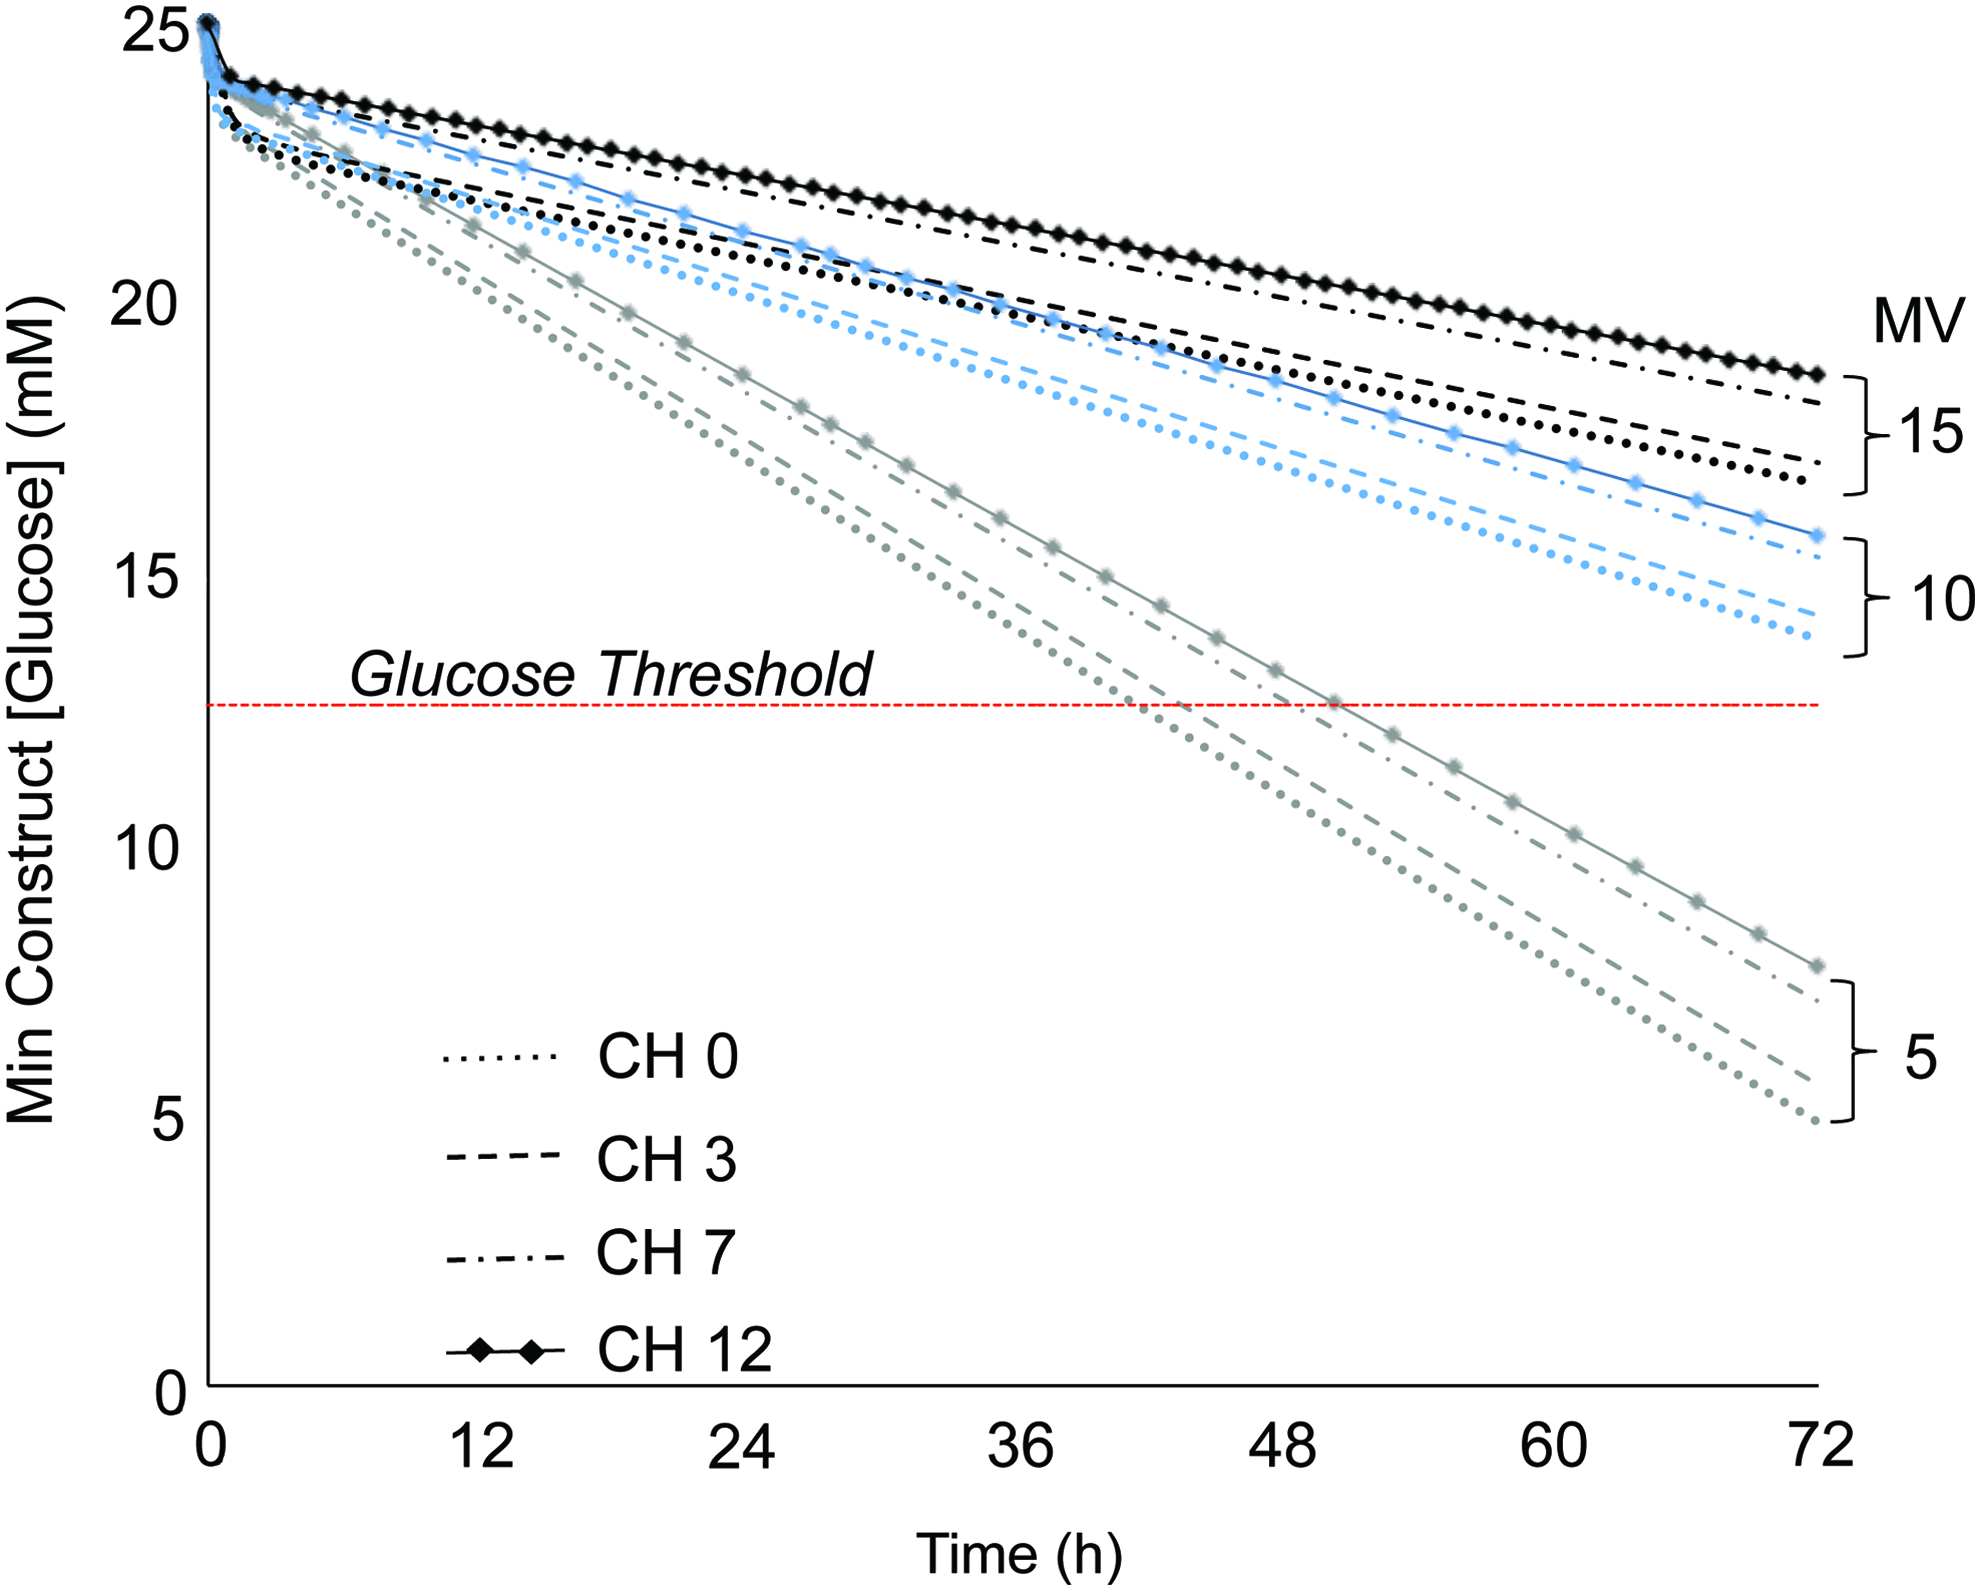
Theoretical predictions of the minimum glucose concentration within the construct over the 72 h culture period. Trend lines represent the mean level of glucose consumption for the different channel configurations (dotted line, CH 0; dashed line, CH 3; dot-dashed line, CH 7; line-through dots, CH 12) and media supplementation volumes (MV levels indicated on right). Horizonal dashed line denotes the critical glucose threshold for matrix synthesis (12.5 mM). Color images available online at
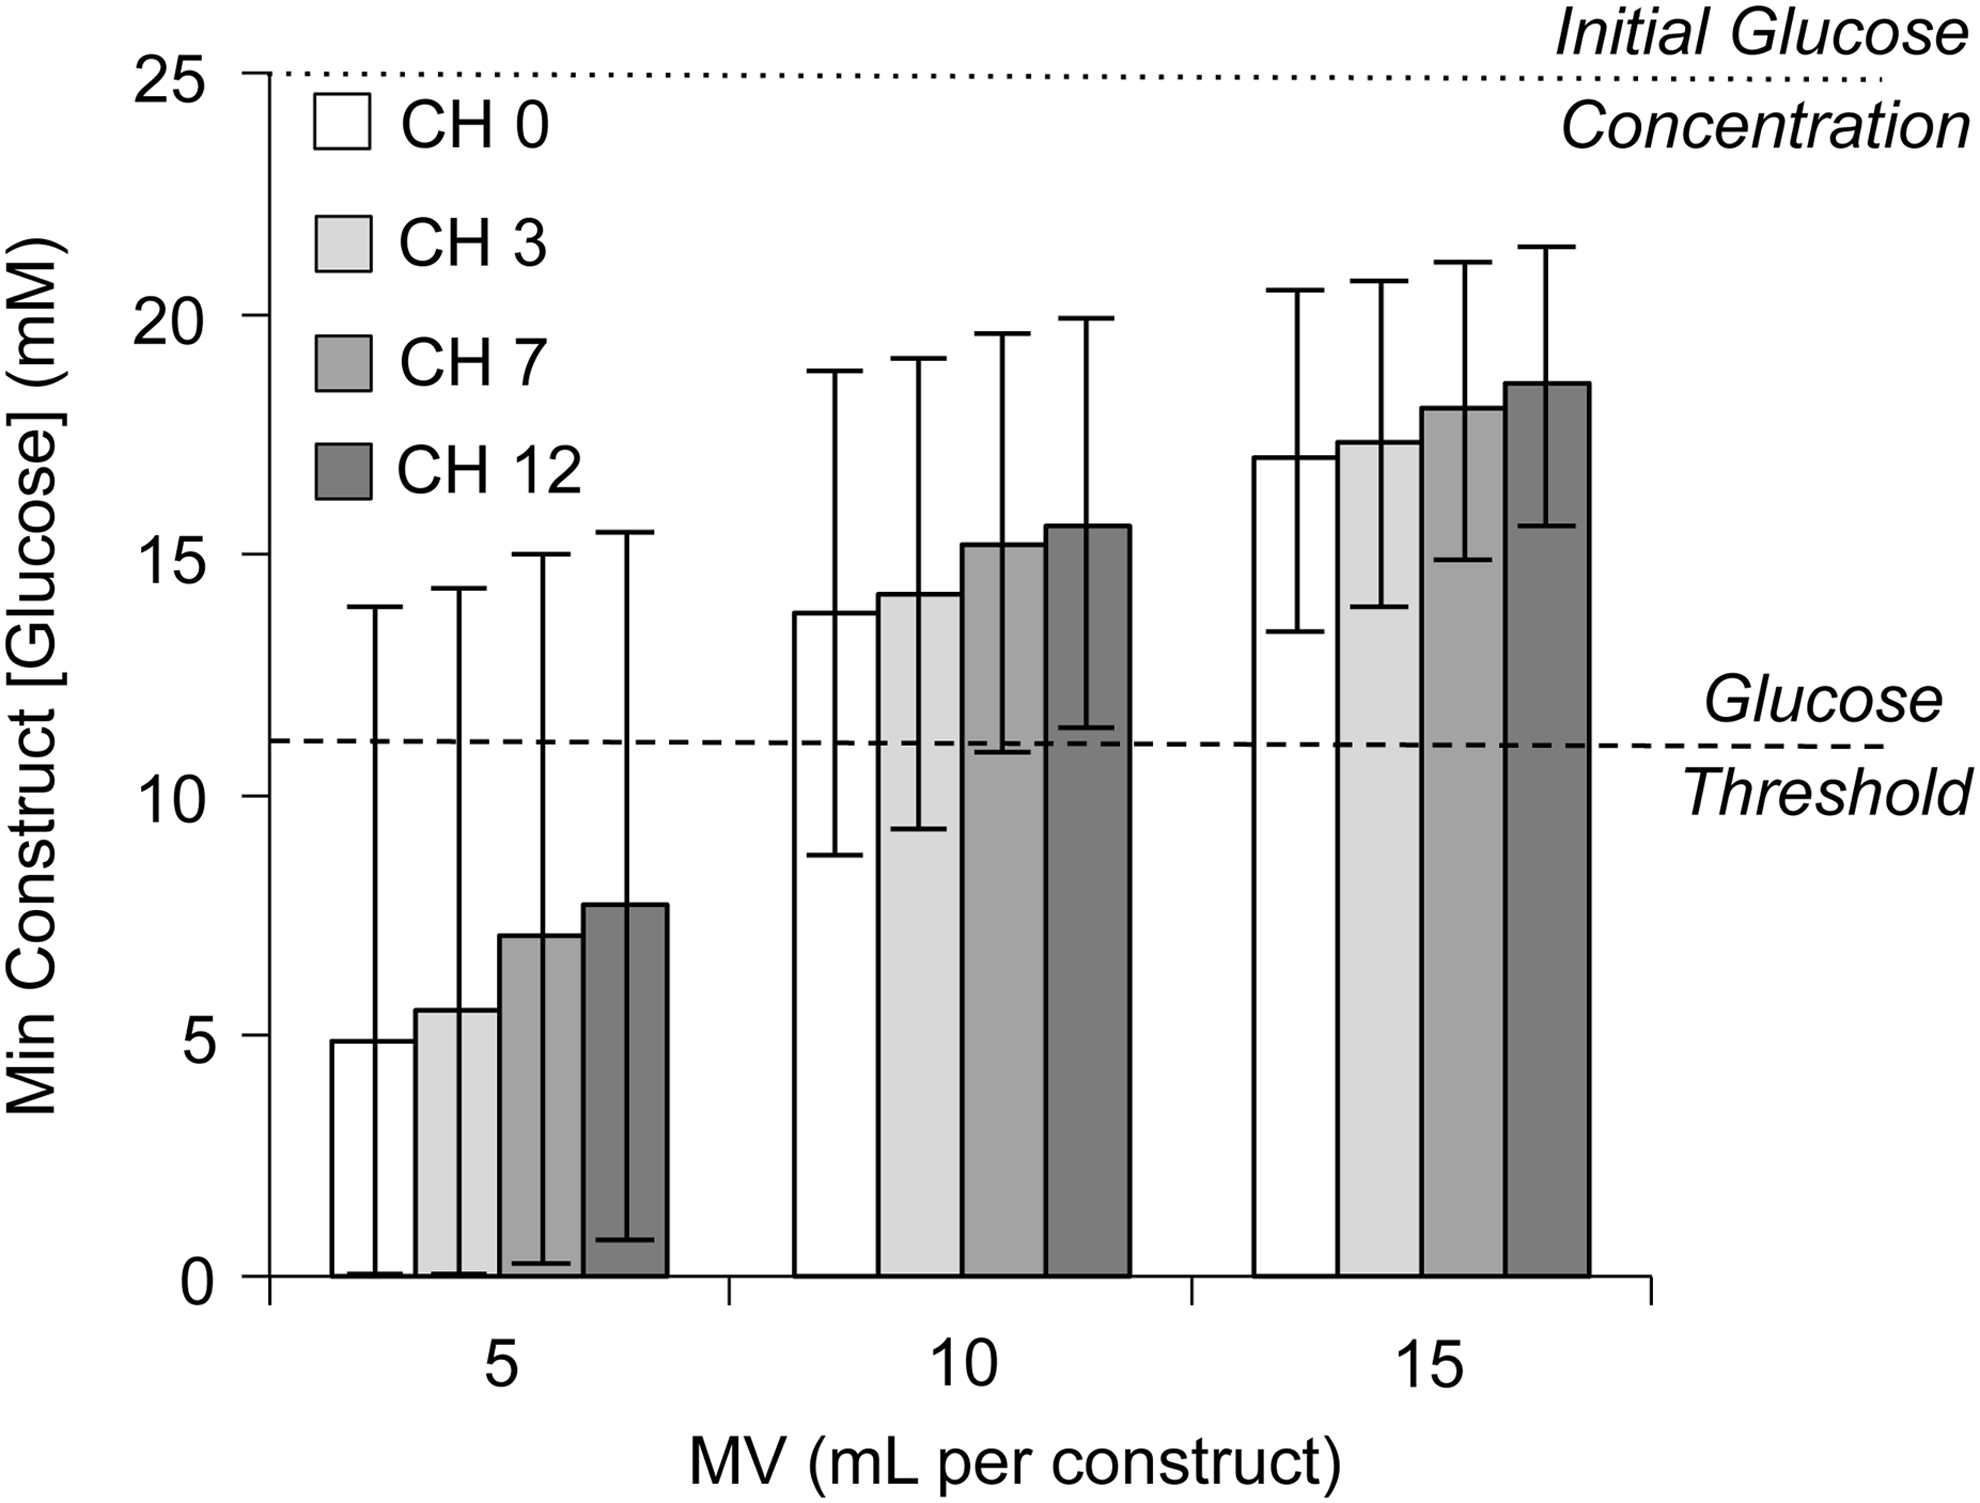
Theoretical predictions of the minimum glucose concentration within the construct after the 72 h culture period. Bar value represents mean glucose consumption level; high error bar represents the low 95% confidence interval (CI) consumption level; low error bar represents the high 95% CI consumption level. Dotted line denotes initial glucose concentration (25 mM); dashed line denotes the critical glucose threshold for matrix synthesis (12.5 mM).
On average, the minimum construct glucose concentration increased by 8.4 mM between the MV 5 and 10 groups, and by 2.7 mM between the MV 10 and 15 groups (Fig. 3). For a given MV, the minimum glucose concentration within the construct increased by an average of 0.6 mM between each CH level (i.e., 0–3, 3–7, or 7–12). The MV∞group further elevated minimum glucose concentrations; the minimum construct glucose concentration of the CH 0, 3, 7, and 12 constructs was 23.2, 23.4, 23.8, and 24.4 mM, respectively, at 72 h. From these predictions, it became evident that increasing MV led to diminishing returns in glucose availability; a MV of 15 was sufficient to elevate all CH groups with 95% confidence above the 12.5 mM threshold (Fig. 4). Therefore, this MV was selected as the highest MV for experimental culture.
Study 2: experimental culture
After 56 days, all groups had similar EY∼304±97 kPa (Fig. 5A; p>0.13). SR (Fig. 5B) was significantly influenced by CH (p<0.001), but not MV (p=0.059). In the extreme instance, the CH 12 group swelled 3.00±0.26 times the day-0 ww when cultured in MV 15; CH 0 constructs at this same MV remained near day-0 dimensions (SR=1.20±0.07; Fig. 6). Due to this disparity of construct swelling, biochemical normalizations were performed with respect to both D56ww and D0ww to examine the composition of the final constructs and total matrix deposition, respectively. Relative to D56ww, neither GAG (Fig. 5C; 7.1%±0.7%; p>0.12) nor collagen (Fig. 5E; 1.6%±0.3%; p>0.35) significantly differed due to effects of MV or CH. Relative to D0ww, the GAG content was significantly influenced by CH (Fig. 5D; p<0.001), MV (p=0.006), and CH×MV (p<0.001); most notably, in the MV 15 group, CH 12 had 2.6×the GAG content of CH 0. For all CH values, MV 10 had more GAG than MV 5 (p=0.004). Similarly, when collagen mass was normalized to D0ww (Fig. 5F), CH (p<0.001), MV (p=0.014), and CH×MV (p<0.001) significantly influenced collagen content. For all CH values, MV 10 had more collagen than MV 5 (p=0.014). CH (p<0.001) but not MV (p≥0.23) influenced the cell density (as normalized by both D56ww and D0ww; Fig. 5G, H, respectively). All groups increased in cellularity from day-0 values (99.4±1.1×10⁶ cells·mL−1).
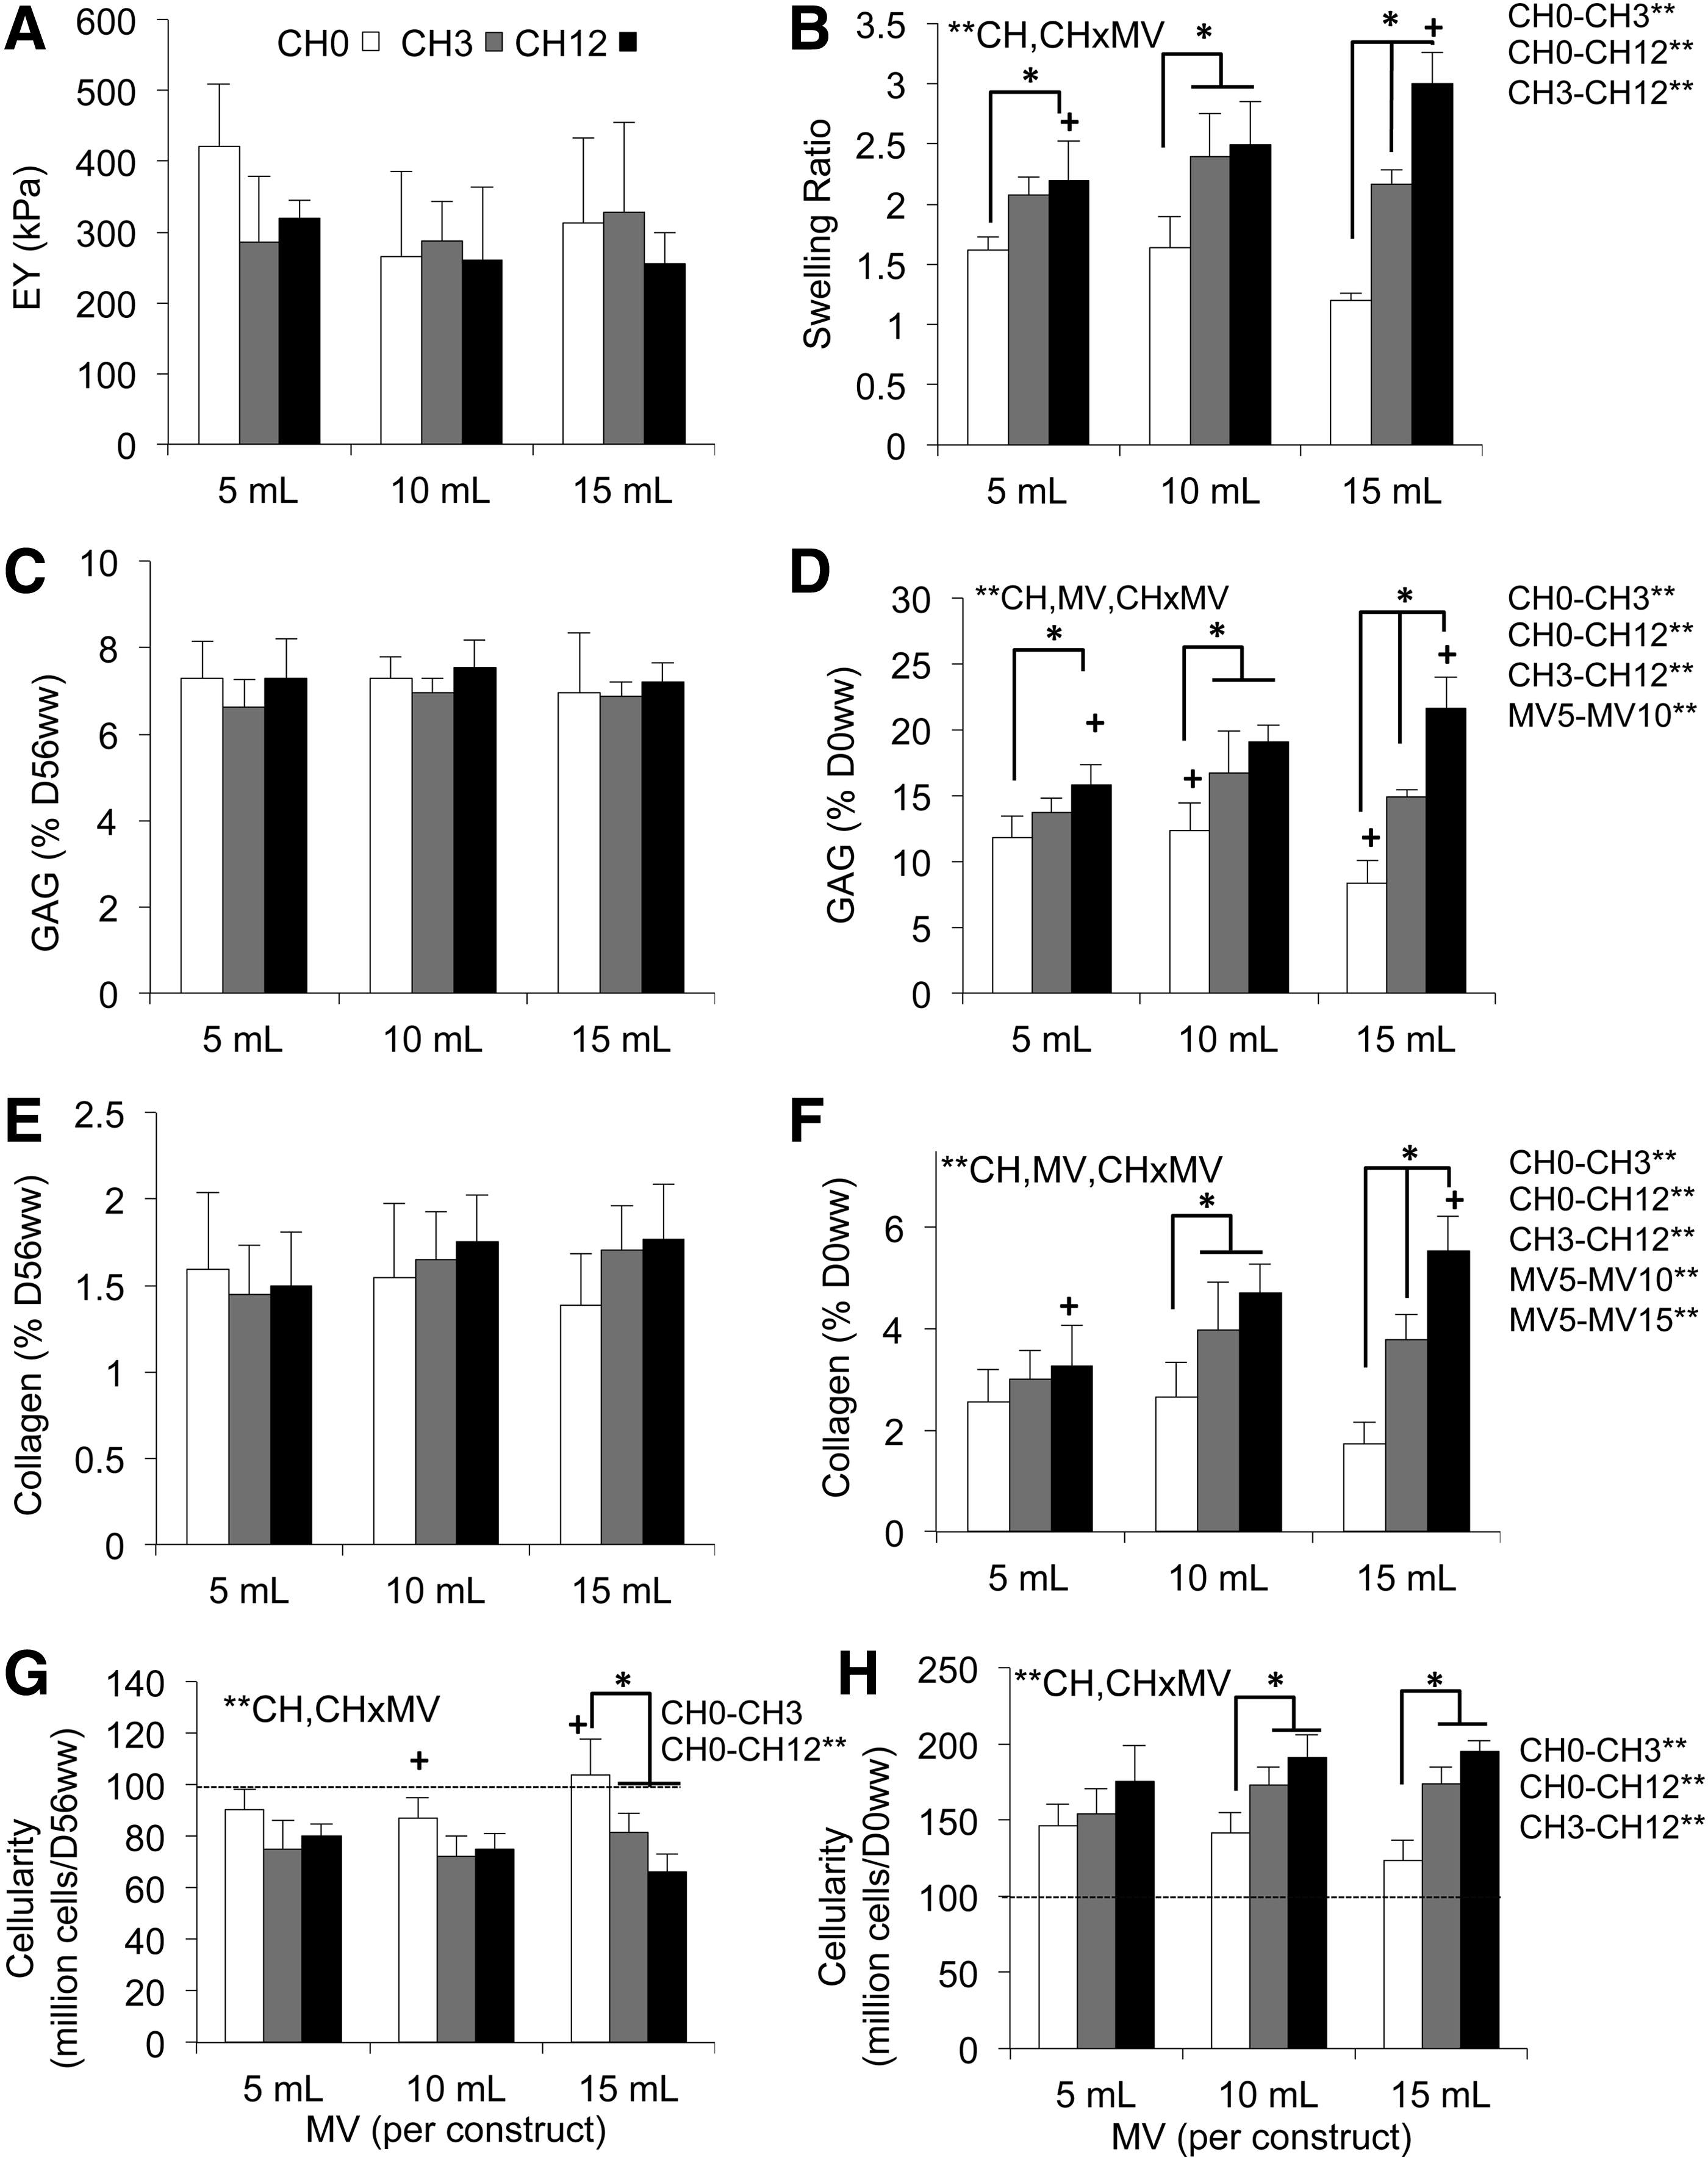
Mechanical and biochemical construct properties (day 56),
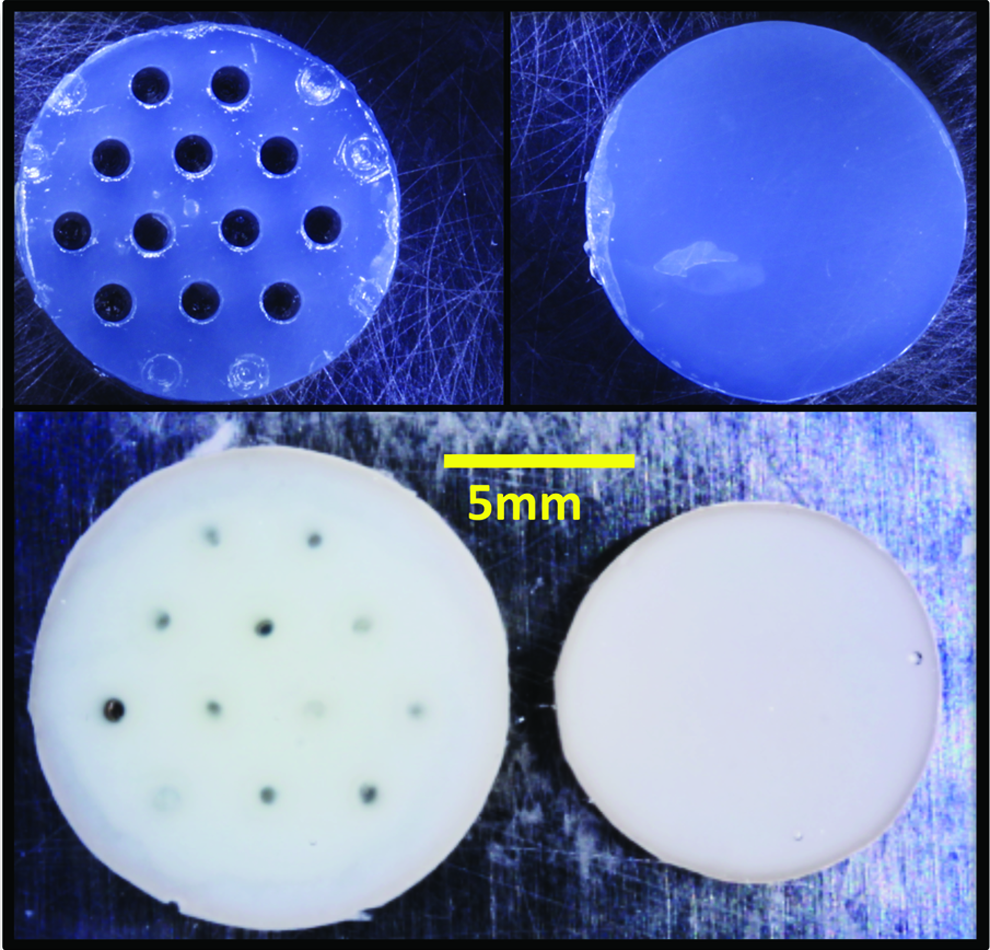
Effect of excess medium on construct swelling. Gross morphological differences in swelling of the experimental MV 15 group between CH 12 (left) and CH 0 (right) groups between freshly cast agarose (top) and mature D56 constructs (bottom). Scale bar, 5 mm. Color images available online at
The loss of matrix macromolecules into the culture media is shown in Table 2. The average daily release of GAG into the culture media varied with CH (p<0.001), MV (p<0.001), and CH×MV (p=0.048); specifically, CH 12 released more GAG than CH 0 (p=0.003) and CH 3 (p=0.012); and MV 15 released more GAG than MV 10 (p=0.015), which released more GAG than MV 5 (p=0.003). Collagen release varied with CH (p=0.005) and MV (p<0.001) but not CH×MV (p=0.29); CH 12 released more collagen than CH 0 (p=0.011), and MV 10 and 15 released more collagen than MV 5 (p=0.045 and p<0.001, respectively).
Glucose concentration is separated into 2-day (D2) and 3-day (D3) groups. Groups with differing superscripts statistically differ (p<0.05).
GAG, glycosaminoglycans.
Glucose concentrations in spent media are presented separately for media collected after a 2-day (GLU D2) or 3-day (GLU D3) period in the (2-2-3-day) weekly media replenishment schedule. GLU D2 varied with CH (p<0.001) and MV (p<0.001) but not with CH×MV (p=0.91); GLU D3 varied with MV (p<0.001) but was not different between CH groups (p=0.24). For GLU D2 and GLU D3, MV 15 had a higher glucose concentration than MV 5 (p<0.001 and p=0.001, respectively) and MV 10 (p<0.001 and p<0.001, respectively); and MV 10 was elevated over MV 5 (p<0.001 and p=0.046, respectively). For GLU D2, CH 12 maintained a higher glucose concentration over CH 0 (p=0.010).
Histological analyses (Fig. 7) of the groups display intense Safranin O staining throughout the constructs with a denser staining profile in the MV 15 groups compared to MV 5; the CH 0 group also had a lower intensity band (Fig. 7, A1 arrow) between the more intense center and periphery. Collagen staining was more diffuse than GAG, with a higher intensity band present midway between the center and periphery in the CH 0 constructs (Fig. 7, A2 arrow). This apparent inverse relationship between GAG and collagen content was also apparent in a thin boundary layer around each of the channels (Fig. 7, B arrows).
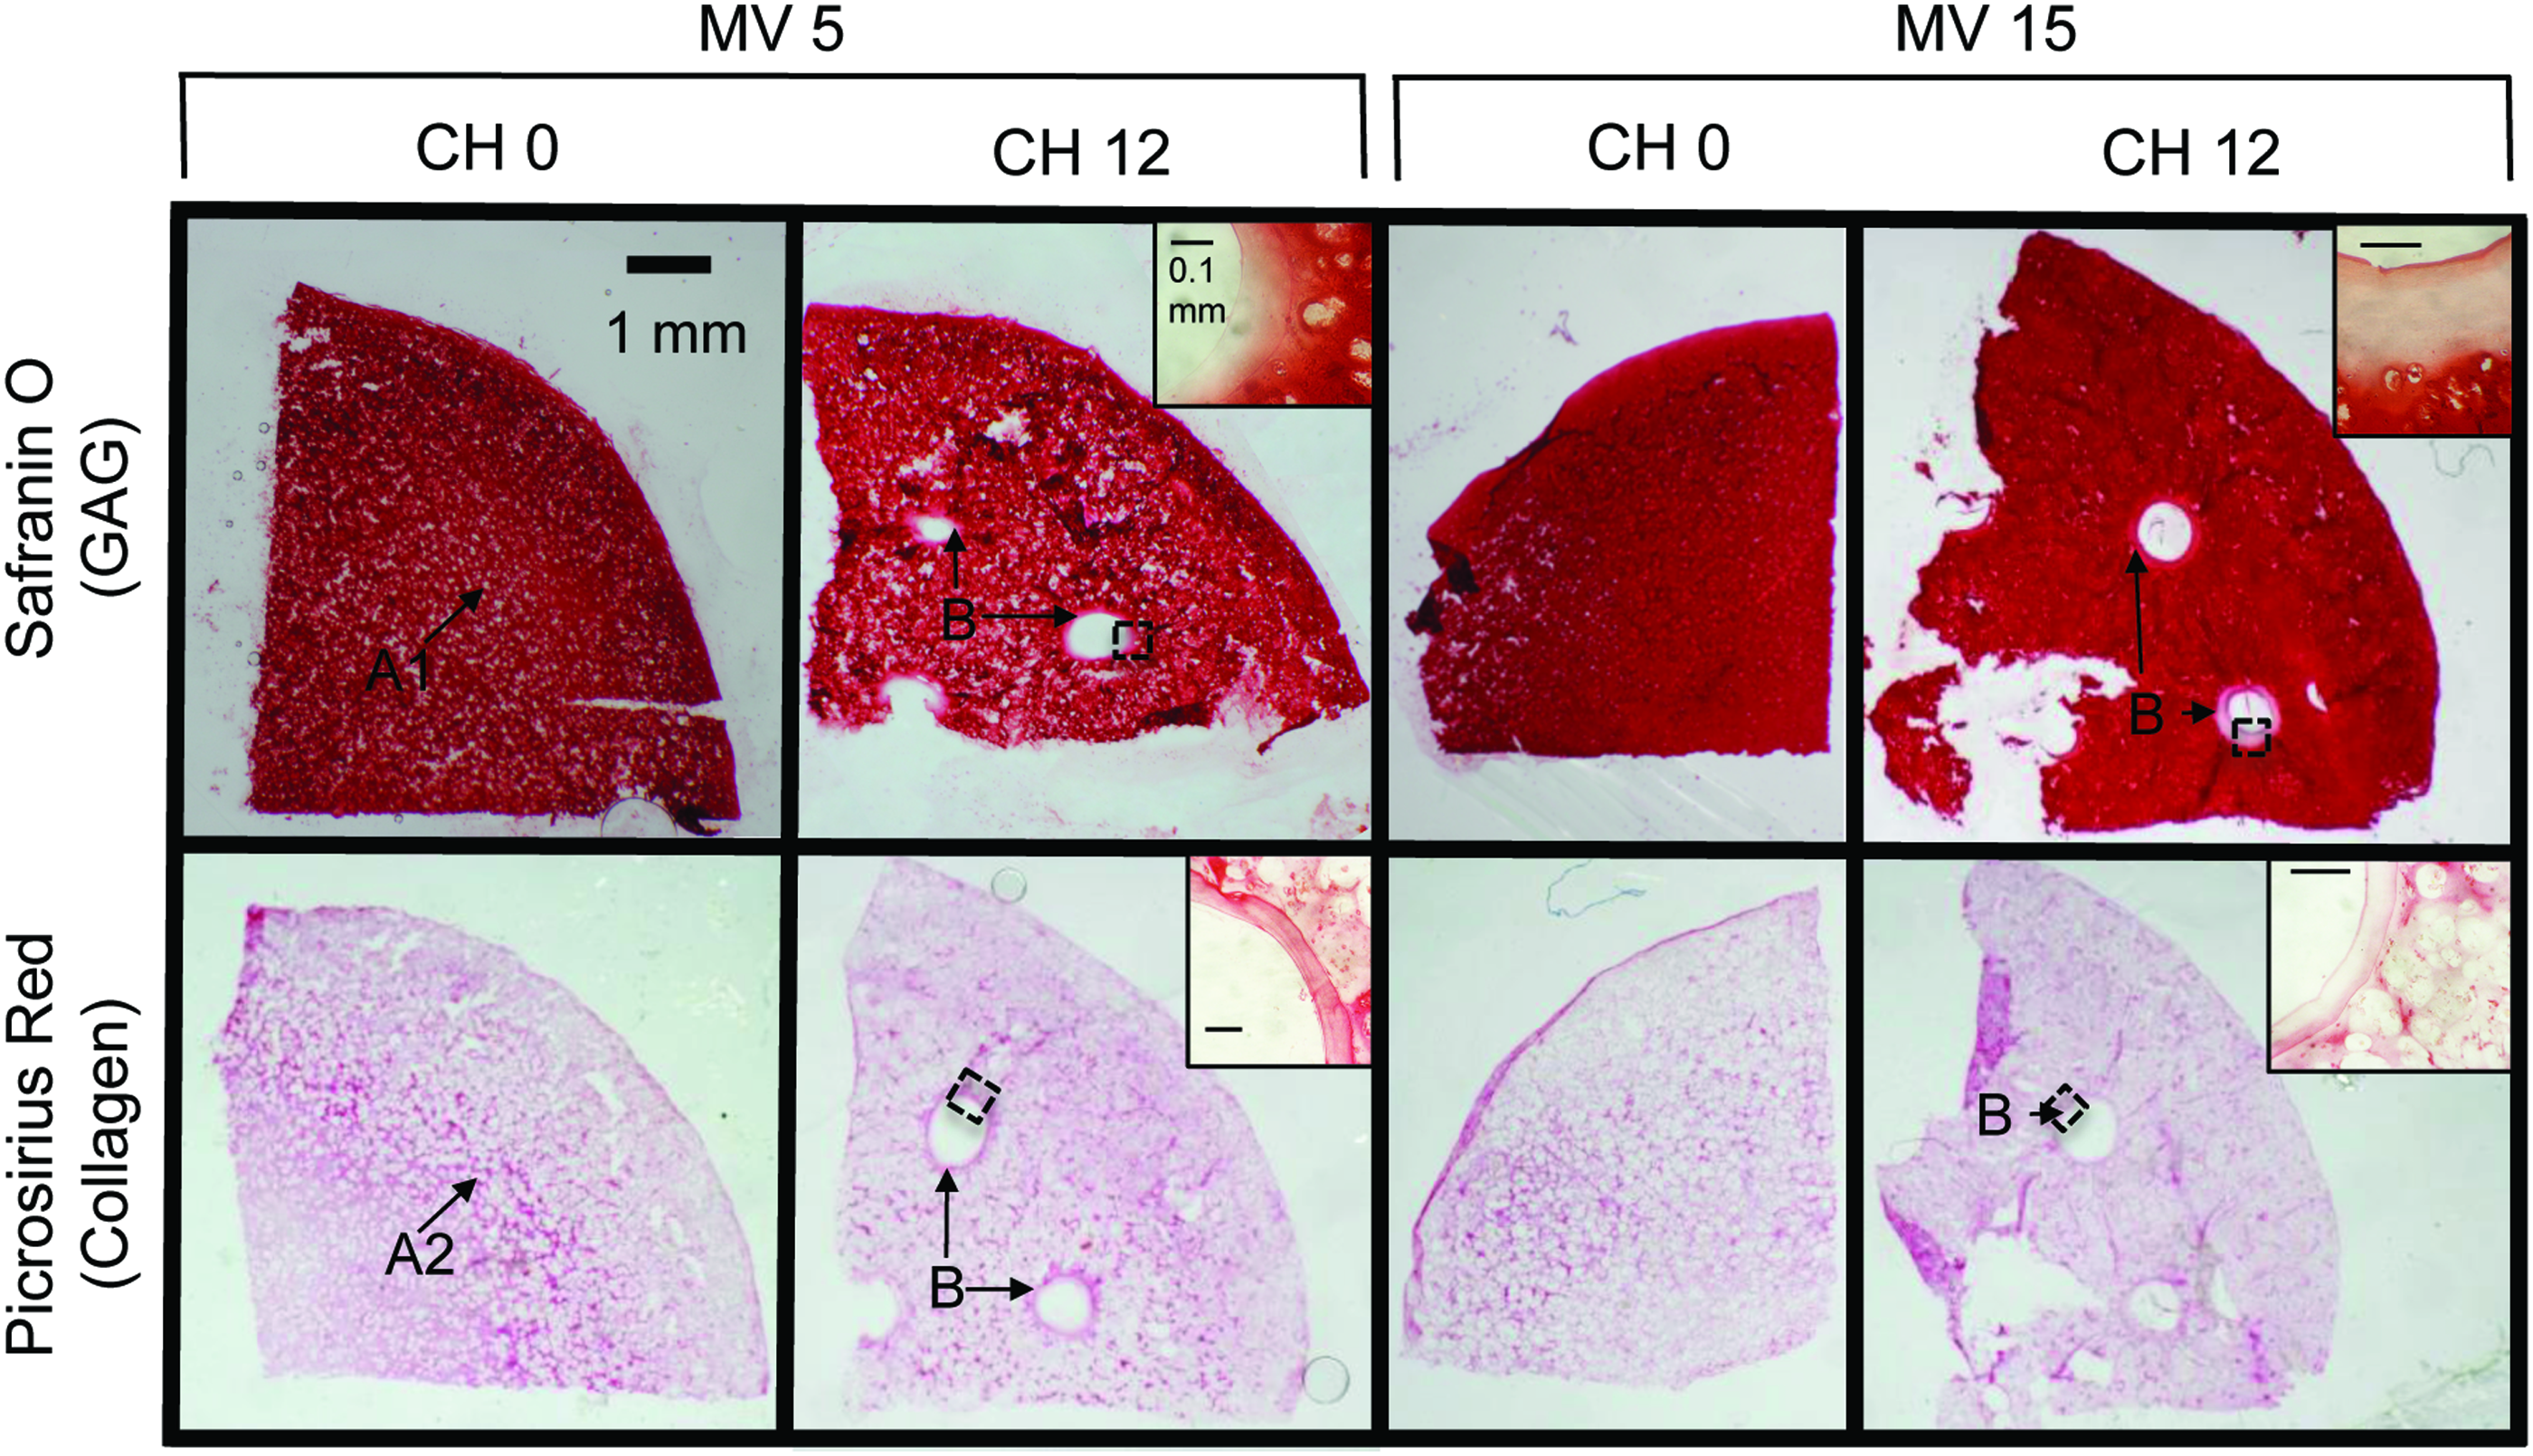
Histological analysis of CH 0 and 12 and MV 5 and 15 samples. GAG (Safranin O) and collagen (Picrosirius red) staining in the CH 0 and 12 groups for the MV 5 or MV 15 mL media supplementation volumes. Representative perichannel images are included (inset) for the salient CH 12 images. Arrow A: banding in GAG (A1) and collagen (A2) in CH 0 group. Arrow B: channel GAG and collagen. Scale bar 1 mm for bulk construct images and 100 μm for enhanced inset image. Color images available online at
Channel filling (Table 3) was significantly higher in the CH 12 group compared to CH 3 (p=0.017), while MV had no significant effect (p=0.104).
Percentage channel filling is evaluated relative to day 0 channel area 0.785 mm2 (based on a ∅1 mm channel).
Denotes differences between indicated groups (p<0.05).
Discussion
The objective of this study was to formulate and validate system-specific computational models for estimating nutrient supplies needed to culture large engineered tissues, with or without nutrient channels. Based on our recent investigations, which reported the glucose threshold necessary for matrix synthesis and a representative glucose consumption rate in our CTE system,21,22 we focused on the availability of glucose as an essential nutrient. Predictions from the simulations indicated that standard media/cell ratios used in studies of smaller constructs (Table 1) may be inadequate for culturing larger constructs, and that channel incorporation alone would not ameliorate this nutrient depletion. According to the models, a higher MV would be required for maximal matrix elaboration and greater effectiveness of nutrient channels, as related to glucose.
With this guidance, constructs (CH 0, 3, 12) were experimentally cultured at standard (MV 5 per ∅10×2.34 mm construct) or elevated (MV 10 and 15) MV, to investigate the validity of computational predictions. Prior investigations of this culture system with constructs of this size or smaller have demonstrated that chondrocytes maintain their morphology throughout the construct.14,37–40 When examining total matrix elaboration, as represented by D0ww-normalized compositional measures in Figure 5, increasing MV produced significantly greater ECM deposition (GAG and collagen, Fig. 5D, F); these quantitative measures were further corroborated qualitatively by the more intense Safranin O staining of the MV 15 groups, compared to MV 5 (Fig. 7). Nutrient channels further increased ECM deposition, with the most dramatic CH-induced enhancements evident in the presence of high MV (Fig. 5D, F). These experimental results supported the model predictions that standard media/cell levels produced suboptimal matrix synthesis and that channels at standard media levels do not demonstrate much effectiveness for larger constructs.
While the GAG and collagen content normalized by D0ww illustrated differences in ECM synthesis as a function of MV and CH, these differences were not evident when using the more conventional normalization to ww on the last day of culture (D56ww). Indeed, although greater matrix synthesis was observed with increasing MV and CH, EY showed no significant differences among the groups (Fig. 5A), presumably because their variable swelling (Fig. 5B) maintained the fixed-charge density of GAGs at a nearly uniform level (Fig. 5C).
In prior studies, we have noted that our CTE system is able to produce GAG at native levels (∼6% ww for immature bovine cartilage), but that collagen remains significantly below native values (∼10% ww), as was observed here (∼7% D56ww GAG in Fig. 5C and ∼1.5% D56ww collagen in Fig. 5E). Interestingly, day 0 normalizations suggest that the amount of collagen actually synthesized (almost ∼6% D0ww in Fig. 5F for the MV 15/CH 12 group) could produce weight ratios closer to native levels, were it not for the substantial swelling (Fig. 5B) driven by the Donnan osmotic pressure from charged GAG.41–43 These results support the value of strategies using exogenous treatments such as lysyl oxidase to strengthen the collagen network by increasing collagen cross-link precursors and to prevent the swelling evident in this study. 44
In prior studies of this model system, 45 it had been suggested that the higher deposition of GAG might inhibit collagen deposition, possibly due to a steric effect. Histological stains from this study support this hypothesis (Fig. 7), especially around channel edges, where a greater proportion of synthesized GAGs may diffuse into the channel due to their natural time constant for binding with the scaffold, 21 allowing for a more intense ring of deposited collagen. This hypothesis had previously motivated alternative strategies for enhancing collagen deposition by using chondroitinase ABC to enzymatically remove GAG and quell construct swelling. 46
The amount of glucose available in the culture media was adjusted by changing the MV per construct instead of modifying the glucose concentration. This choice was motivated by the desire to maintain the glucose concentration at the standard 25 mM of high-glucose DMEM and the concern that large changes in concentration might produce confounding effects due to alterations in osmolality and pH.10,47
Another potential concern is that large numbers of channels may compromise the construct mechanical integrity, possibly leading to stress concentrations and cracking under loading. No cracking was observed during mechanical testing on day 56, although the possibility that such damage may occur at physiological load magnitudes should not be discounted. In native cartilage, the network of channels that irrigates the tissue during development and through adolescence eventually disappears. A process whereby channels completely occlude at the time of construct maturation would be similarly beneficial; by day 56 of this study, channels filled by approximately 75% (Table 3), suggesting that complete filling may occur at a later time point. Depending on the level of elaboration of functional properties in the construct, ensuring free flow of media in the channels for longer culture durations may require periodic material removal. Alternatively, strategies may be needed, such as the injection of cell-seeded agarose, to completely fill channels before implantation.
The computational model employed herein builds from earlier efforts to model engineered cartilage nutrient consumption25,47–51 and serves as a critical step to develop system-specific models for assessing the culture of the characterized CTE systems. Models may similarly guide future studies by identifying the most promising experimental culture conditions for a given construct geometry and cell density, eliminating less promising ones, and reducing the need for labor- and cost-intensive experimental parametric studies.
While the model here provided insight on the culture of large constructs, subsequent models may be considerably improved in future implementations. Under the current framework, the model predicted that all CH groups within the MV 15 group should produce similar matrix levels. Experimental results, however, demonstrated that for MV 15 groups, CH was a significant factor influencing the ECM content, suggesting that additional factors may need to be modeled to account for these observations.25,49 Channels also increased the total construct cell content (Fig. 5H), implying that channels in constructs may act both to increase nutrient availability and enhance the synthesis capacity of the constructs. Thus, cellular proliferation may need to be incorporated into future growth models when simulating multiple weeks of culture.52,53 In addition, early matrix synthesis models implicated oxygen as a limiting nutrient,17,49,50 and recently, our laboratory has shown that active TGF-β binds extensively to the native ECM suggesting potential transport limitations within engineered constructs. 54 Therefore, the transport, binding, consumption, and biosynthetic influence of oxygen and TGF-β may need to be included explicitly in future models. Construct swelling, resulting from ECM synthesis and Donnan osmotic pressure, may also need to be modeled to better reproduce observed phenomena (Figs. 5B, H, and 6). With these improved models, it will become possible to optimize the placement and density of channels for growing full-sized engineered cartilage layers, recognizing the competition between increasing the number of channels to enhance nutrient access and reducing the number of cells available for matrix synthesis.
In summary, computational models are becoming increasingly valuable tools for designing effective culture conditions for engineering large tissue constructs. This study specifically addressed the amount of glucose in our [juvenile bovine chondrocyte]–[agarose gel] CTE system, as a wide range of media and glucose supply rates have been employed in prior studies (Table 1), illustrating the lack of consensus on adequate amounts of this fundamental nutrient. It was found computationally that conventional culture conditions provide inadequate glucose levels for culturing larger constructs, obviating the benefits of nutrient channels. Experimental results demonstrated that significantly enhanced matrix deposition in channeled constructs could be achieved when using higher MV supplementation (Figs. 5D, F, and 6). This agreement between model prediction and subsequent experimentation encourages further development and validation of predictive models, including models that account for a broader set of nutrients, cell proliferation, matrix synthesis, and swelling of the constructs. These more sophisticated models may be subjected to more stringent quantitative validations of a variety of measures, including matrix composition, mechanical properties, and dimensional changes.
Footnotes
Acknowledgment
Research reported in this publication was supported by the National Institute of Arthritis and Musculoskeletal and Skin Diseases of the National Institutes of Health under Award Numbers R01AR060361, R01AR046568, T32AR059038, 2R01DE016525, and 2P41EB002520. The content is solely the responsibility of the authors and does not necessarily represent the official views of the National Institutes of Health.
Disclosure Statement
The authors have no competing financial interests.