
Abstract
Abdominal aortic aneurysms (AAA) represent abnormal aortal expansions that result from chronic proteolytic breakdown of elastin and collagen fibers by matrix metalloproteases. Poor elastogenesis by adult vascular smooth muscle cells (SMCs) limits regenerative repair of elastic fibers, critical for AAA growth arrest. Toward overcoming these limitations, we recently demonstrated significant elastogenesis by bone marrow mesenchymal stem cell-derived SMCs (BM-SMCs) and their proelastogenesis and antiproteolytic effects on rat aneurysmal SMCs (EaRASMCs). We currently investigate the effects of super paramagnetic iron oxide nanoparticle (SPION) labeling of BM-SMCs, necessary to magnetically guide them to the AAA wall, on their functional benefits. Our results indicate that SPION-labeling is noncytotoxic and does not adversely impact the phenotype and elastogenesis by BM-SMCs. In addition, SPION-BM-SMCs showed no changes in the ability of the BM-SMCs to stimulate elastin regeneration and attenuate proteolytic activity by EaRASMCs. Together, our results are promising toward the utility of SPIONs for magnetic targeting of BM-SMCs for in situ AAA regenerative repair.
Introduction
A
The involvement of stem cells and stem cell-derived SMCs in morphogenesis 8 and tissue repair, 9 the only physiologic events where robust vascular elastogenesis is observed, suggests their higher capacity for elastogenesis versus adult SMCs. Previously, 10 we showed that rat bone marrow mesenchymal stem cell (BM-MSC)-derived SMCs (BM-SMCs) significantly stimulate synthesis of crosslinked elastic matrix and attenuate matrilysis in rat aneurysmal SMCs (EaRASMCs). 10 We now seek to enable their targeted delivery to AAA tissue for regenerative benefit.
The rapid development of strong permanent magnet materials makes feasible magnetic targeting of super paramagnetic iron oxide nanoparticle (SPION)-labeled cells to deep tissues in the human body, such as the aorta, even in the presence of high shear blood flow, and to track their retention and biodistribution using magnetic resonance imaging (MRI)—or computed tomography. 11 As the first step, in this study, we assessed viability of SPION-labeled BM-SMCs, their responsiveness to an externally applied magnetic field for improved uptake into a matrix-disrupted aortic wall, and their ability to maintain their previously demonstrated functional benefits upon SPION-labeling. 10
Materials and Methods
Isolation and culture of SMCs from elastase infusion-induced rat AAAs
Animal procedures were approved by the IACUC at the Cleveland Clinic. EaRASMCs were isolated from the infrarenal abdominal aortae of young adult male Sprague–Dawley rats (200 g) (n = 3) at 14-days post AAA induction by porcine pancreatic elastase (20 U/mL; Worthington) infusion. 12 The AAA segments were harvested and minced and digested with type II collagenase (175 U/mL; Worthington) and porcine pancreatic elastase (3 U/mL; Sigma-Aldrich) to isolate the primary EaRASMCs. 6 Primary cells from the three rats were pooled, passaged, and characterized. 6 Similarly, control healthy rat aortic SMCs (RASMCs) were isolated from healthy adult rats (n = 3). 6 The primary cells were cultured for 2 weeks in Dulbecco's modified Eagle's medium-F12 (Invitrogen) supplemented with 10% v/v fetal bovine serum (FBS; Invitrogen) and 1% v/v penicillin–streptomycin (Penstrep; Thermo Fisher) and passaged before use.
Differentiation of rat BM-MSCs into BM-SMCs
Rat BM-MSCs were differentiated into BM-SMCs using our published methods. 10 BM-MSCs (Invitrogen; 2 × 10⁴ cells/10-cm2) were cultured to confluence in low-glucose (1 g/L) DMEM (Invitrogen) containing 10% v/v MSC-qualified FBS (Invitrogen) and 1% v/v Penstrep. The cells were reseeded (2 × 10⁴ cells/cm2) on human fibronectin-coated plastic (BD Biosciences), differentiated in a medium containing 2.5 ng/mL transforming growth factor-beta1 (TGF-β1; Peprotech) for 6 days, and then propagated for 5 days in high-glucose (4.5 g/L) DMEM (Invitrogen) containing 10% v/v FBS (Invitrogen), 1% v/v Penstrep, 2.5 ng/mL of TGF-β1, and 5 ng/mL of platelet derived growth factor (R&D Systems). The derived BM-SMCs were propagated in DMEM-F12 containing 10% v/v FBS and then passaged.
Labeling BM-SMCs with SPIONs
BM-SMCs were labeled with neutrally charged SPIONs (fluidMAG-D; mean diameter = 50 nm; Chemicell GmBH) per Riegler et al. 13 BM-SMCs (3 × 10⁴ cells/well) were cultured in six-well plates for 48 h, serum starved (2 h), and then incubated for 24 h in DMEM-F12 medium containing 10% v/v FBS, 375 ng/mL of poly-L-lysine (Sigma-Aldrich), and SPIONs (0.2, 0.5, and 1.0 mg/mL).13–15
Assessing cell uptake and cytotoxicity of SPIONs
SPION-uptake by BM-SMCs was confirmed by Prussian blue staining.15,16 BM-SMCs were cultured on glass coverslips, labeled with SPIONs (0.2, 0.5, and 1.0 mg/mL), washed, and incubated with an iron- and Nuclear Fast Red-stains (Scytek Labs). The cell layers were rinsed with a decreasing ethanol gradient and xylene, mounted with Entellan® (Merck KGaA), and visualized with light microscopy.
SPION effects on BM-SMC viability were assessed using the LIVE/DEAD® assay (Invitrogen) 17 ; unlabeled BM-SMCs served as the control. The cells were visualized using fluorescence (Model IX51; Olympus America). The cytotoxicity of SPIONs was further confirmed by the lactate dehydrogenase (LDH) assay (Thermo Fisher). 18 LDH activity in cells at the highest SPION dosage (1 mg/mL) was determined as per the manufacturer's instructions.
Determining magnetic responsiveness of SPION-labeled BM-SMCs
The responsiveness of SPION-BM-SMCs to a constant magnetic field gradient, applied orthogonal to gravity, 19 was estimated using cell tracking velocimetry (CTV) as per Zborowski and colleagues. 20 SPION-BM-SMCs (0.2, 0.5 and 1.0 mg/mL) were washed with sterile phosphate-buffered saline (PBS; Sigma-Aldrich) and resuspended at 2 × 10⁶ cells/mL of culture medium. The cells were injected, using a 5-mL syringe connected to PEEK tubing, into the flow chamber (1.0 mm I.D, square borosilicate glass channel; Vitrocom) of the CTV apparatus (in the z-direction), perpendicular to gravity (x-direction). Valves on both sides of the flow chamber were closed and residual fluid motions allowed to completely dampen. SPION-BM-SMC motion within the flow chamber was recorded using a microscope with a 5× objective (Model BHMJ; Olympus). ImageView® software tracked the cells (400–1000/sample) between frames using algorithms to obtain a linear fit of location versus time data, to calculate velocities of individual cells. The magnetophoretic mobility of cells was calculated as cell velocity divided by the magnitude of the applied magnetic field gradient. 19
Impact of magnetic targeting on BM-SMC uptake into vessel wall
Improved BM-SMC uptake into the vessel wall upon magnetic targeting was assessed ex vivo within matrix-disrupted porcine carotids (Lampire Biological Labs). The arteries were de-endothelialized using a guide wire, intraluminally infused with 20 U/mL porcine pancreatic elastase (Sigma-Aldrich) using a Scimed 5F catheter (SCIMED Life System) for 20 min at 37°C to disrupt the aortal elastic matrix, and then rinsed with sterile PBS.
SPION-BM-SMCs (1 × 10⁶ cells/mL) were labeled with VivoTrack 680 (Perkin Elmer; 0.5 mg/mL, 15 min) and then infused into the carotid lumen at 15 × 106 cells/mL using a Scimed 5F catheter, with the distal end clamped. BM-SMCs were infused into control carotids. The test artery alone was exposed to a permanent NdFeB magnet (CMS Magnetics) for 40 min. 13 The arteries were then flushed repeatedly with PBS to remove loosely adherent cells. Image J® analysis of whole tissue images (Bruker Xtreme®) quantified relative fluorescence across the vessel length. Results were plotted as mean fluorescence versus axial distance from point of cell infusion. The carotids were opened lengthwise and fluorescence signal distribution visualized using a laser-based scanning system (LI-COR Odyssey®).
Impact of SPION-labeling on phenotype and elastogenesis by BM-SMCs
SPION-labeled (0.5 mg/mL) and -unlabeled BM-SMCs were cultured in six-well plates (3 × 10⁴ cells/well) for 14 and 21 days, respectively, for comparing their phenotype (real time–polymerase chain reaction [RT-PCR], western blot) and elastogenesis (Fastin assay) as described subsequently.
Impact of SPION-labeling on paracrine effects of BM-SMCs on cocultured EaRASMCs
The paracrine effects of SPION-labeled and -unlabeled BM-SMCs on elastogenesis by EaRASMCs were determined in transwell cocultures. 10 EaRASMCs were seeded within wells of six-well plates (3 × 10⁴ cells/well) and maintained for 21 days in standalone culture (control) or in noncontact coculture with BM-SMCs and SPION-BM-SMCs similarly seeded within PET-transwell inserts (pore size = 1 μm; Greiner Bio-One). The EaRASMCs were subsequently harvested for analysis.
Quantitative RT-PCR analysis
RT-PCR assessed the gene expression profile in (1) BM-SMCs upon SPION-labeling and (2) EaRASMCs upon coculture with SPION-labeled and -unlabeled BM-SMCs.13,14 We investigated SMC-phenotypic marker protein genes (α-smooth muscle actin [ACTA2], caldesmon [CALD1], smoothelin [SMTN], and smooth muscle myosin heavy chain [MYH11]), genes for proteins involved in elastic fiber assembly (tropoelastin [ELN], fibrillin-1 [FBN1], lysyl oxidase [LOX], fibulin-4 [EFEMP2], fibulin-5 [FBLN5]), and genes for elastolytic MMPs (MMP2 and MMP9), collagen type I (COL1A1), and tissue inhibitors of MMP1 (TIMP-1). Cell layers were analyzed at 14 days (SPION-BM-SMCs vs. BM-SMCs and RASMCs) or 21 days (EaRASMCs cultured standalone vs. in coculture with SPION-BM-SMCs or BM-SMCs) of culture. RNA was isolated, quantified, and RT-PCR was carried out on equal amounts of RNA reverse transcribed, as published21–23 ; primer sequences are indicated in Table 1. Results were analyzed by a linear regression of efficiency method 24 using a Matlab code. 25 The resulting copy number for each group was normalized to its corresponding 18s ribosomal RNA (18S) and reported as relative fluorescence units (RFU).
SMC, smooth muscle cells.
Western blots
Differences in synthesis of SMC phenotype marker proteins between BM-SMC groups and also MMP2 protein by EaRASMCs in standalone culture or in cocultures were semi-quantitatively analyzed by western blotting.10,17 Primary antibodies for SMA, SM22, Smoothelin, MHC, MMP2 (Abcam), MMP9 (Millipore), and the housekeeping protein β-actin (Sigma-Aldrich) were used. Secondary antibodies were conjugated with either IRDye® 680LT or IRDye® 800CW (LI-COR Biosciences). Protein bands were visualized on an LI-COR Odyssey laser-based scanning system, quantified using ImageJ software, and normalized to respective β-actin bands and further to the ratio obtained for cell controls (RASMCs for SPION-labeling and EaRASMCs in paracrine effect studies).
DNA assay for cell proliferation
A fluorometric DNA assay 26 determined effects of SPION-labeling on (1) BM-SMC proliferation versus RASMCs and on (2) their paracrine effects on proliferation of cocultured EaRASMCs versus standalone EaRASMC controls. Cell counts were estimated assuming 6 pg of DNA per cell. 26
Fastin assay for elastin
Tropoelastin secreted into the medium conditioned by EaRASMCs within the wells and total elastic matrix deposited by control and cocultured EaRASMCs over 21 days were quantified using a Fastin assay (Accurate Chemical and Scientific).10,17,27 Hot oxalic acid digestion extracted soluble elastin from equal volumes of the harvested homogenized cell layers. Elastic matrix amounts measured in the extracts with the Fastin assay were normalized to the corresponding cell numbers in each group.
Immunofluorescence visualization of elastic matrix
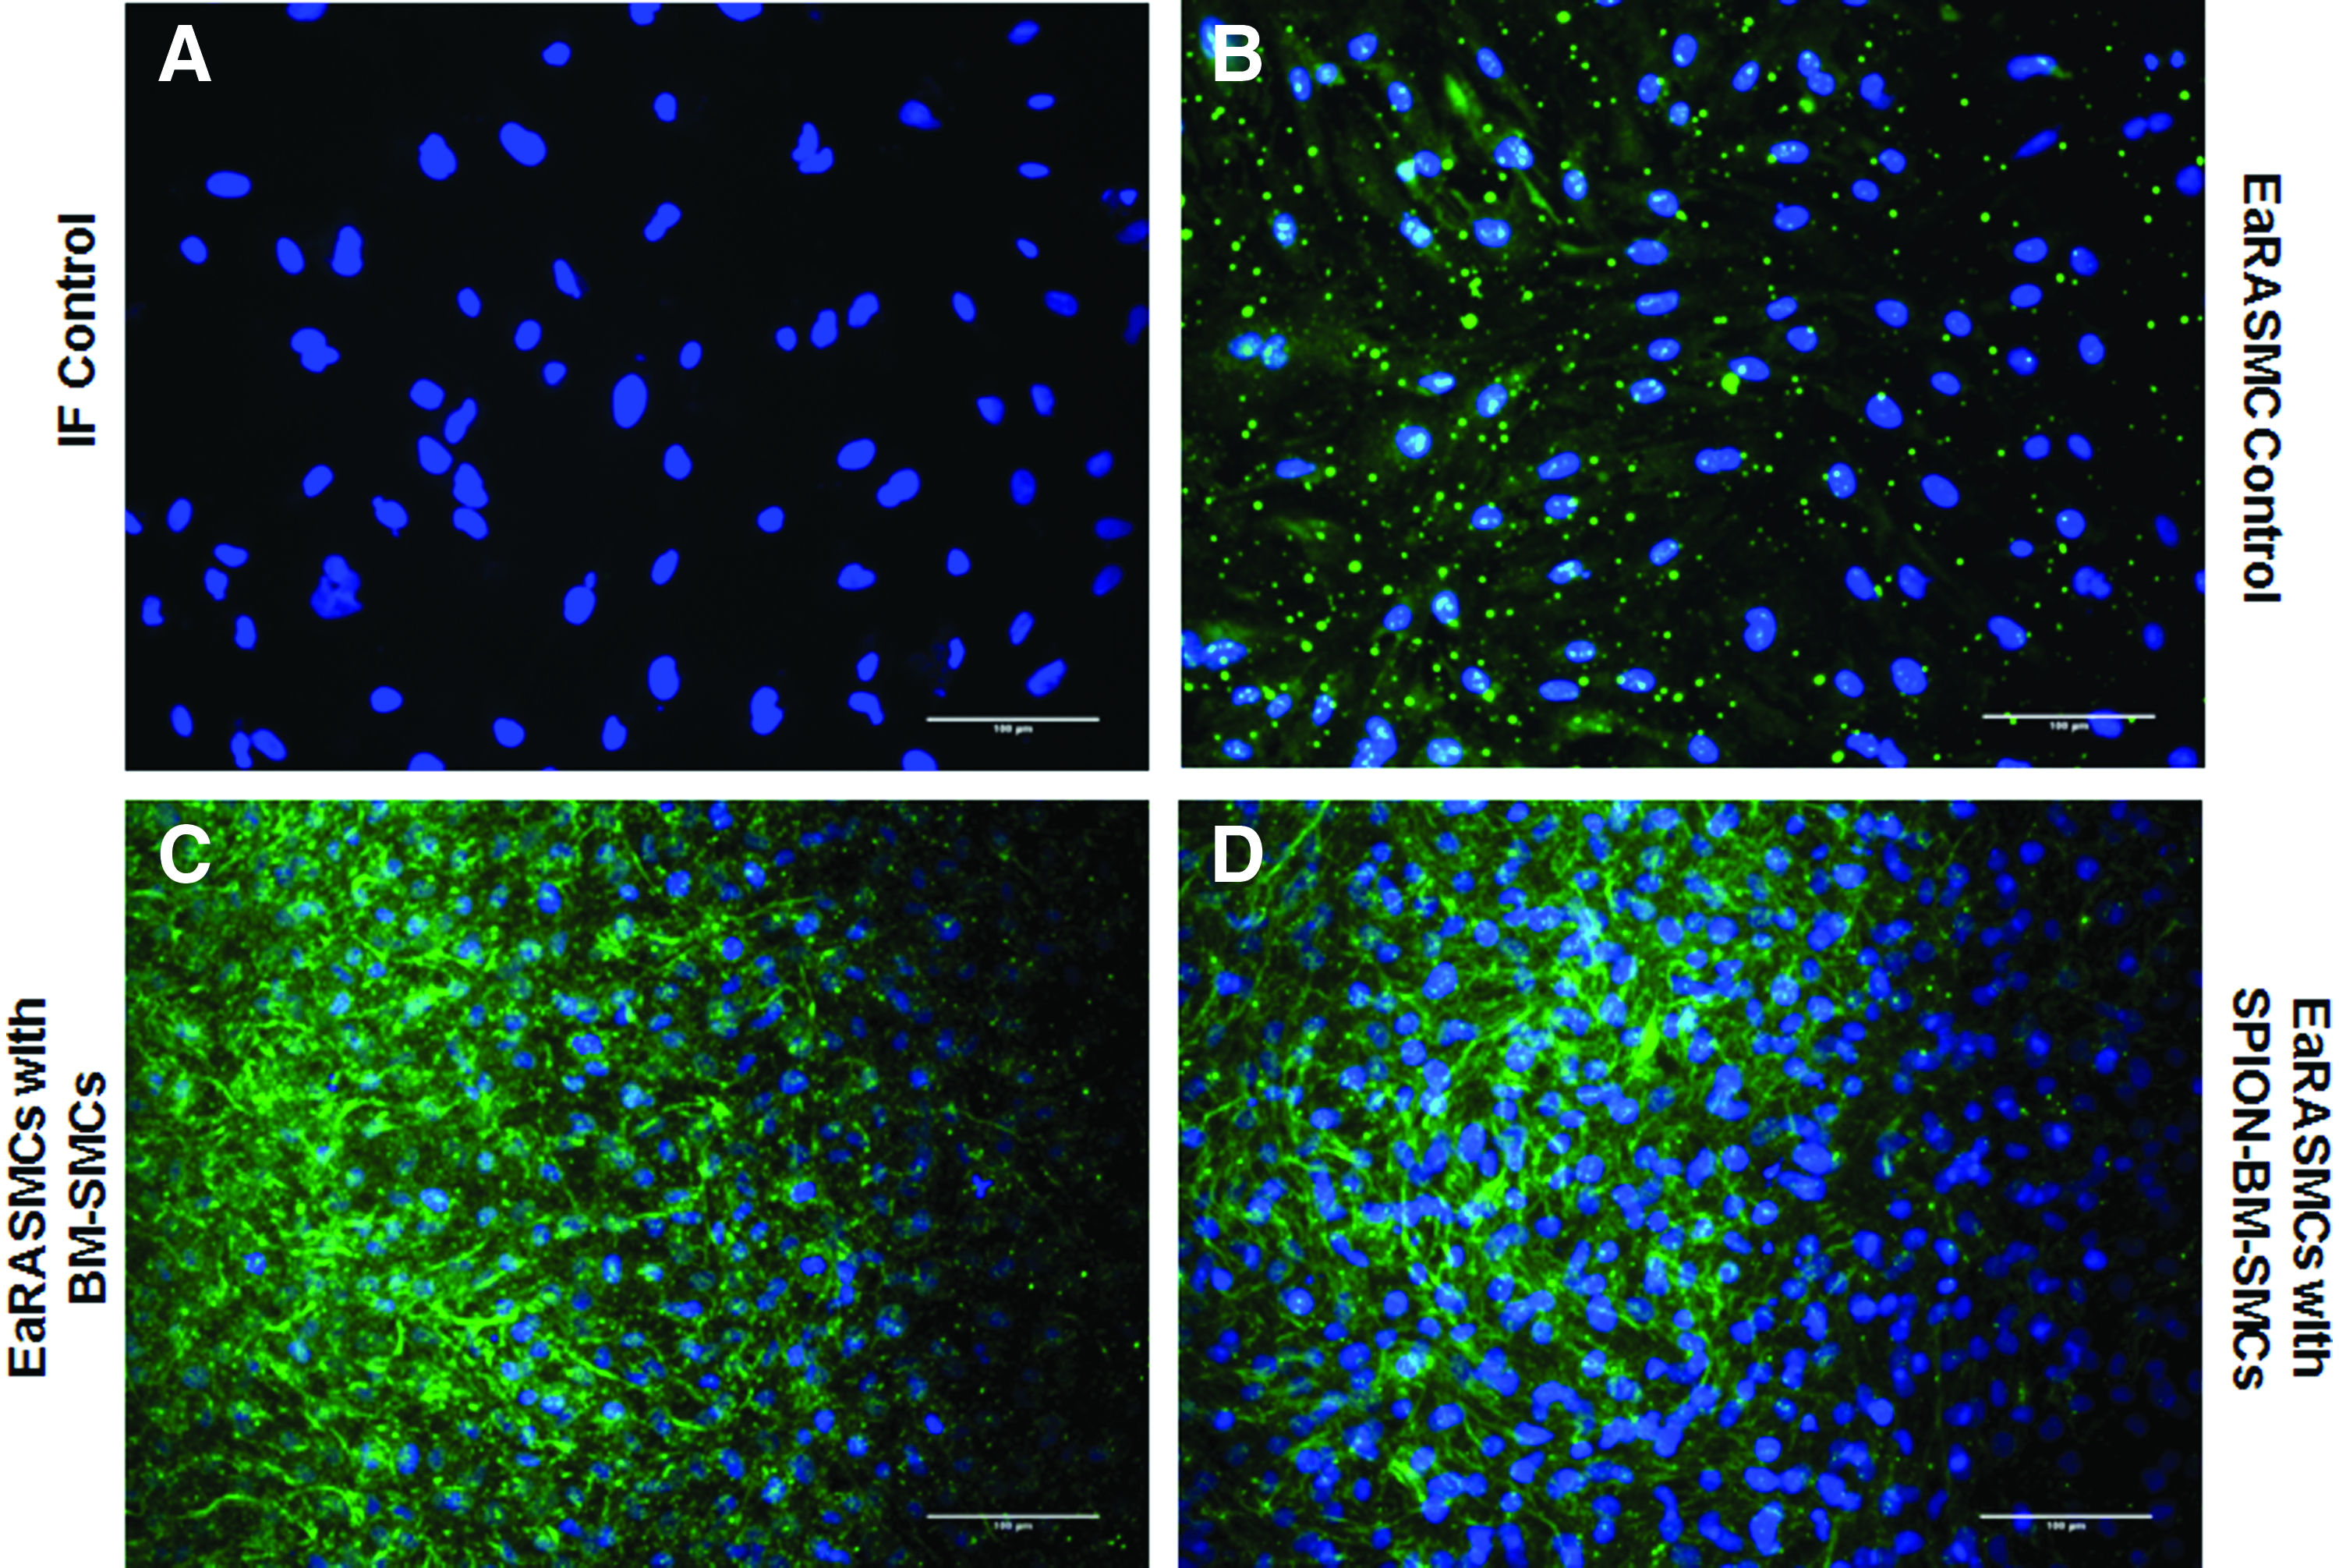
Standalone and cocultured EaRASMC layers (21 days) were fixed in cold methanol and treated with an antibody against elastin (Millipore). Elastic matrix was visualized with an Alexa488-conjugated IgG secondary antibody (Invitrogen). Cell layers were mounted with Vectashield® containing DAPI (Vector Labs) and were imaged using a fluorescence microscope.
Transmission electron microscopy
Transmission electron microscopy (TEM) compared elastic matrix ultrastructure between standalone and cocultured EaRASMC layers. As we previously published,6,7 21-day cultures within Permanox chamber slides were fixed with 2% w/v cacodylate glutaraldehyde (12 h), postfixed in 1% w/v osmium tetroxide (1 h), dehydrated in a graded ethanol series (50–100% v/v), and embedded in Epon 812 resin. The sections were mounted on copper grids, stained with uranyl acetate and lead citrate, and visualized on a Hitachi TEM (Model H7600T).
Gel zymography
Differences in enzyme activities of MMP2 and 9 between standalone (control) and cocultured EaRASMC groups were assessed by gel zymography.10,17 The MMP2 and 9 band intensities in the test cultures were normalized to that in controls for comparison.
Statistical analysis
Values shown are mean ± standard deviation (SD) from n = 6 replicate cultures/condition. A total of n = 3 replicate cultures/condition were analyzed for western blotting, gel zymography, TEM, and immunofluorescence (IF) imaging. The number of replicates was determined by power analysis 28 of our prior data 7 with cell cultures, which indicated that n = 6 replicates for biochemical assays and n = 3 replicates for western blot and zymography analyses, with three independent measurements for each parameter, sufficient to reliably detect quantitative differences in outcomes, with a power of ≥0.95. The data were analyzed using one-way ANOVA with Fisher's LSD post hoc test, and differences between groups deemed statistically significant for p-values <0.05.
Results
Impact of SPION-labeling on BM-SMCs
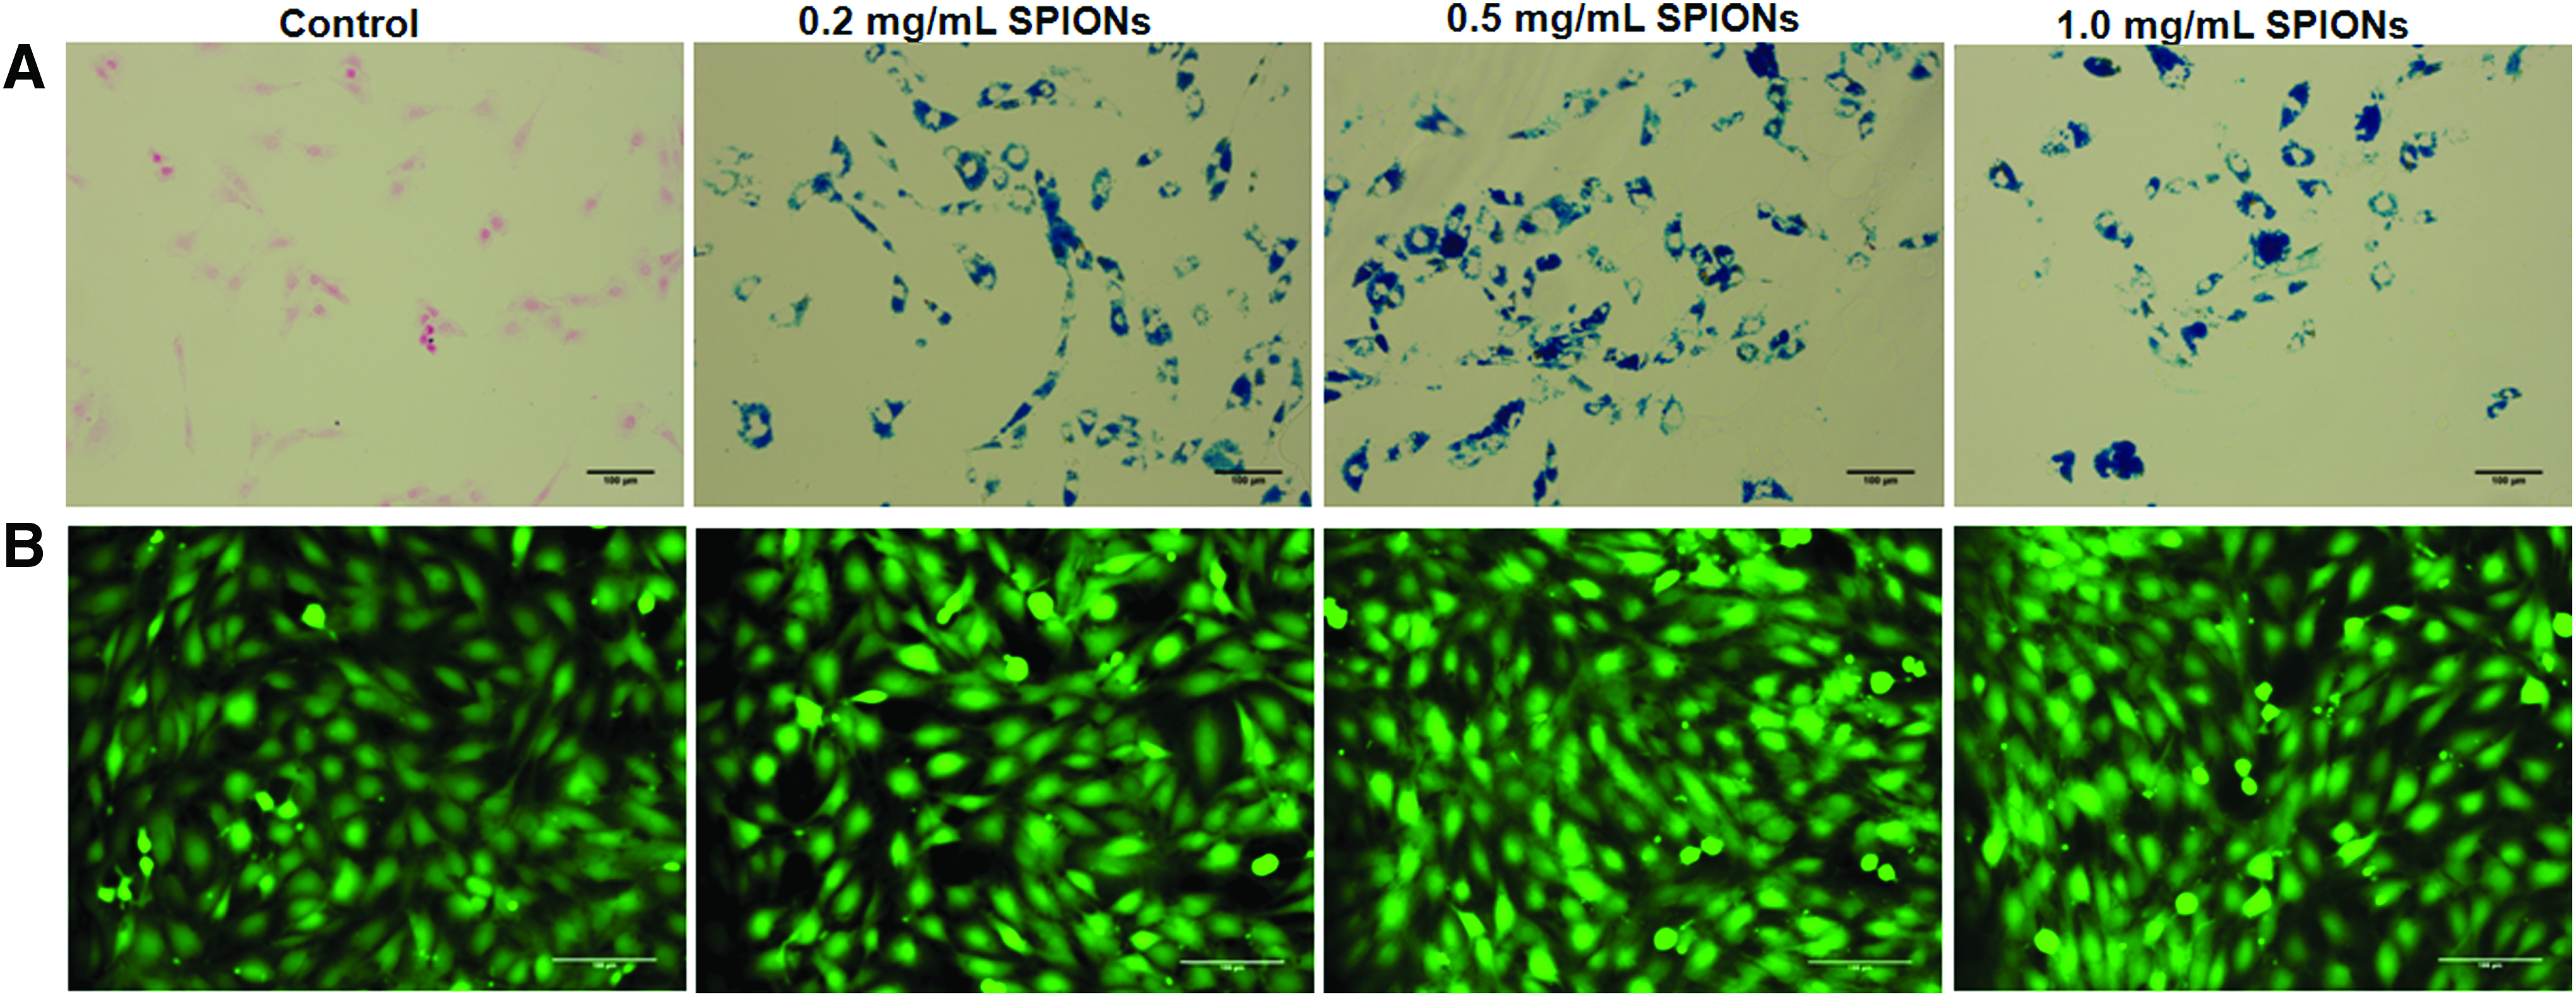
Prussian blue staining indicated significant SPION uptake by BM-SMCs at all three tested SPION concentrations, but no coloration in controls (Fig. 1A); no SPION dose-dependent differences in uptake were noted. At all SPION-labeling doses, most BM-SMCs remained viable (green; Fig. 1B). Even at the highest concentration (1 mg/mL), SPIONs were noncytotoxic to BM-SMCs (Supplementary Fig. S1; Supplementary Data are available online at
Prussian blue staining of BM-SMCs
SPION-BM-SMCs were significantly mobile even under the weak applied magnetic field (Table 2), while unlabeled BM-SMCs were immobile. Magnetic velocity of the labeled BM-SMCs increased as a function of SPION dose only up to 0.5 mg/mL; still higher SPION dosing (1 mg/mL) did not increase magnetic velocity further (p = 0.143 vs. 0.5 mg/mL).
Shown are mean ± SD of values obtained from n = 500–700 cells/sample.
BM-SMC, bone marrow mesenchymal stem cell-derived SMC; CTV, cell tracking velocimetry; SD, standard deviation; SMCs, smooth muscle cells; SPION, super paramagnetic iron oxide nanoparticle.
SPION-BM-SMCs infused in the presence of an adjoining permanent magnet showed significantly higher fluorescence indicating higher uptake and retention in the wall of matrix-disrupted porcine carotids versus unlabeled BM-SMCs infused in the absence of an applied magnetic field, while vessels not infused with any cells showed no fluorescence beyond the background (Fig. 2).

SPION-labeling of BM-SMCs in conjunction with an applied magnetic field significantly increases uptake and retention of the cells into matrix-disrupted porcine carotids upon ex vivo infusion. Representative images show successful BM-SMC labeling with infrared emitting fluorescent tracker dye (Vivotrack 680),
BM-SMC expression of genes for SMC-phenotypic markers and elastic matrix assembly proteins was unaltered (p >0.05) by SPION-labeling (Fig. 3); in both BM-SMC groups, SMTN and MYHII expression were significantly lower (p <0.05) than for RASMCs. Except for FBN1 and MMP2, expression of other genes for proteins involved in elastin homeostasis was higher in the BM-SMC cultures versus RASMCs. SPION-labeling did not alter BM-SMC synthesis of SMC phenotypic marker proteins except for SMA, which was lower in the SPION-BM-SMC cultures (p = 0.040; Fig. 4). There was also no significant difference in the β-actin-normalized protein amounts of SMA, SM22, and smoothelin for either BM-SMC group relative to RASMCs.

RT-PCR outcomes showing similar expression levels of genes for SMCs and elastic matrix homeostatic markers by both SPION-BM-SMCs (0.5 mg/mL SPIONS) and unlabeled BM-SMCs. Expression levels of all genes were normalized to expression of a reference gene (18S) and indicated as mean ± SD of RFU from n = 6 replicate cultures/condition. * indicates significant differences in gene expression between BM-SMCs or SPION-BM-SMCs versus RASMCs, deemed for p < 0.05. RAMSC, rat aortic SMCs; RFU, relative fluorescence unit; RT-PCR, real time–polymerase chain reaction.

Western blot analysis shows no difference in expression of SMC marker proteins and elastolytic MMP2 between unlabeled BM-SMCs and SPION-BM-SMCs. Shown are
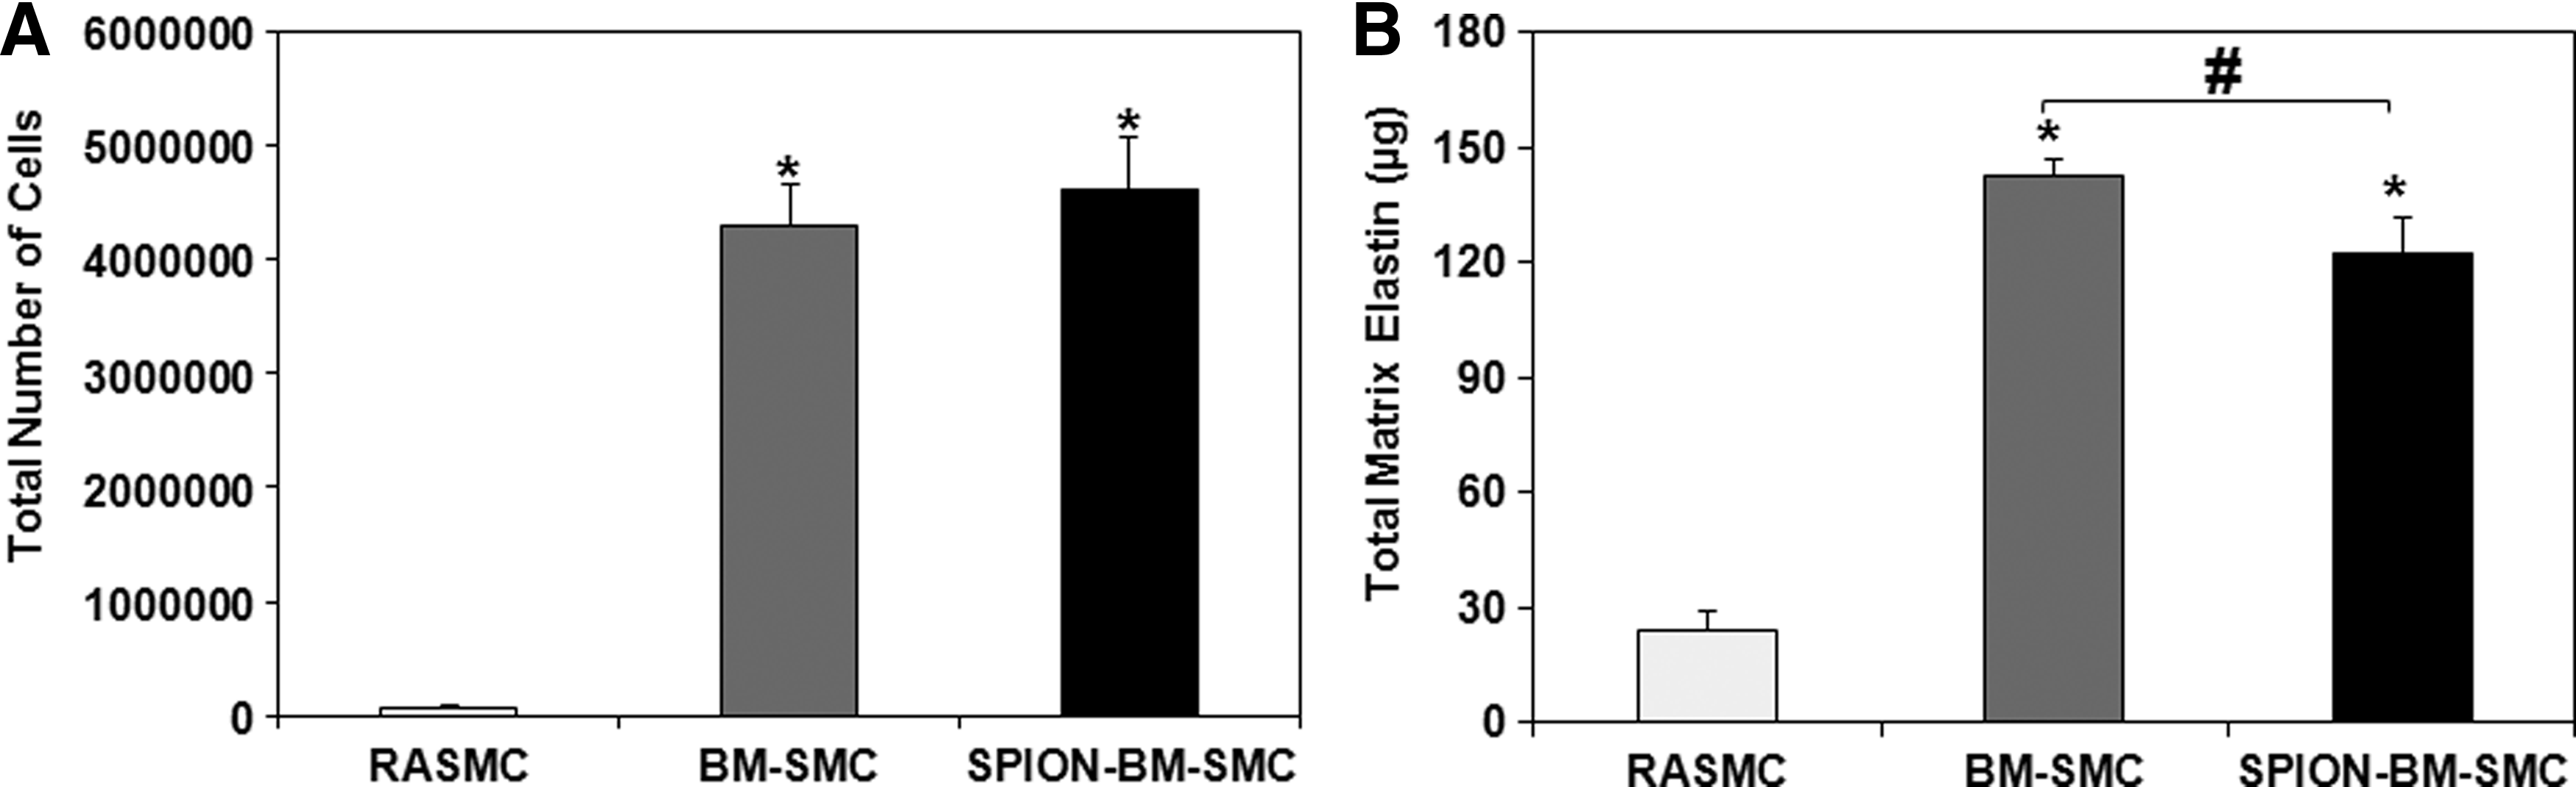
SPION-labeling did not alter the proliferation of BM-SMCs (p = 0.115 for BM-SMCs vs. SPION-BM-SMCs) (Fig. 5A). Absolute amounts of elastic matrix generated by SPION-BM-SMCs were slightly lower compared to BM-SMCs (p = 0.0001; Fig. 5B), although elastic matrix amounts generated on a per cell basis were similar (p = 0.81).
SPION-labeling modestly alters proliferation
Paracrine effects of BM-SMCs and SPION-BM-SMCs on EaRASMCs
Relative to control EaRASMCs, ELN, LOX, FBLN5, EFEMP2, and COL1A1 expression were significantly higher (p = 0.005, 0.016, 0.005, 0.005, 0.020) in EaRASMCs cocultured with BM-SMCs, while only LOX and TIMP1 were significantly higher (p = 0.012, 0.018) in EaRASMCs cocultured with SPION-BM-SMCs (Fig. 6). There were no differences in expression of elastic fiber assembly protein genes except for ELN (Fig. 6), which was slightly lower in EaRASMCs cocultured with SPION-BM-SMCs (p = 0.04). Expression of MMP genes was similar in all three EaRASMC groups (Fig. 6). Proliferation and tropoelastin synthesis were not different between control and cocultured EaRASMCs and between the cocultured EaRASMCs (Fig. 7A, B). Elastic matrix amounts deposited by the cocultured EaRASMCs were significantly higher than that by control EaRASMCs (p = 0.0001 and 0.0001 vs. BM-SMCs and SPION-BM-SMCs), both on an absolute (Fig. 7C) and a cell-normalized basis (Fig. 7D), but were not different between the two groups of cocultured EaRASMCs.
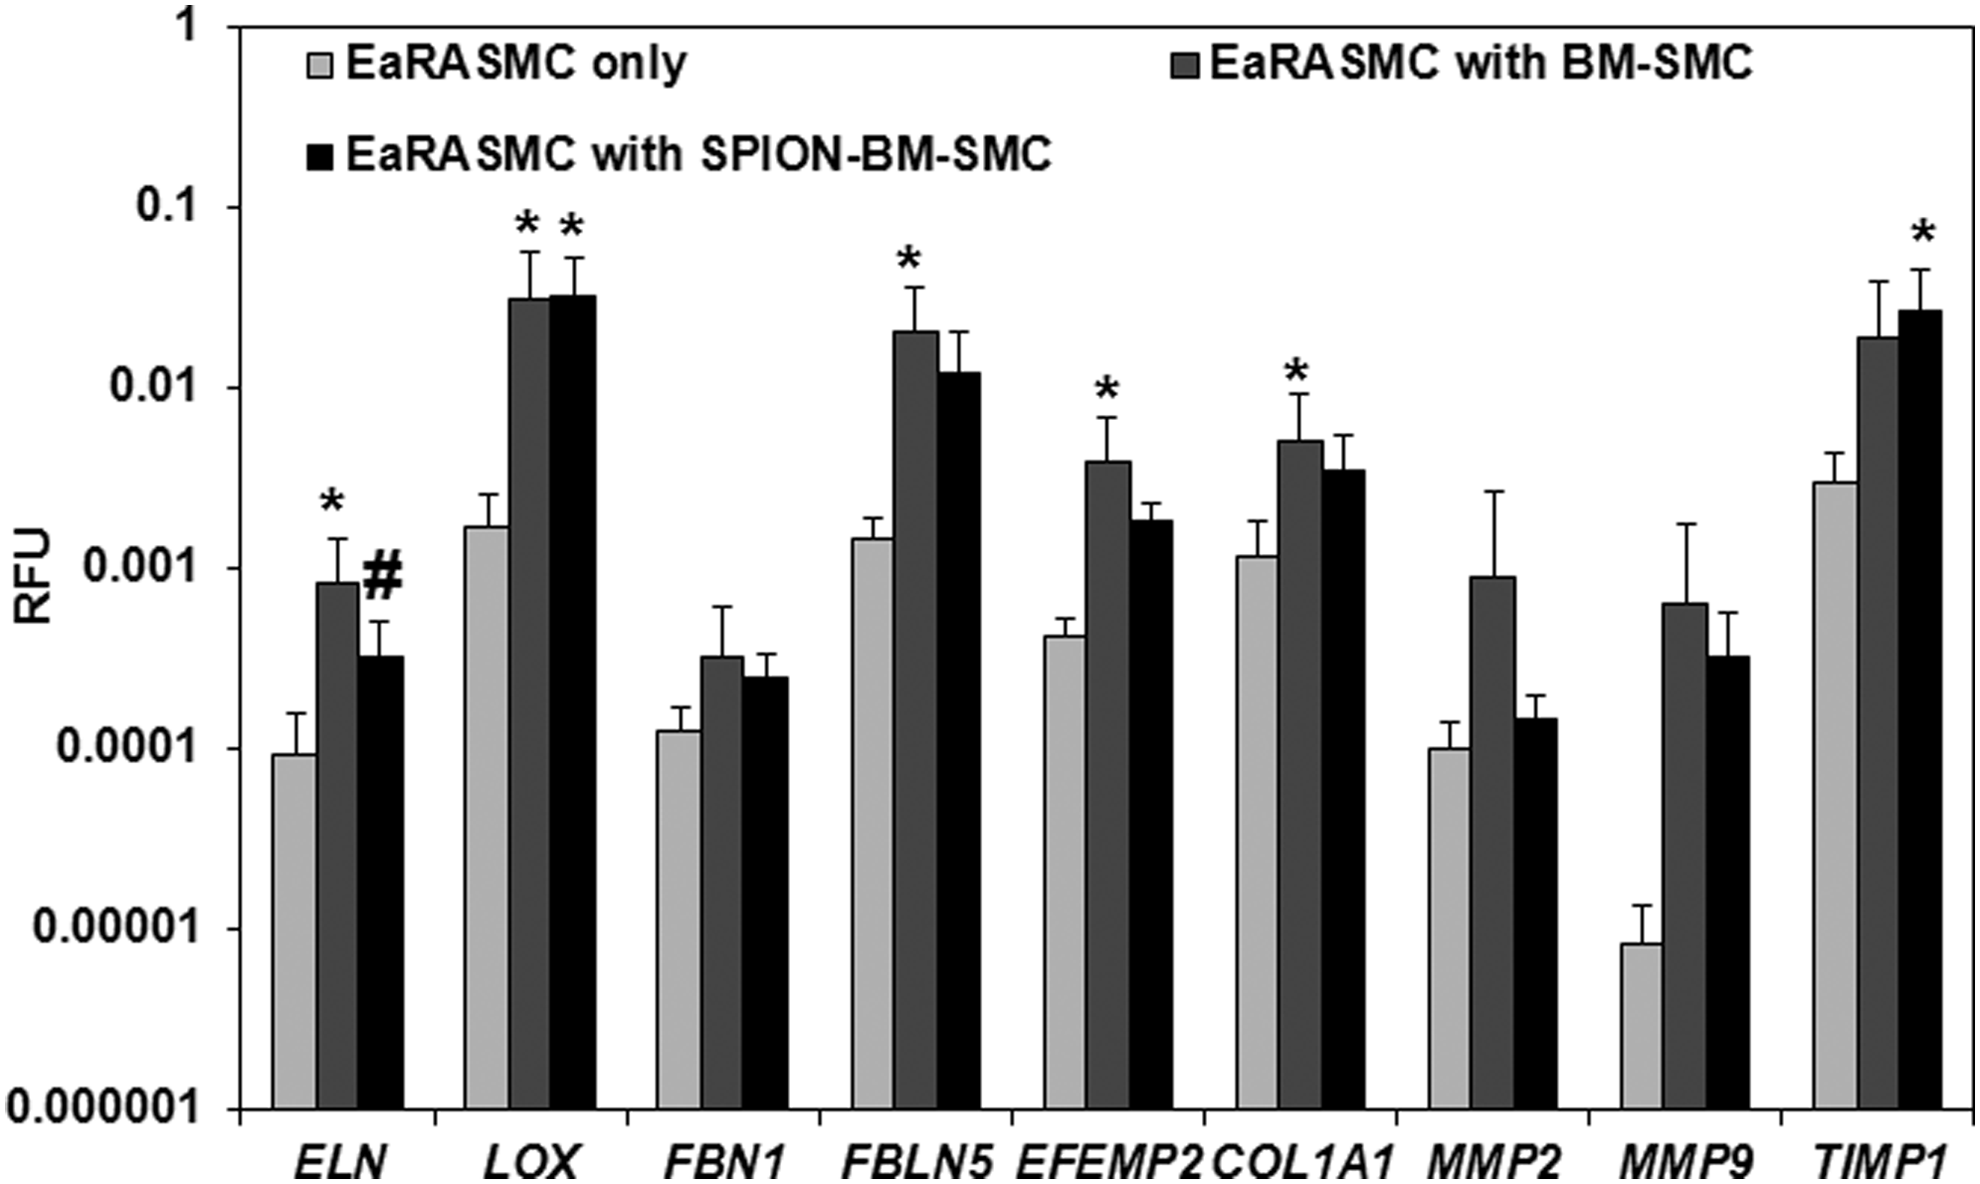
RT-PCR analysis shows increased expression of genes for elastic matrix assembly proteins by EaRASMCs cultured with BM-SMCs and SPION-BM-SMCs in real time, relative to controls (standalone EaRASMCs). No differences in gene expression were noted between EaRASMCs cocultured with BM-SMCs or SPION-BM-SMCs except for ELN. Indicated are the mean ± SD of RFU normalized to reference gene (18S) obtained by analysis of n = 6 replicate cultures/condition. * and # indicate significant differences between cocultured and control EaRASMCs and between EaRASMCs cocultured with BM-SMCs versus EaRASMCs with SPION-BM-SMCs, respectively, deemed for p < 0.05. EaRASMCs, elastic matrix and attenuate matrilysis in rat aneurysmal SMCs.

Paracrine effects of BM-SMCs on EaRASMC proliferation and matrix synthesis are unaltered by their labeling with SPIONs. Shown are proliferation ratios
Both SPION-labeled and-unlabeled BM-SMCs had no inhibitory effect on MMP2 protein synthesis by EaRASMCs (Fig. 8A) versus control, but significantly reduced MMP9 synthesis (p = 0.049 for SPION-BM-SMCs vs. control); no differences in MMP synthesis were noted between the cocultured EaRASMC groups. While only MMP9 activity was significantly reduced in EaRASMC layers cocultured with BM-SMCs (p = 0.004), both MMP2 and MMP9 activities were reduced in EaRASMCs cocultured with SPION-BM-SMCs (p = 0.038 and 0.003, respectively) (Fig. 8B). MMP activities were not different between the two groups of cocultured EaRASMCs.
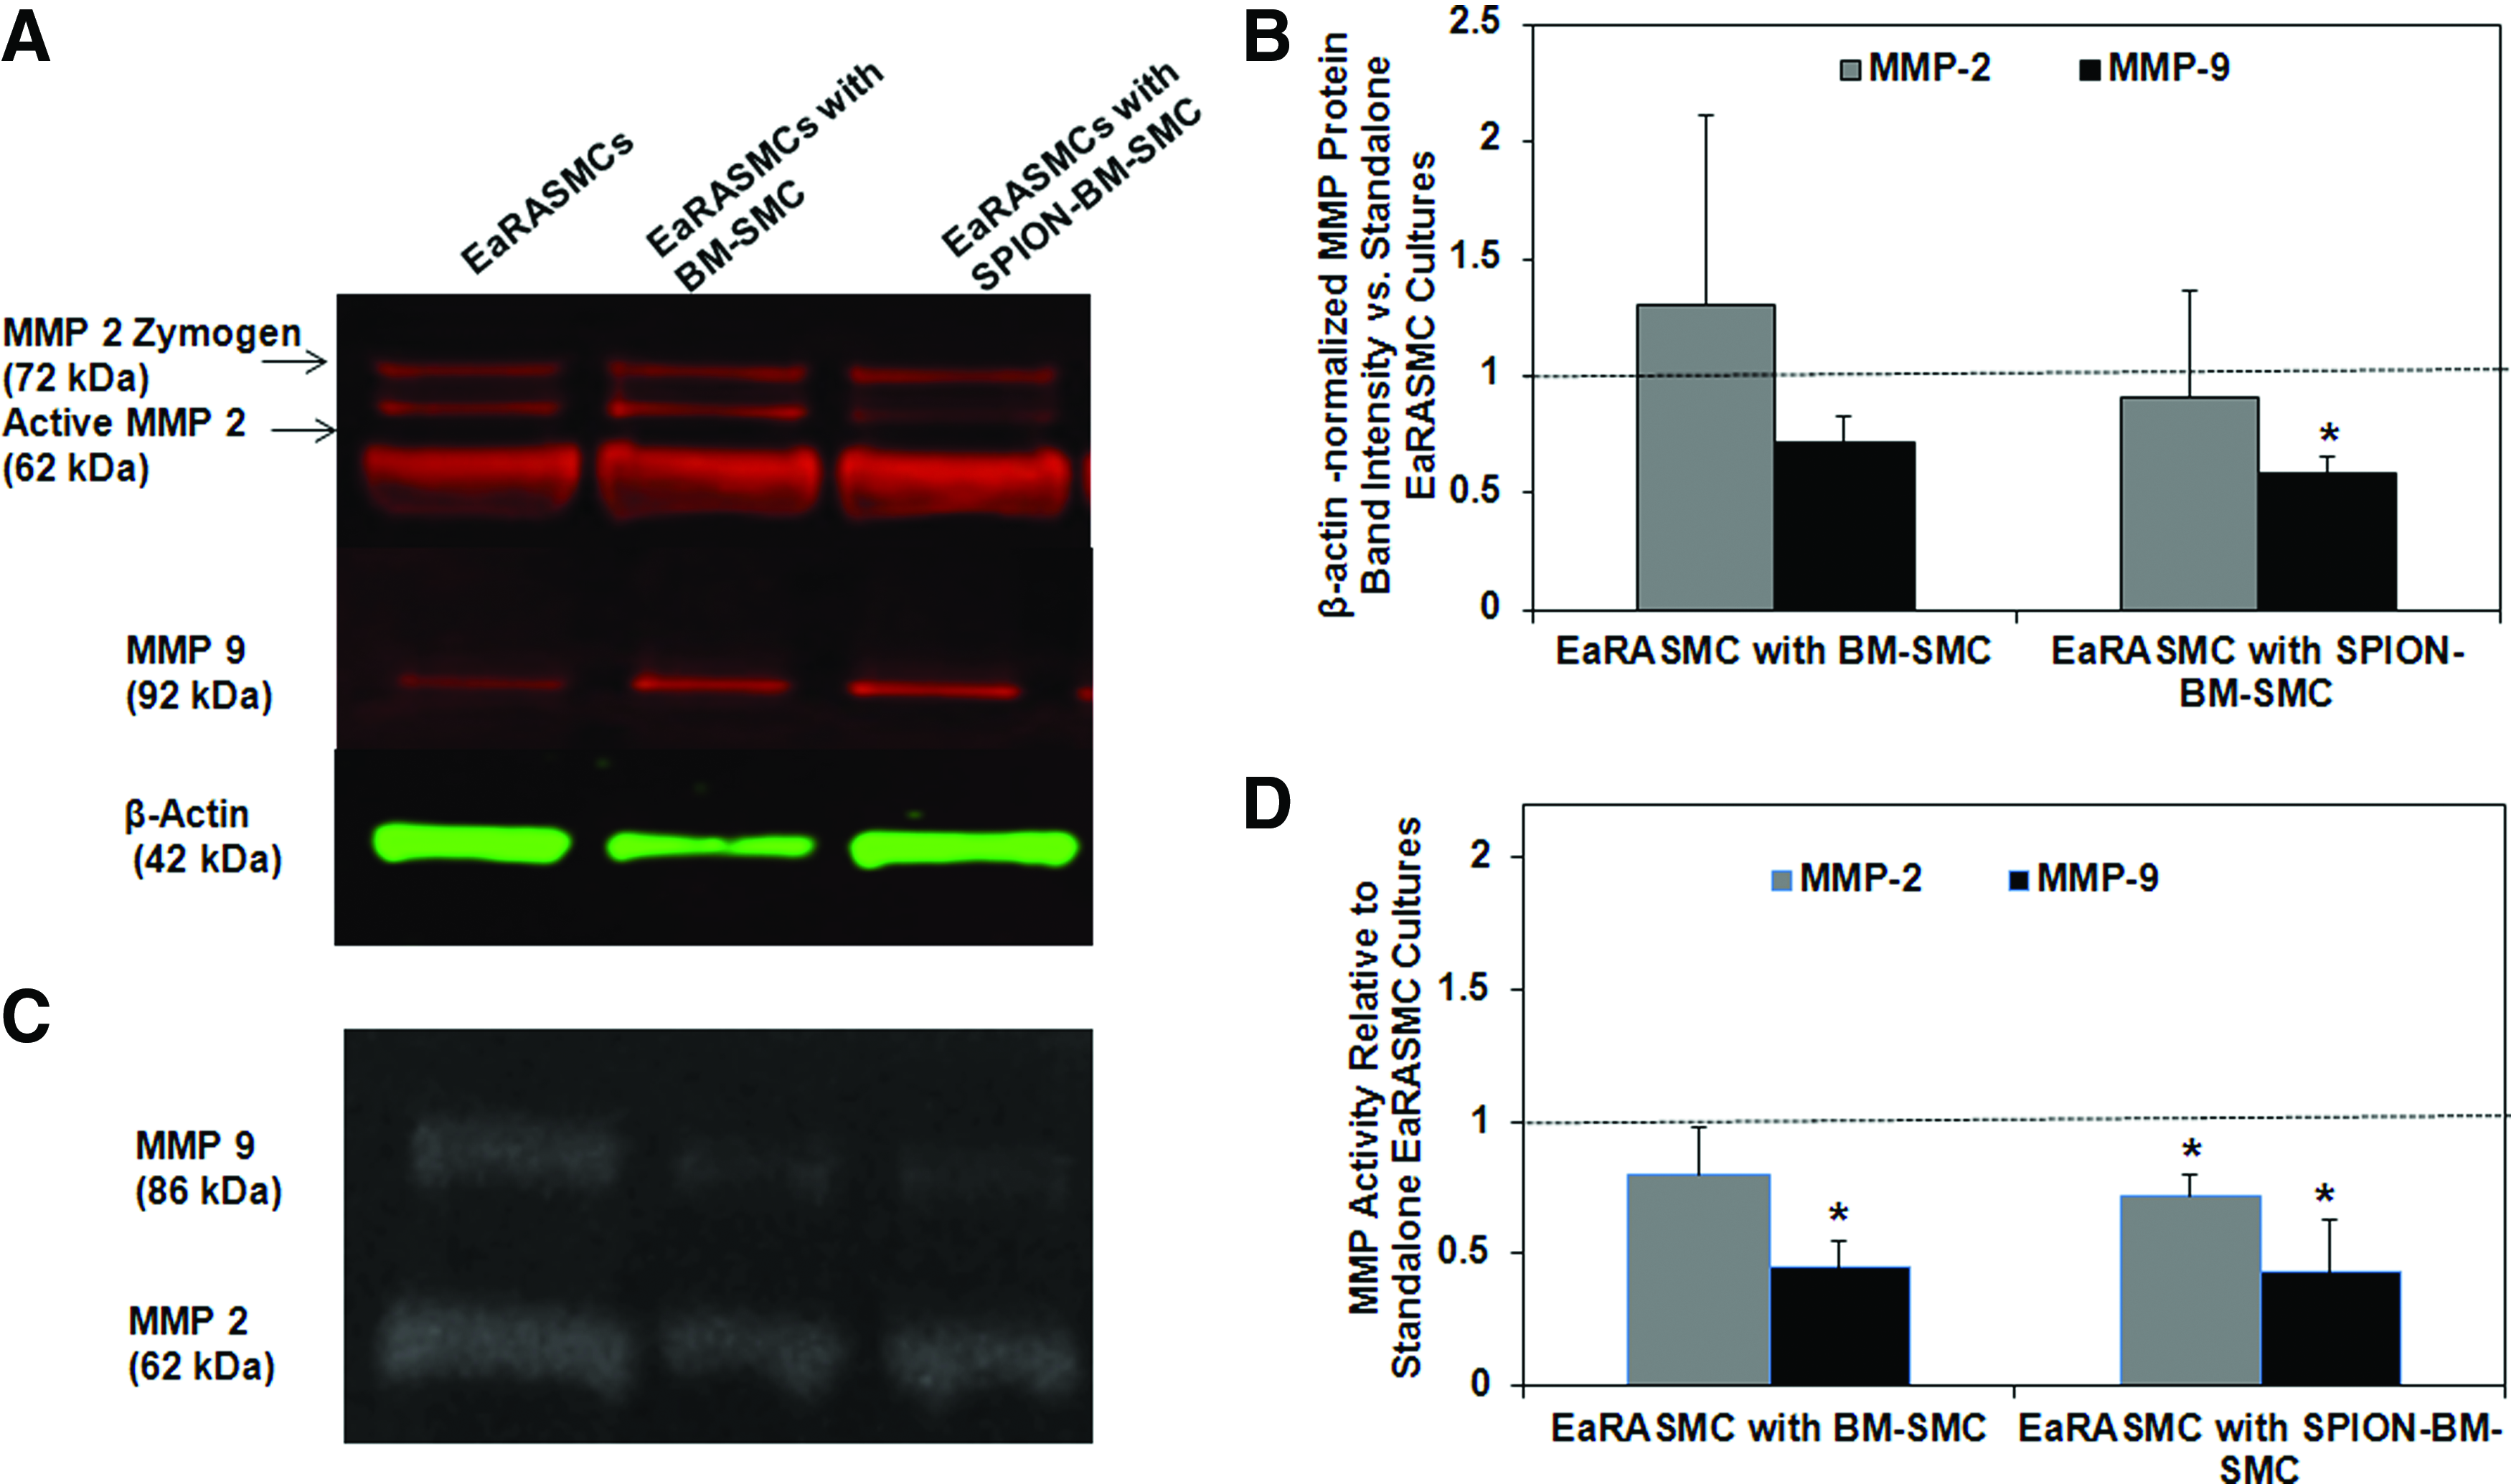
Antiproteolytic effects of BM-SMCs on EaRASMCs are maintained upon SPION-labeling. Shown are MMP2 and 9-protein synthesis and enzyme activity in EaRASMC cultures, as analyzed by western blots and gelatin zymography, respectively.
IF showed significantly greater deposition of elastic matrix (green) by cocultured EaRASMCs versus controls and no noticeable differences were noted in this outcome between the two cocultured groups (Fig. 9). TEM images (Fig. 10) showed nascent fiber formation with large amorphous elastin deposits in both EaRASMC layers cocultured with BM-SMCs (Fig. 10B) and SPION-BM-SMCs (Fig. 10C), unlike in standalone EaRASMC controls (Fig. 10A).

Transmission electron microscopy images showing that increased elastic matrix deposition by EaRASMCs upon coculture with unlabeled BM-SMCs is maintained upon coculture with SPION-BM-SMCs. Microfibrillar structures ‘M’ were observed in control
Discussion
AAA growth occurs due to chronic enzymatic breakdown of the wall structural matrix. Unlike collagen fibers, which undergo natural regenerative repair postdisruption, elastic fibers are poorly restored, due to poor elastogenesis, and impaired elastic fiber assembly by postneonatal and diseased vascular SMCs.6,7,29,30 Thus, to achieve AAA growth arrest, elastin regeneration must significantly exceed its breakdown. 31
Previously, 10 we showed that BM-SMCs exhibit high elastogenesis and generate paracrine secretions that stimulate elastogenesis by EaRASMCs, findings which support their use for matrix regenerative AAA therapy, provided they can be efficiently delivered to the AAA wall. One way to achieve this is by guiding intra-aortally infused, magnetically responsive BM-SMCs into the AAA wall using an externally applied magnetic field. The BM-SMCs are rendered paramagnetic by SPION-labeling,13–32,33 a strategy that has been applied to cell delivery to other tissue locations and facilitates their tracking using MRI.34–36 In the context of our proposed use of BM-SMCs, in this study, we sought to ascertain how SPION-labeling influences phenotype and functionality of the BM-SMCs, including their proelastogenesis and antiproteolytic properties. 10
Since nanoparticles (1) smaller than 100 nm 37 and (2) bearing a cationic charge 38 can be more cytotoxic to nonphagocytic cells, we labeled BM-SMCs with fluidMAG-D nanoparticles of size >100 nm, which contain starch as a polymer matrix and present surface hydroxyl (-OH) groups that are neutral at physiologic pH. 39 The concentration of SPIONs (0.2, 0.5, 1.0 mg/mL) was selected based on the study conducted by Reigler et. al, where they showed the potential cytotoxicity of SPIONs beyond 1 mg/mL dosage. 13 Since the size and neutral charge of our SPIONs can limit their uptake by BM-SMCs, 40 we used poly-L-lysine as a cationic agent that facilitates SPION uptake, 14 as confirmed in Figure 1. Since the SPIONs are neutrally charged, they do not induce intracellular lysosomal damage and cellular apoptosis, as with anionic nanoparticles. 41 CTV analysis, which is a reliable measure of magnetic mobility, showed that our SPION-BM-SMCs have significant magnetic mobility even under the weak applied magnetic field (B = 0.1 Tesla) & field gradient (dB/dZ = 0.078 Tesla/cm) conditions, unlike unlabeled BM-SMCs. Thus, when this technology is clinically translated, the strong magnetic fields (∼3 Tesla) applied using commercial MRI scanner systems are expected to provide a strong driving force to efficiently draw intra-aortally infused SPION-BM-SMCs to the AAA wall. 13 The plateauing of the magnetic velocity of the SPION-BM-SMCs beyond a 0.5 mg/mL SPION-labeling dose (Table 2) suggests that it is limited by the strength of the applied magnetic field.
Whole tissue imaging showed significantly greater uptake and retention of SPION-BM-SMCs into matrix-disrupted arteries in the presence of an adjoining permanent magnet (Fig. 2C), relative to uptake of nonlabeled BM-SMCs, which confirmed utility of SPION-labeling for the purpose. However, BM-SMC-associated fluorescence was not uniform across circumference of the artery lumen, likely because the magnet did not uniformly surround the vessel. While the emphasis in this study was not on magnet design and magnetic field optimization, we will systematically investigate these aspects in future. The lack of decrease in SPION-BM-SMC-associated fluorescence in the test vessels, despite repeat luminal flushing with PBS, suggests that the cells are not superficially adhered to the luminal wall, but instead distributed within the wall tissue. Such cell penetration into the wall tissue likely occurs through gaps in the endothelium and the disrupted extracellular matrix caused by elastase injury.
SMCs express distinct maturation stage-specific phenotypic marker proteins. 8 For this reason, we investigated BM-SMC expression of markers characteristic of early (SMA), mid (SM22α, caldesmon), and late (MHC) stages of maturation leading to a terminally differentiated state. Our gene expression studies showed that BM-SMCs do not exhibit a mature terminally differentiated phenotype42,43 and are not phenotypically changed by SPION-labeling. The intermediate maturation state of our BM-SMCs likely accounts for their higher elastogenesis versus RASMCs as is the case with neonatal vascular SMCs. 5 Despite the lower gene expression of terminal SMC differentiation markers by BM-SMCs, differences in synthesis of these same marker proteins were not different than in RASMCs (Fig. 3); closer inspection of this data suggests that this might be due to large SDs associated with analysis with a relatively small number of replicate samples (n = 3).
Our results indicate that SPION-labeling of BM-SMCs does not adversely impact their expression of ELN or capacity for elastic matrix neoassembly. Since ELN expression and elastic matrix synthesis per cell (0.343 ± 0.079 ng/cell for RASMCs vs. 0.033 ± 0.002 ng/cell for BM-SMCs and 0.026 ± 0.003 ng/cell for SPION-BM-SMCs) by BM-SMCs were similar to RASMCs, their significantly higher generation of elastic matrix (Fig. 5B) is likely due to their faster proliferation versus terminally differentiated and quiescent RASMCs. 8 The interim differentiation state of BM-SMCs, similar to neonatal vascular SMCs, likely account for their more rapid proliferation. 44 Overall, our ability to generate significantly greater net amounts of elastic matrix with the use of BM-SMCs versus RASMCs, for identical seeding counts, justifies their proposed use for regenerative AAA therapy.
We investigated how SPION-labeling impacts the proelastogenesis stimuli from BM-SMC secretions on EaRASMCs. 10 In general, while SPION-labeling of BM-SMCs did not significantly change the upregulated expression of almost all tested elastic matrix assembly genes by cocultured EaRASMCs, only the changes in expression of LOX and TIMP1 were statistically higher than in EaRASMC controls. While increased LOX implies possible increases in tropoelastin crosslinking 45 and increased FBLN5 and EFEMP2 expression suggest increased tropoelastin association with glycoprotein microfibrils for improved elastic fiber formation, 46 the increase in TIMP1 suggests greater regulation of MMP activity. Collectively, the outcomes suggest that BM-SMCs even when labeled with SPIONs would provide an impetus to improving quantity and quality of elastic matrix assembly in a proteolytic milieu.
Again, despite slight differences in ELN expression between EaRASMCs cocultured with the BM-SMCs and SPION-BM-SMCs (Fig. 6), no differences were seen in amounts of tropoelastin measured in the wells (Fig. 7), which we confirmed (data not shown) to be exclusively generated by the EaRASMCs and not generated by the SPION-BM-SMCs and BM-SMCs within the transwell inserts. This in turn suggests that BM-SMC- and SPION-BM-SMC-derived secretions have similar effects on elastogenesis by EaRASMCs. This lack of differences in tropoelastin synthesis in cocultured EaRASMCs versus control EaRASMCs despite lower ELN in the latter suggests that one or more posttranscriptional steps leading to extracellular tropoelastin release likely limit tropoelastin precursor yield. Significantly higher elastic matrix deposition in EaRASMC cocultures relative to controls also suggests augmentation of posttranslational matrix assembly processes (e.g., precursor recruitment, microfibril engagement, and crosslinking) in the cocultures.
Outcomes of IF and TEM imaging (Figs. 9 and 10) were mostly consistent with the biochemical assay outcomes in showing significantly greater number of mostly nascent elastic fibers in the cocultured EaRASMC layers than in control cultures and no apparent differences in density and form of elastic matrix between EaRASMCs cocultured with BM-SMCs and SPION-BM-SMCs. Our data also indicate that MMP synthesis and proteolytic activity in BM-SMC cultures are not increased upon labeling the cells with SPIONs, and their anti-MMP effects are retained upon SPION-labeling (Supplementary Fig. S2).
Conclusions
Our study demonstrates that SPION-labeling of BM-SMCs, necessary to render them magnetically responsive for magnetic field-guided delivery to the AAA wall, does not adversely impact their viability, phenotype, elastic matrix synthesis, and elastogenesis-stimulatory and antiproteolytic properties. With this evidence in hand, future work will focus on optimizing magnetic field parameters for efficient BM-SMC delivery to AAA tissue toward assessing their efficacy for regenerative matrix repair.
Footnotes
Acknowledgments
The authors acknowledge research funding for this project from the National Institutes of Health (HL092051), American Heart Association (13GRNT17080027), and National Science Foundation (BME Division; 1508642) awarded to A.R.
Disclosure Statement
No competing financial interests exist.
References
Supplementary Material
Please find the following supplemental material available below.
For Open Access articles published under a Creative Commons License, all supplemental material carries the same license as the article it is associated with.
For non-Open Access articles published, all supplemental material carries a non-exclusive license, and permission requests for re-use of supplemental material or any part of supplemental material shall be sent directly to the copyright owner as specified in the copyright notice associated with the article.