
Abstract
Dedifferentiated fat (DFAT) cells derived from mature adipocytes have mesenchymal stem cells' (MSCs) characteristics. Generally, mature adipocytes are 60–110 μm in diameter; however, association between adipocyte size and dedifferentiation efficiency is still unknown. This study, therefore, investigated the dedifferentiation efficiency of adipocytes based on cell diameter. Buccal fat pad was harvested from five human donors and dissociated by collagenase digestion. After exclusion of unwanted stromal cells by centrifugation, floating adipocytes were collected and their size distribution was analyzed. The floating adipocytes were then separated into two groups depending on cell size using 40- and 100-μm nylon mesh filters: cell diameters less than 40 μm (small adipocytes: S-adipocytes) and cell diameters of 40–100 μm (large adipocytes: L-adipocytes). Finally, we evaluated the efficiency of adipocyte dedifferentiation and then characterized the resultant DFAT cells. The S-adipocytes showed a higher capacity to dedifferentiate into DFAT cells (S-DFAT cells) compared to the L-adipocytes (L-DFAT cells). The S-DFAT cells also showed a relatively higher proportion of CD146-positive cells than L-DFAT cells, and exhibited more osteogenic differentiation ability based on the alkaline phosphatase activity and amount of calcium deposition. These results suggested that the S- and L-DFAT cells had distinct characteristics, and that the higher dedifferentiation potential of S-adipocytes compared to L-adipocytes gives the former group an advantage in yielding DFAT cells.
Introduction
M
Adipose-derived stem cells (ASCs), identified as MSCs, can be isolated from the stromal vascular fraction (SVF) of dissociated adipose tissue. Compared with ASCs, DFAT cells contain the relevant stem cell characteristics at higher frequency and Kono et al. demonstrated that approximately five times more DFAT cells than ASCs 12 produced from a given amount of cat fat tissue. In addition, compared with ASCs, DFAT cells are a more homogeneous cell population. Matsumoto et al. reported that ASCs at passage 1 are 13.3% positive for CD11b (monocyte marker) and 12.8% positive for CD45 (leukocyte common antigen), whereas DFAT cells at passage 1 are negative for these two markers. 3 The reason for such characteristics of DFAT cells is their isolation from a floating pure cell population, involving disruption and collagenase digestion of mature adipocytes followed by separation from the SVF fraction by centrifugation.
Almost all the floating cells (over 98%) resulting from such a technique are mature adipocytes, with an average diameter of 60–110 μm. 13 However, despite such a variable size range, no studies have investigated the ideal size of mature adipocytes for dedifferentiation into DFAT cells. A single recent study 14 of isolated mature adipocytes using the ceiling culture technique showed clustering of proliferating cells by small-sized adipocytes; however, the influence of adipocyte size on dedifferentiation efficiency for DFAT cells remains unclear.
The oral cavity contains encapsulated fat masses, known as the buccal fat pad (BFP), located between the masseter and buccinator muscles and the ascending mandibular ramus and zygomatic arch. 15 BFP function is related to mastication and suction. BFP tissue is easily accessible with a simple surgical procedure conducted by dentists and maxillofacial surgeons, and is often removed during oral and maxillofacial surgery. 16 Therefore, BFP may become a useful cell source for regenerative medicine based on tissue engineering. Recent studies showed that both ASCs17,18 and DFAT cells 19 isolated from human BFP possess suitable characteristics for bone and periodontal tissue engineering.18,20
In this study, we isolated adipocytes from human BFP and separated the floating mature adipocyte population into two groups based on cell diameters. We then examined whether DFAT cells could be generated from both groups of adipocytes and if so, how the properties compared between the two size-based groups of DFAT cells.
Materials and Methods
Isolation and culture of DFAT cells
Human white adipose tissue was obtained from the BFP area of five donors (Sample 1–5), undergoing Le Fort I and Sagittal Split Ramus Osteotomy (SSRO) at the Nihon University Dental Hospital (Tokyo, Japan), as shown in Table 1. The patients were otherwise healthy and had no systemic disease. All patients provided signed informed consent and the experimental protocols were reviewed and approved by the Ethics Committee of the Nihon University School of Dentistry (approval number 2008-8). Adipocytes were isolated by using a modified method, described by Sugihara et al.1,2 (Fig. 1). Briefly, 5–10 g of BFP was harvested, minced into small pieces, and then dissociated with 0.1% (w/v) collagenase digestion (C6885; Sigma-Aldrich, St. Louis, MO) at 37°C (pH 7.4) for 1 h. The SVF, which contains mesenchymal cells (preadipocytes), fibroblasts, and erythrocytes, was separated from mature adipocytes by virtue of the inherent buoyant properties of adipocytes, that is, by floating. Cells in the top layer were then collected and centrifuged at 700 rpm for 1 min. After centrifugation, the floating layer was resuspended in new Dulbecco's modified Eagle's medium (DMEM; Sigma-Aldrich). This step was repeated for an additional two cycles to ensure complete removal of the SVF from the floating adipocytes.
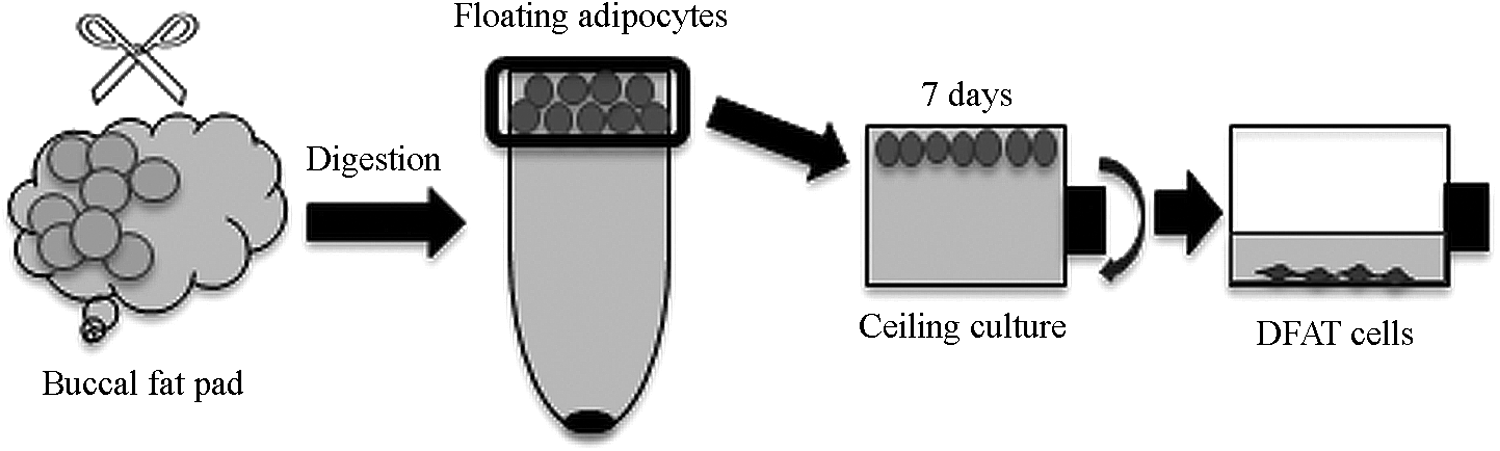
Isolation and culture of DFAT cells. Buccal fat pad was minced into small pieces and dissociated with 0.1% (w/v) collagenase. After filtration and centrifugation, the floating adipocytes were harvested and placed in culture flasks filled completely with DMEM containing 20% FBS for 7 days. Then the flasks were turned upside down and cells were cultured under conventional conditions. DFAT, dedifferentiated fat; DMEM, Dulbecco's modified Eagle's medium; FBS, fetal bovine serum.
SSRO, Sagittal Split Ramus Osteotomy.
The floating cells were finally separated into two groups based on cell size using 40- and 100-μm nylon mesh filters: diameters less than 40 μm and diameters of 40–100 μm. Each cell population was separately placed in 25-cm2culture flasks (BD Falcon, San Jose, CA), which were completely filled with DMEM supplemented with 20% (v/v) fetal bovine serum (13B103; Sigma-Aldrich) and 1% antibiotics as a growth medium (GM), and were incubated at 37°C in 5% CO2. Cells were floated up in both groups and were adhered to the top inner surface (ceiling) of the flask. Seven days later, the flasks were inverted and the medium was changed every 4 days until the cells reached to confluence. The initial DFAT cells referred to as passage 0 (P0), were passaged at 80% confluence and used for experiments.
Determination of adipocyte size
To determine the distribution of cell size among the floating population isolated from the BFP tissues, the floating cells were suspended in 1 mL DMEM and their diameter and number were measured using a Coulter Counter Multisizer3 (Beckman Coulter, Miami, FL). The measurement was conducted three times and the results are presented as the mean ± standard deviation (SD).
Nile red fluorescence staining
To determine whether the cells would have lipid-filled vacuoles, the floating cells were collected and incubated for 20 min with Nile Red Fluorescence dye (AdipoRed Assay; Lonza, Walkerslive, MD) and 5 μg/mL Hoechst 33342 (Sigma-Aldrich) to visualize lipid droplets and nuclei, respectively. Images of staining were captured under immunofluorescence microscopy (KEYENCE, Osaka, Japan). In addition, we analyzed the proportion of Nile Red fluorescence-positive cells by using flow cytometry (FACSAria; BD Biosciences, San Jose, CA). Data acquisition and analysis were then performed by using FlowJo software (Tree Star, Ashland, OR).
Efficiency of dedifferentiation into DFAT cells
To test whether adipocyte size could influence the efficiency of dedifferentiation from mature adipocytes to DFAT cells, the number of DFAT cells dedifferentiated from the same number of adipocytes was counted for both groups, S-DFAT and L-DFAT cells. Adipocytes were placed in the culture flasks at the initial density of 1.0 × 10⁴ cells/cm2 and were incubated for 18 days and then the number of DFAT cells in the 25-cm2culture flasks was counted at day 6, 10, 14, and 18 using the Countess™ Automated Cell Counter (Invitrogen, Eugene, OR).
Analysis of cell surface markers
The immunophenotype of DFAT cells at passage 1 was identified using flow cytometry as described previously.21–23 Cells grown to 60% confluence were suspended at a density of 5 × 10⁵ cells per tube, and then labeled using antibodies against the following antigens: CD13 (PE-CD13, aminopeptidase N), CD44 (FITC-CD44, hyaluronate receptor, phagocytic glycoprotein-1), CD45 (FITC-CD45, leukocyte common antigen), CD73 (PE-CD73, NT5E), CD90 (APC-CD90, Thy-1), CD105 (APC-CD105, endoglin), CD146 (PE-CD146, MUL18), CD271 (PE-CD271, NGFR), and STRO-1 (FITC-STRO1) (all from BD Biosciences, San Jose, CA). Control cells were also incubated with isotype-matched mouse anti-human IgGs to serve as negative control. Dead cells were identified by staining with 1 μg/mL propidium iodide (Sigma-Aldrich). Flow cytometry data were analyzed by using the FlowJo software.
RNA isolation and reverse transcription–polymerase chain reaction
Total RNA was extracted using the TRI Reagent (Cosmo Bio, Tokyo, Japan) according to the manufacturer's protocol when the cells had reached 60% confluence in 100-mm culture dishes. RNA concentration was determined using a NanoDrop 1000 (Thermo Fisher Scientific, Inc., Yokohama, Japan). cDNAs were generated from 1 μg of total RNA and amplified using the ReverTra Ace qPCR-RT Kit (Toyobo, Osaka, Japan) according to the manufacturer's instructions. Polymerase chain reaction (PCR) amplification was performed by using a PCR Thermal Cycler Dice (TaKaRa Bio, Inc., Ohtsu, Japan): denaturation at 98°C for 10 s, annealing temperature of 58°C (GAPDH, KLF4, OCT3/4, SOX2, RUNX2, PPARγ2, and SOX9), 62°C (c-MYC) for 30 s, and extension at 72°C for 60 s, with a total of 35 cycles of amplification. The primer sequences are shown in Table 2.
RT-PCR, reverse transcription–polymerase chain reaction.
Expression profiling of embryonic stem cells
The gene expression was analyzed using a human primer set [PrimerArray Embryonic Stem Cells (Human) PH016; TaKaRa Bio, Inc.] in the CFX96 Real-time PCR Detection System (Bio-Rad, Hercules, CA) according to the manufacturer's instruction. The primer array contains a mixture of 96 primer pairs representing 88 genes associated with stem cell and germline cell differentiation, and 8 housekeeping genes. Quantification of gene expression was performed using a PrimerArray Analysis Tool version 2.0 (TaKaRa Bio, Inc.). The study was conducted in triplicate.
Colony-forming unit fibroblast assay
Cells at passage 1 were plated onto six-well plates (100 cells/well) and incubated in the GM for 10 days. The cells were stained with 0.05% (w/v) Toluidine blue (Sigma-Aldrich). More than 50 cells in an aggregate were scored as a colony. Each test was conducted three times.
Cell growth assay
Cells at passage 1 were seeded onto 6-well plates (1000 cells/well), and counted using a Cell-Counting Kit-8 (WST-8; Dojindo Laboratories, Kumamoto, Japan) according to the manufacturer's instructions at the indicated days as previously described. 21 Each test was conducted three times and results are presented as mean ± SD.
Cell cycle analysis
Cell cycle analysis was performed using Click-iT™ EdU Flow Cytometry Assay Kits (Molecular Probes, Eugene, OR) according to the manufacturer's instructions and as previously described.21,22 Briefly, cells at passage 1 were cultured onto 100-mm culture dishes (1.0 × 10⁵ cells/dish) in the GM for 3 days and were treated with 10 mM EdU. Cells were exposed to the Click reaction mixture containing Blue™ Azide (C10418) and the percentages of S-phase, G2+M-phase, and G1-phase cells were analyzed using a flow cytometer (FACSAria).
Osteogenic differentiation
Cells at passage 1 were seeded onto 12-well plates (1.0 × 10⁴ cells/well) in the GM, and the medium was replaced with osteogenic induction medium (OIM) consisting of the GM, supplemented with 100 nM dexamethasone, 10 mM b-glycerol 2-phosphate disodium salt hydrate (Sigma-Aldrich), and 50 mM
Adipogenic differentiation
Cells at passage 1 were seeded onto 12-well plates (1.0 × 10⁴ cells/well) in the GM for 7 days, and the medium was replaced with adipogenic induction medium (AIM) consisting of the GM, supplemented with 1 mM dexamethasone (Sigma-Aldrich), 0.5 mM isobutylmethylxanthine (Sigma-Aldrich) and 1 × Insulin–Transferrin–Selenium–A (GIBCO, Grand Island, NY) or the GM medium as control. Cells were cultured in AIM or GM for 21 days and stained with Oil Red O (Wako Pure Chemical Industries) as previously described.24,25 The Oil Red O-positive cells were counted and the proportion of positively stained cells was calculated.
Statistical analyses
All statistical analyses were performed using Ekuseru–Toukei 2010 (Social Survey Research Information Co., Ltd., Tokyo, Japan). Statistical differences were evaluated using Student's t-test. A p-value of less than 0.05 indicated statistical significance.
Results
Adipocyte size
The size distribution of the floating adipocytes after centrifugation is represented in Figure 2. In this initial experiment, the floating cells were divided into five groups based on cell diameter (<40, 40–59, 60–79, 80–99, and 100–130 μm) and cell numbers in each group were determined using a Coulter counter. Despite 60–79 μm being the reported average diameter of adipocytes,13,26 the group of cells in that size range was one-third the size of the largest in this study, which was that containing cells less than 40 μm in diameter. Therefore, cells were grouped into two: those less than 40 μm in diameter (S-adipocytes) and those 40 μm or larger in diameter (L-adipocytes). Nile Red and Hoechst 33342 staining confirmed that these adipocytes are lipid-filled monovacuolar adipocytes with a single nucleus (Fig. 3A, B). Flow cytometry analysis revealed that 100% of S-adipocytes were positive for Nile Red (Fig. 3C). It also exhibited the reference between the size distribution and the patient's age (Table 3). It showed almost the same distribution among about 20, 30, and 40 years old patient's adipocyte size.

Distribution of floating adipocytes based on cell size. The diameter of floating cells was measured to estimate the distribution of adipocyte size which ranged from 20 to 130 μm. The floating cells were suspended in 1 mL DMEM and Coulter Counter Multisizer 3 was used to measure their diameter and number. Each bar indicates the mean ± SD (n = 3, *p < 0.05). SD, standard deviation.
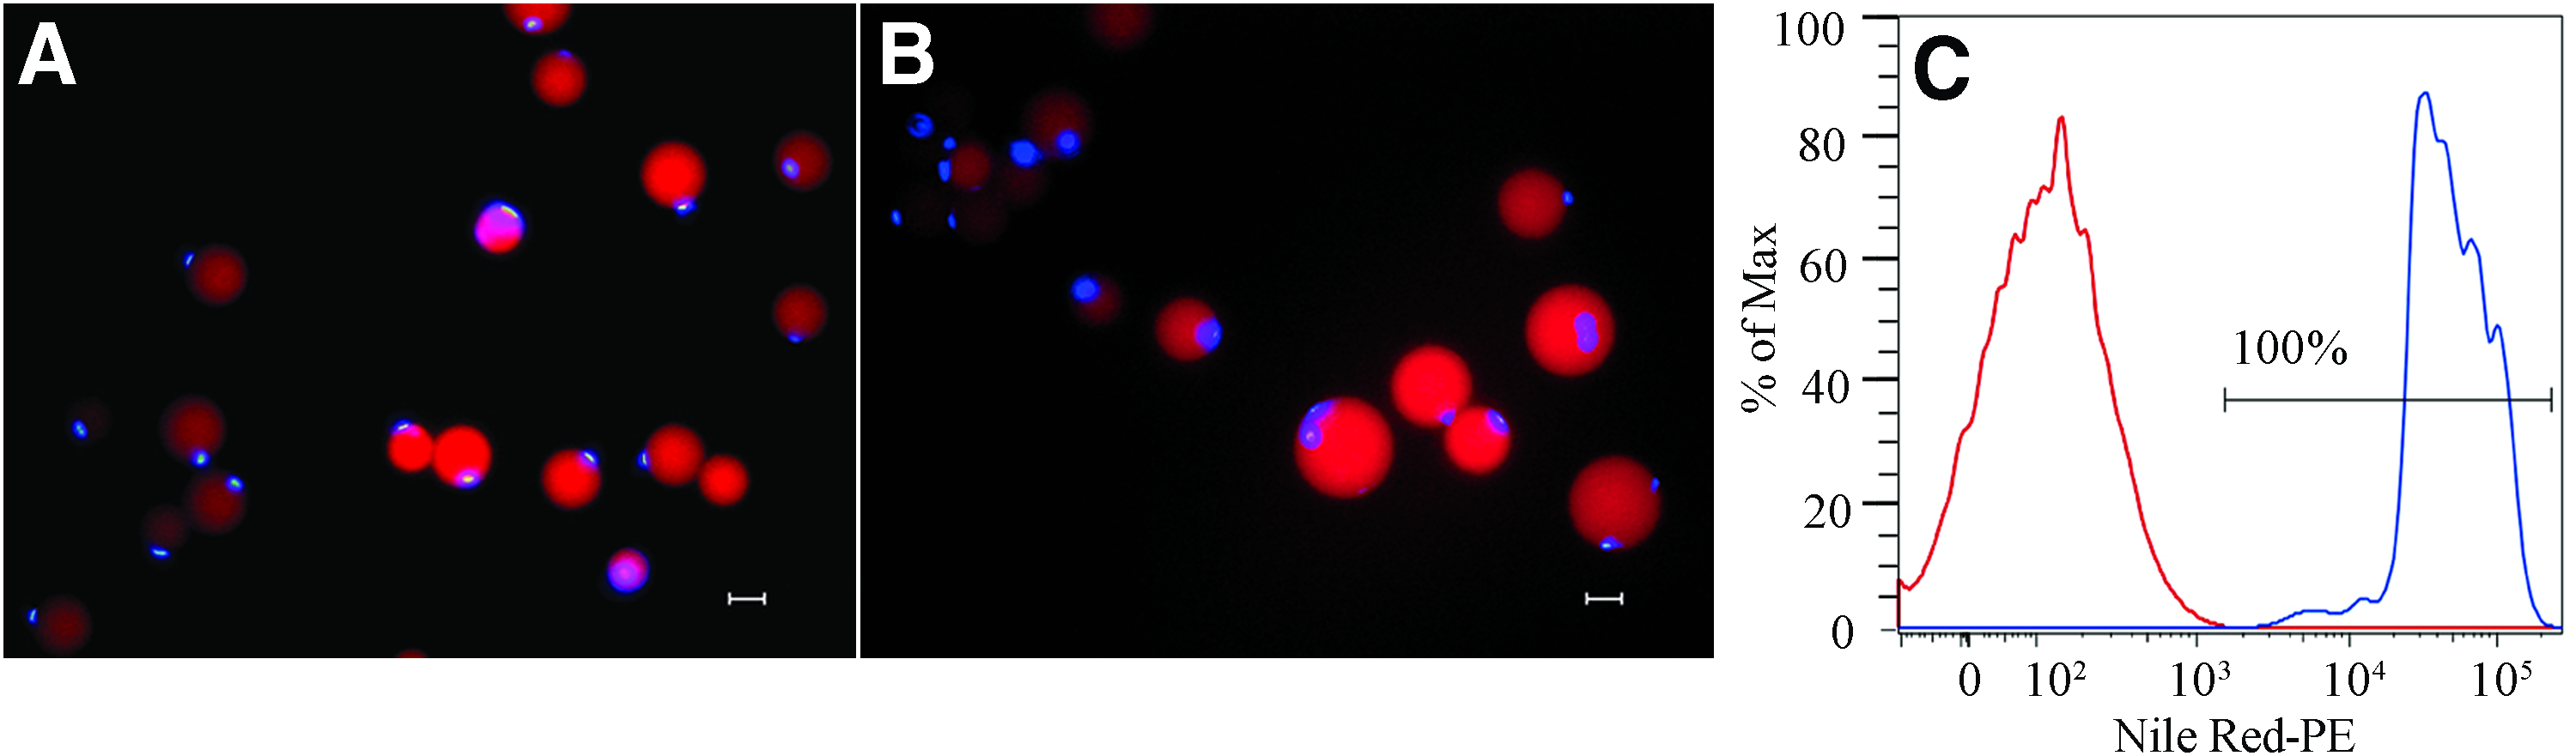
Nile Red fluorescence staining of floating adipocytes.
Successful dedifferentiation into DFAT cells from small-size adipocytes
To determine whether both cell groups could be dedifferentiated into DFAT cells, S- and L-adipocytes from the five donors were isolated and incubated independently. During the isolation, adipocytes of all sizes floated up and adhered to the culture flask ceiling on day 3 (Fig. 4A). The majority of cells had a single lipid droplet in the cytoplasmic membrane. On day 5 of the ceiling culture, fibroblast-like DFAT cells were generated from both the S- and L-adipocytes (Fig. 4B). When the flasks were inverted on day 7 of the ceiling culture, DFAT cells frequently formed colony (Fig. 4C) with similar results obtained for both S- and L-adipocytes.
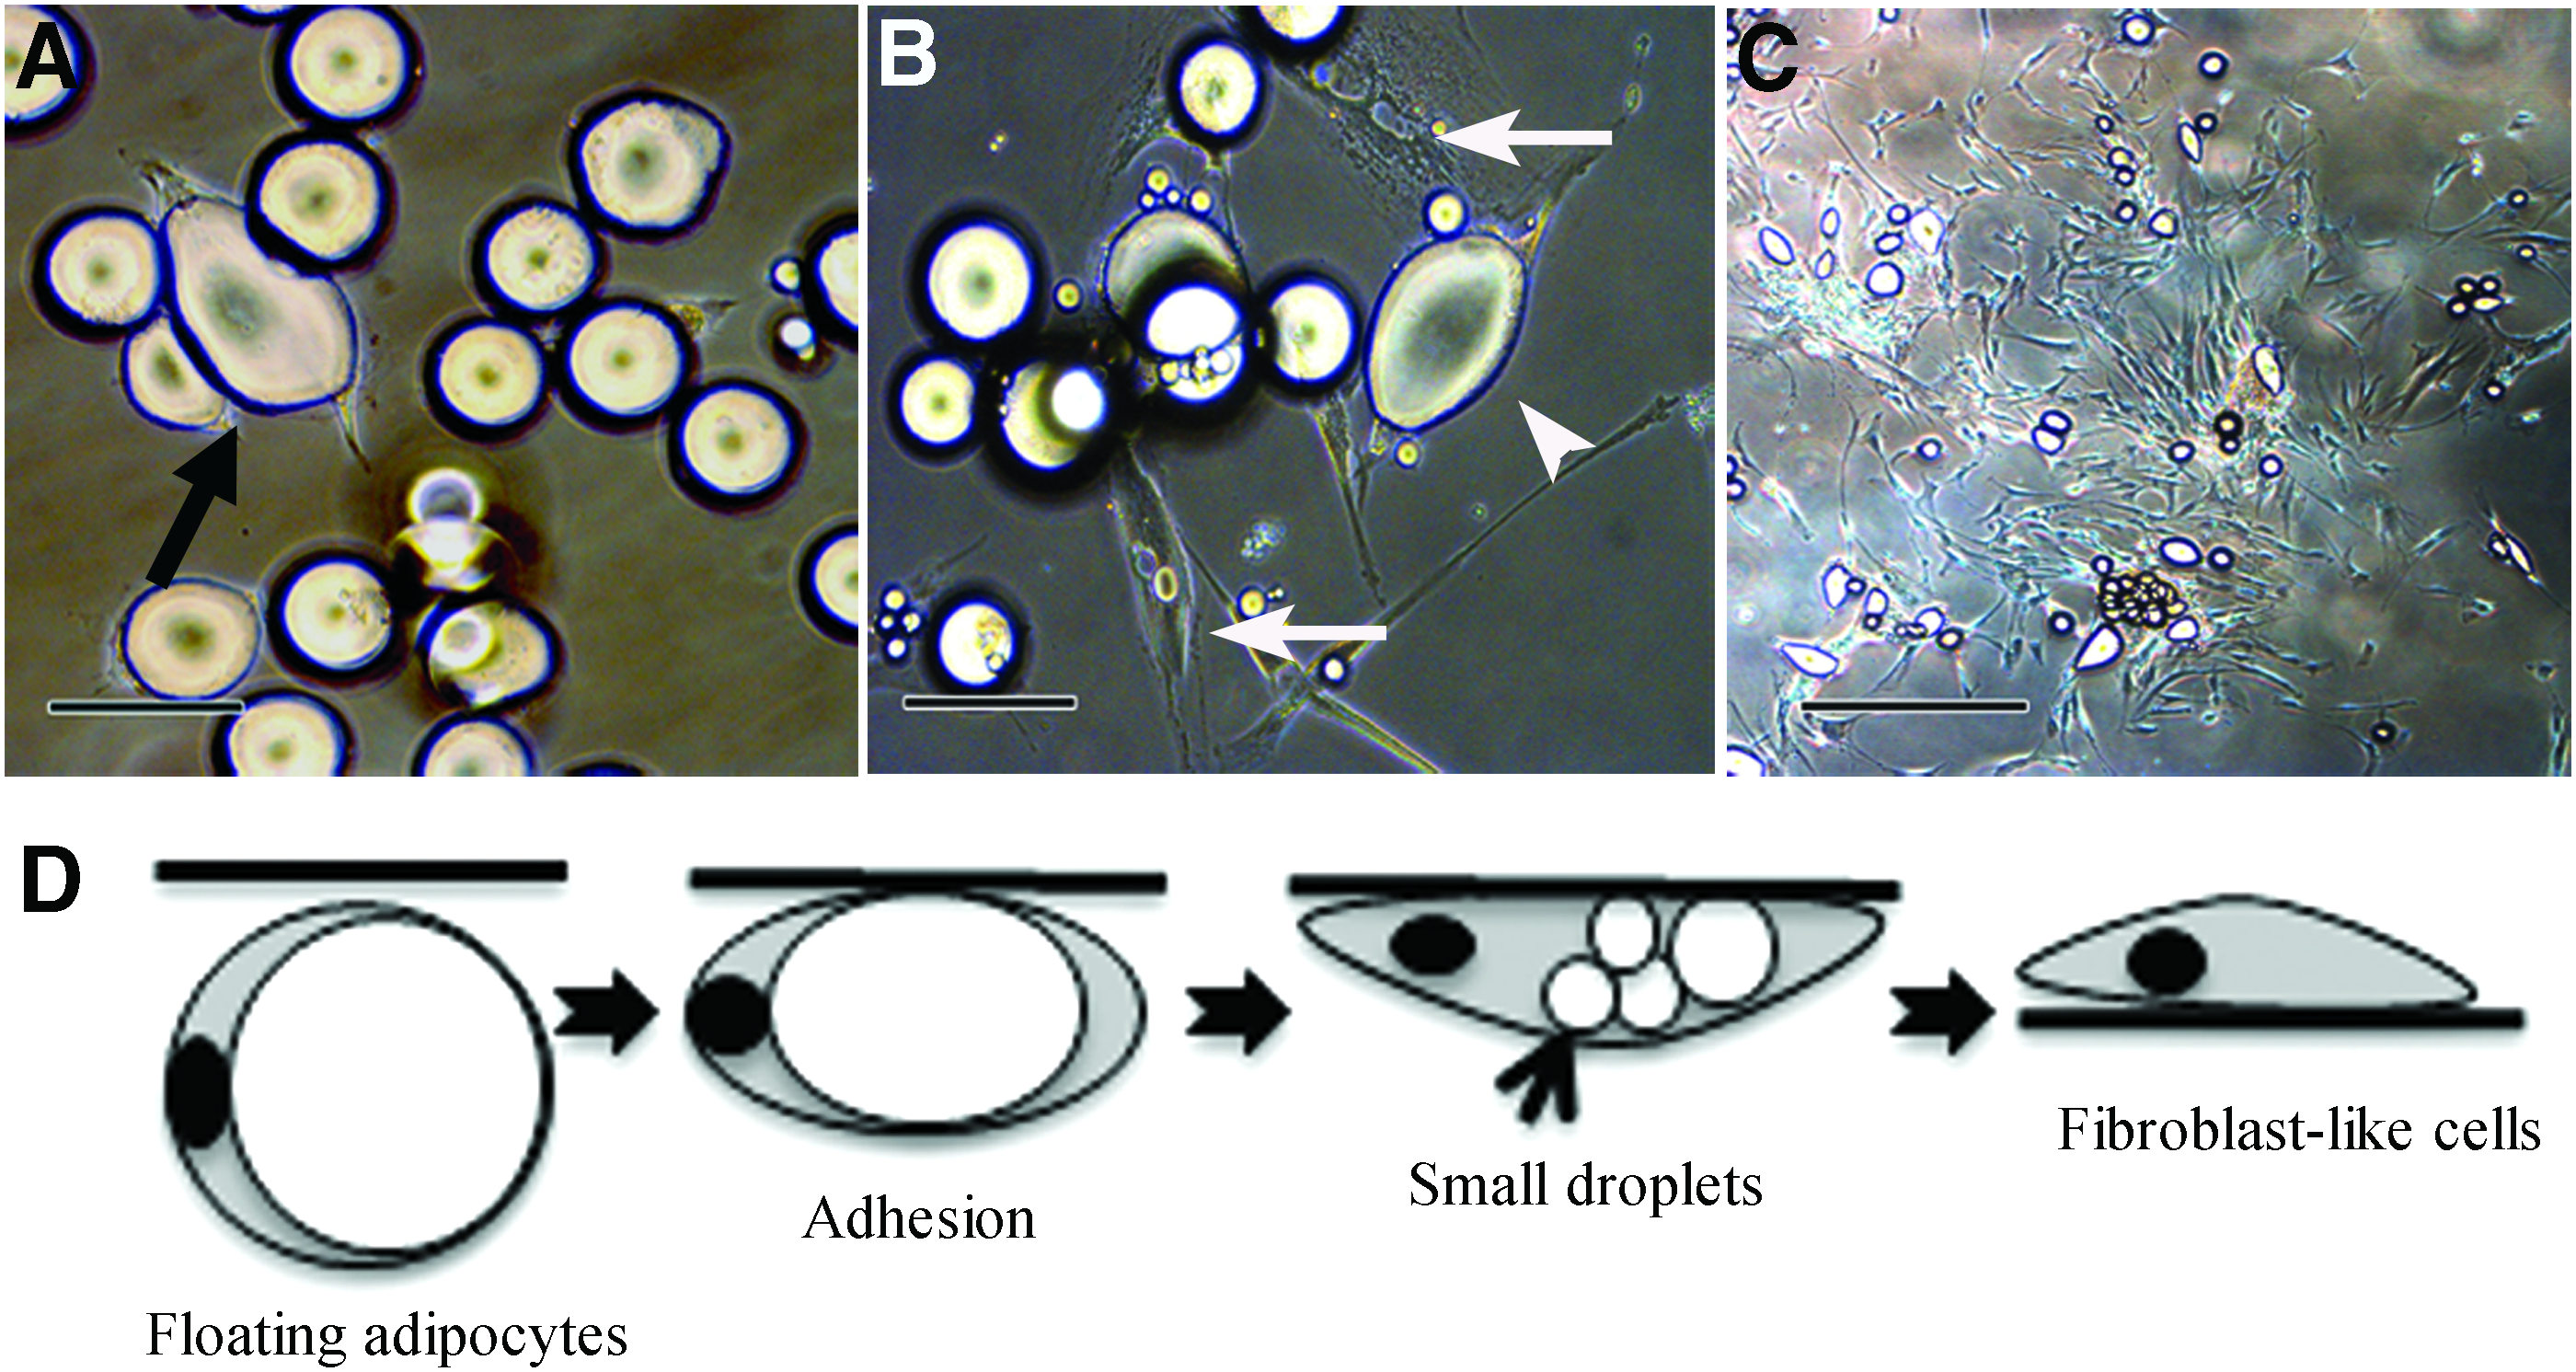
Morphological changes during dedifferentiation from mature adipocytes to DFAT cells.
Efficiency of dedifferentiation into DFAT cells
Since S-adipocytes were able to yield DFAT cells (S-DFAT cells) consistent with those derived from L-adipocytes (L-DFAT cells), we compared the efficiency of dedifferentiation into DFAT cells from the same number of S- and L-adipocytes, as described in the Materials and Methods section. At day 6, the number of S-DFAT cells (0.5 × 10⁵ ± 0.05 cells/cm2) was significantly higher than that of L-DFAT cells (0.3 × 10⁵ ± 0.05 cells/cm2). The difference was maintained by day 21 of culture and the significant differences were also observed at day 10 and 14 (Fig. 5).
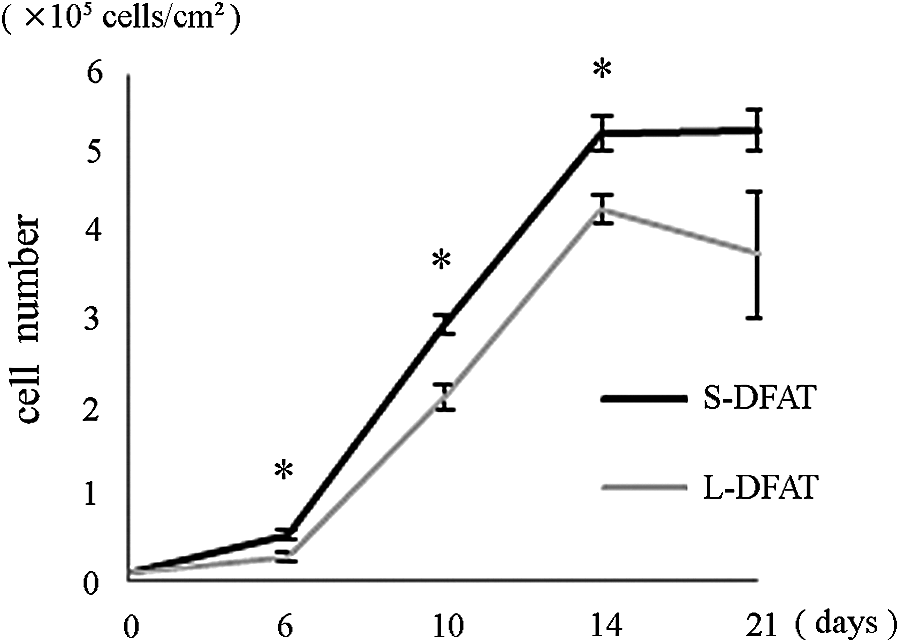
Efficiency of dedifferentiation into DFAT cells from floating mature adipocytes. S- and L-adipocytes were cultured in 25-cm2culture flasks (1.0 × 10⁴ cells/flask). At the indicated days, the number of DFAT cells generated at the bottom of the flask was measured. In brief, after trypsinization, the cell suspensions were centrifuged. Then DFAT cells were present at the bottom of the tube, hence, their number was measured. Each bar indicates the mean ± SD (n = 4, *p < 0.05).
Characteristics of S-DFAT and L-DFAT cells
To determine whether S- and L-DFAT cells shared the characteristics of MSCs, we examined the respective levels of common MSC markers. Both the S- and L-DFAT cells showed high expression levels of CD13, CD44, CD73, CD90, and CD105. Interestingly, the expression of CD146 in S-DFAT cells was higher than that in L-DFAT cells. Reproducible results were obtained from two donors (Table 4).
DFAT, dedifferentiated fat.
Next, we examined the mRNA expression levels of c-MYC, KLF-4, OCT3/4, SOX2, RUNX-2, PPARγ2, and SOX9 by using conventional reverse transcription-PCR. Both S- and L-DFAT cells expressed all genes, except for SOX2 (Fig. 6), with no significant differences between the groups based on reproducible results from four donors. In addition, we compared gene expressions related to multipotency and self-propagation ability between S- and L-DFAT cells by using a primer array. Three genes (CCL2, LAMC1, GATA6) showed higher expression in S-DFAT cells compared to L-DFAT cells, while the other three genes (DCN, NES, SFRP2) related to the preadipocytes, neural stem cells and Wnt inhibitor were expressed at lower levels in the S-DFAT cells than in the L-DFAT cells (Table 5).
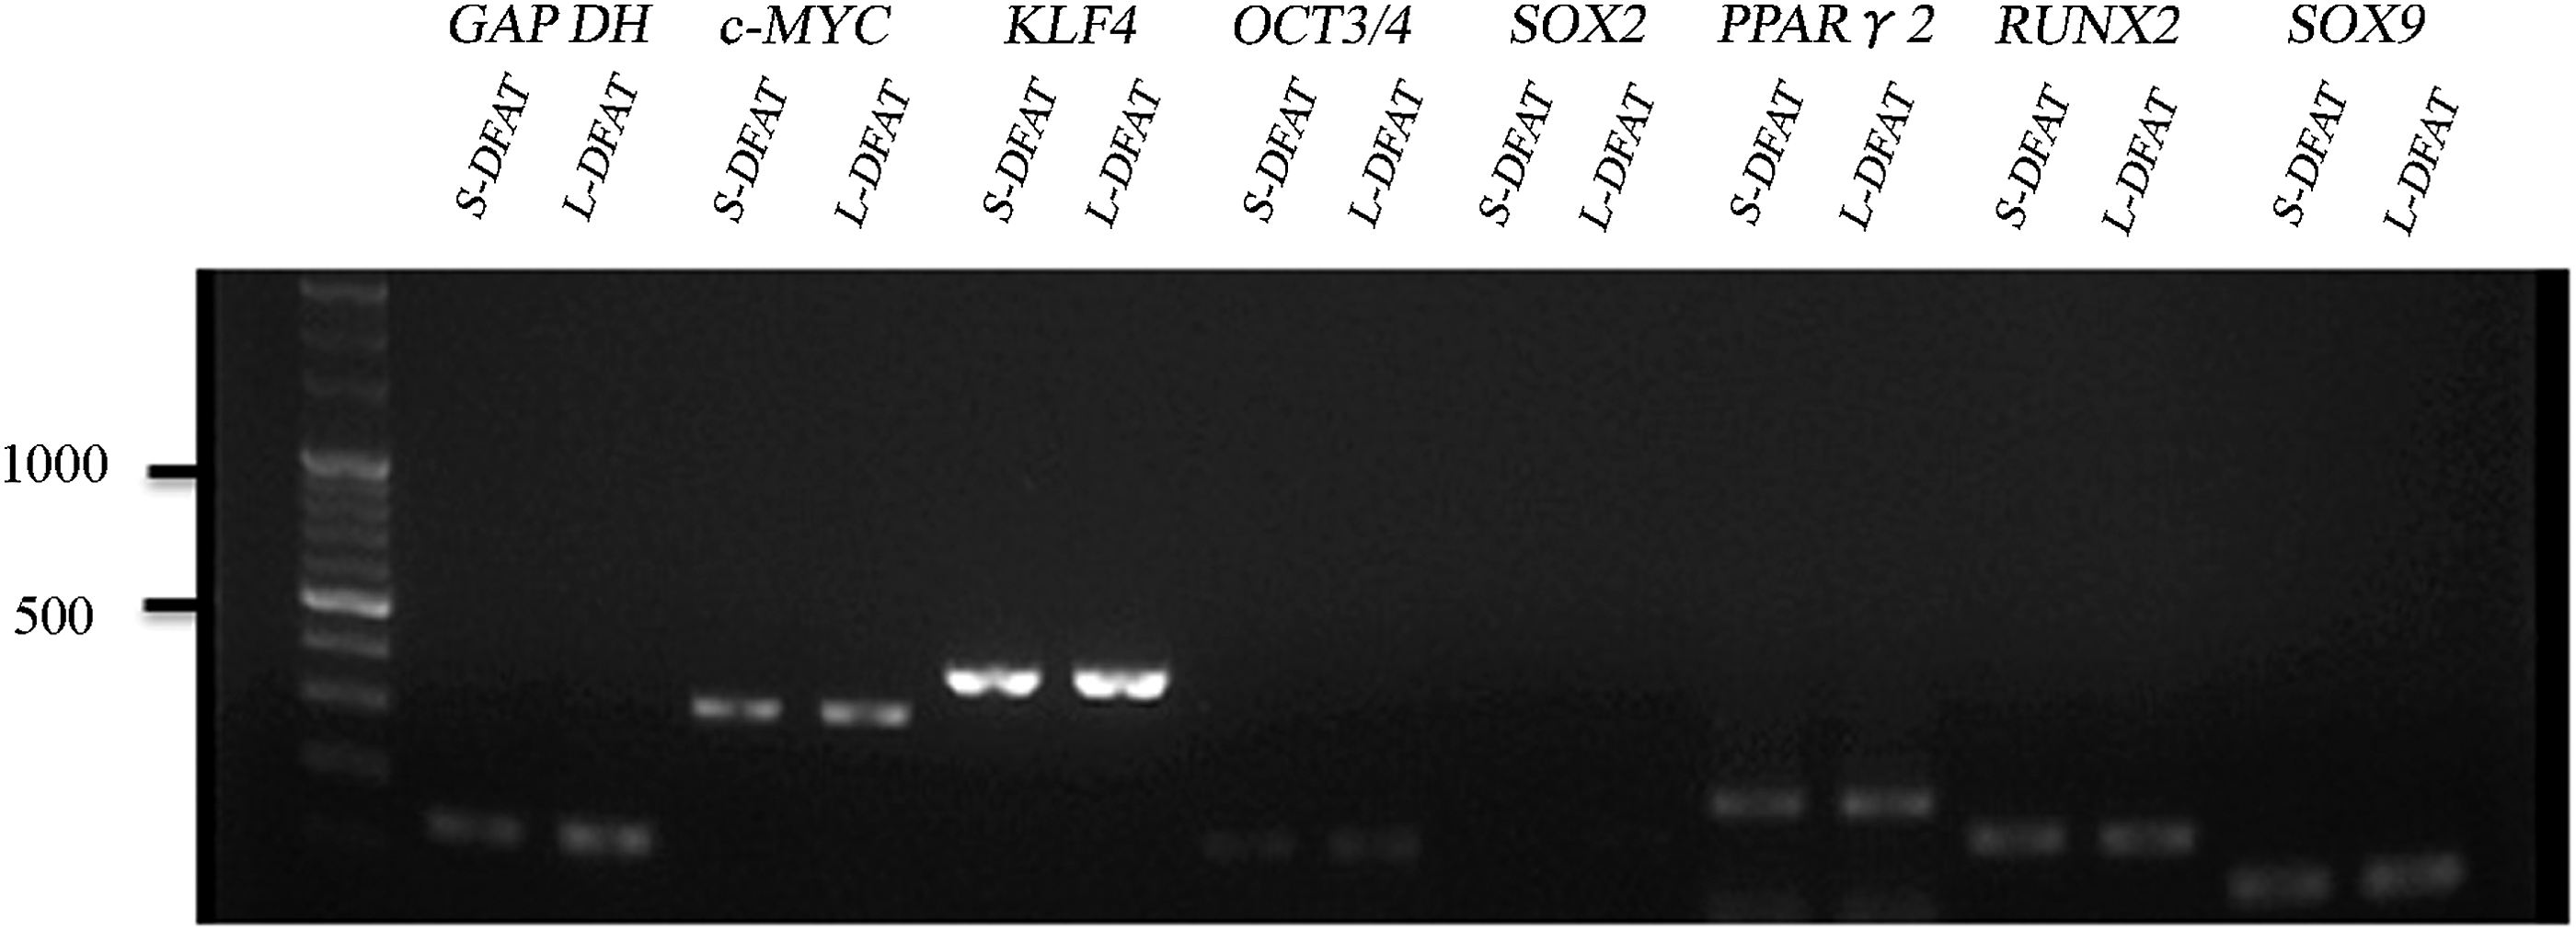
RT-PCR analysis for S-DFAT cells and L-DFAT cells. Specific primer sequences were used for reverse transcription PCR analysis of embryonic stem cell markers (c-MYC, KLF4, OCT3/4, SOX2), transcription factors of osteogenic, adipogenic, and chondrogenic lineages (RUNX2, PPARγ2, SOX9), and GAPDH. The expression pattern in S-DFAT cells was similar to that of L-DFAT cells. SOX2 gene expression was not detected in either of the DFAT cell groups. Similar results were obtained in independent experiments with cells from four different donors.
The table show six genes, which were exhibited in S-DFAT cells more than 1.5 times and less than half of gene expressions in L-DFAT cells.
We performed cell growth assay, cell cycle assay, and colony-forming unit fibroblast (CFU-F) and they were equivalent between the S- and L-DFAT cells (Fig. 7 and Table 6). Osteogenic differentiation potential of the S-DFAT cells was also compared with that of the L-DFAT cells based on ALP activity, Alizarin Red S staining, and the amount of calcium deposition. In OIM culture, the ALP activity in S-DFAT cells was significantly increased during osteogenic induction culture in comparison with that in L-DFAT cells (Fig. 8A). The ALP activities in S-DFAT cells at day 3, 5, 7, and 14 were significantly larger than those in L-DFAT cells. The Alizarin Red S staining revealed that calcium accumulation, a marker of terminal-stage osteoblastic differentiation, was observed in both S- and L-DFAT cells after osteogenic induction culture (Fig. 8B). At day 7 of osteogenic induction culture, phase contrast microscopy revealed that Alizarin Red S-positive mineralized nodules was observed in S-DFAT cells, but less in L-DFAT cells. The amount of calcium deposition in S-DFAT cells was significantly higher than that in L-DFAT cells at day 7 and 21 of the osteogenic induction culture (Fig. 8C). Finally, Oil Red O staining revealed the equivalent adipogenic differentiation between the S- and L-DFAT cells (Fig. 9A, B).

Colony-forming unit fibroblasts and cell growth potential.
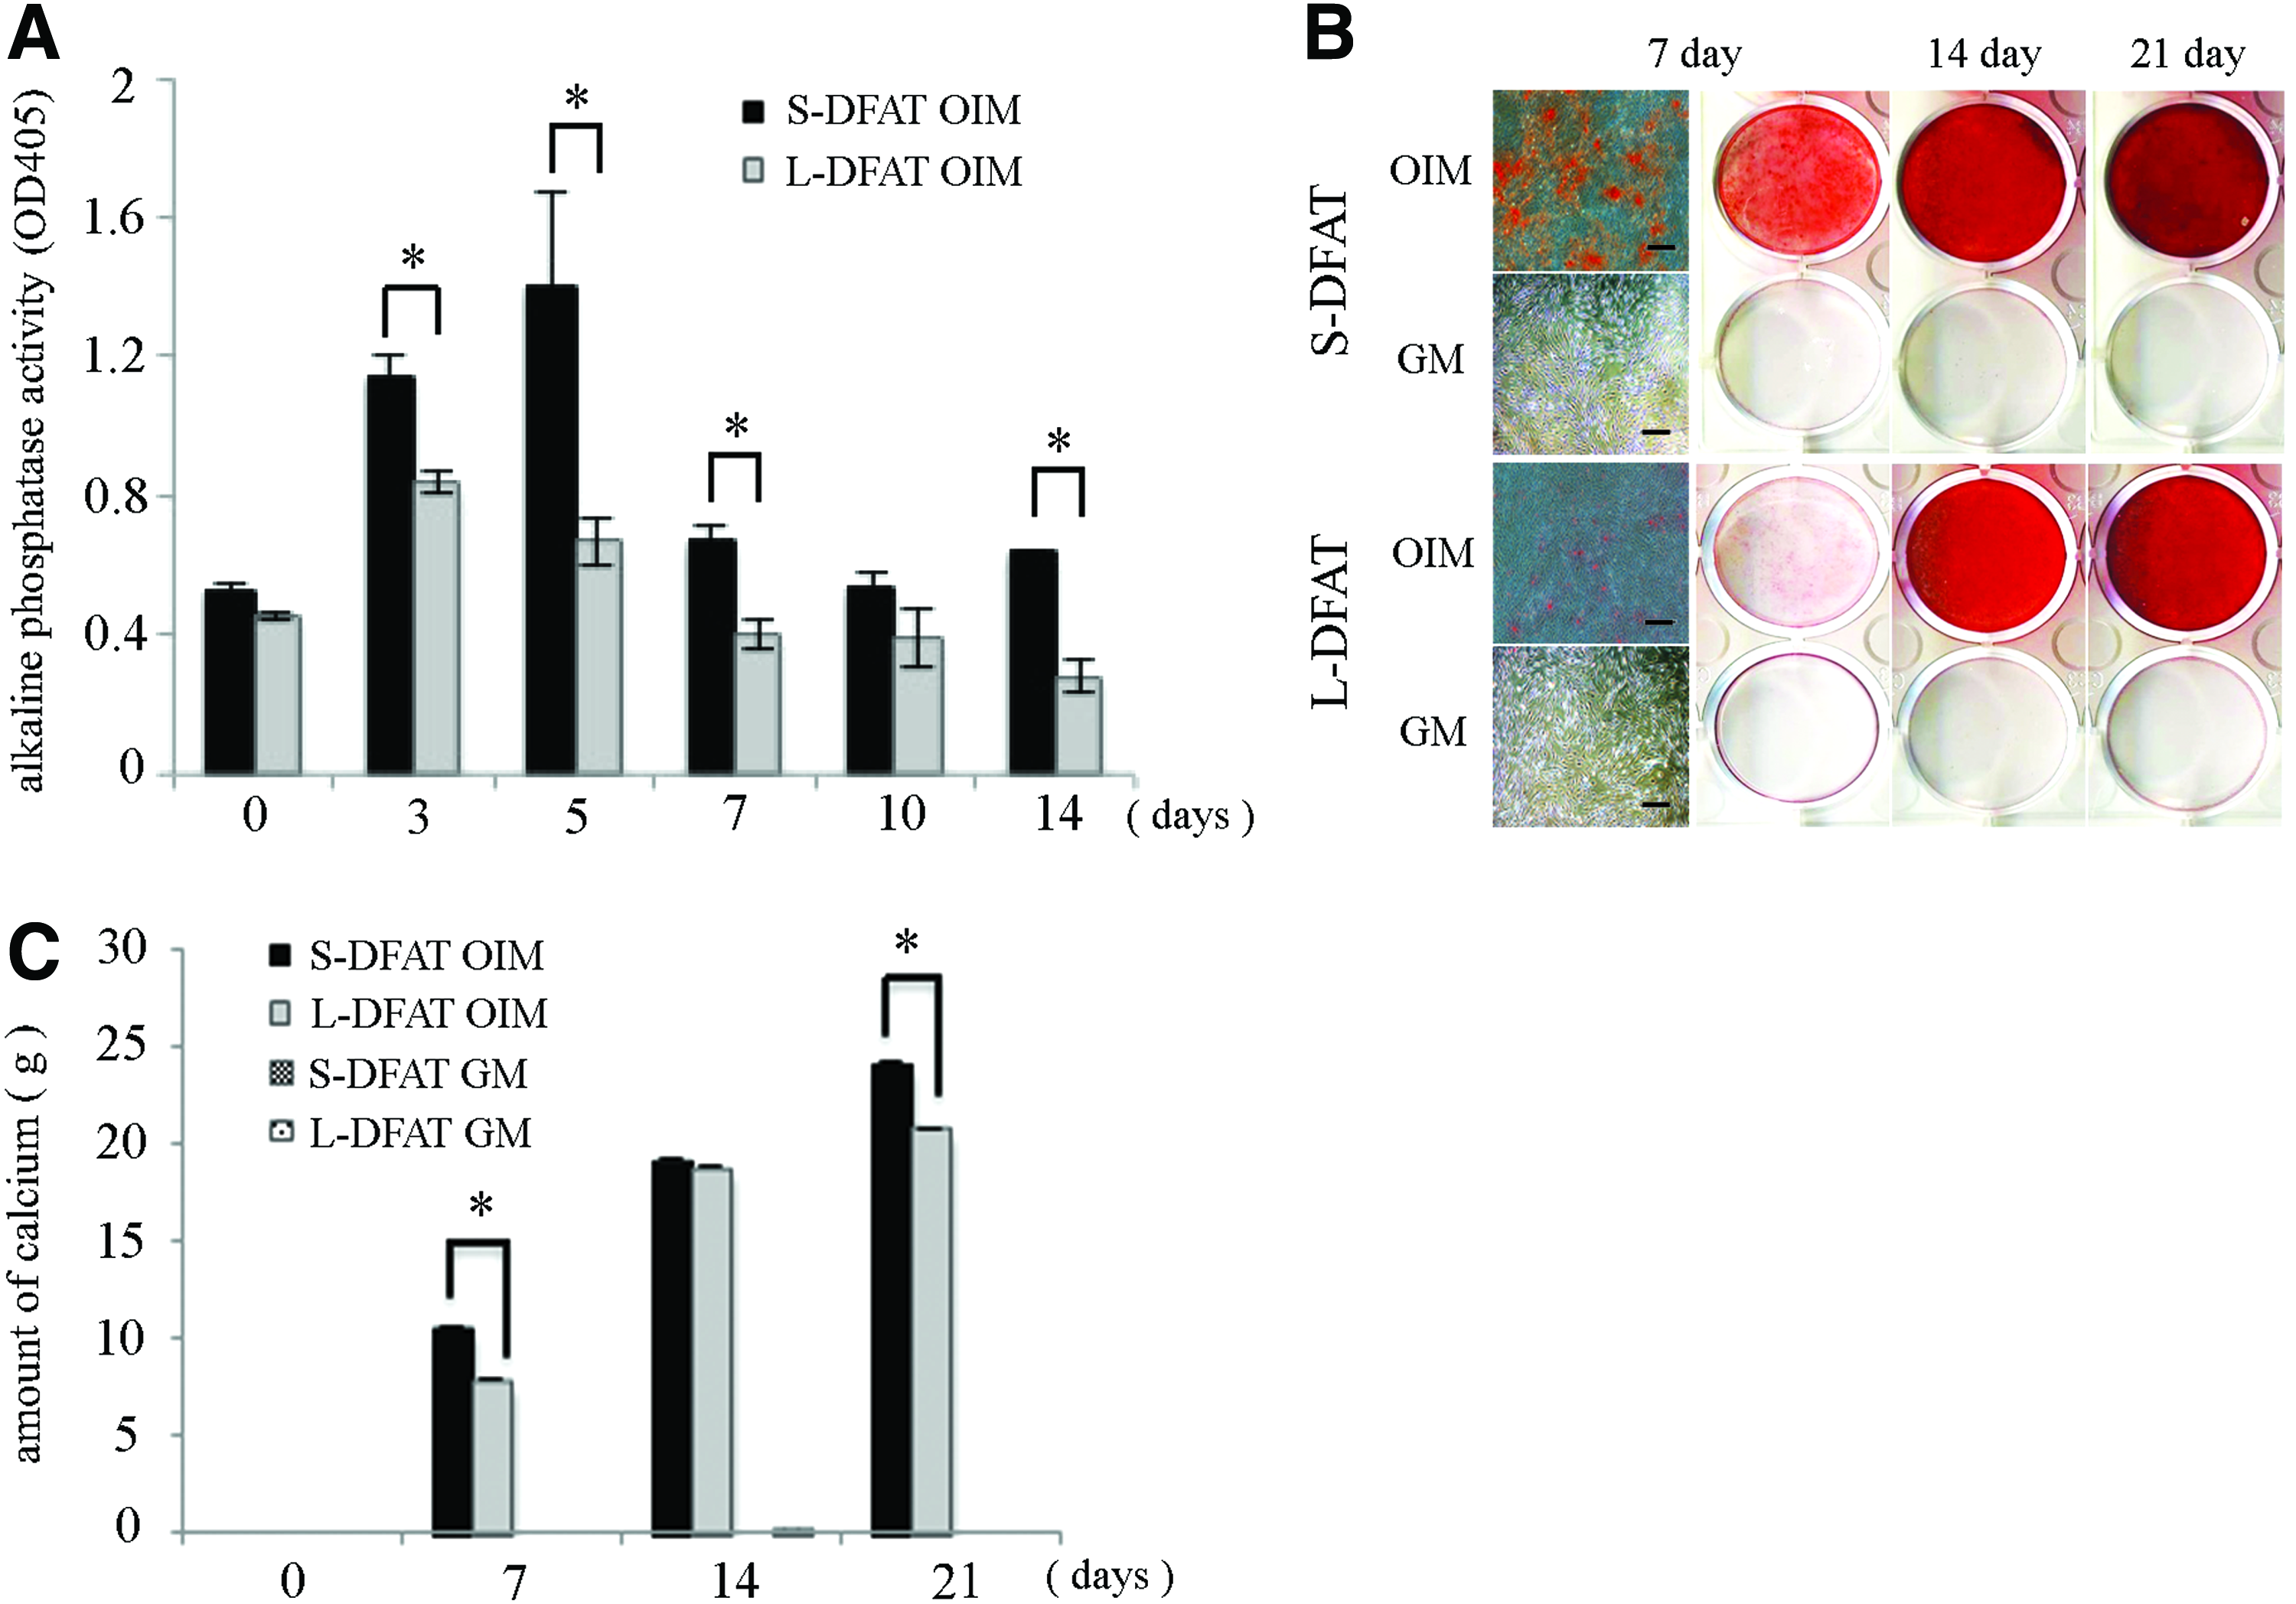
Osteogenic differentiation potential.
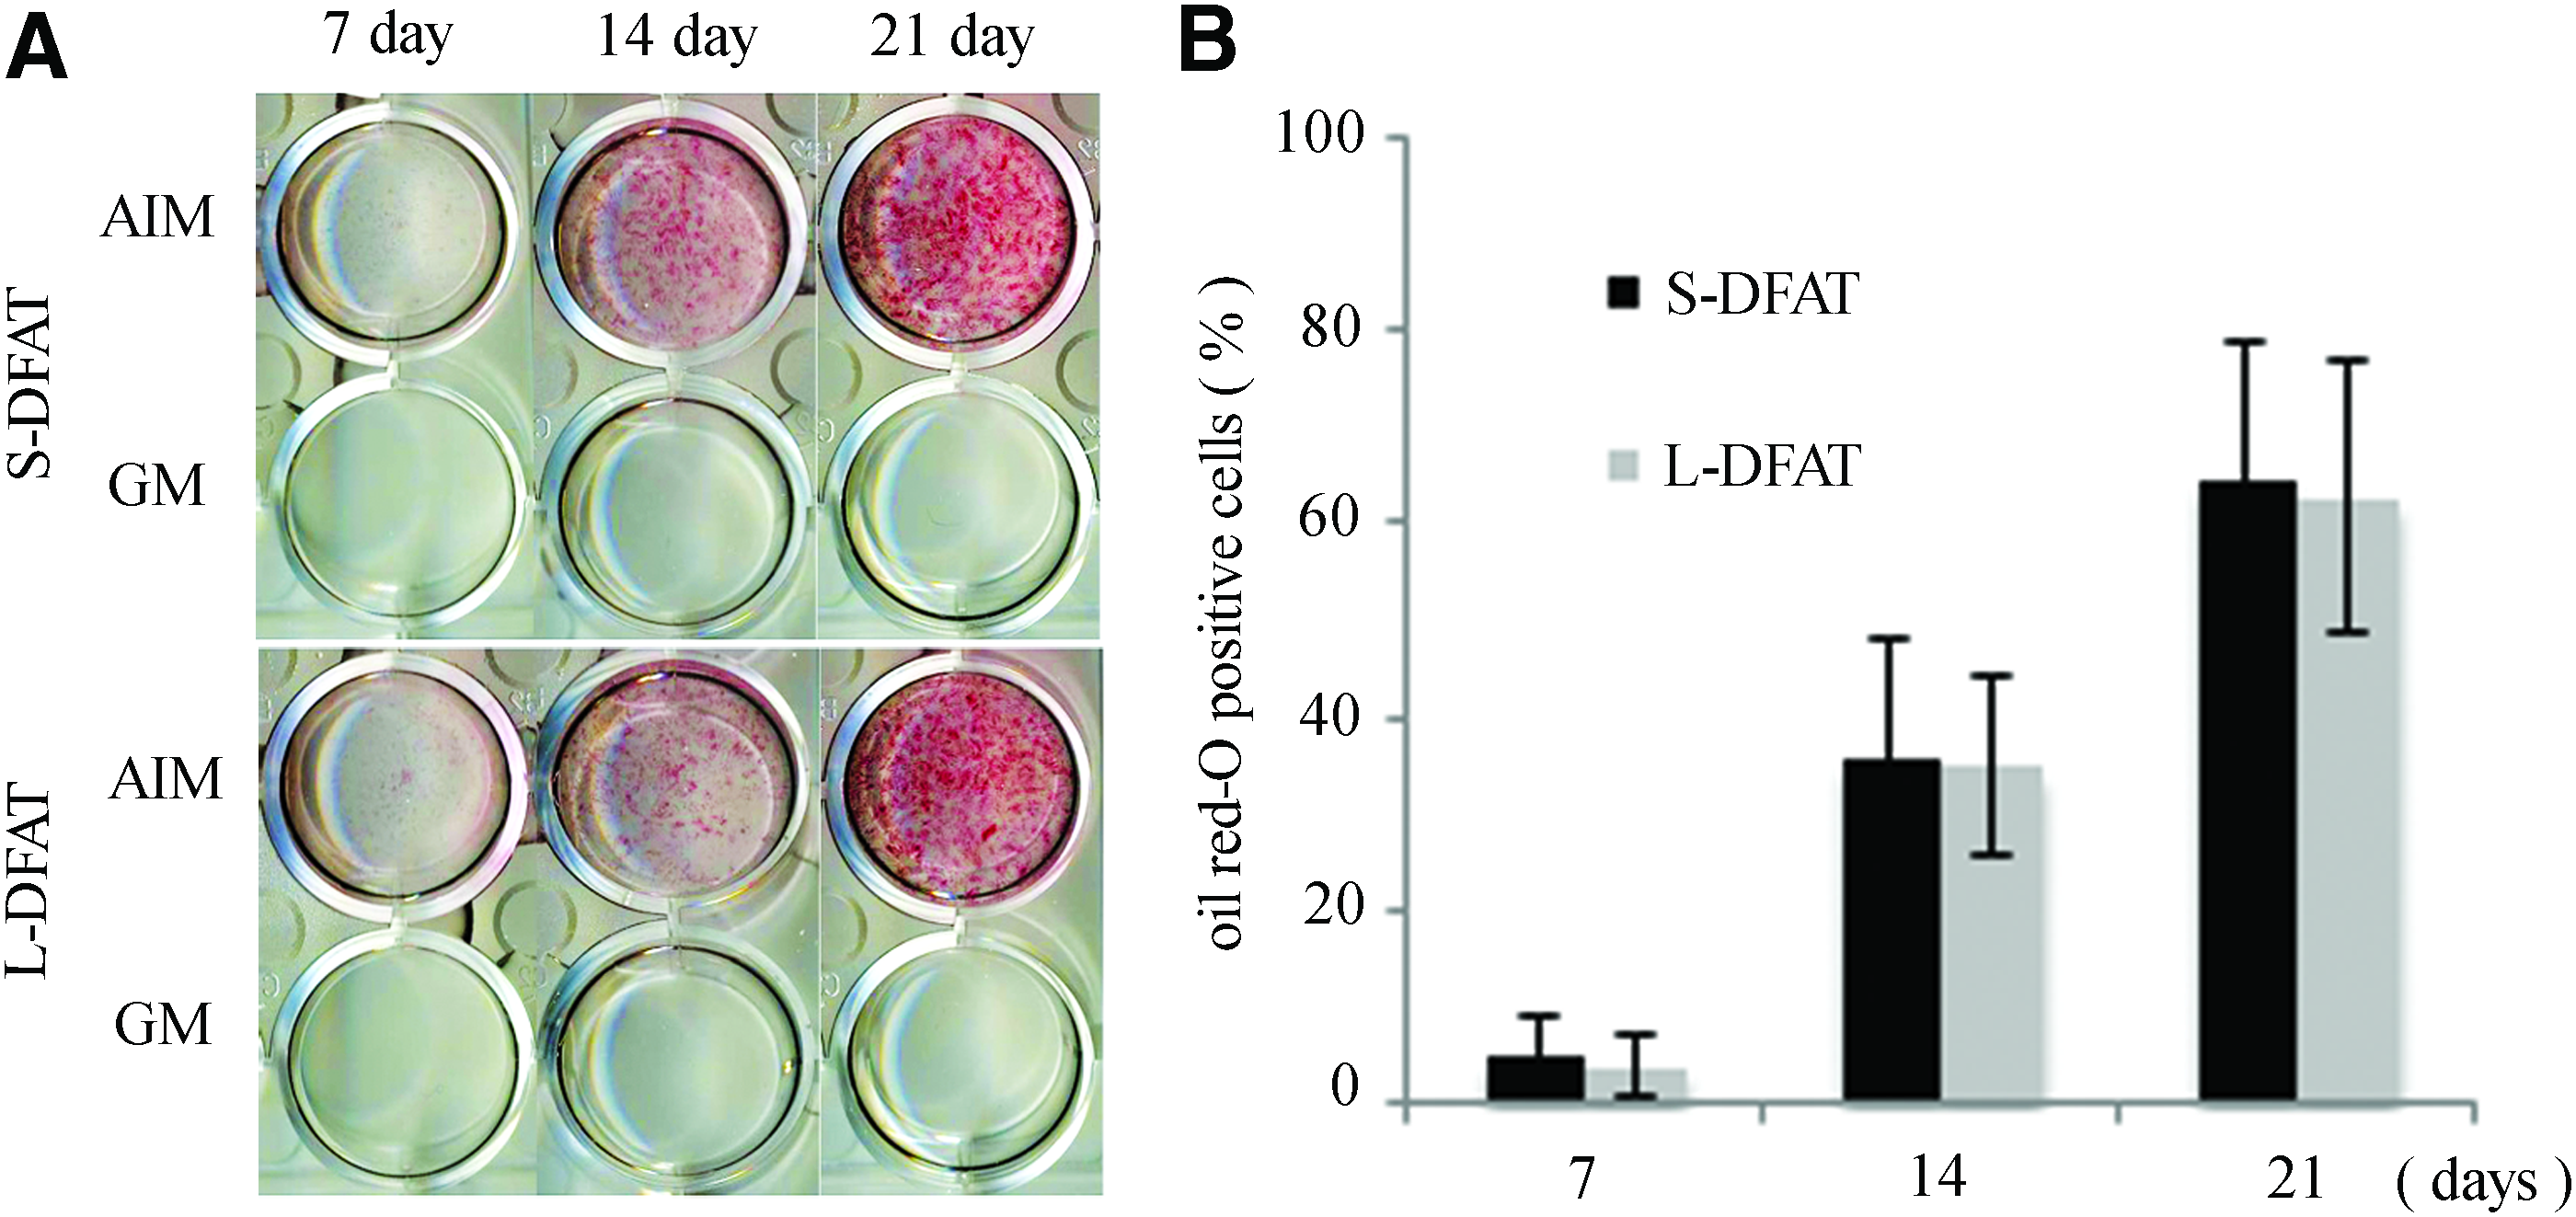
Adipogenic differentiation potential.
Discussion
The present study examined whether DFAT cells are generated from S-adipocytes, less than 40 μm in diameter and compared the properties of S-DFAT cells with those of L-DFAT cells derived from L-adipocytes with an average diameter larger than 40 μm. 27 The results defined key characteristics of DFAT cells and provided novel insights into the different characteristics of S- and L-DFAT cells.
We first examined the size distribution and purity of the isolated mature adipocytes after centrifugation. Our study showed that almost all floating cells were unilocular mature adipocytes by Nile Red fluorescence staining, consistent with a previous study finding that almost all floating cells (over 98%) were mature adipocytes.28,29 In addition, we observed that almost all the cells of ∼40 μm in diameter exhibited the characteristics of mature adipocytes based on Nile Red fluorescence staining. Interestingly, the number of cells smaller than 40 μm in diameter was significantly higher than that of adipocytes of larger size (60–80 μm), conflicting with the results reported previously. In one study, a large number of mature adipocytes measured 50–110 μm in diameter, 27 whereas a second reported the average adipocytes to be 112 μm (range 96–120 μm) in diameter. 30 We propose this discrepancy because of the site of the cell source. The previous studies used skin subcutaneous tissue from patients with a mean age of ∼50, 27 and 40 years, 30 and the differences in adipocyte size seemed to relate to the patient's age. In contrast, we obtained adipose tissue from the BFP and found that the size distribution of adipocytes was not different across a patient age range of 20–40 years (Table 3). Our future work will, therefore, compare adipocyte size across cells isolated from skin subcutaneous tissue and BFP from the same donors.
Next, we compared the S- and L-DFAT cells based on the characteristics for MSCs. Our CFU-F analysis indicated similar potential between the size groups, while flow cytometry revealed higher CD146 expression in the S-DFAT cells compared to the L-DFAT cells, although the remainder of the phenotype profile was consistent with the previous report.3,31 The CD146 marker is most commonly used to isolate MSCs from human periodontal ligament tissue. 32 However, previous research showed that DFAT cells do not express the pericyte markers (CD140b, NG2, and CD146), suggesting that DFAT cells are distinct from pericytes, 33 although, Shen et al. subsequently showed CD146 expressed in DFAT cells. 34 Adding to the controversy, a recent study found no CD146 expression in unpassaged DFAT cells, but expression of this antigen from day 7 of culture. 35 Together with the previous work, our similar results of CD146 expression in the passaged S- and L-DFAT cells at 7 days of culture might support that DFAT cells gradually acquire the characteristics of precursor cells. 35
In embryonic stem (ES) cells, maintenance of a pluripotent state is conferred by a core of developmentally regulated transcription factors, including the homeodomain proteins OCT3/4 and NANOG, and the high-mobility group transcription factor SOX2. 36 In this study, S- and L-DFAT cells showed similar expression patterns for c-MYC, KLF4, and OCT3/4, but not SOX2. We previously examined the expression of ES cell marker in the MSCs from deciduous and supernumerary teeth, and found that MSCs derived from the dental pulp of deciduous teeth expressed c-MYC and KLF4, but not OCT3/4 and SOX2. 22 On the other hand, MSCs from the dental pulp of mesiodentes expressed all four genes. 21 Furthermore, PrimerArray analysis showed different expression levels for six genes between the S-DFAT and L-DFAT cells (Table 4). These results together suggested varied expression patterns among stem cells obtained from various tissues.
We also found herein that S-DFATs cells could potentially differentiate into osteoblasts and adipocytes, and that S-DFAT cells showed higher osteogenic potential in particular compared to the L-DFAT cells. Interestingly, this finding relates to the CD146 expression results mentioned above based on previous research suggesting that CD146 expression is correlated with a higher osteogenic potential. Periodontal ligament-derived and bone marrow-derived MSCs, both highly expressing CD146, showed a greater osteogenic potential than lower expressing cells.37,38 Similarly, a comparison between ASCs and DFAT cells obtained from BFP demonstrated more effective induction of osteoblasts from DFAT cells than from ASCs, 19 whereas in our current experiments, S-DFAT cells exhibited higher osteogenic potential than L-DFAT cells. The results suggested that S-DFAT cells have an advantage over L-DFAT cells and ASCs in bone tissue engineering. On the other hand, there was no significant difference between S- and L-DFAT cells in adipogenic differentiation potential.
We also examined the efficiency of dedifferentiation from mature adipocytes to DFAT cells based on the proposal that smaller adipocytes could show higher efficiency compared to larger adipocytes because proliferation activity was recently attributed to small-sized adipocytes. 14 As speculated, the S-adipocytes contained more juvenile adipocytes than those of the L-adipocytes, suggesting higher rates of dedifferentiation for S-DFAT cells compared to L-DFAT cells and that adipocyte size is closely positively associated with dedifferentiation. More studies are needed to reveal how cell size could influence the efficiency of mature adipocyte dedifferentiation.
In summary, we isolated floating mature adipocytes from human BFP and successfully dedifferentiated them into DFAT cells and it revealed that there was a high proportion of S-adipocytes in BFP. Since the clinical feasibility that culturing DFAT cells in 20% serum will make it difficult, and more studies will be necessary to identify the inducer of mature adipocyte dedifferentiation, we proposed based on these results that S-adipocytes are more advantageous for inducing dedifferentiation into DFAT cells than L-adipocytes. We also provide the first report on the characteristics of S-DFAT isolated from S-adipocytes and of higher osteogenic differentiation ability of these cells compared to L-DFAT cells. Therefore, DFAT cells obtained from BFP could be suitable donor cells for bone and periodontal tissue engineering.
Footnotes
Acknowledgments
This work was supported in part by the Grant-in-Aid for Scientific Research (B) (21390528, 15H05037, to M.H.), (C) (26463101 to N.S.), (Houga) (15K15724 to M.H.), Grant from Dental Research Center for 2015, Nihon University School of Dentistry (to N.S.), the research grants from the Promotion Project of Medical Clustering of Okinawa Prefecture and JSPS KAKENHI (15H04607 to K.K.), and Nihon University Graduate School of Dentistry research fund (10010105 to N.T). This work was also supported by MEXT-Supported Program for the Strategic Research Foundation at Private Universities (S1411018).
Disclosure Statement
No competing financial interests exist.