
Abstract
The noninvasive and longitudinal imaging of cells or cell aggregates in large optically scattering scaffolds is still a largely unresolved problem in tissue engineering. In this work, we investigated the potential of near-infrared (NIR) photoacoustic (PA) tomography imaging to address this issue. We used clinically relevant sizes of highly light scattering polyethersulfone multibore® hollow fiber scaffolds seeded with cells. Since cells have little optical absorption at NIR wavelengths, we studied labeling of cells with absorbers. Four NIR labels were examined for their suitability based on absorption characteristics, resistance to bleaching, and influence on cell viability. On the basis of these criteria, carbon nanoparticles proved most suitable in a variety of cells. For PA imaging, we used a research setup, based on computed tomography geometry. As proof of principle, using this imager we monitored the distribution and clustering of labeled rat insulinoma beta cell aggregates in the scaffolds. This was performed for the duration of 1 week in a nondestructive manner. The results were validated using fluorescence imaging, histology, and light microscopy imaging. Based on our findings, we conclude that PA tomography is a powerful tool for the nondestructive imaging of cells in optically scattering tissue-engineered scaffolds.
Introduction
D
A method that is attracting great interest in imaging optical absorption contrast in highly scattering media is photoacoustic (PA) also called optoacoustic imaging.3–5 In this method a short pulse of light is used to irradiate the sample of interest. The instantaneous absorption of light by naturally occurring chromophores, or extraneously added dyes, induces a localized temperature rise, which results in the generation of ultrasound pulses through the thermoelastic effect. Using ultrasound transducers placed outside the medium it is possible to detect these ultrasound waves, even those arising from large depths, thanks to their weak scattering and attenuation in soft tissues.3,4 An image reconstruction algorithm is then utilized to ascertain the location of the ultrasound sources, allowing for three-dimensional visualization of absorber distribution.3,4
When comparing PA tomography with other nondestructive imaging techniques like computed tomography (CT)-X-ray and magnetic resonance imaging (MRI), PA has the advantage of using nonionizing laser illumination, as it is faster and less expensive. 6 The PA technique in a microscopic variant (PAM) has been applied for high-resolution imaging of scaffold degradation of polylactic glycolic acid (PLGA) inverse opal scaffolds, and for the visualization of melanoma cells inside these scaffolds.7,8 The PA technique in a microscopic variant (PAM) has been applied for high-resolution imaging of scaffold degradation of PLGA inverse opal scaffolds, and for the visualization of melanoma cells inside these scaffolds.7,8 In addition, in similar scaffolds, the neovascularization in a mouse model was monitored by combining PAM with OCT. 9 Furthermore, Zhang et al. used PAM together with a novel contrast agent based on 1-(4,5-dimethyl-2-thiazolyl)-3,5-diphenylformazan (MTT formazan) for staining of encapsulated cells in their PLGA inverse opal scaffolds. Zhang et al. also showed multiwavelength PAM applied for imaging of cocultures and the evaluation of (immune) histochemistry in both 2D and 3D dimensions. 10 PAM provides excellent resolutions, but is limited to shallow depth imaging. Recently, a commercially available hybrid PA/ultrasound system 11 was used to image single-walled carbon nanotube (SWCNT)-incorporated PLGA (SWCNT-PLGA) implanted 2 mm deep in rats. The scaffolds were successfully visualized using PA imaging at 7 and 14 days postsurgery. While this study showed clearly the capability of PA imaging to visualize the scaffold in vivo at two time points, it did not image cells and their fate inside the scaffold.
In this work, we use a PA computed tomography imager based on acquiring multiple projections around the object, to image cell aggregates inside large tissue-engineered scaffolds over time. We used a polyethersulfone (PESM) multibore® hollow fiber as the scaffold. This PESM scaffold possesses clinically relevant thickness of 4 mm in diameter (and centimeters in length). These specific multibore hollow fibers are commercially available and used for water treatment. In literature they are described as a hepatocyte bioreactor and a medium perfusion system for three-dimensional tissue-engineered constructs.12,13 These studies showed that the multibore hollow fiber was biocompatible.12,13 The scaffolds were seeded with rat insulinoma cells or primary bovine chondrocytes, as a model for Islets of Langerhans, to investigate the performance of the imaging approach and optimize it for future in vivo applications. Near-infrared (NIR) wavelengths showed low scaffold signal background and deep penetration depths compared with visible wavelengths. Since cells show low optical absorption at these wavelengths, prior labeling of the cells is required. We therefore, investigated four NIR dyes for their optical absorption characteristics, resistance to bleaching, signal intensity, and influence on cell viability, to select the most optimal label for PA tomography. The PA images of the labeled cells in the scaffolds were validated using fluorescence imaging, histology, and light microscopy imaging.
Materials and Methods
Cell culture
As Islets of Langerhans are not abundantly available, cell aggregates with a diameter of 100 or 200 μm of either rat insulinoma (INS1E) beta cells or primary bovine chondrocytes were used as a model for islets. The INS1E cells (provided by Dr. B. Guigas, LUMC, Leiden, the Netherlands and Dr. P. Maechler, University Medical Center, Geneva, Switzerland) were cultured in RMPI (Gibco) with 2.05 mM
Cell labeling
Performances of four cell labels were evaluated: DiR, carbon nanoparticles (CNP), Sienna+, and Endorem.14–17 DiR (Invitrogen) is near IR fluorescent, lipophilic carbocyanine DiOC187 (DiR) with a fluorescence excitation at 750 nm and an emission at 780 nm and two superparamagnetic iron oxide particles (SPIOs). DiR diffuses laterally with the plasma membrane of cells. CNP (India Ink; Rotring) were collected from Indian ink. Only particles smaller than 0.22 μm, used as the Indian ink, were filtered through a 0.22 μm filter. Both Sienna+ and Endorem are SPIOs. Sienna+ (Endomagnetics Ltd. Cambridge) are carboxydextran-coated iron oxide particles. Endorem (Guerbet) are dextran-coated iron oxide particles. Cells were labeled with 4 μM DiR following the manufacturer's protocol (Invitrogen). Cells were incubated overnight with Sienna+ (200 μg/mL), Endorem (200 μg/mL), and CNP (diluted 5000× in medium). The same protocols were maintained for all cell types.
Agarose microwell fabrication and controlled cell aggregate formation
These agarose microwell chips are a platform to create cell aggregates in a controlled manner. They were used for validation, as their properties are well known. Sterile agarose microwells were fabricated as described previously. 18 In short, polydimethylsiloxane-negative molds containing either 200 μm or 400 μm wells were sterilized with 70% ethanol. 3% Ultrapure TM agarose (Gibco Invitrogen) was dissolved in PBS. The solution was heated to 100°C in a microwave oven. Molds were placed inside six-well plates and filled with 8 mL of 3% agarose solution. The plates were centrifuged at 300 g for 1 min to remove air bubbles and stored at 4°C for at least 30 min. After the gel is formed, the molds were gently removed from the agarose using a sterile spatula. Using a sterile punching device, chips were punched out leaving a thin agarose wall on all sides to fit into a 12-well plate. Chondrocytes or INS1E cells were then seeded onto the different agarose chips (1.5 million chondrocytes/chip, and 1 million INS1Es/chip). To understand how many cells give rise to the signal of one aggregate, we have determined the amount of cells per aggregate as follows: In case of the 200 μm diameter wells a total of 2865 wells are available in one chip. Whereas, 1465 wells are available in a chip with 400 μm diameter wells. The cells are evenly dispersed over the entire microwell chip during seeding. From the abovementioned information, the average number of cells per aggregate can be deduced. For chondrocytes, in microwell chips with 200 μm wells, one chondrocyte aggregate comprises 524 cells (200 μm) and 1023 cells when seeded in a chip with 400 μm wells, since in the latter condition less wells in total are available to capture the same amount of cells. For INS1Es one aggregate comprises either 350 cells (200 μm wells), or 683 cells (400 μm wells). The plates were centrifuged at 150 g for a maximum of 1 min and 1 mL of medium was carefully added to the chips. After 24 h (Chondrocytes) or 48 h (INS1E) at 37°C, if needed, aggregates were flushed out of the chips and used for seeding in the multibore hollow fiber.
Multibore hollow fiber
A modified poly(ether sulfone) (PESM) multibore hollow fiber (Inge AG) was used to encapsulate the cells (1 cm pieces). The 4 mm single fiber consists of seven bores with a diameter of ∼0.9 mm each. The membrane has pores of 20 nm. 13
PA tomography
The imager uses a 32-element curvilinear ultrasound detector array (IMASONIC) with a central frequency of 6.25 MHz and 80% bandwidth. A 32-channel pulser–receiver system (Lecoeur Electronique) was used for data acquisition 19 at a sampling rate of 80 MHz and 60 dB gain. The detector is placed inside the water tank and connected to a rotator stage (Fig. 1A, B). Illumination is achieved using light from an optical parametric oscillator (Opotek, 700–950 nm) pumped by a Q-switched Nd:YAG laser (Quanta-Ray; Spectra Physics) operating at 10 Hz repetition rate19,20 and delivering 5 ns pulses of about 28 mJ. The laser is coupled into a fiber bundle, which splits into seven branches of about 9 mm diameter. One fiber is used to monitor the delivered energy and the others are distributed around the sample (Fig. 1A, B). The data are stored and reconstructed off line using back-projection algorithm. 21

Overview of experimental setup.
Before each set of measurements, a calibration measurement was performed. This calibration ascertains the imaging geometry for the reconstruction algorithm such as the center of rotation and positions of detector elements. For this purpose, a phantom was made, which contains four horsetail hair of 250 μm diameter at four positions around the center of the phantom, for more details reader can refer to.20,21 The images of the scaffolds and their contents were obtained by performing 20 projections with 18 degree steps. It took about 4 min to image one slice. The entire imaging took about 40 min.
Investigation into an optimum NIR PA cell label
INS1Es were labeled with DiR, CNP, Sienna+, and Endorem. Then they were seeded (865,000 cells/chip) in a chip containing 400 μm agarose microwells. After 1 day, agarose chips were fixed in 10% formalin (1 h, RT) and washed with PBS (3×). To prevent loss of aggregates, a layer of agarose was placed on top of the chips. Agarose phantoms were made by embedding the agarose chips inside agarose containing 0.5% (v/v) of Intralipid® 20%. Chips were imaged with a pulsed laser energy of 20 mJ/cm2 split over six fibers, using 20 projections of 18 degrees, 25 averages per image, and one slice.
Photostability examination of different labels was performed by illuminating different label solutions using a pulsed laser. The variation in the absorption spectra of DiR, CNP, Sienna+, and Endorem were measured using a spectrophotometer (UV probe 2.21). Labeling solutions were diluted to prevent oversaturation of the spectrophotometer; DiR 1000× in ethanol, CNP 5000× in dH2O, Sienna+ and Endorem 1000× in dH2O, and 100% ethanol or 100% dH2O was used as reference and baseline, based on the solvent used. A cuvet was filled with 1.5 mL diluted label solution. Before the irradiation, a spectrum of each solution was measured, then the cuvet was illuminated using a 748 nm pulsed laser with an energy of 20 mJ/cm2. Samples were illuminated three times during 15 min. After each time interval, samples were mixed and the absorption spectrum was measured.
To test the effect of the labels on cell proliferation and activity, labeled INS1E cells were cultured for 1, 3, or 7 days (n = 3). At day 1, 3, and 7 a Presto Blue assay (Invitrogen) was performed following the manufacturer's protocol (1 h incubation).
Endpoint PA imaging of labeled encapsulated cell aggregates
DiR-labeled bovine chondrocyte aggregates were seeded into six different PESM multibore hollow fibers by placing a 4-mL polyethylene tube on the tip of a 5-mL glass pipette. The cell suspension was then loaded followed by placing the hollow fiber inside the polyethylene tube. The end of the hollow fiber was closed by a surgical staple (Horizon, ligating clips). Finally the cell suspension was pipetted into the hollow fiber. This process was repeated at least three times, till all bores were filled. Finally, the other end of the hollow fiber was closed with surgical staples. Each time point (day 0 and 7) one hollow fiber containing DiR-labeled cells were fixed in 10% formalin. Before imaging, the hollow fiber is placed in the agarose sample and imaged in transverse plane with a pulsed laser energy of 25 mJ/cm2 split over six fibers. Hollow fibers were imaged using fluorescent cryotome (excitation 640 nm, emission 712 nm, slice thickness 30 μm, and exposure time of 5000 ms).22,23
PA serial imaging of encapsulated labeled INS1E cell aggregates
DiR and CNP-labeled INS1E aggregates, with or without agarose macrospheres to prevent cell clustering (4%, Agarose Bead Technologies, 150–350 μm), were seeded into a four PESM multibore hollow fibers as described previously. A specially designed agarose phantom containing a medium compartment was created at each measurement day in a sterile environment and filled with normal culture medium without Phenol Red (Fig. 1C). Each time the hollow fibers were placed inside the medium compartment (Fig. 1D). For each hollow fiber an agar sample with medium compartment was made. The phantoms were closed using an agarose plug and sealed with a layer of agarose. Samples were imaged at day 0, 3, and 7 (Fluence is 20 mJ/cm2, 10 slices in transverse plane, 25 averages, 20 projections, and 18 degrees). Right after each measurement point the hollow fiber was placed back into the culture medium to prevent any cell apoptosis. After 1 week, hollow fibers were fixed in 10% formalin and embedded in paraffin. Sections were deparaffinized, hydrated, and incubated with proteinase K (5 min, RT). After which they were stained for insulin using a rabbit anti-insulin (Santa Cruz) primary antibody and a goat anti-rabbit Alexa 568 (Invitrogen) secondary antibody. Subsequently, sections were stained for cell apoptosis using a TUNEL assay (Roche) according to the manufacturer's protocol. Sections were then mounted using a DAPI aqueous mounting medium (Vectashield hard set with DAPI), thereby directly counterstaining the nuclei of the cells with DAPI. A paraffin section was treated with Pulmozyme as a positive control for the TUNEL assay.
Statistical analysis
A two-paired Student's t-test was performed to assess statistical differences for Presto Blue results (p < 0.05).
Results
Identification of an optimal NIR PA cell label
The relative performances of four cell labels were evaluated: DiR, CNP, and two SPIOs Sienna+ and Endorem,14–17
with their respective absorbance spectrum depicted in Supplementary Figure S1 (Supplementary Data are available online at
Figure 2A shows the PA image of the complete field of view of an agarose microwell chip seeded with DiR-labeled primary bovine chondrocytes. The region marked by the rectangle is magnified in Figure 2B. Individual wells containing ∼960 cells are seen as individual spots with a diameter of ∼200 μm in the PA image. These cell numbers per aggregate were based on the total amount of cells seeded divided by the number of well in each chip. The PA signal of each individual aggregate accurately colocalized with the light microscopy image (Fig. 2C). The results showed that labeling chondrocytes with DiR was successful, and the DiR-labeled cells produced PA signals. Similar PA images of agarose chips were obtained using the other three labels, but with different average spot intensities from CNP with the highest signal to Sienna+ and Endorem with the lowest signal (Fig. 2D).
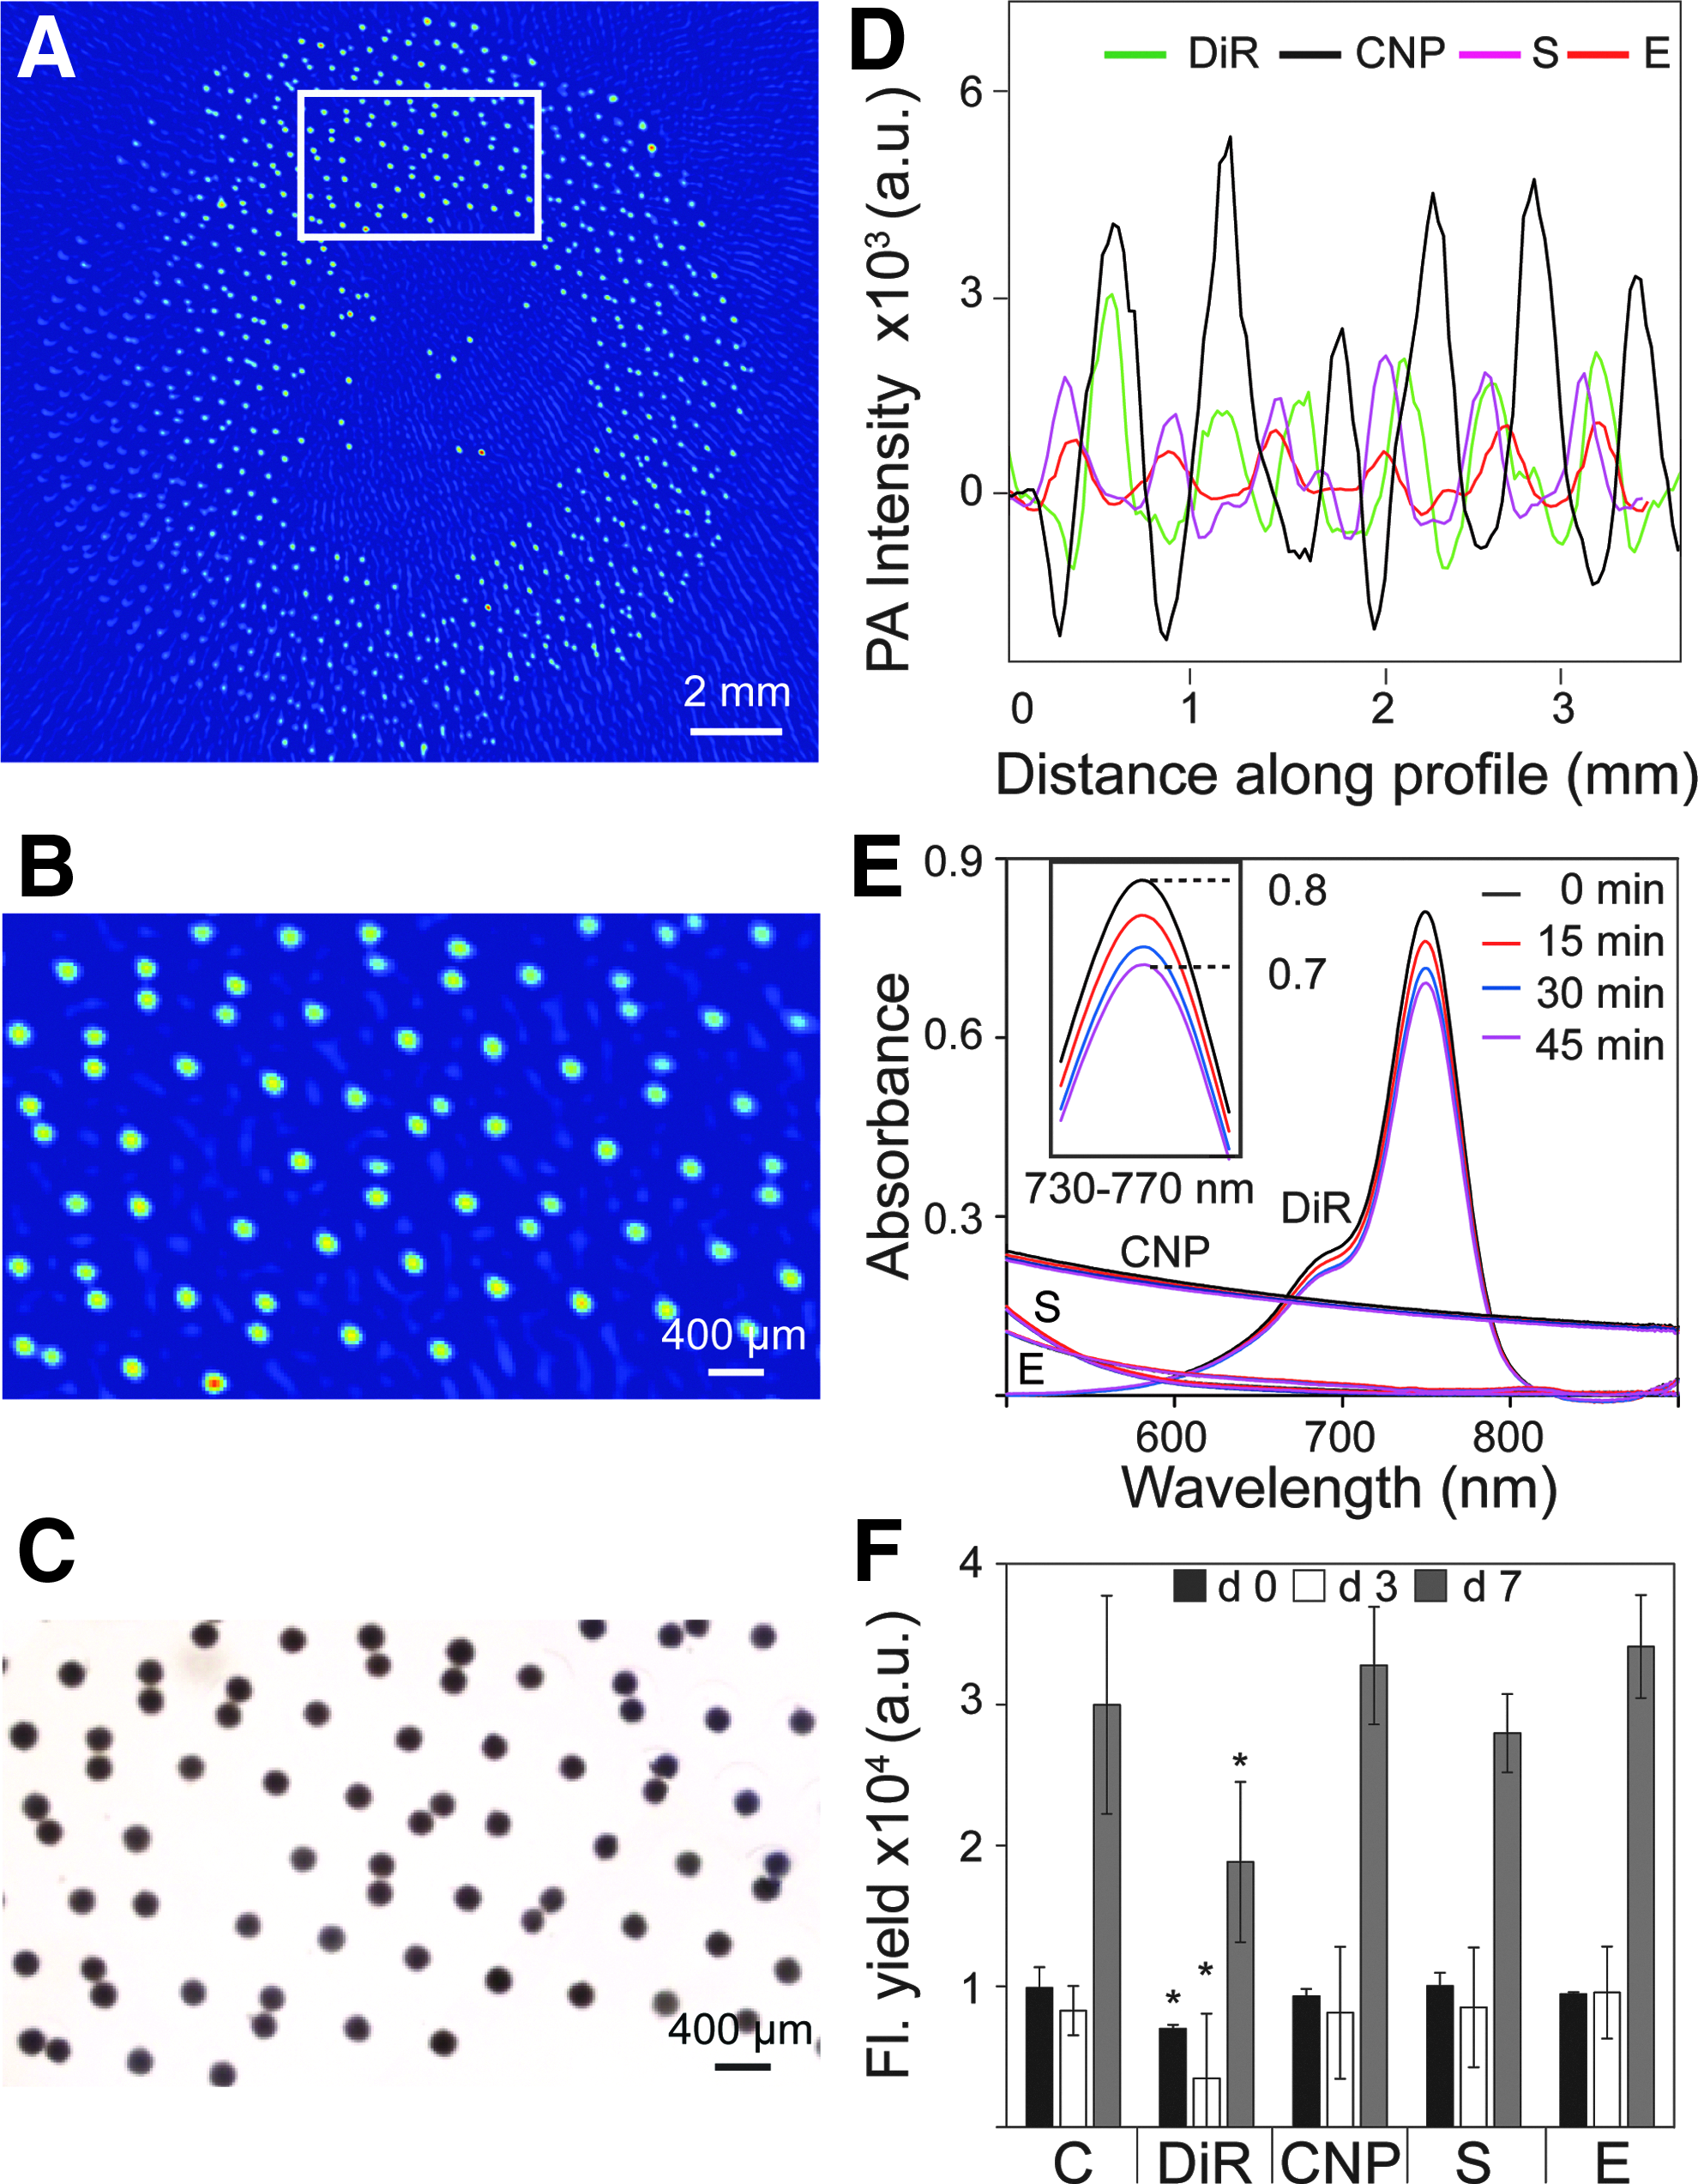
Finding the optimal near-infrared PA cell label.
For the most optimal PA signal, one should take cell type-dependent label efficiencies into account. Figure 2D depicts the profile of PA intensities from a row of INS1E aggregates obtained per label. For INS1E cell aggregates the PA response from CNP-labeled cells showed the highest signal intensity compared with the other labels from CNP with the highest signal to Sienna+ and Endorem with the lowest signal. We also performed comparable measurements using primary bovine chondrocytes to assess cell type-dependent effects (Supplementary Fig. S2).
Figure 2E shows bleaching of DiR, where a drop of ∼12.5% in the absorption of DiR was seen after 45 min of illumination. The inset in Figure 2E shows details of the absorption changes in the wavelength range 730–770 nm for DiR. Supplementary Figure S1 shows the complete overview of the photostability of the four labels of optical absorption spectra with pulsed light exposure over time. CNPs and the SPIOs showed no perceivable changes in absorption after 45 min of illumination.
Fluorescence yield from a Presto Blue assay that indicates cell activity, after labeling with the four labels, is shown in Figure 2F for days 0, 3, and 7. An initial drop in fluorescence signal was seen on day 3 for all cases. This might be due to slow attachment of cells to the tissue culture plastic, decreasing their activity. Of the four labels, only DiR negatively affected cell metabolism.
Endpoint PA imaging of encapsulated cell aggregates
Before serial PA imaging, these experiments were performed for the sake of validation using fluorescence imaging on slices of the scaffold made using a cryomicrotome.22,23 Figure 3A shows PA cross-sectional images of a hollow fiber with DiR-labeled primary bovine chondrocyte aggregates fixed directly after cell seeding at day 0, the corresponding fluorescence cryomicrotome image is depicted in Figure 3B. Hollow fiber containing DiR-labeled cells are imaged after 7 days of culture. PA image after 7 days of culture is shown in Figure 3C and the corresponding fluorescence cryomicrotome image is shown in Figure 3D.
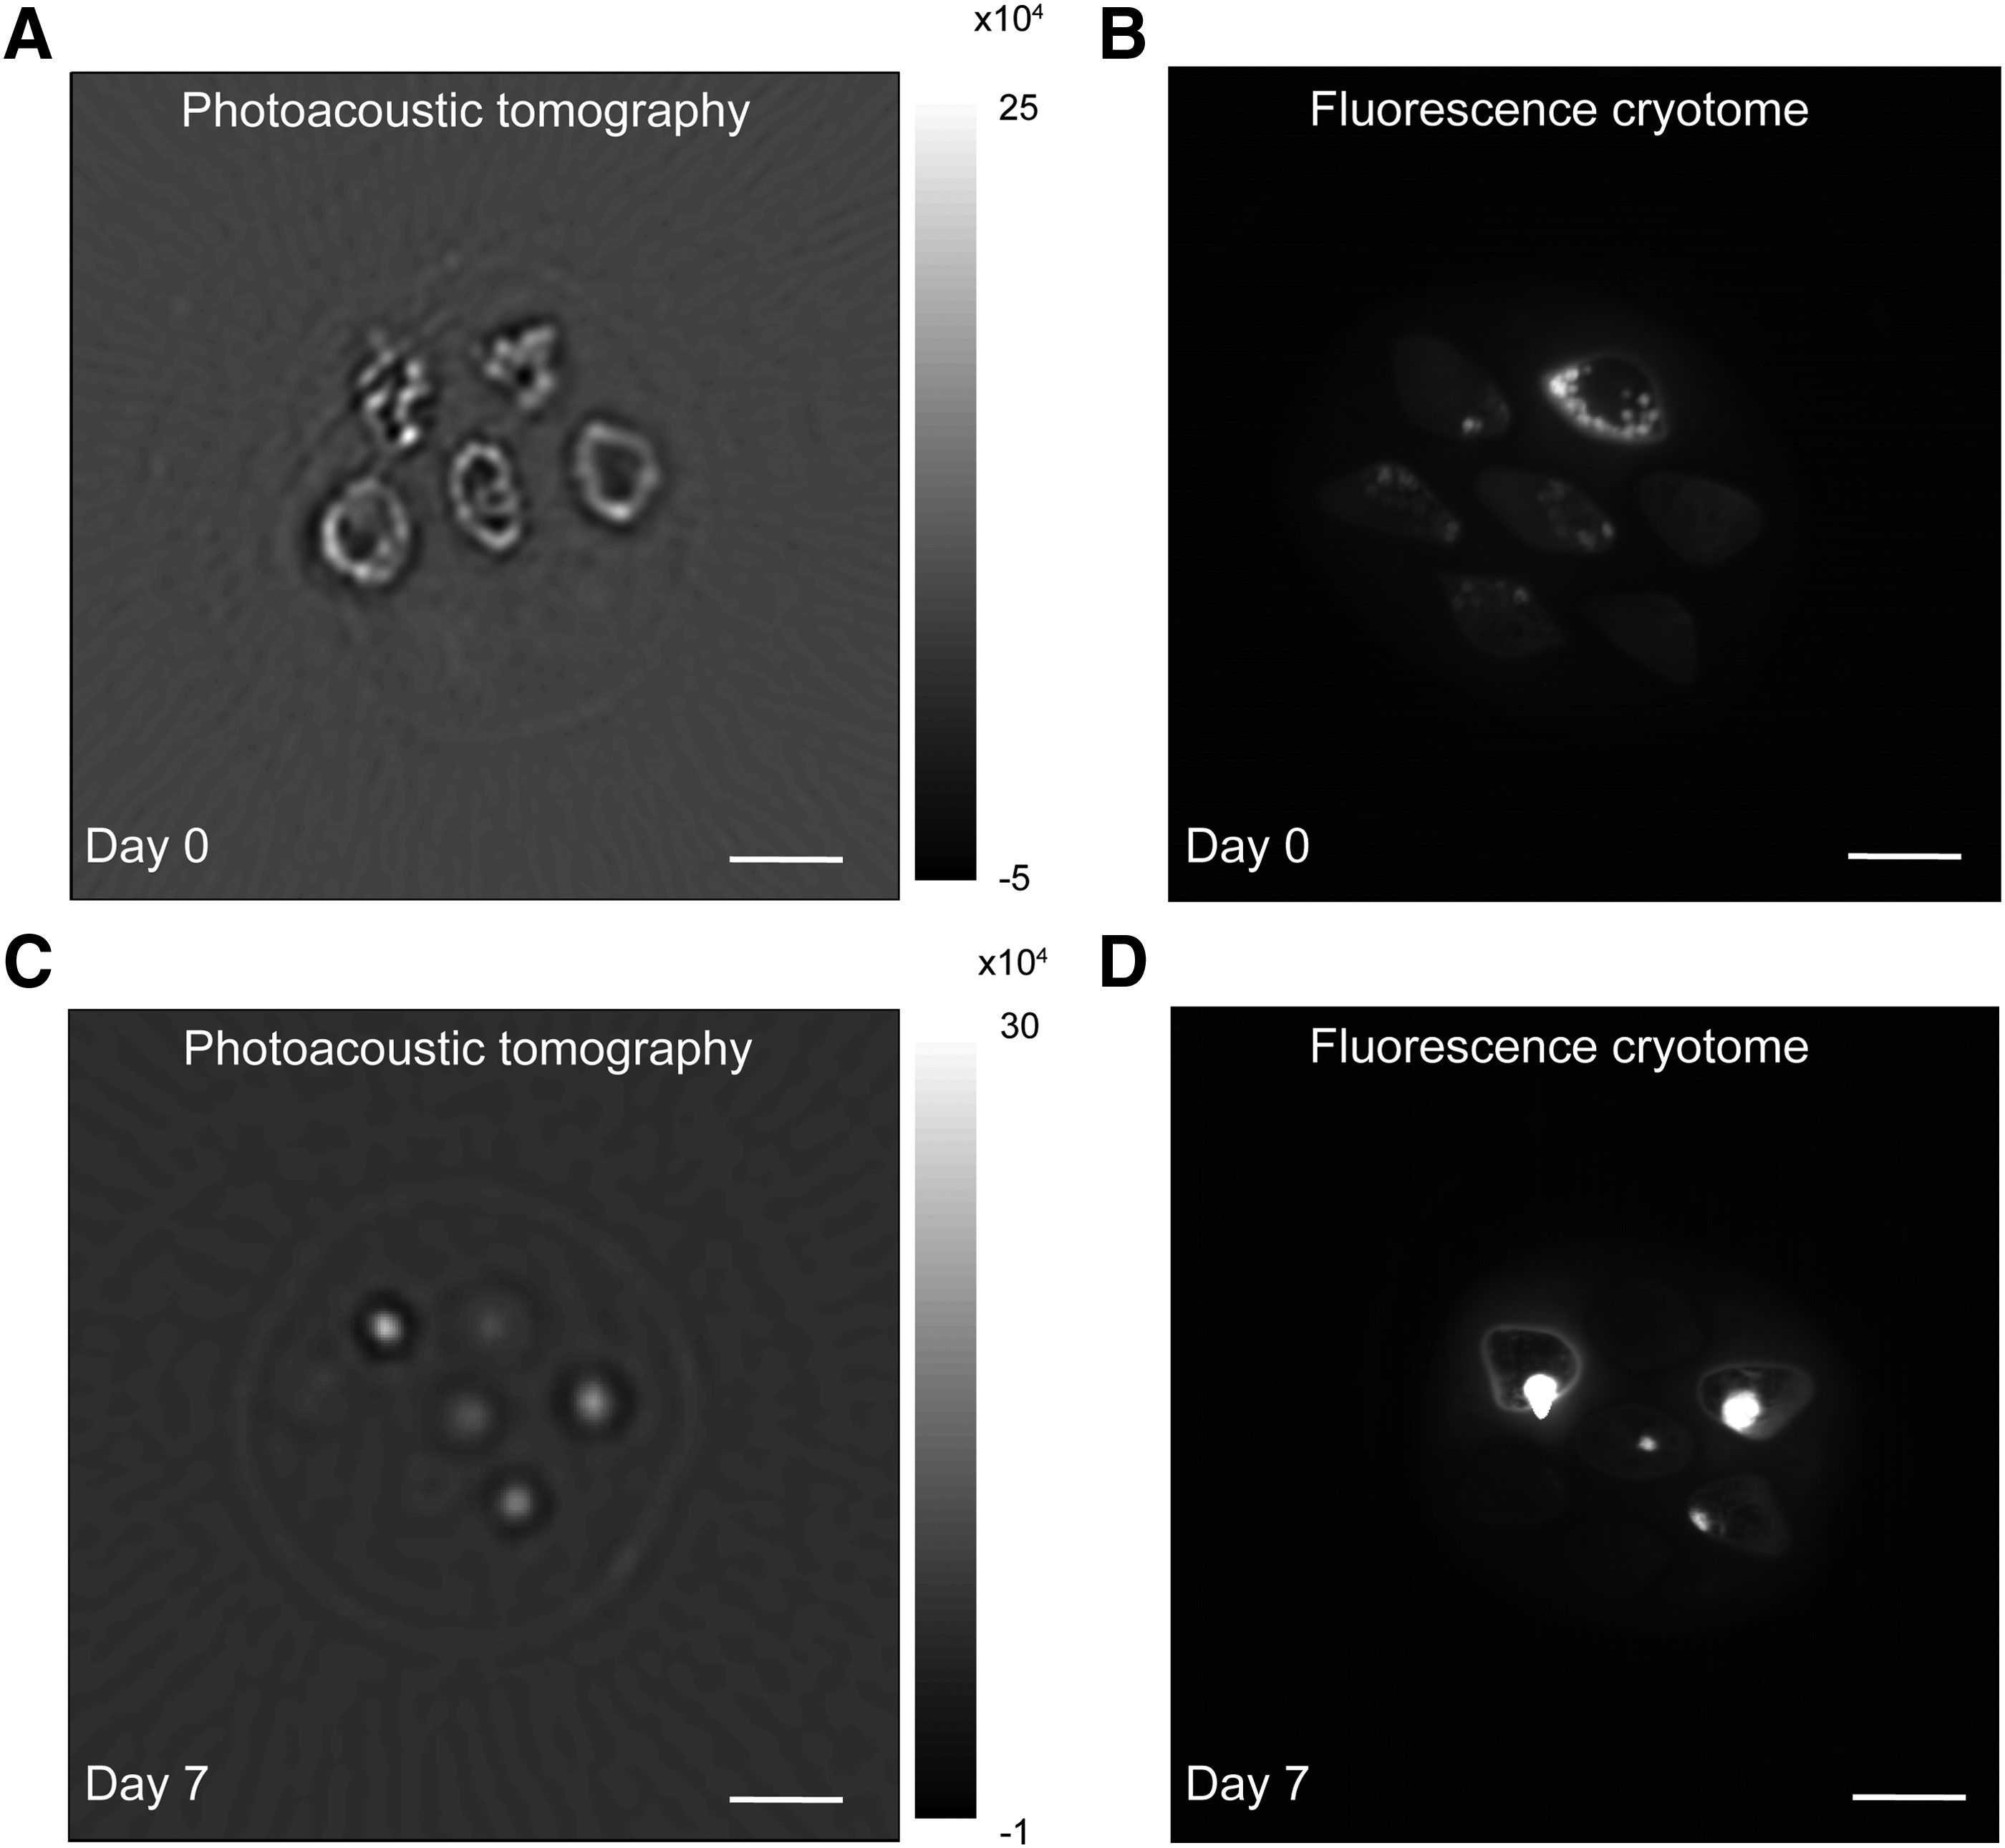
Endpoint PA imaging of labeled encapsulated chondrocyte aggregates. The same multibore hollow fiber with DiR-labeled cells was imaged with fluorescence cryotomicrotome to compare the images.
The PA images showed high-intensity regions corresponding to cell distributions inside the bores of the PESM scaffolds (Fig. 3A, C). After comparison of Figure 3A–D, we observed excellent colocalization of the PA and fluorescence cryomicrotome images. In both PA and fluorescence cryotome images individual aggregates are seen. At day 0 the images appeared overall grainy, with a dense distribution of cells at the walls of each bore in the multibore hollow fiber (Fig. 3A). At day 7 however, in the PA images, a condensation of the intensity was observed (Fig. 3C). Additionally, the signal becomes more localized in the bores and has a more homogeneous appearance between the bores (Fig. 3C). This is also seen in the fluorescence cryotome images, indicating the clustering of cell aggregates (Fig. 3D).
Longitudinal PA serial imaging of encapsulated labeled INS1E cell aggregates
We investigated the real time possibilities of longitudinal PA tomography. At specific time points during 7 days of culture, the same encapsulated INS1E aggregates were imaged by PA tomography, instead of imaging three different PESM scaffolds at three different time points. Due to cumulative photobleaching of DiR, it was not possible to image DiR-labeled samples over time (data not shown). We found no detectable PA signal after 3 days. On the contrary, the CNP-labeled cells could be imaged even at 7 days without apparent drop in PA signal intensity (Fig. 4).
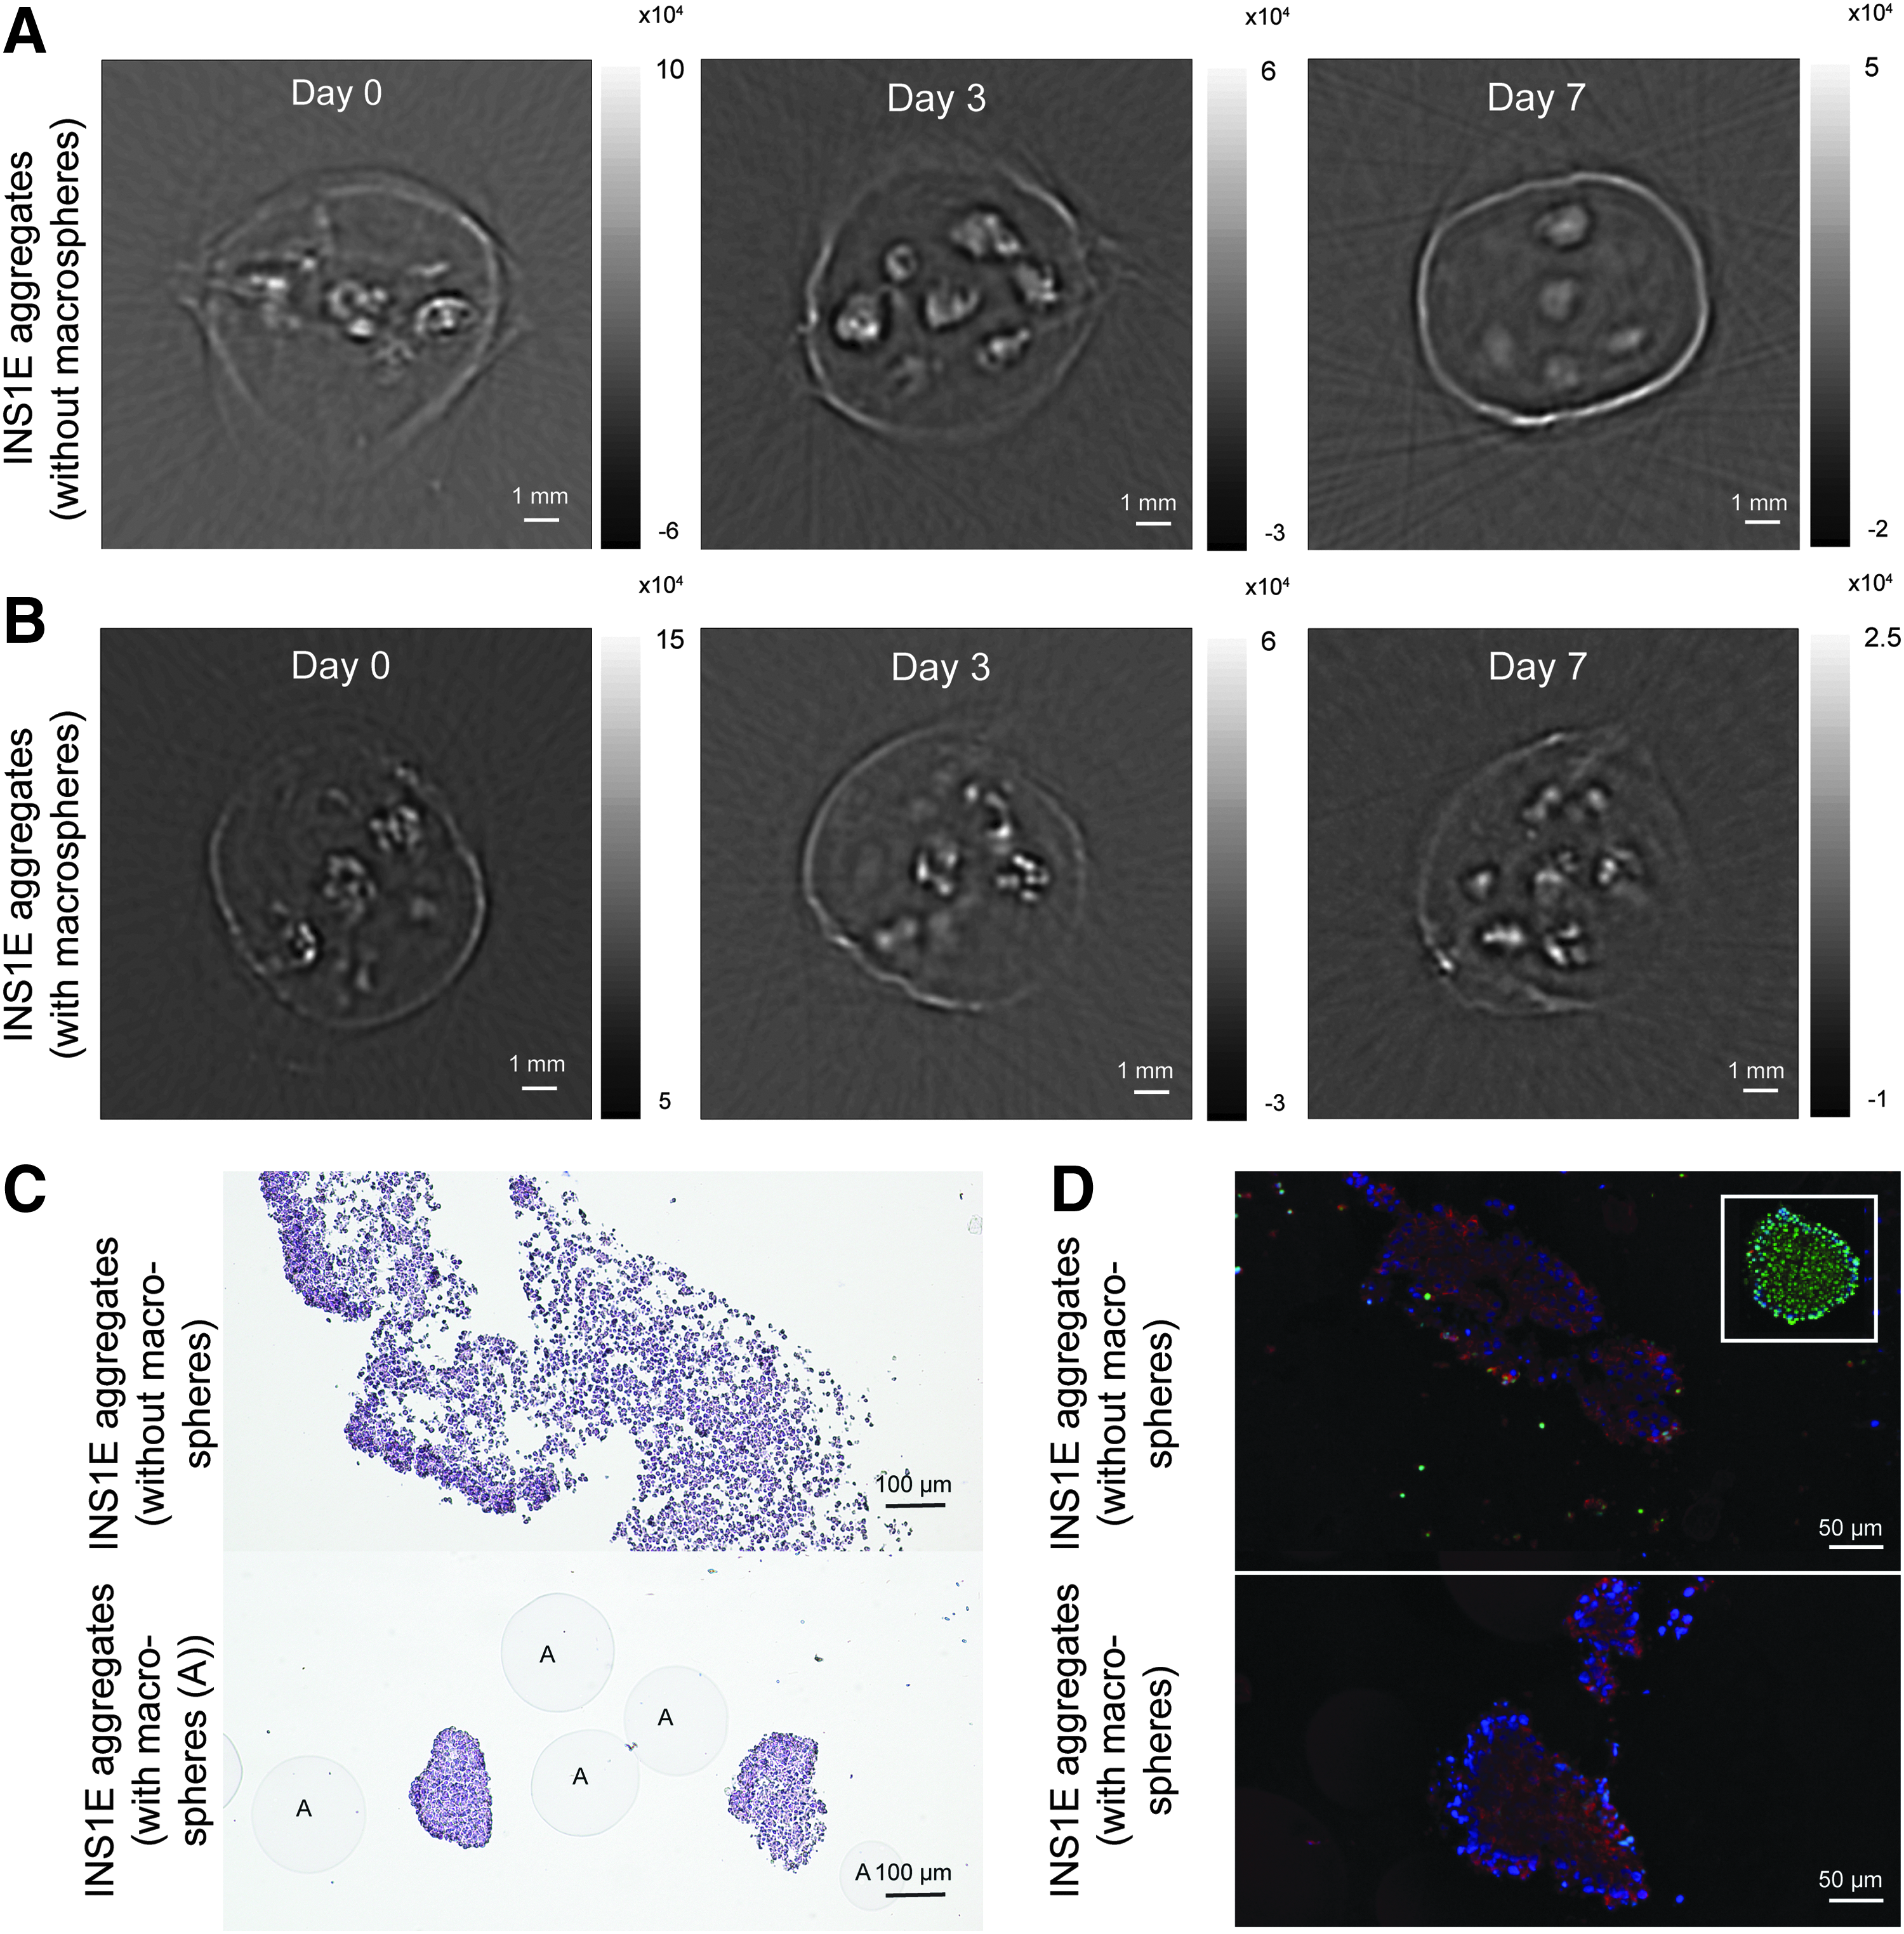
PA serial imaging of encapsulated labeled INS1E cell aggregates.
Figure 4A shows one representative slice per time point of encapsulated CNP-labeled INS1E aggregates. Directly after cell seeding (day 0), hotspots were visible in the PA images representing separate aggregates. With time, the PA images showed compaction of the signal within the bores indicating clustering of the individual INS1E aggregates.
Figure 4B shows the PA images of encapsulated INS1E aggregates in combination with agarose macrospheres into the PESM scaffold. These are used to prevent cell aggregate clustering. PA images in Figure 4B retained the graininess of the image on day 0, 3, and 7 in a contrast to the situation without the agarose macrospheres. This suggested that the macrospheres prevented cell aggregates from clustering.
After the PA measurements, comparative histology of the specimens at day 7 was done to confirm the PA findings. Figure 4C shows the Hematoxylin and Eosin-stained histological images of the scaffold. The top image represents the scaffold without the macrospheres, and the bottom image represents the one containing a mixture of labeled cells and agarose macrospheres. In the top image cell clustering is observed in contrast to the bottom image, which coincides with the PA imaging results. Using agarose macrospheres helped maintaining the original size of the aggregates (100–200 μm), without these agarose macrospheres the aggregates size increased.
To assess potential detrimental effects of prolonged illumination on cell apoptosis, we investigated apoptosis by a TUNEL assay. In addition, the presence of insulin-positive cells was determined with immunohistochemistry. Figure 4D shows hardly any apoptotic INS1E cells (green) in samples with and without the agarose macrospheres compared with a positive control section (Pulmozyme-treated sections, white square). In addition, the INS1E aggregates stained positive for insulin without any noticeable differences between the conditions (red). This shows that even prolonged imaging does not harm the cells which are important for longitudinal imaging.
Discussion
Visualizing cells in large highly scattering scaffolds is hampered when common imaging techniques are used. In this work, we report that this challenge could be met by using a less conventional imaging technique based on PA tomography. We tested to what extent we could use PA tomography to follow cells in time and with what resolution. We studied a specific scaffold modality engineered for macroencapsulation of islets of Langerhans used as an islet delivery vehicle in type I diabetes. Such scaffolds are generally large in size, millimeter to centimeter range, since they have to house a considerable large mass of islet tissue.24,25 Moreover, in case of macroencapsulation for immunoprotective applications, these devices are closed and do not allow for observation of cell behavior given the optically scattering nanoporous polymer layers that comprise these scaffolds.
We show that a number of NIR labels could be used for PA imaging in optically scattering scaffolds. Of these labels, DiR affected cell metabolism in long-term culture. In addition, DiR was sensitive for bleaching, a known and undesirable phenomenon related to fluorescent labels. 26 In contrast, high signal intensities were obtained using CNP. This label was not sensitive for bleaching and did not show evidence of cell toxicity making it ideally suited for noninvasive imaging over time. We demonstrate that signal intensity with each of these labels is cell-type dependent. The differences in signal intensities between different labels could be explained by the difference in the labeling method and label type between DiR and both SPIOs and CNP. While DiR is incorporated into the membrane of the cells, both SPIOs and CNP are phagocytized by the cells. Furthermore, the amplitude of PA signal depends on the optical absorption coefficient of the labels that is higher for CNP and DiR at the imaging wavelength used than for the SPIOs. In addition, part of the absorbed light by DiR will be converted to the fluorescence emission, which contributes to the lower PA signal compared with CNP. Additionally, to the difference in signal intensity between the different cell types and labels, one could expect a difference in time span where cells can be followed. This difference is determined by the dilution of the labels while cells proliferate. The labeling efficiency, the absorption coefficient, and the proliferation rate of cells influence the ultimate PA signal intensity. Dilution of the label over time can be caused by proliferation, where the initial amount of label present in one cell gets distributed over multiple cells. This could potentially lead to a loss of signal after prolonged cell culture. Although not part of this study, it would be worthwhile to investigate the interplay between these three parameters and their effect on PA imaging during long-term studies.
There appear to be inconsistencies in effects of CNP derived from India ink in relation to toxicity. Some reports have suggested that India ink is chemically and spectroscopically stable, nontoxic, nonreactive, and nonallergenic.27–29 The use of CNP derived from India Ink has already been investigated in abdominal surgery, where colonic lesions routinely are being mapped using a CNP dispersion. 30 . The long-term safety of the routine has been verified extensively and the particles have been found safe to use for colonic marking. 31 Kumashiro et al 32 furthermore showed that carbon dispersions can be injected safely into patients undergoing a radical lymphadenectomy for rectal cancer, facilitating the discernability of the nodes and resulting in less nerve damage during resections. Subdermal injection of carbon particles in the breast was also shown to improve intraoperative mapping of lymph nodes during radical mastectomies while showing no adverse reactions. 33
Comparing PA images of DiR-labeled cells in scaffolds with images obtained by fluorescence cryomicrotomy, we showed a visually excellent colocalization between PA images and fluorescence cryomicrotome images of DiR-labeled cells. This visual colocalization could not be substantiated by image overlay since PA slices represent 1-mm-thick slices of the multibore hollow fibers, whereas slices of 30 μm were imaged by fluorescence cryomicrotome.
The great advantage of PA imaging is the ability to visualize cells in a nondestructive manner. This allowed us to follow cell distribution over a period of 7 days, of encapsulated INS1E aggregates in the same hollow fiber. A special sample holder of agarose gel with a medium compartment needed to be developed. This container helped in maintaining sterility, an important condition for longitudinal imaging. Cell aggregates were imaged over time, making it possible to follow cell behavior. Without agarose macrospheres, cell aggregate clustering was seen as the aggregate size increased on the images. On the other hand we noticed that the macrospheres were able to prevent cell aggregate. These results were validated by histology, where the effect of addition of microspheres to cell distribution was clearly visible and in full agreement with the PA imaging. Importantly, a TUNEL assay showed hardly any apoptotic cells, indicating that PA tomography is harmless for cells.
The next step in cell imaging would be functional imaging by taking advantage of the PA ability to image at multiple wavelengths. Functional imaging would give more information of cell behavior and cell type-specific function. One of the major drawbacks when using relatively large scaffolds is the occurrence of hypoxia in the core of the scaffold. PA imaging could help answering these fundamental questions in a noninvasive manner, for example by using cells labeled with a hypoxia sensitive probe. More specifically for evaluation of beta cells in the PESM multibore hollow fiber, beta-cell-specific probes are needed.34,35 This could be achieved by transfection of beta cells with an appropriate NIR fluorescent reporter gene. 35 In the end, the ultimate goal would be to perform in vivo functional imaging using PA tomography. Different studies using PA imaging and even specifically PA tomography to image in vivo have been previously reported.9,11,36–39 These studies focus on different imaging targets such as cancer, photothermal therapy, vascularization, and oxygen saturation. This indicates the possibility to continue this work in vivo, thereby following encapsulated cells after transplantation. Especially in combination with functional imaging this would be highly interesting.
Overall, this study demonstrates that PA tomography can be used to follow distribution of cells encapsulated in highly scattering scaffolds of clinically relevant size without sample destruction. Furthermore, CNP is found to be a suitable NIR PA contrast agent for labeling cells. With this combination, it is possible to achieve a 100–200 micron resolution in imaging the aggregates at few mm deep and over a period of 7 days. This resolution allows the study of global cell behavior rather than following of individual. One of the main challenges of PA tomography remains, a lack of quantification due to the unknown optical fluence. Some directions to improve quantification is to use either photon propagation models40,41 or a combination with other optical techniques.42,43
Footnotes
Acknowledgments
This research was supported by the JDRF, grant key: 17-2013-303. Fluorescent Cryomicrotome images were kindly provided by J.P.H.M. van den Wijngaard Department of Biomedical Engineering and Physics, and Academic Medical Center in the Netherlands.
Disclosure Statement
No competing financial interests exist.
References
Supplementary Material
Please find the following supplemental material available below.
For Open Access articles published under a Creative Commons License, all supplemental material carries the same license as the article it is associated with.
For non-Open Access articles published, all supplemental material carries a non-exclusive license, and permission requests for re-use of supplemental material or any part of supplemental material shall be sent directly to the copyright owner as specified in the copyright notice associated with the article.