
Abstract
Excessive extracellular matrix (ECM) deposition is a cause of progressive fibrosis, which ultimately leads to progressive organ dysfunction. The lack of an in vitro fibrosis model and in vitro drug screening tools limits the development of effective antifibrotic drugs. The profibrotic cytokine transforming growth factor-β1 (TGF-β1), which is secreted by a variety of cells under continuous hypoxic condition, correlates strongly with tissue fibrosis and is largely responsible for the observed increases in ECM deposition in fibrotic diseases. In this study, we established an in vitro fibrosis model in which human adipose-derived stem cells (hASCs) secrete TGF-β1 by engineering three-dimensional cell masses (3DCMs) of hASCs on a maltose-binding protein-basic fibroblast growth factor (MBP-FGF2)-immobilized substrate. We found that the hypoxic microenvironment created in the interior of 3DCMs during the early stages of culture leads to activation and synthesis of TGF-β1. The gene expression of fibrosis-related molecules such as TGF-β1, α-smooth muscle actin (αSMA), and collagen type I was upregulated in 3DCMs. As culture time increased, overexpression of TGF-β1 led to differentiation of hASCs into activated myofibroblasts, which accumulate excessive collagen type I and are characterized by αSMA expression. Furthermore, immunofluorescence data verified the increase in collagen type I synthesis in αSMA-positive cells. Scanning electron microscopy revealed rigid and compact 3DCMs, probably due to accumulation of ECM components and cross-linking of these components. The advantage of this TGF-β1-mediated 3D in vitro fibrosis model is that it opens up new avenues to understand the common mechanism of fibrosis, which will then facilitate the development of broadly effective antifibrotic compounds and the screening of existing antifibrotic agents. To the best of our knowledge, this is the first proper biomimetic 3D in vitro fibrosis model to be developed.
Introduction
F
Because 3D microtissues can improve the differentiation and therapeutic potential of various stromal cell populations, its application in tissue engineering, cell therapy, and wound healing has been discussed.10,11 In the field of drug discovery, development, and screening, interest in 3D cell culture systems has increased because they can provide more physiologically relevant information and predictive data for in vivo tests.12,13 A mechanism for 3D cell mass formation has been explained biophysically as a balance between the strengths of cell–cell contact and cell–matrix adhesion. 13 3D cell masses form as physically forced self-assemblies using methods with poor cell matrices, such as nonadherent round-bottom well plates, 14 rotary culture methods, 15 and hanging drop methods. 16 We have used a recombinant maltose-binding protein-basic fibroblast growth factor (MBP-FGF2) surface for the formation of 3D microtissues. A substrate with immobilized FGF2 was created using MBP as the physical linker that immobilized FGF2 to a hydrophobic polystyrene (PS) surface (PS-MBP-FGF2). 17 We showed that human adipose-derived stem cells (hASCs) specifically adhered to an immobilized FGF2 surface through a heparin sulfate proteoglycan-mediated interaction, which causes a reduction in the cell–matrix adhesive force. 17 The inside of the 3D microtissues was hypoxic and hypoxia-inducible factor-1α (HIF-1α)-induced angiogenic growth factors were expressed that led to endothelial differentiation in vivo.18,19 The hypoxic microenvironment created during spheroid formation initiated differentiation of hASCs.
In the body, when an organ is hypoxic, it releases various growth factors and profibrotic cytokines, primarily transforming growth factor-β (TGF-β), which lead to fibrogenesis. The molecular mechanisms of fibrosis are poorly understood, but they are characterized by intracellular signaling pathways, multiple extracellular stimuli, and other common pathways of fibrogenesis, such as accumulation of matrix proteins, degradation, and cross-linking and stabilization of collagen proteins.3,20,21 Despite this complexity, a central regulator of tissue fibrosis is the cytokine superfamily TGF-β, which includes TGF-β1, 2, and 3; these cytokines have been shown to display similar fibrogenic effects in vitro.3,20,21 It has been well-documented that hypoxia-induced TGF-β1 or elevated TGF-β1 alone serves as a major stimulus for activation of myofibroblasts and collagen deposition, which subsequently progresses to fibrosis in various organs.20,22 Expression of α-smooth muscle actin (αSMA) is a hallmark of differentiation into myofibroblasts and has been widely accepted as a marker for fibrosis. Recent in vivo studies demonstrated that induction of hypoxia and excessive TGF-β1 synthesis lead to differentiation of lung and cardiac fibroblasts into ECM producing myofibroblasts, which are characterized by αSMA expression.22,23 Watson et al. confirmed the synergistic increase in myofibroblast differentiation and αSMA expression by exogenous TGF-β1 on hypoxic cells. 23 Fibrogenesis 5 and increased ECM production were observed for cells subjected to exogenous TGF-β1 without hypoxia. Continuous exposure of cells or tissues to TGF-β1 causes myofibroblast differentiation with or without hypoxia. TGF-β1 mediates fibrosis 24 by inducing a cellular mediator of myofibroblast formation. When activated, myofibroblasts function as the primary collagen-producing cells. 25
In this study, a PS surface with immobilized FGF2 was used to promote hypoxic 3D clustering of hASCs, which leads to formation of three-dimensional cell masses (3DCMs) that mimic in vivo fibrosis. We characterized the 3DCMs with respect to a hypoxia-collagen deposition cascade that occurs during fibrosis to determine whether they can serve as microtissues for testing antifibrosis therapies.
Materials and Methods
Culture of hASCs
hASCs (Cellbio) were expanded at 37°C and 5% CO2 in a growth medium consisting of DMEM-F12 supplemented by 10% fetal bovine serum (Welgene) and 100 U/mL penicillin and streptomycin (Invitrogen). For each passage, the cells were plated at a density of 5 × 10³ cells/cm2 and grown by 70% confluence and then, conducted subculture using 0.25% trypsin-EDTA (Invitrogen). Fifth passage (P5) cells were used for all the experiments. The morphology of adherent cells was observed using a phase-contrast microscope (Zeiss Axio Vet. A1).
Fluorescence-activated cell sorting analysis
Monolayer hASCs were treated with trypsin (0.25%) in phosphate-buffered saline (PBS) and dissociated by gentle pipetting. Dissociated cells were washed with PBS containing 0.5% bovine serum albumin (BSA; Sigma-Aldrich). Then the cells were stained with either isotope controls or antigen-specific antibodies for 90 min. The antibodies used were human CD29 (Millipore), CD90 (BD Biosciences), CD105 (Caltac Laboratories), CD166 (BD Biosciences), and myofibroblast (αSMA; Abcam). The cells were washed thrice with PBS containing 0.5% BSA, resuspended in PBS, and analyzed flow cytometry (Cytomics FC 500). Isotype control IgG was used as a negative control.
Construction of the 3DCM culture system (3DCM formation)
hASCs were split and cultured on PS-MBP-FGF2 (NTCP; 96 well) plate at a density of 1 × 10⁵ cells/cm2 and allowed to form 3DCM at 37°C. Within 24 h of culture on 96 well plates, hASCs formed into 3DCM. The formed 3DCMs were collected at the interval of 1-, 3-, and 5-day for fibrosis analysis. The media were changed every 48 h. The 3DCM formation of adherent hASCs was observed by a phase-contrast microscope. The diameters of 3DCMs were presented as mean ± SD (n = 15 per group).
3DCM size reduction and cell compactness
Hematoxylin and eosin staining
Harvested 3DCMs were fixed with 4% paraformaldehyde (PFA) at room temperature for 30 min, dehydrated with a series of graded ethanol (50%, 70%, 80%, 90%, and 100%), and embedded in paraffin wax. Sections of 4–6 μm thickness of 3DCM were prepared and stained with hematoxylin and eosin (H&E) for histological analyses. The sections were deparaffinized, hydrated with deionized water, and washed thrice with PBS (1× ). The clear sections were immersed for 10 s in hematoxylin (Harris; Sigma-Aldrich) and washed for 10–15 min in running water. Then they were subjected to counter stain with eosin for 15 s and again wash for 10–15 min. The slides were dehydrated, cleared with xylene, mounted, and viewed under light microscope.
Scanning electron microscope
3DCMs were collected at each time point by gentle pipette suction and washed with PBS. Then they were fixed with 2.5% glutaraldehyde for 1 h at 4°C and postfixed in 1% osmium tetroxide in deionized water for 2 h. The fixed 3DCMs were subsequently dehydrated with a series of graded ethanol (30%, 50%, 70%, 80%, 90%, and 100% twice). After dehydration, the 3DCMs were immersed in hexamethyldisilazane (HMDS) for 2 min and then vacuum dried overnight. To obtain scanning electron microscope (SEM) images, the 3DCMs were attached over the adhesive carbon tape and was sputter coated with gold for 60 s at 10 mA, and images were obtained at 15 kV (Inspect F50).
Immunofluorescence
Indirect immunofluorescence (IF) staining was performed using a standard procedure. In brief, harvested 3DCMs were fixed with 4% PFA for 30 min, embedded in optimized cutting temperature (OCT) compound (TISSUE-TEK® 4583; Sakura Finetek USA, Inc.), frozen, and cut into 4–6-μm-thick sections at −28°C. To avoid nonspecific binding, sections and hASC 2D cultures were first incubated for 1 h in BSA (4%) at room temperature. Then the sections were incubated with primary antibodies against Col I (Rabit; Abcam) and αSMA (Mouse; Abcam), overnight at 4°C. The samples were then washed with PBS and incubated for 1 h at room temperature with the corresponding fluorescence-conjugated secondary antibody (1% BSA, donkey anti-rabbit [Life Technologies], and goat anti-mouse Alexa 488 [Invitrogen]). DAPI (4,6-diamidino-2-phenylindole; Vector Laboratories) was used as nuclear stain and examined using a confocal microscope (Carl zeiss). The similar staining procedure was performed for the 2D (cell numbers are equal to those of 3DCMs) culture. Control was performed without primary antibodies under identical conditions.
For hypoxia analysis, at each time point, the 3DCMs were incubated with 10 mmol pimonidazole hydrochloride (Hypoxyprobe™-1 Kit; Hypoxyprobe) in 0.1 mL solution for 2 h before being harvested. 3DCMs were gently removed and fixed with 4% PFA for 30 min at 4°C, and then embedded in OCT. The cryostat sections (4–6 μm) were washed with water and PBS. The sections were then incubated with 4% BSA in PBS for 1 h to block the nonspecific binding. Pimonidazole was detected with primary mouse antibody (Hypoxyprobe) and secondary goat anti-mouse Alexa 488 (Invitrogen) antibodies. DAPI was used as nuclear stain and examined using a confocal microscope. Control was performed without primary antibodies under identical conditions. Similarly, hypoxia was analyzed for monolayer cultures; normal cell concentration (NCC, 20,000 cell/cm2) and 2D.
Analysis of TGF-β1 ELISA
To assess the TGF-β1 secretion, the culture media were collected from 3DCMs at each time point (1-, 3-, and 5-day). To activate the latent TGF-β1 to the immunoreactive form, the cell culture supernatant was incubated with 1 N HCL and neutralized with 1.2 N NaOH/0.5 M HEPES. The assay was performed according to the manufacturer's instructions using the Quantikine ELISA human TGF-β1 kit (R&D System). Optical density was measured at 450 nm using Multiskan (Thermo).
Quantitative real-time polymerase chain reaction
Total RNA was extracted from 3DCMs prepared at different time points (1-, 3-, and 5-day) using Trizol reagent from Invitrogen according to the manufacturer's instructions. The extracted RNA was dissolved in nuclease-free water, and the RNA concentration was quantified using a NanoDrop ND1000 Spectrophotometer (Thermo Fisher Scientific). Complementary DNA synthesis was performed using Maxime RT PreMix (iNtRon) following the manufacturer's instructions. All polymerase chain reactions were carried out using ABI Prism 7500 (Applied Biosystems) and the gene expression level was quantified using SYBR Premix Ex Taq (TaKaRa). Relative gene expression level was calculated by the comparative Ct method. All target primer sequences were received from Bioneer. TGF-β1 (P256170), ACTA1 (αSMA; P169093), COL1A1 (P157768), and GAPDH (P267613) are commercially available.
Masson's trichrome staining
Paraffin sections of 3DCMs cut in 4–6 μm thickness were deparaffinized, immersed for 10 min in hematoxylin (Harris; Sigma-Aldrich), washed in deionized water (10–15 min at room temperature), stained with 0.5% acid fuchsin solution (Sigma-Aldrich), and washed for 5 min in running tap water. The sections were treated with 1.25% phosphomolybdic acid (PMA; Sigma-Aldrich) for 5 min and washed for 5 min in running tap water. The sections were stained with 0.5% methyl blue (Sigma-Aldrich) for 3 min, washed in deionized water for 5 min at room temperature, dehydrated in ethanol/water series (2 min each) followed by two changes in absolute ethanol, and cleared in xylene. The sections were mounted and observed under light microscope.
Hydroxyproline assay
To perform the hydroxyproline assay, 2D cultured hASCs and hASC 3DCMs (3 × 10⁶ cells) were harvested at each time point using the RIPA buffer and hydrolyzed with 12N HCl solution for 3 h at 120°C. The assay was performed with the hydroxyproline kit (Sigma-Aldrich) according to the manufacturer's instructions. The absorbance was measured at 560 nm using Multiskan.
Immunohistochemistry
Paraffin sections of 4–6 μm thickness were cut from 3DCMs of each day. The sections were blocked with BSA (4%) for nonspecific binding and then incubated with primary antibodies against collagen II and collagen IV (Santa Cruz Biotechnology) overnight at 4°C. Then the sections were incubated with horse radish labeled anti-goat secondary antibody (Vector) for 1 h at room temperature. Positive staining was visualized by diaminobenzidine (DAB; Vector). The sections were counterstained with hematoxylin and observed under conventional optical microscope. Negative control was performed without primary antibodies under identical conditions.
Assessment of cell viability
Lactate dehydrogenase release assay
As a marker of cell death, absolute lactate dehydrogenase (LDH) release was quantitatively measured at each time point in 2D cultured hASCs and hASC 3DCMs using the LDH assay kit (Promega). The spectrum was measured at 490 nm using Multiskan.
Live and dead assay
For assessing cell survival, we performed the live and dead assay kit (Molecular Probes) according to the manufacturer's instruction. Briefly, harvested 3DCMs were treated with 1 mL of HEPES-buffered saline solution containing 1 μL of green (SYTO 10) fluorescent nucleic acid stain solution and 1 μL of red (ethidium homodimer-2) nucleic acid stain solution and incubated at CO2 incubator for 30 min. Then, the 3DCMs were washed with PBS thrice, fixed with 4% PFA for 30 min, embedded in OCT, frozen and cut into 10-μm-thick sections at −28°C. The whole 3DCM was completely sectioned, and two slides were selected from both middle and outer parts of daily samples. The sections were analyzed under a confocal microscope.
Transmission electron microscope
For transmission electron microscope (TEM) analysis, 3DCM was fixed and dehydrated similarly as for SEM sample preparation. In addition, the fixed 3DCM was infiltrated with epoxy resin, embedded, and polymerized at 60°C for 24 h. Ultrathin sections prepared with ultramicrotome (Ultra cut C; Leica Co. Ltd.) was stained with uranyl acetate and lead citrate and observed using a cryo TEM (cryoTecnai F20; FEI Co. Ltd.).
Statistical analysis
Statistical analysis of the data was analyzed by ANOVA one way test, using Prism software (GraphPad). All of the data represent the mean values and standard errors. Statistical significance was determined as *p < 0.05, **p < 0.01, and ***p < 0.001, respectively.
Results
hASC phenotyping
Adherent cells obtained from human adipose tissue were expanded in vitro and exhibited fibroblast-like morphology (Supplementary Data are available online at
3DCM formation and characterization
The formation of hASC 3DCMs on a PS-MBP-FGF2 surface is shown (Fig. 1). At 4 h after seeding on PS-MBP-FGF2, a monolayer of adherent hASCs similar to monolayer formed on tissue culture plate (TCP) was observed by phase-contrast microscopy. However, 4 h after seeding hASCs on PS-MBP-FGF2, they started rolling to form cellular aggregates and developed into complete 3DCMs within 24 h. As culture time increased, the size of the 3DCMs reduced to between 360 and 420 μm by day 5 (Fig. 2B and Supplementary Fig. 2A). The mean diameter of the 3DCMs at each time point is shown (Supplementary Fig. 2B). The hASCs cultured on TCP remained as a monolayer independent of culture time (Supplementary Fig. 2A).
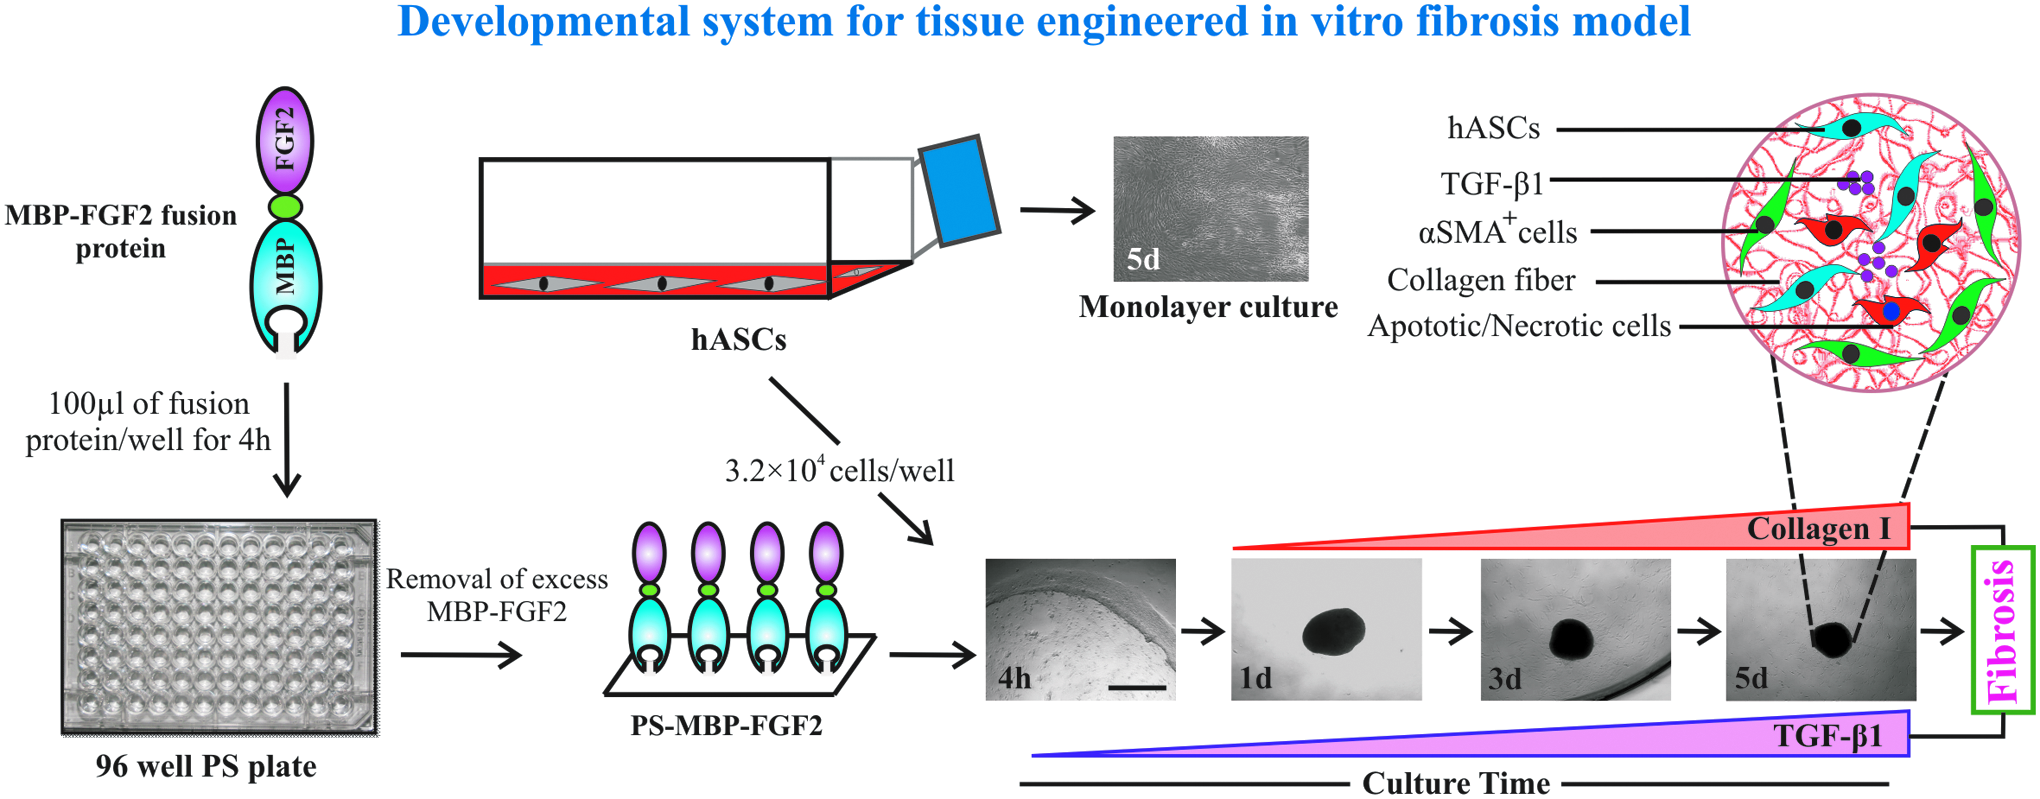
Schematic illustration of 3DCM formation for fibrosis progression. 3DCM, three-dimensional cell mass. Color images available online at
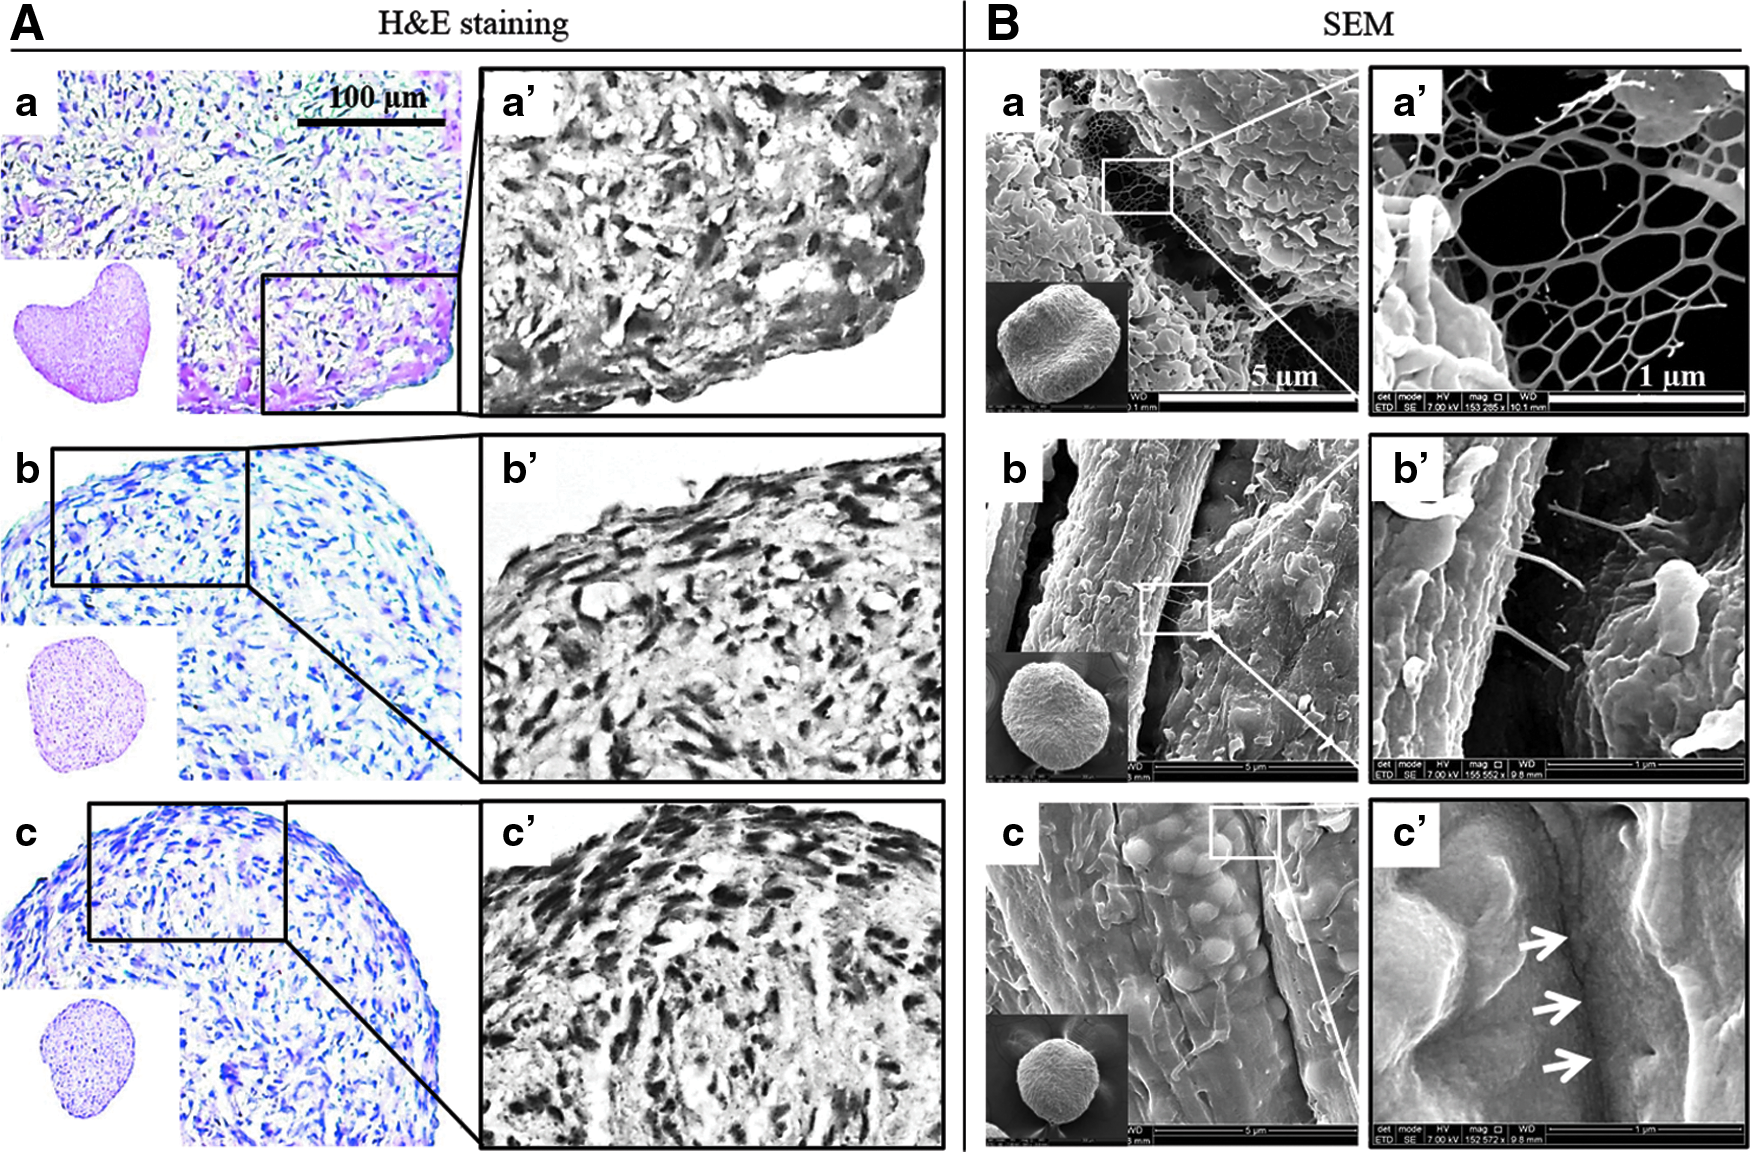
Histological and morphological characterization of 3DCMs. hASCs were cultured for 1 day
To determine their morphological characteristics, the 3DCMs were imaged by SEM. Many nanostructured ECM networks were observed between the cells after 24 h and the smallest gaps between the cells measured ∼3–5 μm (Fig. 2B-a′). As the culture time increased, the ECM networks between the cells reduced drastically, the cells became closer together, and the smallest gap between the cells was reduced to about 1 μm (Fig. 2B-b′). At day 5, the cells in the 3DCM cultures were tightly packed with no visible ECM network (Fig. 2B-c′). To confirm the size reduction and compact packing of the cells and their internal structures, 3DCMs were sectioned and stained with H&E. The results showed that the cells were uniformly distributed on day 1. As the culture time increased, the cell concentrations were higher in the outer regions than in the inner regions of the 3DCMs (Fig. 2A-a′–c′). By day 5, the cell concentrations in the outer regions increased further showing a more intact and compact structure than at day 1 and day 3 (Fig. 2A). Furthermore, bromodeoxyuridine (BrdU) IF staining showed an increased cell proliferation at the outer regions where the compact structures were observed (data not shown).
Hypoxic induction in 3DCMs
To examine induction of hypoxia in 3DCMs, we used a hypoxyprobe, which stains cells that are exposed to hypoxic conditions. Although DAPI staining of a 1-day culture showed that cells were distributed evenly, hypoxyprobe-positive cells were limited to the interior region of the 3DCMs (Fig. 3). This may be due to limited diffusion of oxygen to the interior region of the 3DCMs. In a 3-day culture, hypoxyprobe-positive cells expanded throughout the 3DCMs. In a day-5 culture, most of the hypoxyprobe-positive cells were concentrated near the outer regions of the 3DCMs. These results suggest that hypoxia was initially induced in the interior regions of the 3DCMs and then spread to the outer regions. Hypoxia induction was not observed in NCC and 2D (Supplementary Fig. 3). We speculate that hypoxia induced by the lack of oxygen diffusion to the interior extended to the outer region when cells of the 3DCMs contracted and compacted.

Hypoxia induction in 3DCMs. IF staining was carried out using Hypoxyprobe™-1 kit for hypoxia analysis; DAPI
Expression of TGF-β1 and fibrosis-related molecules in 3DCMs
We examined the profibrotic cytokine TGF-β1 secretion and fibrosis markers gene expressions by ELISA and qPCR, respectively (Fig. 4). ELISA analysis of 3DCM cultures showed a marked increase in TGF-β1 as culture time increases (Fig. 4A). Less TGF-β1 was detected in 2D cultures. Thus, the degree of hypoxia in 3DCMs is related to expression of the profibrotic cytokine TGF-β1 such that the progression of hypoxia correlates with TGF-β1 synthesis. mRNA expression of the fibrosis markers TGF-β1, αSMA, and Col I is shown in Figure 4B. Fibrosis-related molecules such as TGF-β1, αSMA, and Col I were upregulated in 3DCMs. Expression of TGF-β1 initiates fibrosis, and αSMA and Col I are fibrosis markers. TGF-β1 expression was significantly upregulated in 1-day 3DCM culture and decreased in 3- and 5-day cultures. In 3- and 5-day 3DCM cultures, the late-stage marker αSMA was upregulated. However, similar mRNA expression levels were not observed in 2D cultures (Fig. 4B). αSMA expression upregulated in 3DCM cultures was significantly inhibited by SB 431542, a potent inhibitor of TGF-β1 receptor kinase activity (Fig. 4C). These results suggest that, as culture time increases, 3DCMs mimic fibrosis and TGF-β1 stimulation is crucial for αSMA expression in 3DCM cultures.

Analysis of profibrotic cytokine TGF-β1 secretion and fibrotic markers gene expression in 3DCMs.
Total collagen deposition in 3DCMs
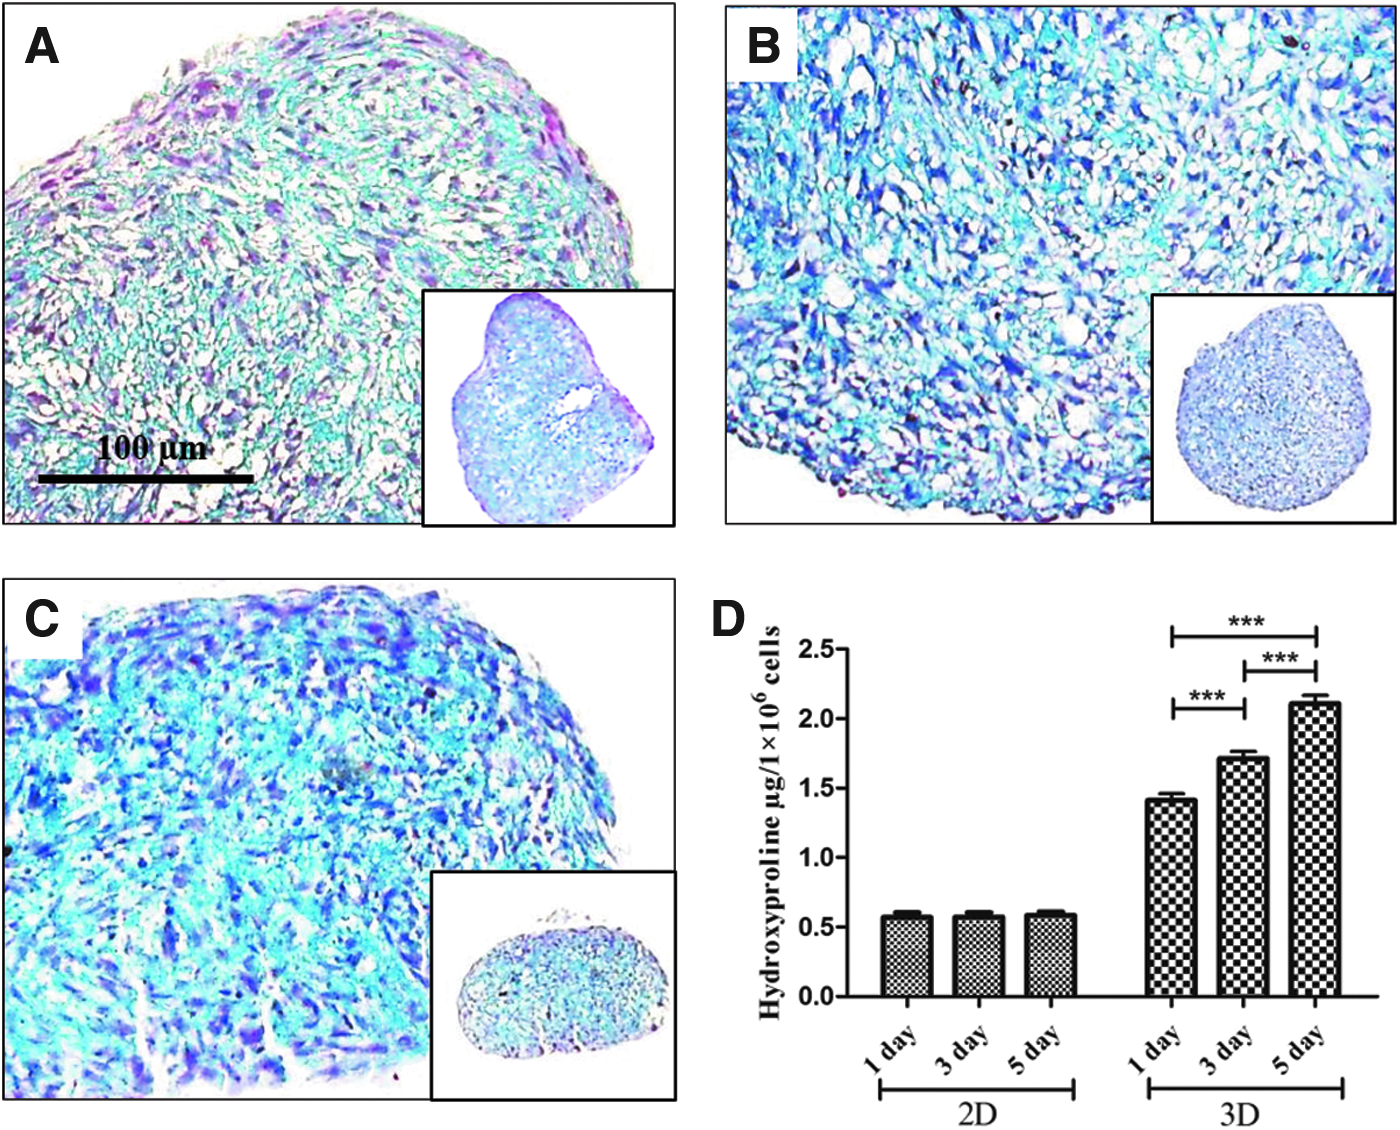
Total collagen synthesis was qualitatively and quantitatively analyzed by Masson's trichrome (MT) staining and hydroxyproline assay, respectively (Fig. 5). As culture time increased, MT staining of collagen (indicated by a blue color) increased in 3DCMs. Five-day 3DCM cultures showed more collagen bundles than 1- and 3-day 3DCM cultures (Fig. 5C). The hydroxyproline assay showed that 3DCMs synthesized much more collagen than 2D cultures and confirmed that collagen synthesis in 3DCMs increased as culture time increased, whereas collagen synthesis was constant in 2D cultures (Fig. 5D).
Analysis of total collagen synthesis in 3DCMs.
Collagen type I deposition in 3DCMs
To confirm myofibroblast differentiation and Col I synthesis, 3DCMs were sectioned and double stained by IF for αSMA and Col I. In contrast to MT staining, IF showed that little Col I was observed in 1-day 3DCM cultures (Fig. 6A). Col I synthesis (Fig. 6A-b, red color) and αSMA-positive cells (Fig. 6A-a, green color) were observed in 3- and 5-day 3DCM cultures, whereas Col I synthesis and αSMA-positive cells were not observed in 2D cultures (Supplementary Fig. 4). Myofibroblast differentiation, as characterized by αSMA, has been shown to be responsible for increased Col I synthesis in fibrosis both in vitro and in vivo. Our results also indicate that increased Col I synthesis in 3DCMs is mainly due to myofibroblast differentiation.

Collagen deposition in 3DCMs.
MT staining and IF data suggested the presence of other types of collagen in hASC 3DCMs. To confirm the presence of other types of collagen, immunohistochemical (IHC) analysis was performed with antibodies to collagen type II and IV (Fig. 6B). The IHC staining results showed the presence of collagen II. However, collagen II drastically decreased as culture time increased (Fig. 6B; a–c). IHC staining showed no evidence for the presence of collagen IV (Fig. 6B; d–f). An increase in Col I deposition was further confirmed by TEM analysis with increased culture time (Fig. 6C). Five-day 3DCM cultures contained a large number of collagen fibers. The collagen fibers were thicker in the 5-day 3DCM cultures than in the 3-day 3DCM cultures (Fig. 6C-f) probably due to the cross-linking of collagen fibers.
Cell viability in 3DCMs
Excessive Col I accumulation and deposition in 3DCMs result in increased cell death as shown by the confocal live/dead assay (Fig. 7A) and LDH assay (Fig. 7B). The qualitative live/dead confocal images showed a marked amount of cell death on day 3. Even more dead cells were seen in the 5-day 3DCM cultures (Fig. 7A), but no dead cells were observed in the 1-day 3DCM cultures. Cell damage/death was also quantitatively measured using an LDH assay in which the release of LDH is proportional to the number of damaged or dead cells. No significant increase in the LDH level was observed in the 1-day 3DCM cultures, but LDH levels drastically increased in the 3- and 5-day 3DCM cultures. There was no significant increase in the LDH level in the 2D cultures (Fig. 7B). These data suggest that continuous accumulation and deposition of Col I lead to cell death in hASC 3DCMs.
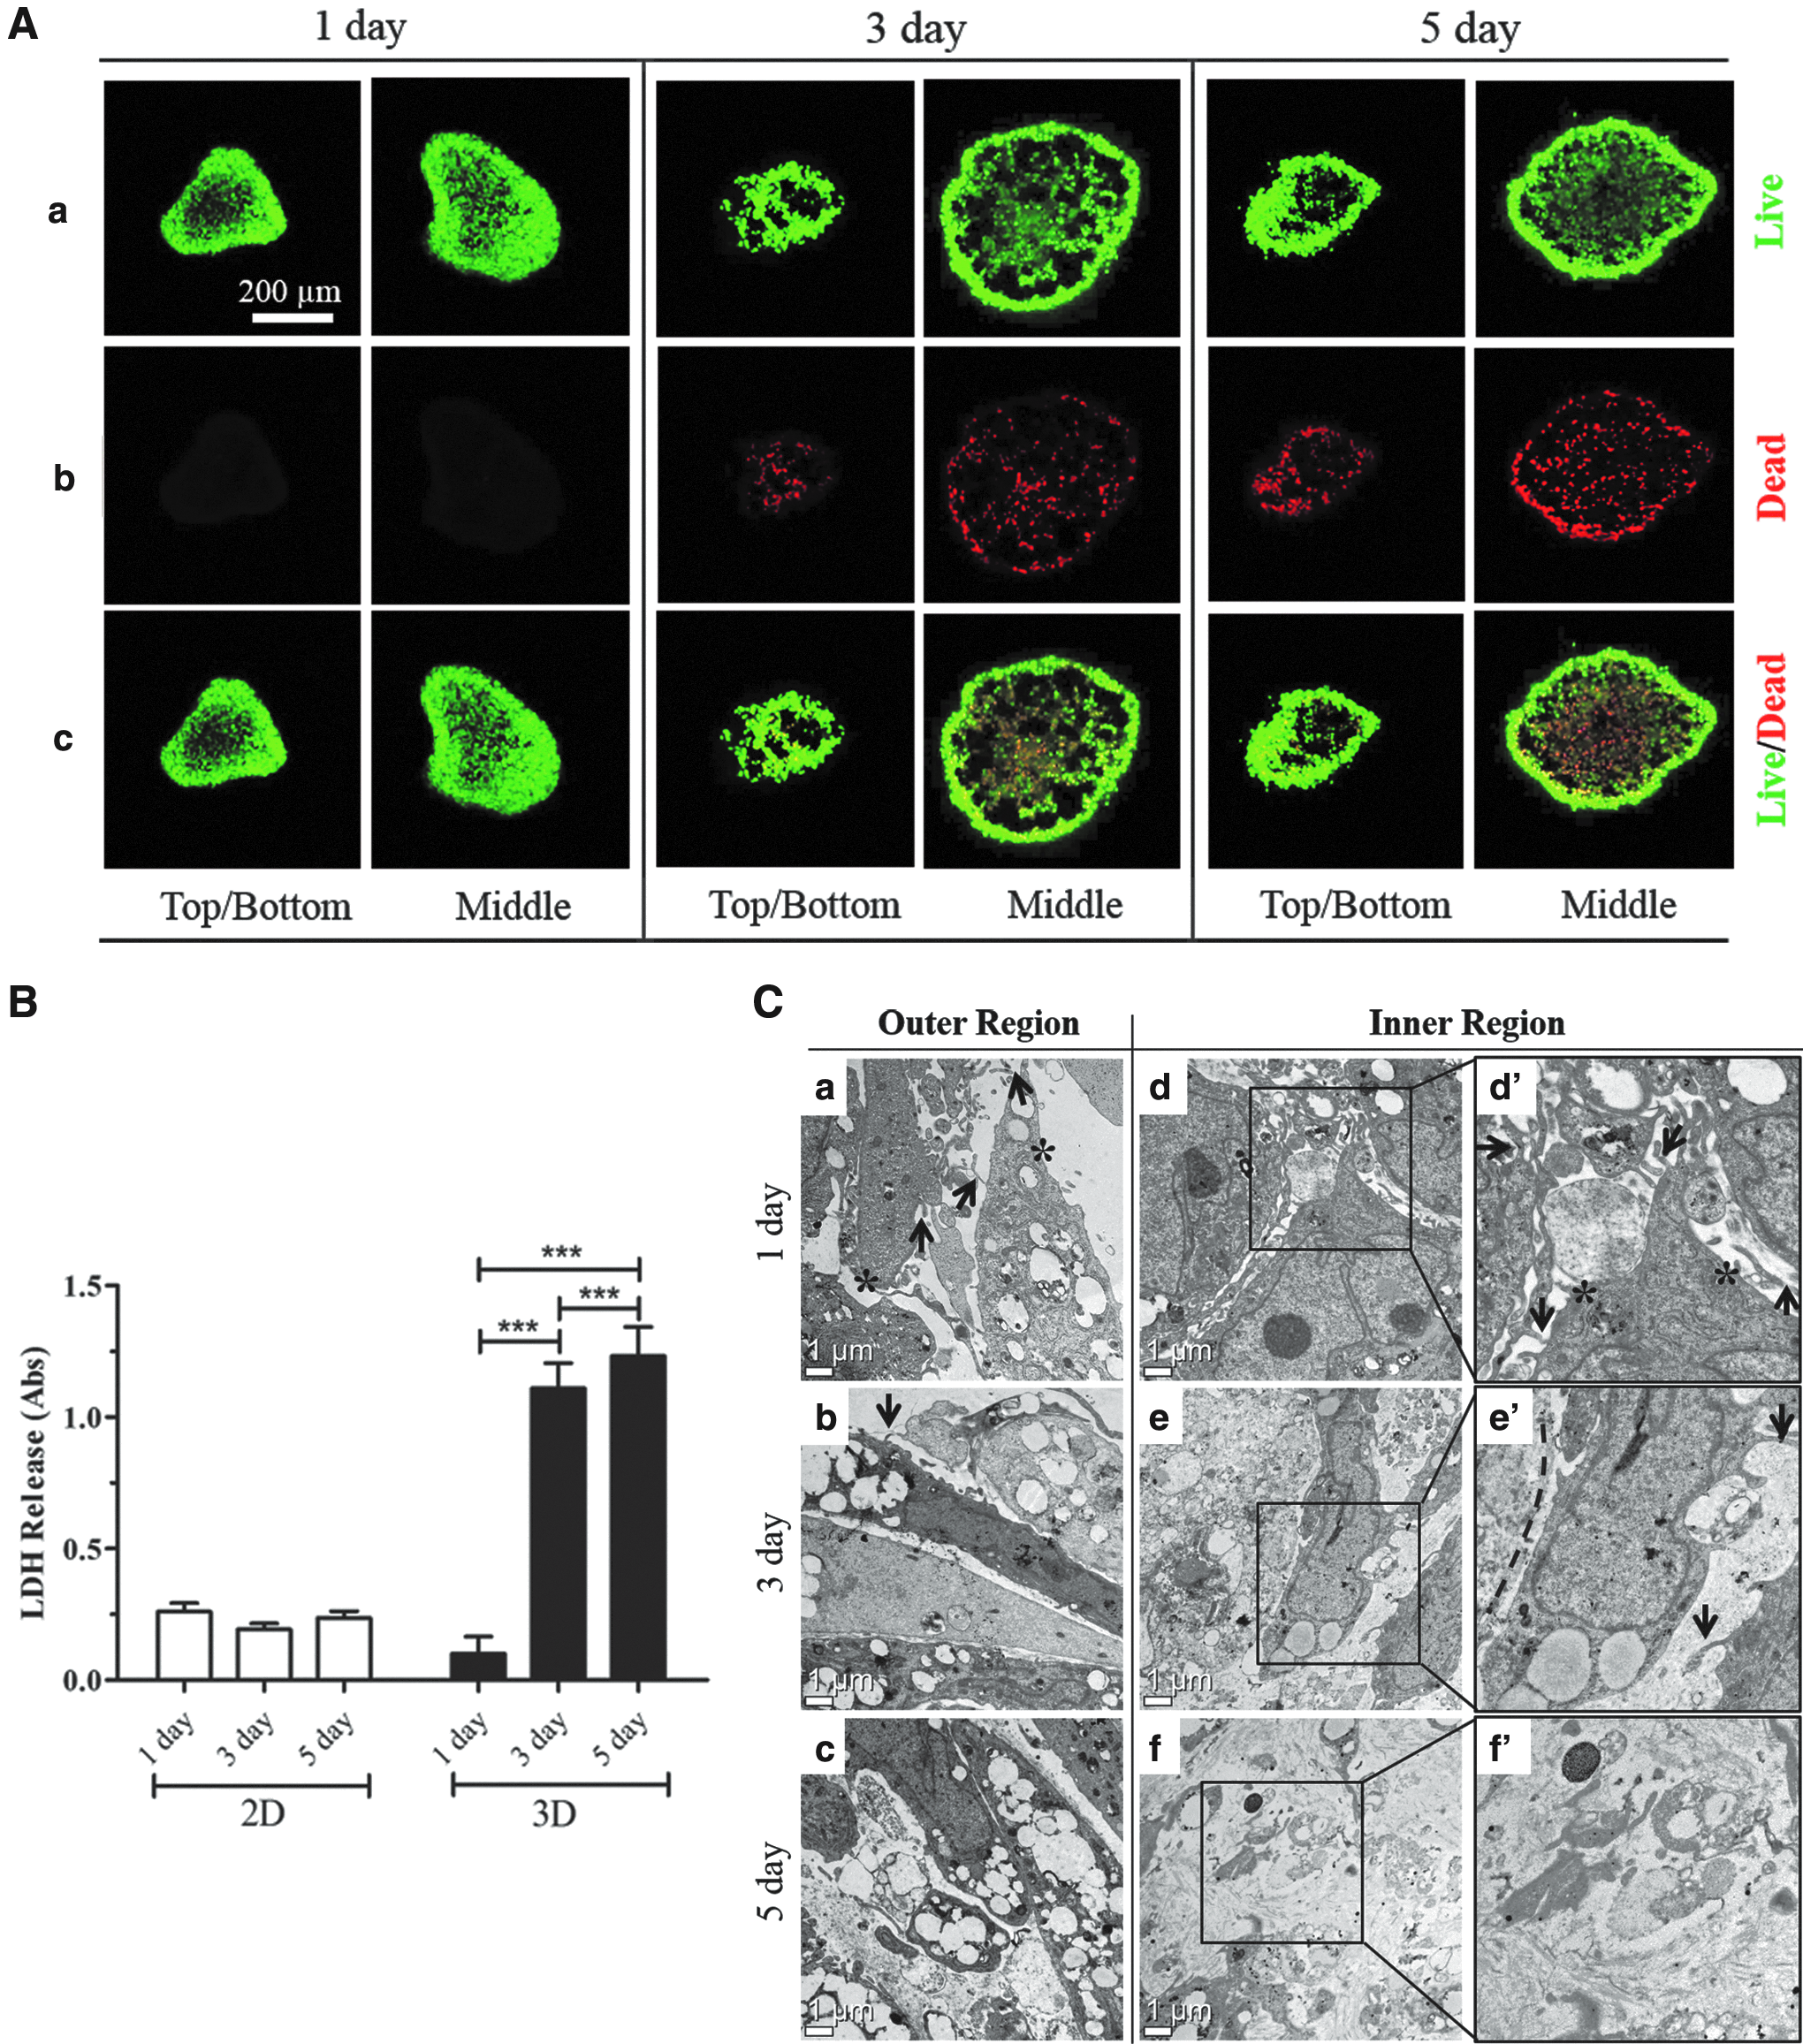
Cell viability in 3DCMs.
Comparative TEM observations of 3DCMs
TEM was used to observe ultrastructural changes in cells within 3DCMs. Cells in 1-day 3DCM cultures displayed microvilli structures with rich cytoplasm in both the outer and inner regions of the 3DCMs (Fig. 7C). The cells in the inner regions were held together with numerous microvilli structures (Fig. 7C-d) and had intact cell membranes and nuclear material along with visible mitochondria (Fig. 7C-d). In 3-day 3DCM cultures, cells showed limited microvilli structures in both the outer and inner regions of the 3DCMs, and this lack of microvilli indicates early-stage apoptosis (Fig. 7C-b and e). Dead cells in the inner region lost their intact cell membranes and microvilli structures (Fig. 7C-e) by direct apoptosis, apoptosis with subsequent necrosis, or by direct necrosis. In 5-day 3DCM cultures, microvilli structures on cells in both the outer and inner regions of the 3DCMs vanished (Fig. 7C-c and -f) and a few cells in the outer region lost their intact cell membranes, while other cells remained intact with rich cytoplasm and nuclear material (Fig. 7C-c). In contrast, numerous cells in the inner region lost their cell membranes and nuclear material (Fig. 7C-f), which are indicators of cell death by apoptosis or necrosis. Furthermore, this TEM data correlated with the live/dead confocal microscopy images.
Discussion
TGF-β1 expression correlates strongly with tissue fibrosis and is largely responsible for the observed increases in ECM deposition in fibrotic diseases by stimulation of profibrogenic genes in a wide variety of cells, including epithelial cells, mesenchymal cells, and cardiac and lung fibroblasts.22,26–28 TGF-β1 is primarily secreted by inflammatory cells, particularly macrophages,20,29 under continuous hypoxia/inflammatory condition. 30 We hypothesized that hASCs, which are multipotent stromal cells that may have the capacity for ECM synthesis, may induce TGF-β1 expression in hypoxic conditions, even though hASCs do not demonstrate TGF-β1 overexpression in normal culture conditions. In this study, we have successfully engineered a novel 3D in vitro fibrogenesis model in which hASCs secrete TGF-β1. The established 3D in vitro model induced hypoxic conditions at the interior region of cell mass (Fig. 3). With increase in culture time, the hypoxia positive region extended to outward of 3DCMs. It is speculated that the continuous exposure to hypoxic condition might increase TGF-β1 expression in those regions, since it was reported that TGF-β1 was secreted from cardiac and lung fibroblasts and macrophages in continuous hypoxic condition.20,22,30
We demonstrated that elevated TGF-β1 expression mediated the differentiation of hASCs into activated myofibroblasts, which are characterized by αSMA expression, by gene expression analysis (Fig. 4B) and IF (Fig. 6A-a, green color). TGF-β1 mRNA expression was observed in 1-day 3DCM cultures. In addition, αSMA gene expression increased as culture time increased to 3–5 days. We found that elevated levels of TGF-β1 correlated well with elevated levels of αSMA in vitro. These data indicate that TGF-β1 expression stimulates αSMA synthesis and transformation of hASCs into myofibroblasts (Fig. 4B). Until now, hypoxia-induced and TGF-β1-mediated myofibroblast transformation had not been shown in an in vitro fibrosis model. Although collagen expression occurred before differentiation of hASCs into αSMA-positive myofibroblasts (Fig. 4B), collagen protein synthesis correlated with hASCs differentiation into αSMA-positive myofibroblasts (Fig. 6A). Falanga et al. and Saed et al. reported that hypoxia and TGF-β1 are synergistic with regard to excessive ECM collagen synthesis and transcription in fibroblasts.31,32 Hypoxia has also been shown to directly induce transcription of genes that are directly involved in excessive ECM collagen synthesis in cardiac fibroblasts and in the epithelial to mesenchymal transition,23,33 which ultimately lead to fibrosis. Therefore, the time discrepancy between collagen gene expression and differentiation into αSMA-positive cells may be explained by collagen gene expression directed from hASCs by initial hypoxic stimulation.
Finally, we verified fibrosis progression by observing the accumulation and deposition of ECM collagen fibrils. In general, in vivo tissue fibrosis is accompanied with an increase in ECM collagen deposits. Song et al. reported that histological detection of increased collagen deposits in lung tissue is essential to verifying fibrosis. 28 Thus, we stained our in vitro 3DCMs with MT blue to observe fibrillar collagen deposits. Collagen deposition in 3DCMs at various culture times was compared visually. Collagen deposition was highest in 5-day 3DCM cultures (Fig. 5C) when compared to 1- and 3-day cultures (Fig. 5A, B). These qualitative data correlated with quantitative data generated by a hydroxyproline assay (Fig. 5D). However, in an in vitro model, it is difficult to make a conclusion regarding fibrosis development by measuring total collagen deposition because other types of collagen, which are not directly related to fibrosis development, may be involved in 3DCM formation. IF staining with a Col IA antibody clearly demonstrated that Col I synthesis increased as culture time increased (Fig. 6A-b) and revealed that higher levels of Col I were observed in αSMA-positive cells (Fig. 6A-a). These data directly confirm that overexpression of TGF-β1 stimulates myofibroblast differentiation and Col I protein synthesis, which increase as culture time increases, and indirectly demonstrates the presence of other types of collagen, especially at early time points. The 5-day 3DCM culture showed higher density Col I deposition and thicker Col I fibers when compared to 3-day cultures. This can be clearly seen in magnified TEM image inner region of the 5-day 3DCM (indicated by arrows, Fig 6C-f′). The thicker Col I fibers may result from cross-linking of the fibers. When Col I fibers become thick, they block oxygen diffusion and prevent transport of nutrients and metabolites, which ultimately leads to cell death. Furthermore, we have shown that the 5-day 3DCM is more rigid and compact than 1- and 3-day 3DCMs (Fig. 2B). It has been reported that accumulation and cross-linking of ECM components 34 alter tissue stiffness, which is a common feature of fibrosis. Furthermore, accumulation of ECM components alters the mechanical properties of tissues, which can then deleteriously impact organ function. 35
Excessive ECM deposition is a cause of progressive fibrosis, which ultimately leads to progressive cell death and organ dysfunction. Cell death induced by excessive ECM deposits in 3DCMs was assessed by three independent methods: an LDH assay, a live/dead assay, and TEM. The LDH assay is a rapid, sensitive, and reliable indicator of cell damage/death as it measures the release of intracellular LDH into the extracellular environment upon cell membrane damage. The quantitative LDH assay showed that 5-day 3DCM culture released more LDH than 1- and 3-day cultures (Fig. 7B), suggesting that more damage/death occurred in the 5-day 3DCM cultures than in earlier cultures. A similar result was observed by live/dead confocal microscopy (Fig. 7A). Increased cell death and LDH levels correlated with increased collagen deposition, suggesting that cell death was due to accumulation and deposition of Col I.
We further confirmed cell death by observing morphological changes in subcellular structures in 3DCMs with TEM (Fig. 7C). One-day 3DCM cultures did not show any signs of apoptosis or necrosis in both inner and outer regions. This can be clearly seen by intact cell membrane (indicated by asterisks, Fig. 7C-a and -d′) and numerous interconnected microvilli structures (indicated by arrows, Fig. 7C-a and -d′). However, after that, the rate of cell death by apoptosis/necrosis, particularly in the inner part of the 3DCMs, increased as culture time increased (Fig. 7C-e and -f). In 3-day 3DCM cultures, permeable cell membranes (indicated by dashed line, Fig. 7C-e) and limited microvilli structures (indicated by arrows, Fig. 7C-e), which are typical characteristics of necrosis and apoptosis, respectively, were observed. In the 5-day 3DCM cultures, maximum cells lost their cell walls, mitochondria, and microvilli (Fig. 7C-f). These data clearly indicate that cell death could be due to direct apoptosis/necrosis or apoptosis and subsequent necrosis. These data also showed that cell death followed increased ECM synthesis, which suggests that fibrosis leads to cell death. Furthermore, these TEM data correlate with data from the LDH assay and from live/dead confocal microscopy. Although the cell viability in 3DCM cultures decreased with an increase in culture time, it may be in vitro 3D model to screen antifibrotic drug for a short-term culture because the cell death occurred mostly in the fibrotic area of 3DCMs.
Our 3D model represents a biological consequence of hypoxia-induced and TGF-β1-mediated ECM accumulation and mimics the disruption of normal tissue architecture in fibrosis. Because of its versatility, our in vitro model can be used to identify new antifibrotic agents that target TGF-β1 and evaluate known or novel TGF-β1-induced profibrotic signaling pathways and a common fibrogenic pathway. It can also be used to screen existing antifibrotic drugs. Furthermore, this inflammation-independent in vitro model that partially mimics the in vivo model can be used to identify three possible categories of antifibrotic agents: (1) those that inhibit TGF-β1 overexpression, (2) those that prevent transformation into myofibroblasts through the TGF-β1/Smad3 pathway, and (3) those that suppress ECM expression and deposition of collagen fibrils. We expect that the first category will have the most potent antifibrotic action because it directly suppresses production of the profibrotic cytokine. Thus, inhibitors of TGF-β1 are potential therapeutic agents for the treatment of fibrosis in the heart, lung, liver, kidney, and skin. The second and third categories of therapeutic agents may also be of interest if the common mechanism of fibrosis is elucidated. However, these inhibitors will have to be tested further to establish whether they will be effective in preserving tissue structure in fibrosis.
Our results strongly indicate that this in vitro model could be used to investigate the common mechanisms that occur during the development of fibrosis. Because this in vitro model is versatile, it could be used to optimize the size of 3DCMs, improve myofibroblast differentiation, and further evaluate the relationships between hypoxia, TGF-β1 overexpression, and cell proliferation by altering cell numbers. We expect to further improve our 3D model by incorporating other cell populations, such as lung fibroblasts, renal glomerular epithelial cells, cardiomyocytes, skin fibroblasts, and immune cells, to create more biomimetic in vitro models to specifically study the development of fibrosis in each organ. Mosadegh et al. showed the significance of coculture by engineering a 3D in vitro model for cardiac fibrosis that incorporated both cardiomyocytes and fibroblasts. 36 The main advantages of our in vitro model are a low-cost culturing strategy, easy preparation, and good controllability and availability. Most importantly, we used human cells to eliminate species differences, thus the results are highly relevant to human disease. On the other hand, Naderi et al. and Stromps et al. demonstrated that ASCs were differentiated into adipogenic and chondrogenic cells in 3D culture with adipogenic differentiation and chondrogenic differentiation media, respectively.37,38 Although we focused on the fibrosis of 3DCMs in this study, we might need to investigate the adipogenic and chondrogenic differentiation of 3DCMs in the future.
In conclusion, we demonstrated the transformation of hASCs into activated myofibroblasts by growing them as 3DCMs on an MBP-FGF2-immobilized substrate. Our in vitro fibrosis model describes a novel mechanism in which induction of hypoxia and overexpression of TGF-β1 mediate differentiation into myofibroblasts. The differentiated myofibroblasts secreted and deposited excessive ECM that then caused progressive fibrosis in hASC 3DCMs. Because initiation and progression of fibrosis in our model mimic in vivo fibrosis, it could be used to study the common mechanism of fibrosis, which could then be targeted for the development of broad-range antifibrotic compounds. It could also be used to screen existing antifibrotic agents for future preclinical and pharmaceutical use. This model has the advantages of easy preparation and good controllability, and it mimics tissue structures, and is inflammation independent. We expect that our inflammation-independent and biomimetic 3D in vitro model will endow a bright future for various research disciplines and applications.
Footnotes
Acknowledgments
This study was supported, in part, by a grant of the Korea Science and Engineering Foundation (KOSEF), grant funded by the Korea government (MEST) (2006-2004339), and a grant of Korea Institute of Science and Technology (KIST) (2E26230).
Disclosure Statement
No competing financial interests exist.
References
Supplementary Material
Please find the following supplemental material available below.
For Open Access articles published under a Creative Commons License, all supplemental material carries the same license as the article it is associated with.
For non-Open Access articles published, all supplemental material carries a non-exclusive license, and permission requests for re-use of supplemental material or any part of supplemental material shall be sent directly to the copyright owner as specified in the copyright notice associated with the article.