
Abstract
Bone marrow niche is a major contributing factor in leukemia development and drug resistance in acute myeloid leukemia (AML) patients. Although mimicking leukemic bone marrow niche relies on two-dimensional (2D) culture conditions, it cannot recapitulate complex bone marrow structure that causes introduction of different three-dimensional (3D) scaffolds. Simultaneously, microfluidic platform by perfusing medium culture mimic interstitial fluid flow, along with 3D scaffold would help for mimicking bone marrow microenvironment. In this study TF-1 cells were cocultured with bone marrow mesenchymal stem cells (BM-MSCs) in 2D and 3D microfluidic devices. Phenotype maintenance during cell culture and proliferation rate was assayed and confirmed by cell cycle analysis. Morphology of cells in 2D and 3D culture conditions was demonstrated by scanning electron microscopy. After these experiments, drug screening was performed by applying azacitidine and cytarabine and cytotoxicity assay and quantitative reverse transcription–polymerase chain reaction (qRT-PCR) for B cell lymphoma 2 (BCL2) were done to compare drug resistance in 2D and 3D culture conditions. Our result shows leukemic cells in 3D microfluidic device retaining their phenotype and proliferation rate was significantly higher in 3D culture condition in comparison to 2D culture condition (p < 0.05), which was confirmed by cell cycle analysis. Cytotoxicity assay also illustrated drug resistance in 3D culture condition and qRT-PCR demonstrated higher BCL2 expression in 3D microfluidic device in contrast to 2D microfluidic device (p < 0.05). On balance, mimicking bone marrow niche would help the target therapy and specify the role of niche in development of leukemia in AML patients.
Introduction
A
Proliferation of leukemic cells relies on bone marrow microenvironment or niche that is essential for survival of these cells. 7 Hematopoietic stem cell (HSC) bone marrow niche that was firstly introduced by Schofield in 1978, is a spatial structure that composed of osteoblasts, endothelial cells, mesenchymal lineage cells, and extracellular matrix (ECM) such as collagen and fibronectin8,9 that regulate the proliferation, differentiation, and self-renewal of HSC through diverse mechanisms. 10 Leukemic cells compete for resources of bone marrow microenvironment with normal hematopoietic progenitor cells (HPCs) and create leukemic niche. 11 It has shown that proliferation and differentiation capacity of mesenchymal stem cells (MSCs) attenuate in leukemic microenvironment; in addition, normal hematopoiesis supporting in leukemic niche decreases and subsequently makes a decent bed for leukemic progression.12,13 Other studies shows that the interaction of bone marrow stromal cells with malignant cells enhances drug resistance in these cells.14,15 Although in two-dimensional (2D) culture systems, the process of leukemogenesis have elucidated,16,17 it cannot provide an opportunity to uncover the reality of leukemic microenvironment and the interaction of leukemic cells with stromal cells and ECM in vitro, so three-dimensional (3D) culture system is needed owing to this matter. 18 Even though animal models are much more acceptable than 2D culture systems, the expenditure is much higher and utilizing animal models for drug screening is extremely difficult; moreover, it cannot completely mimic human bone marrow microenvironment.19,20
Diverse scaffolds have been established to provide a 3D niche-based structure for normal and leukemic microenvironment with synthetic polymers like polyurethane (PU), poly-
Demineralized bone matrix (DBM), as a natural scaffold similar to autologous bone, 27 not only provide a magnificent structure for mimicking bone marrow niche, 28 but also secrete diverse growth factors, namely BMP-2, TGF-β1, and VEGF, 29 and through this secretion plays a different role in natural and leukemic microenvironment.30,31 Meanwhile, slow interstitial fluid flow in bone produces slow shear stress and regulates normal32,33 and malignant cells behavior. 34 So applying microfluidic devices can provide an opportunity to bring this feature along with other requirements for mimicking bone marrow niche35,36 as we planned in this study and shed light on different types of cancer and mechanisms that lie behind them.
Materials and Methods
Fabrication of microfluidic devices
Microfluidic pattern was designed by AutoCAD software and was printed on a transparency film used as photomask, and SU-8 2050 (MicroChem, Newton, MA) was utilized to create master mold by means of soft-lithography technique. 37 Briefly, PolyDimethylSiloxane (PDMS) and curing agent (Dow Corning) in 10:1 w/w ratio were mixed and was cast on SU-8 mold, degassed, and baked at 85°C for 2 h. After this step, it bounded onto a glass slide to make microfluidic device using corona surface treater (Electro-Technic Products, Inc.) for 1 min (Fig. 1). Afterward, microfluidic platform was sterilized using ultraviolet exposure for 20 min.

Pattern of microfluidic device.
Scaffold preparation
For preparing ECM, collagen type I (Advanced BioMatrix; 3 mg/mL, pH: 2) was neutralized by being mixed with 0.1 N sodium hydroxide. For 3D culture condition, DBM an allograft cancellous bone that made up of mostly collagen type I and IV (Tissue Regeneration Corporation) was purchased as a matchstick form in 5 × 5 × 35 mm and was cut into 5 × 5 × 1 mm based on the DBM chamber size. After that, DBM was coated with collagen and was incubated at 37°C for 2 h in humidified incubator, then it was loaded in DBM chamber. In 2D culture condition collagen was injected into DBM chamber in microfluidic device. After the completion of these processes, medium culture was perfused into microfluidic device for 24 h and cell seeding was performed following this step.
Cell culture
TF-1 cell line (gifted from Tarbiat Modares University) was cultivated in T-75 flasks in RPMI 1640 with 10% fetal bovine serum (FBS) and 1% penicillin/streptomycin in a humidified incubator at 37°C with an atmosphere of 5% CO2 to reach the density of 2–5 × 10⁵/mL. Simultaneously, human bone marrow aspiration was collected from consented healthy donors. The mononuclear cells were separated using Ficoll-Paque (GE Healthcare Bio-Sciences). After washing it twice with phosphate-buffered saline (PBS), cell pellets were cultured in T-75 flasks in Dulbecco's modified Eagle's medium (DMEM) low glucose media with 20% FBS and 1% penicillin/streptomycin and incubated at 37°C with 5% CO2. Adherent cells (MSCs) from third passage were used. Then, in 3D and 2D culture conditions, 105 MSCs were added into DBM scaffold and collagen-coated glass slide in microfluidic devices, respectively. After 48 h of MSCs cultivation, 105 TF-1 cells were added into microfluidic devices. The Iscove's modified Dulbecco's medium (IMDM) with 10% FBS and 1% penicillin/streptomycin were perfused into our devices with the rate of 0.1 mL/h.
Flow cytometry analysis
To TF1 cells phenotype characterization before and after 2D and 3D culture, flow cytometry analysis was performed in day 0, 3, and 7 for assessment of CD34, CD38, and CD33 surface markers expression. Briefly, the cells were centrifuged, the supernatant was removed and 500 μL of PBS was added to the cell pellet. Afterward, 10 μL of monoclonal anti-human CD34-PE, CD38-FITC, and CD33-FITC (Dako) was added to 105 cells and incubated for 30 min at 4°C. A total of 5000 cells counterstained with anti CD34 and anti CD38, also anti CD34 and anti CD33 were detected by flow cytometry (Partec CY-Flow Space) and analyzed with Flowmax software.
Carboxyfluorescein diacetate N-succinilamidyle ester cell division assay
To compare proliferation rate of cells in 2D and 3D culture conditions in microfluidic devices, TF-1 cells were labeled with cell division tracking reagent, Carboxyfluorescein diacetate N-Succinilamidyle Ester (CFSE; Invitrogen). The labeled cells were seeded into DBMs, and glass slides were coated with collagen and MSCs. Assay was performed by flow cytometry in day 0, 3, and 7, also fluorescent microscopy in day 3 and 7. For this purpose, TF-1 cells were centrifuged at 400 g for 6 min, supernatant was removed and cells were resuspended in 1 mL PBS. Then, 1 μL CFSE was added to the cell suspension and incubated at 37°C for 20 min. Afterward, culture medium that contains FBS was added to the cells and incubated at 37°C for 5 min to negate extra CFSE in solution. Following this, the cell suspension was centrifuged at 400 g for 6 min, supernatant was removed and CFSE-labeled TF-1 cells were added to devices.
Cell cycle analysis
To verify the result of proliferation test, cell cycle analysis was performed in day 0, 3, and 7 using cell cycle analysis kit (Coulter Beckman). Briefly, cells were harvested from different culture conditions, washed with Tris buffer (Merch), and centrifuged at 400 g for 6 min. The pellet was resuspended in 100 μL of Tris buffer and 100 μL of RNase solution, also 1 mL of flourochrome solution, which was composed of propidium iodide 50 mg/L in 0.1% sodium citrate, plus, 0.1% Triton X-100 were added to the cell pellets. Cells were incubated at 37°C for 15 min and were analyzed by flow cytometry.
Scanning electron microscopy
After cultivation of TF-1 cells and MSCs on DBM as 3D scaffold and glass slide as 2D culture system for 7 days, scanning electron microscopy (SEM) was performed in day 1 and 7 on both culture conditions to demonstrate the morphology of cells and structure of leukemic microenvironment. Briefly, samples were fixed with 2.5% glutaraldehyde for 5 h at room temperature. Then, they were washed using PBS and dehydrated in a series of 50%, 70%, 90%, and 100% ethanol two times for 10 min. Subsequently, the samples were chemically dried using hexamethyldisilizane (HMDS) for 15 min. Following this step, HMDS was removed and samples were evaporated in fume hood overnight. Finally, specimens were sputter coated with gold for 2 min and examined in accelerating voltage of 20 and 15 KV.
Chemotherapy drugs treatment
Cytarabine (ara-C) and azacitidine (AZA) were used to measure diverse responses between 2D and 3D culture conditions in microfluidic devices and demonstrate the effect of MSCs on drug resistance of TF-1 cells as the representation of AML. Briefly, 105 cells/mL were cultured in triplicate 24-well plates for 24 h before treatment with different doses of ara-C and AZA. To measure half maximal effective concentration (EC50) of drugs, ara-C and AZA were added every 24 h without changing the medium and EC50 was obtained using apoptosis kit (eBiosciences) by flow cytometry after 72 h of the first treatments. DBMs and glass slides, which were coated with MSCs and seeded TF-1 cells, exposed to a continuous flow of medium culture with ara-C and AZA with specified dose in separate microfluidic devices for 24, 48, and 72 h.
Cytotoxicity assay
To compare the effect of AZA and ara.C on different culture conditions, cytotoxicity assay was carried out 24, 48, and 72 h after the exposure of cells with drugs. Briefly, the cells were washed with PBS and then with binding buffer. About 105 cells were resuspended in 1 mL binding buffer and 5 μL of fluorochrome-conjugated Annexin V was added and incubated for 10 min at room temperature. After this step, cells were washed and resuspended in binding buffer and 5 μL of propidium iodide was added to the samples. The cells were analyzed by flow cytometry.
Real-time polymerase chain reaction
To analysis the effect of drugs in microfluidic devices and validate the results of flow cytometry in molecular level, quantitative polymerase chain reaction was performed to assay B cell lymphoma 2 (BCL2) expression following 24, 48, and 72 h of drugs treatment. Briefly, total RNA was extracted using TRIzol (Qiagen) and after qualification of extracted RNA by spectrophotometry, complementary DNA (cDNA) was synthesis using cDNA synthesis kit (Bioneer) according to the manufacturer's instruction. Primers were designed for BCL2 as forward: 5′-CAACATCACAGAGGAAGTAG-3′ and reverse: 5′-GGAACACTTGATTCTGGTG-3′ and mastermix from Roche-Fast Start Cyber Green Master (Roche) was used. Relative expression of BCL2 was calculated using ΔΔCT. Values were normalized with endogenous GAPDH messenger RNA (mRNA) in the same manner.
Statistical analysis
Statistical analysis of the results was performed using SPSS software by analysis of variance (ANOVA) test. Data are presented as mean ± standard deviation. p Value of <0.05 was considered significant.
Results
Phenotype analysis
For studying both normal HSCs and leukemia cells for clinical and therapeutic approaches, retention of original phenotype is necessary. So after the measurement of CD34/CD38/CD33 expression in day 0 of TF-1 cells as original phenotype (Fig. 2A), TF-1 cells in 2D and 3D culture conditions were evaluated after 3 and 7 days cultivation in microfluidic devices. The results of our study show slight decrease in C34+/CD38− cell population in 3D scaffold (nonsignificant [NS]), whereas this population was significantly diminished in 2D culture condition in day 3 in comparison to TF-1 cells original phenotype (p < 0.05). After 7 days of cultivation, CD34+/C38− cells in 3D culture condition reached original phenotype (NS), in contrast to 2D culture condition in which we faced a reduction (p < 0.05) (Fig. 2B). Meanwhile, the CD34+/CD33+ population initiated to decrease in 2D culture condition in day 3 and 7, but in 3D culture condition after a gentle reduction in day 3 (p < 0.05), it started to increase in day 7 (NS) (Fig. 2C).
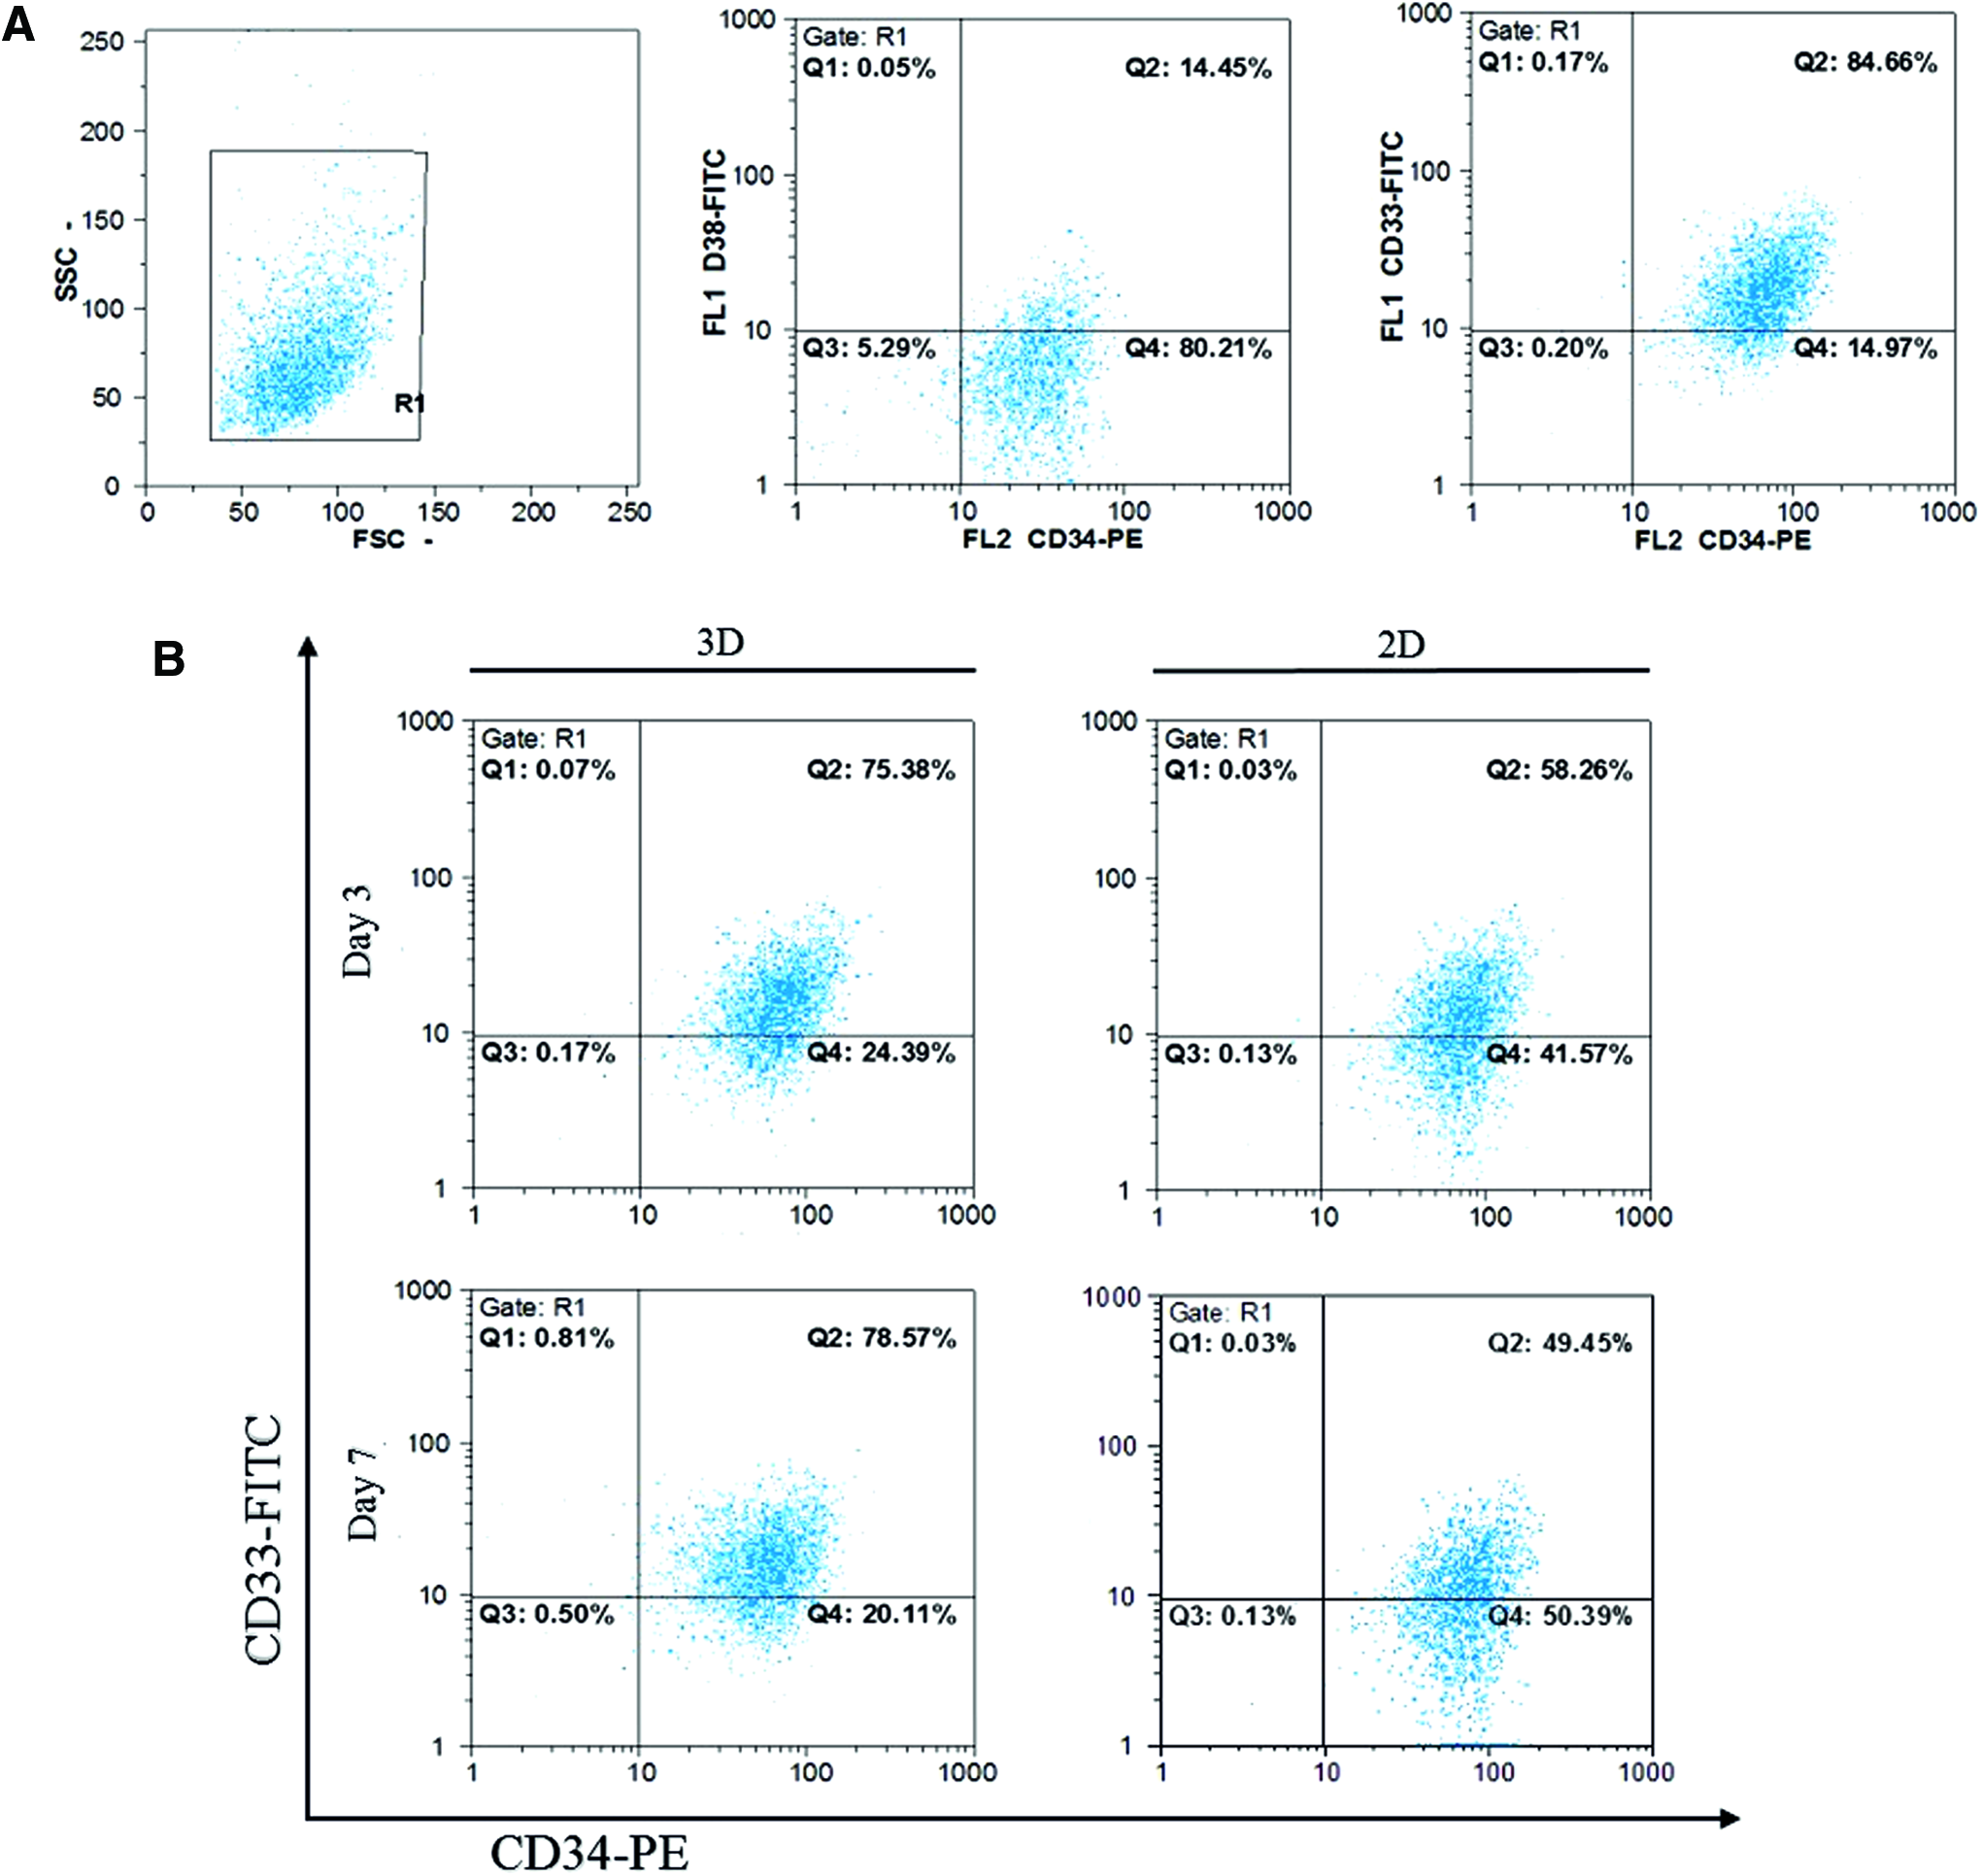
Phenotype maintenance of TF1 cells in 3D and 2D microfluidic devices.
Cell proliferation assay
To analyze the impact of different culture systems on cell proliferation rate, CFSE assay was performed by flow cytometry and fluorescent microscopy. CFSE is a fluorescent dye that is divided equally between daughter cells during cell division, so the proliferation rate is associated with the reduction of fluorescent intensity. Flow cytometry analysis of CFSE was done on CD34+ gated cells. The results show that proliferation rate is remarkably higher in 3D microfluidic devices in comparison to 2D microfluidic devices in day 3 and 7 (Fig. 3B), the evaluation of CFSE by fluorescent microscopy also confirmed this result and fluorescent intensity became weaker during 3 and 7 days after cultivation in our microfluidic devices, but this fluorescent reduction was much higher in 3D microfluidic platform (Fig. 3C).
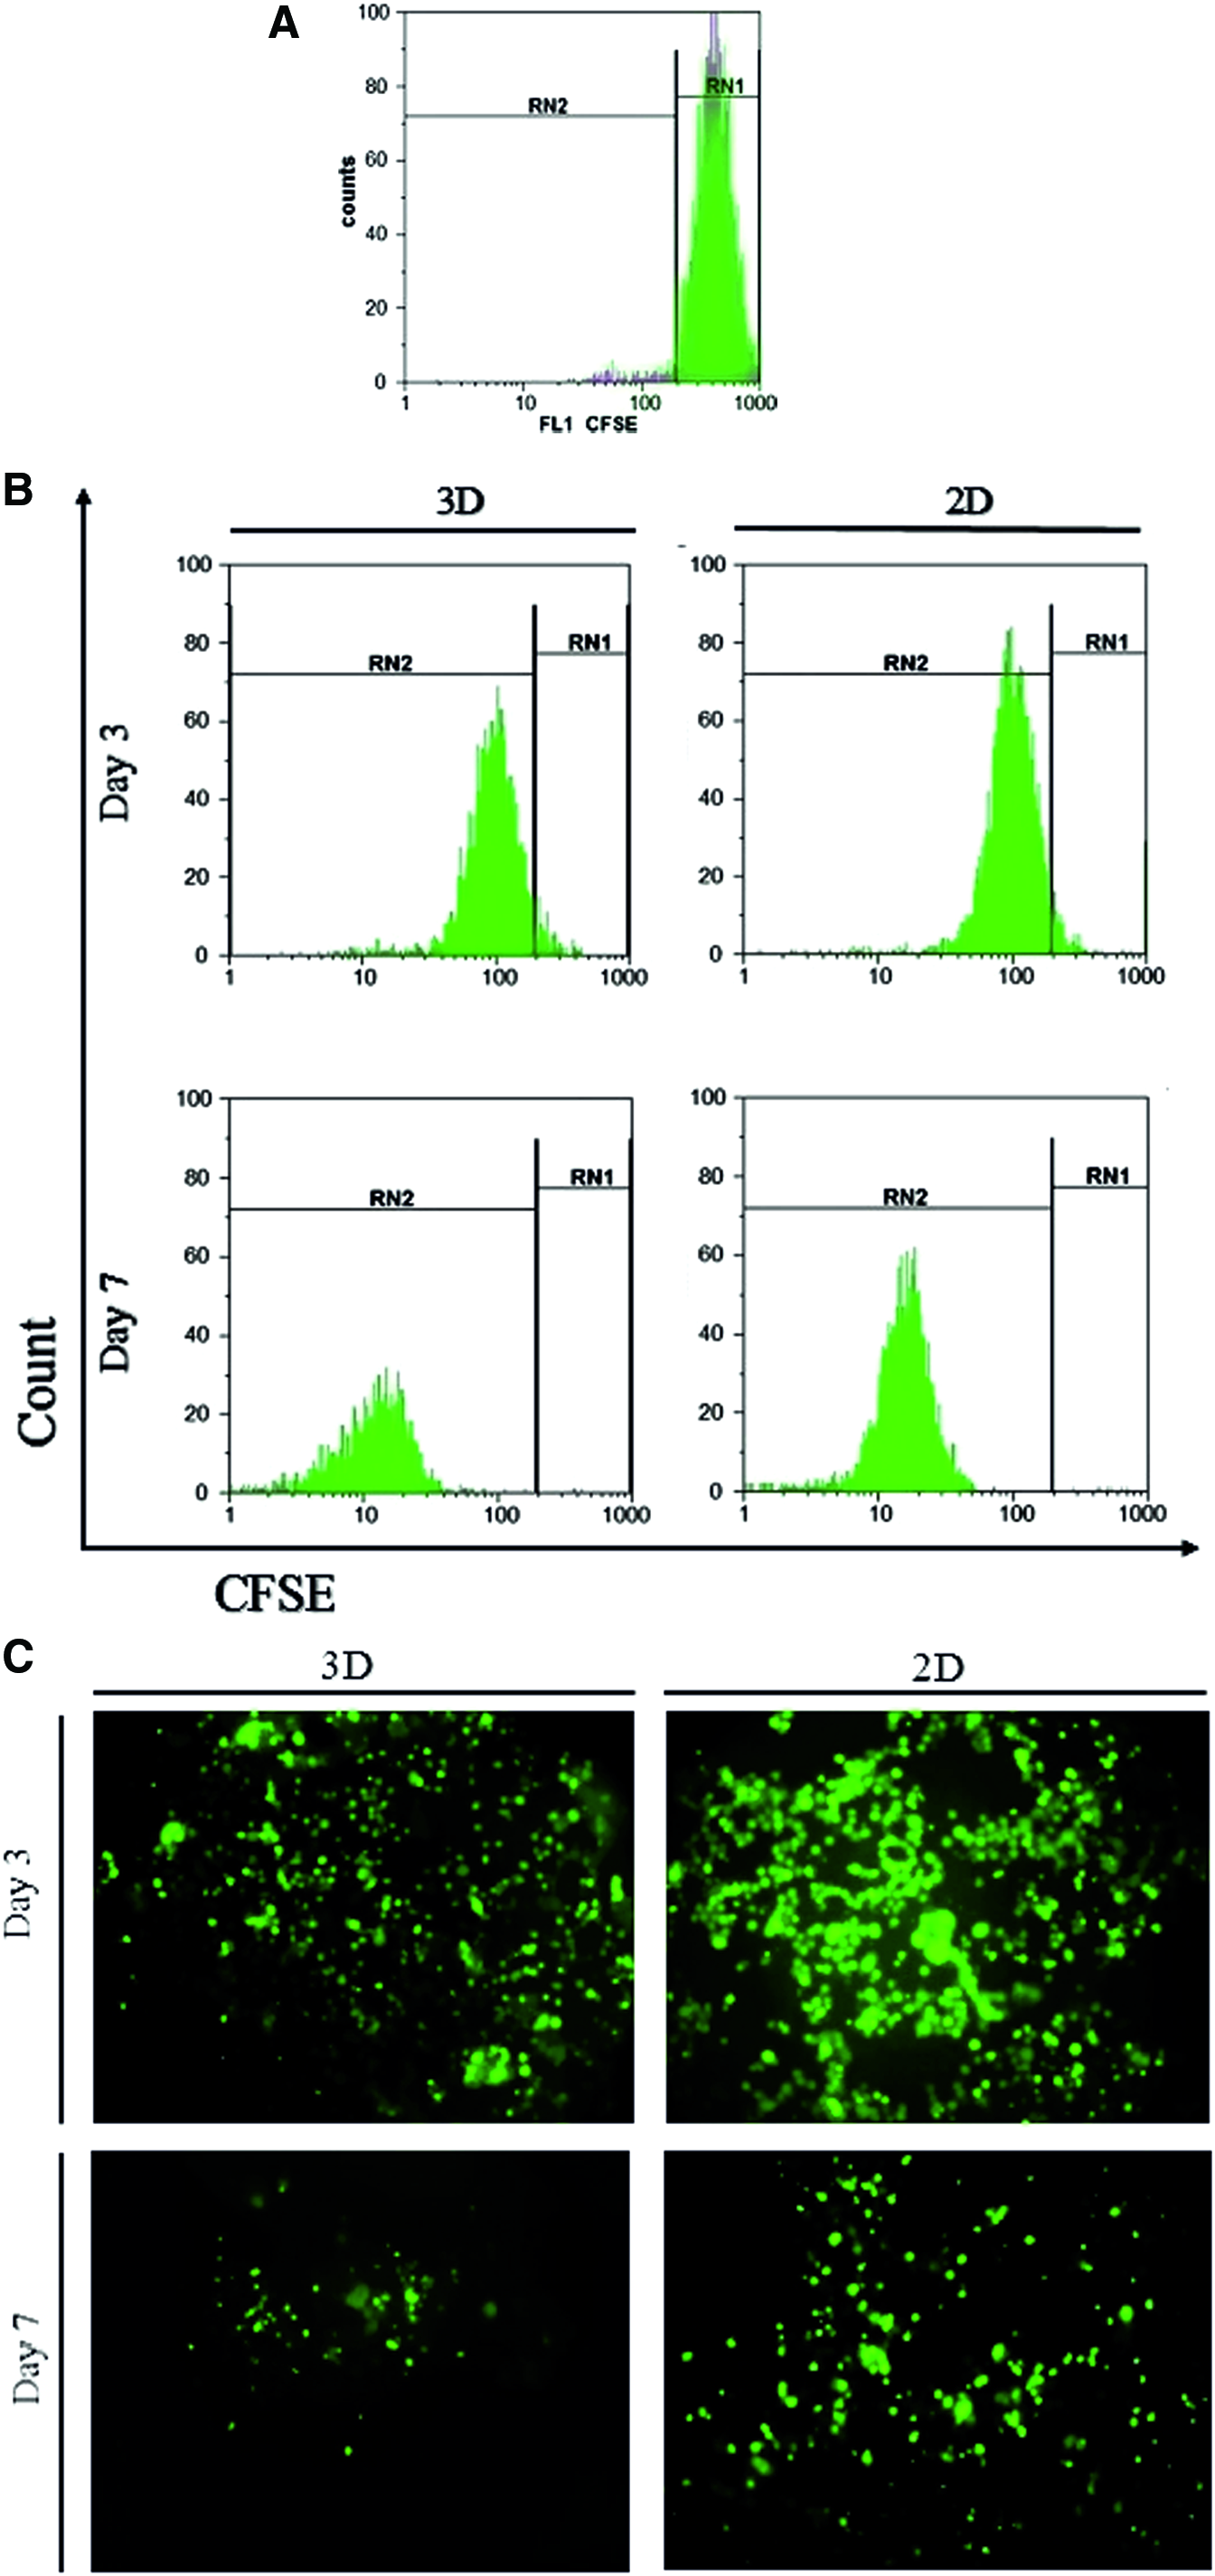
Proliferation assay of TF1 cells in 3D and 2D microfluidic devices by CFSE method. Flow cytometry analysis of TF-1 cells on day 0
Cell cycle analysis
As it was shown by CFSE test, TF1 cells were in proliferate condition. Our results show that cells in S+G2/M phase made up the vast proportion of CD34+ cell cycle analysis. In day 3 and 7 of coculture of TF-1 cells with MSCs, we faced an increase in S+G2/M population in 2D and 3D microfluidic devices, but this population was magnificently higher in 3D-based culture condition compared to 2D culture condition (p < 0.05) (Fig. 4).
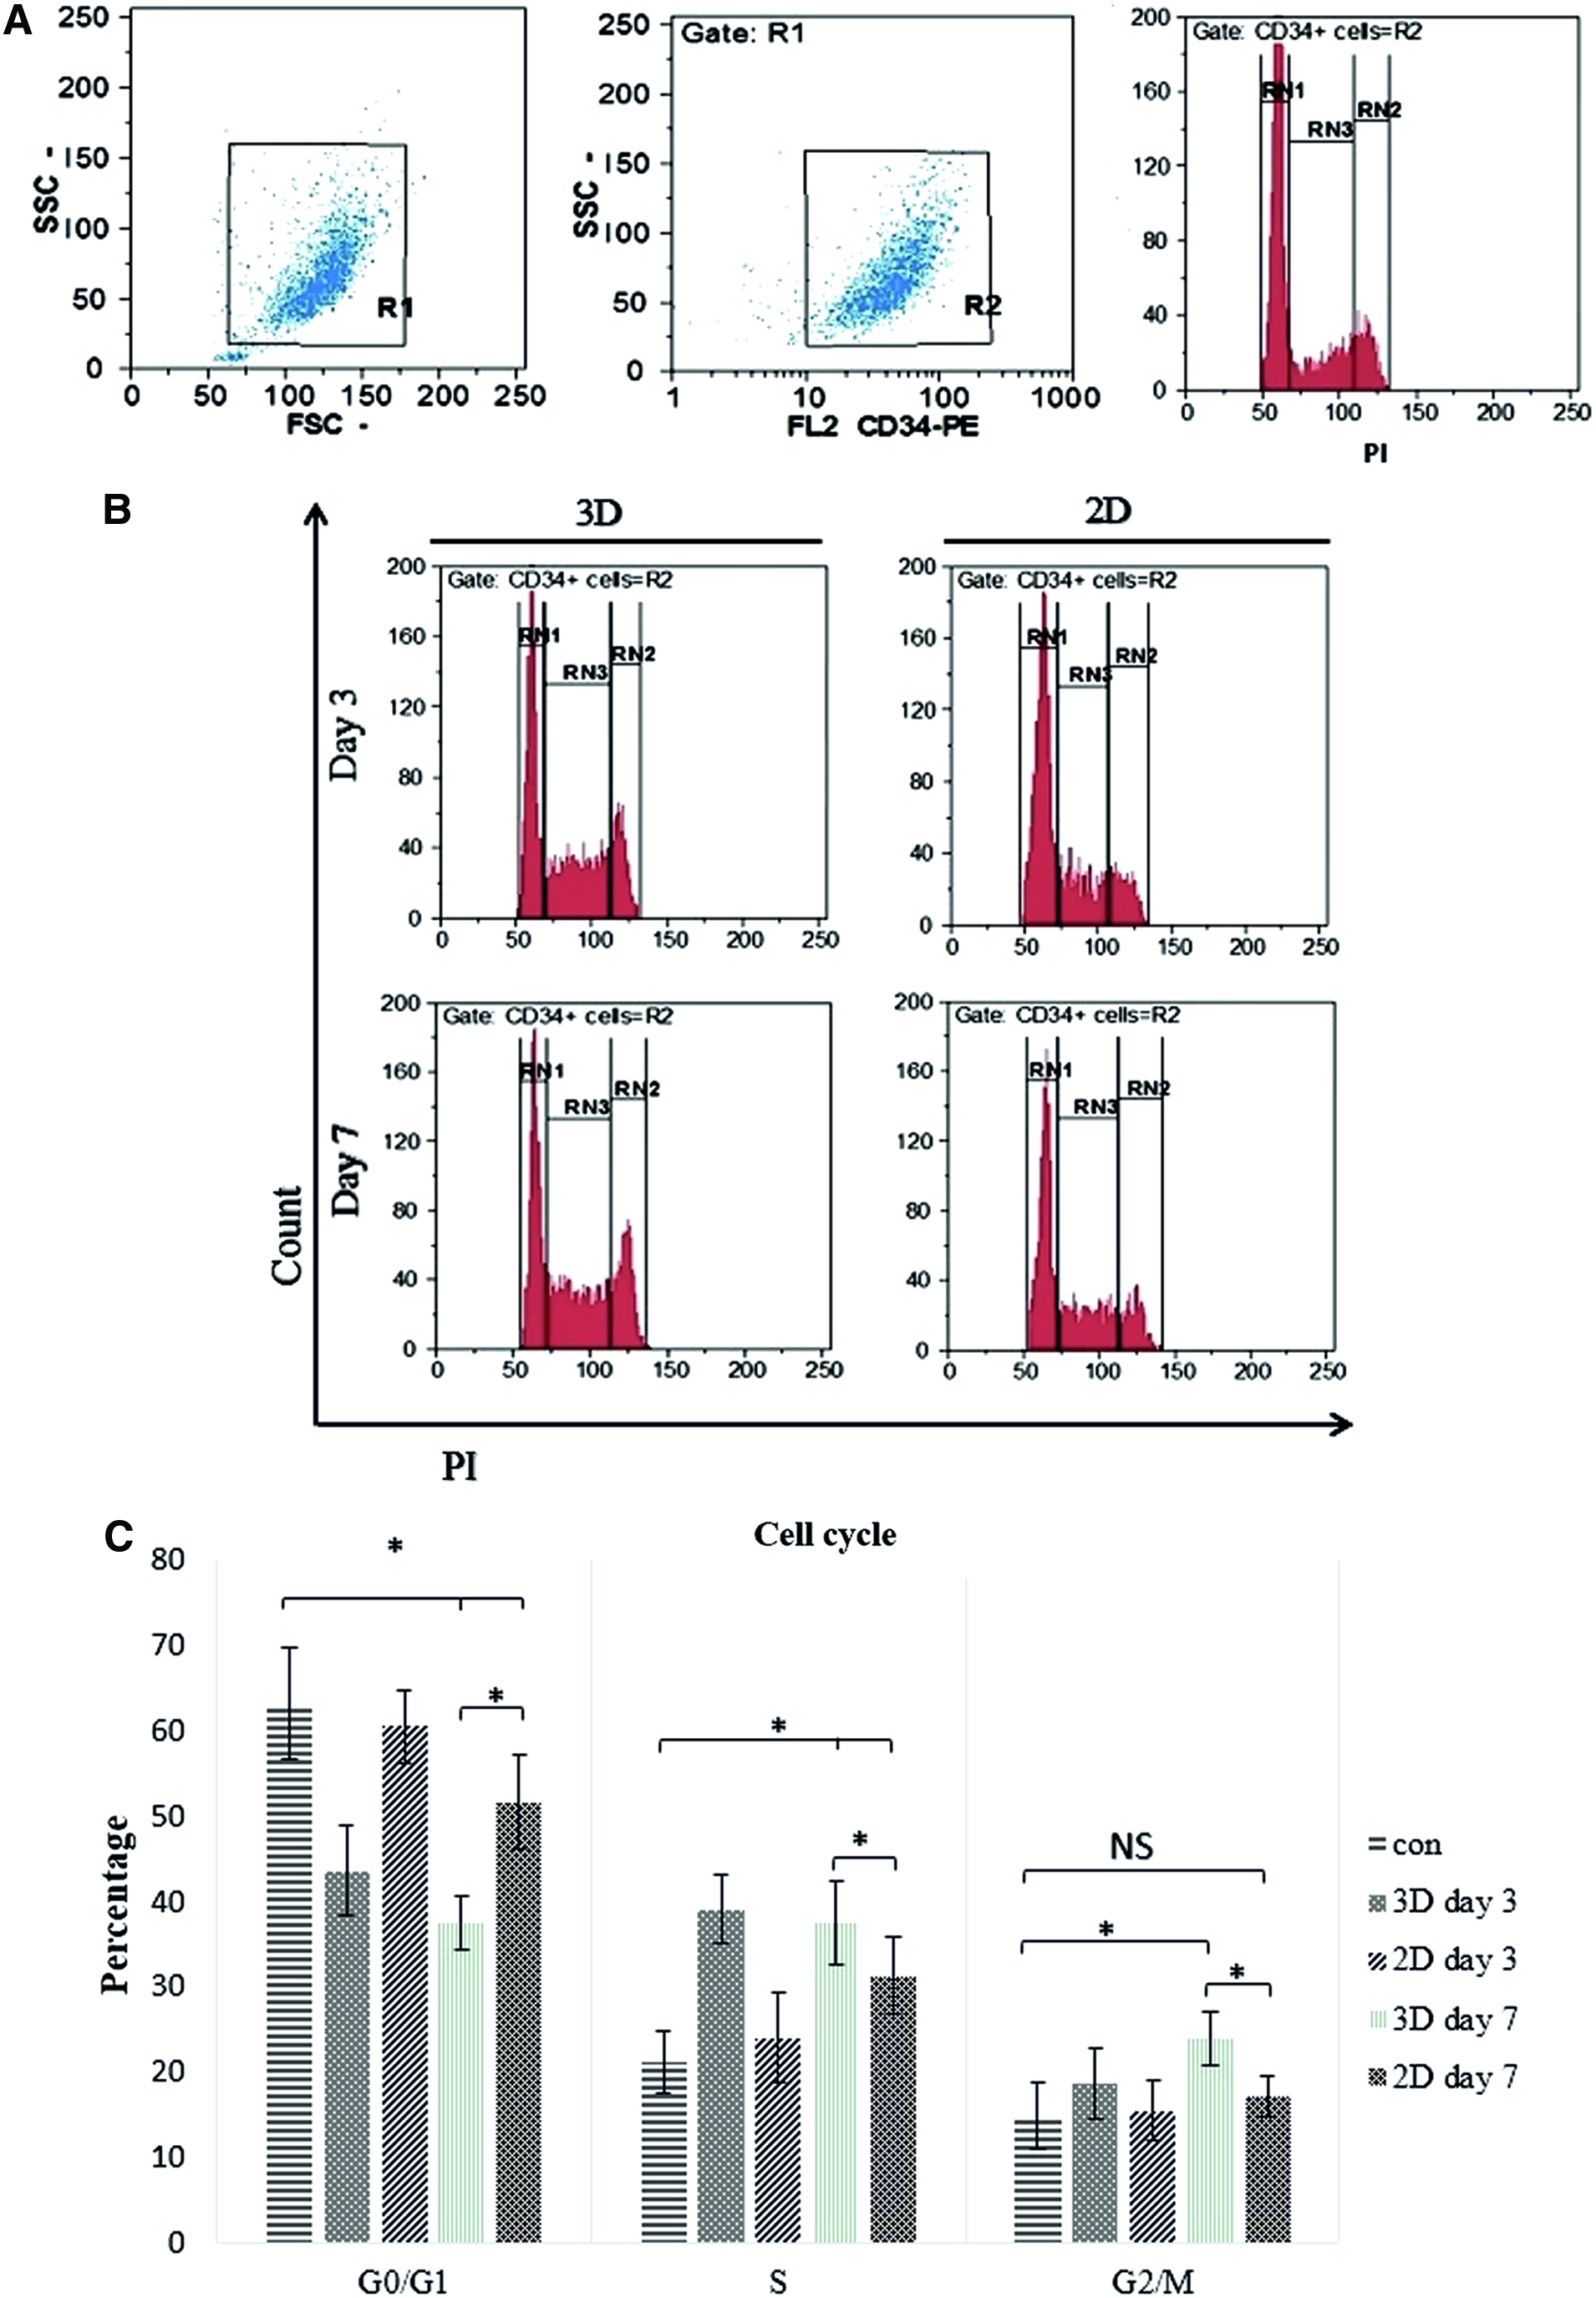
Cell cycle analysis of TF1 cells in 3D and 2D microfluidic devices. RN1, RN2, RN3 represent G0/G1, G2/M and S phase, respectively.
Evaluation of leukemic niche
To characterize the effect of 2D and 3D microfluidic devices on niche formation, SEM was performed in day 1 and 7 of cultivation. Untreated DBM, 3D scaffold, and 2D microfluidic devices that were coated with collagen type 1 are shown in Figure 5A–C, respectively. After 1 day of MSCs cultivation in 2D and 3D devices, cells had a spindle-shaped morphology (Fig. 5D) that is similar to natural bone marrow MSCs in their microenvironment, but in 2D microfluidic devices cells spread extensively and have different morphology in contrast to 3D culture condition (Fig. 5E). After adding TF-1 cells into the devices, they tended to migrate thorough pores of scaffold and interact with MSCs (Fig. 5F) to make a comfortable niche for their progression, but in 2D culture condition, although they had an interaction with MSCs, they spread randomly in the device (Fig. 5G). In day 7, the same pattern occurred for MSCs cultivated in 3D microfluidic device (Fig. 5H) and MSCs cultivated in 2D microfluidic device (Fig. 5I). After 7 days of cultivation in 3D microfluidic device, we faced with colony formation of TF-1 cells within pores of scaffold (Fig. 5J, K), which demonstrated a decent microenvironment formation for proliferation and invasion of leukemic cells. However, microfluidic devices did not change compared to day 1 (Fig. 5L).

Electron microscopy of 3D and 2D microfluidic devices.
Drug resistance in leukemic microenvironment
After measuring EC50 in TF-1 cells by flow cytometry (data not shown), 50% of cells remained alive during drugs treatment, to compare the effect of MSCs and 3D scaffold in drug resistance of leukemic cells, apoptosis assay was performed. The results show after using 0.1 μM of ara-C in 2D and 3D microfluidic devices, not only MSCs escalate leukemic cells survival during 24, 48, and 72 h of drug treatment in both 2D and 3D devices (p < 0.05), but also 3D microfluidic device was less sensitive to drug treatment, which showed the role of leukemic 3D microenvironment in protection of cells from cytotoxicity (Fig. 6A). The same pattern occurred when 2 μM of AZA was used and cells had more resistance in contrast with TF-1 cells in suspension and 3D microfluidic device. The data demonstrated more viable cells compared to 2D culture condition (Fig. 6B). The results were summarized in Figure 6C and D.
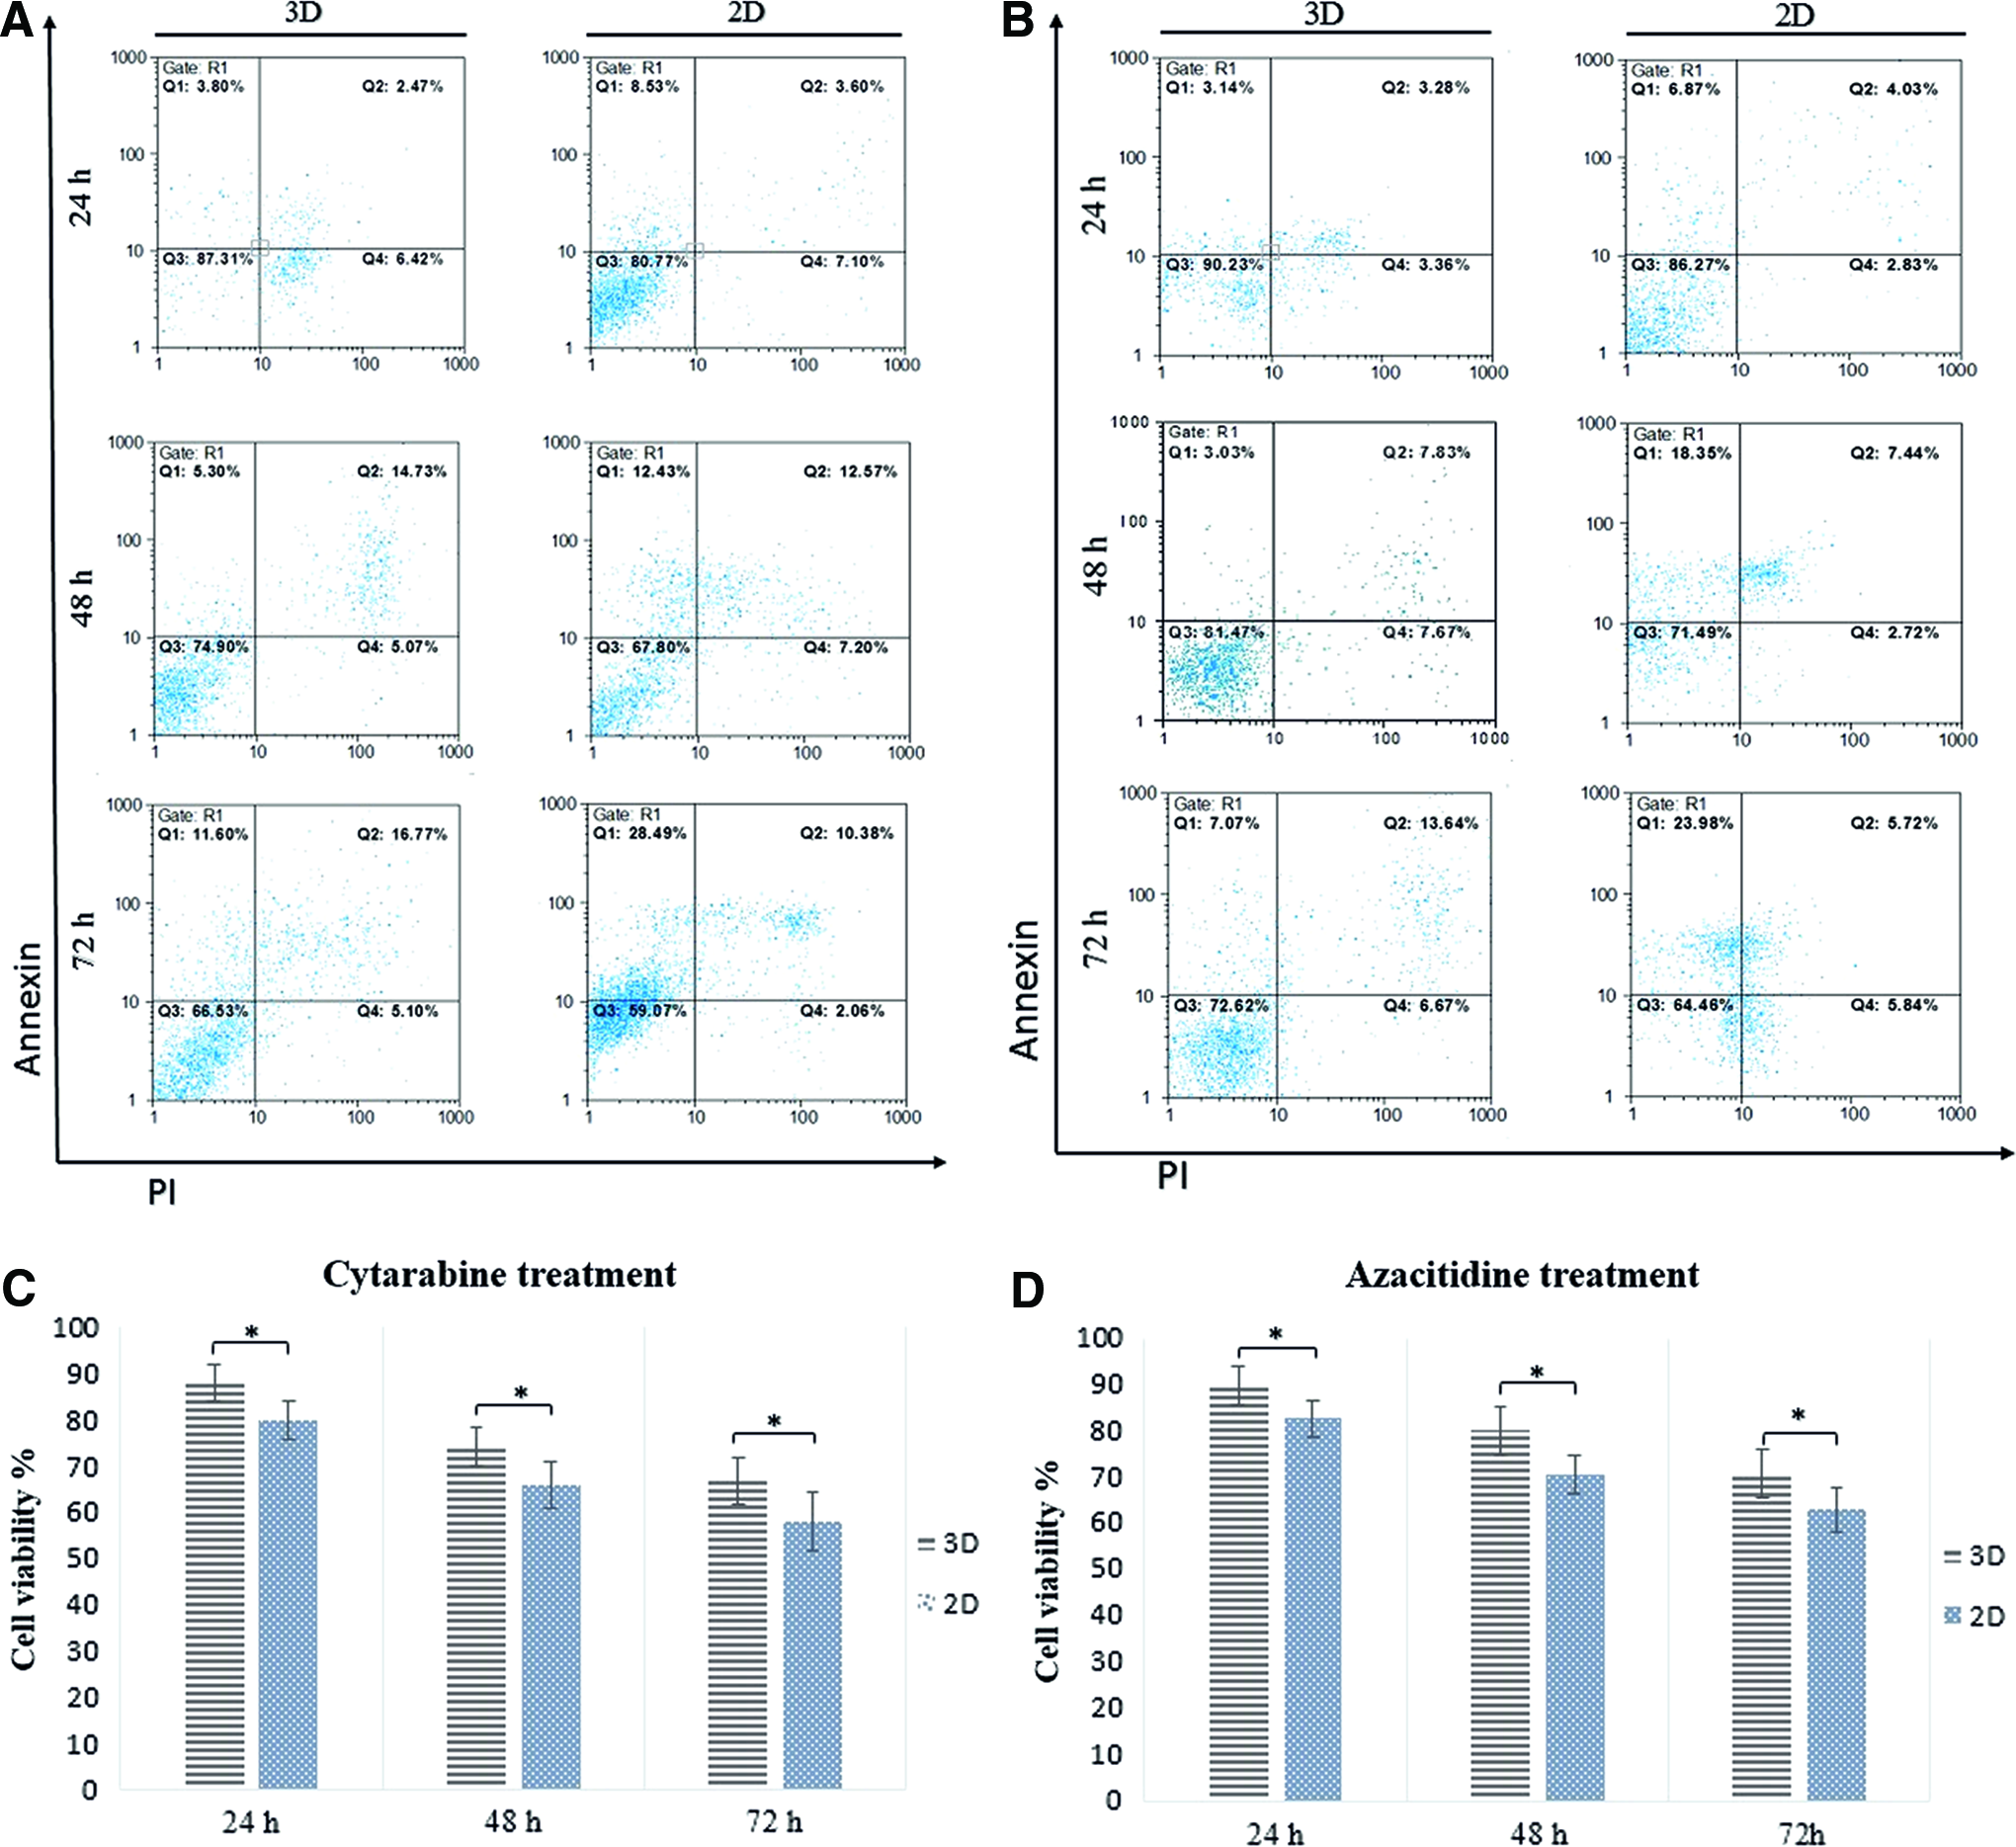
The effect of AZA and ara-C as chemotherapeutic drugs on viability of TF1 cells in 2D and 3D microfluidic devices.
BCL2 expression
Different drug's efficacy in 2D and 3D microfluidic devices was evaluated with BCL2 expression assay. The results verified flow cytometry analysis, which cells in 3D culture condition express meaningfully higher level of BCL2 in contrast with 2D culture condition after 24, 48, and 72 h of drugs treatment (p < 0.05) (Fig. 7). The upregulation of BCL2 in 3D microfluidic devices showed the role of 3D microenvironment and MSCs in drug resistance and enhancement of leukemic cells viability. Meanwhile, level of BCL2 mRNA had an increase in coculture microfluidic devices compared to TF-1 cells in suspension (p < 0.05).
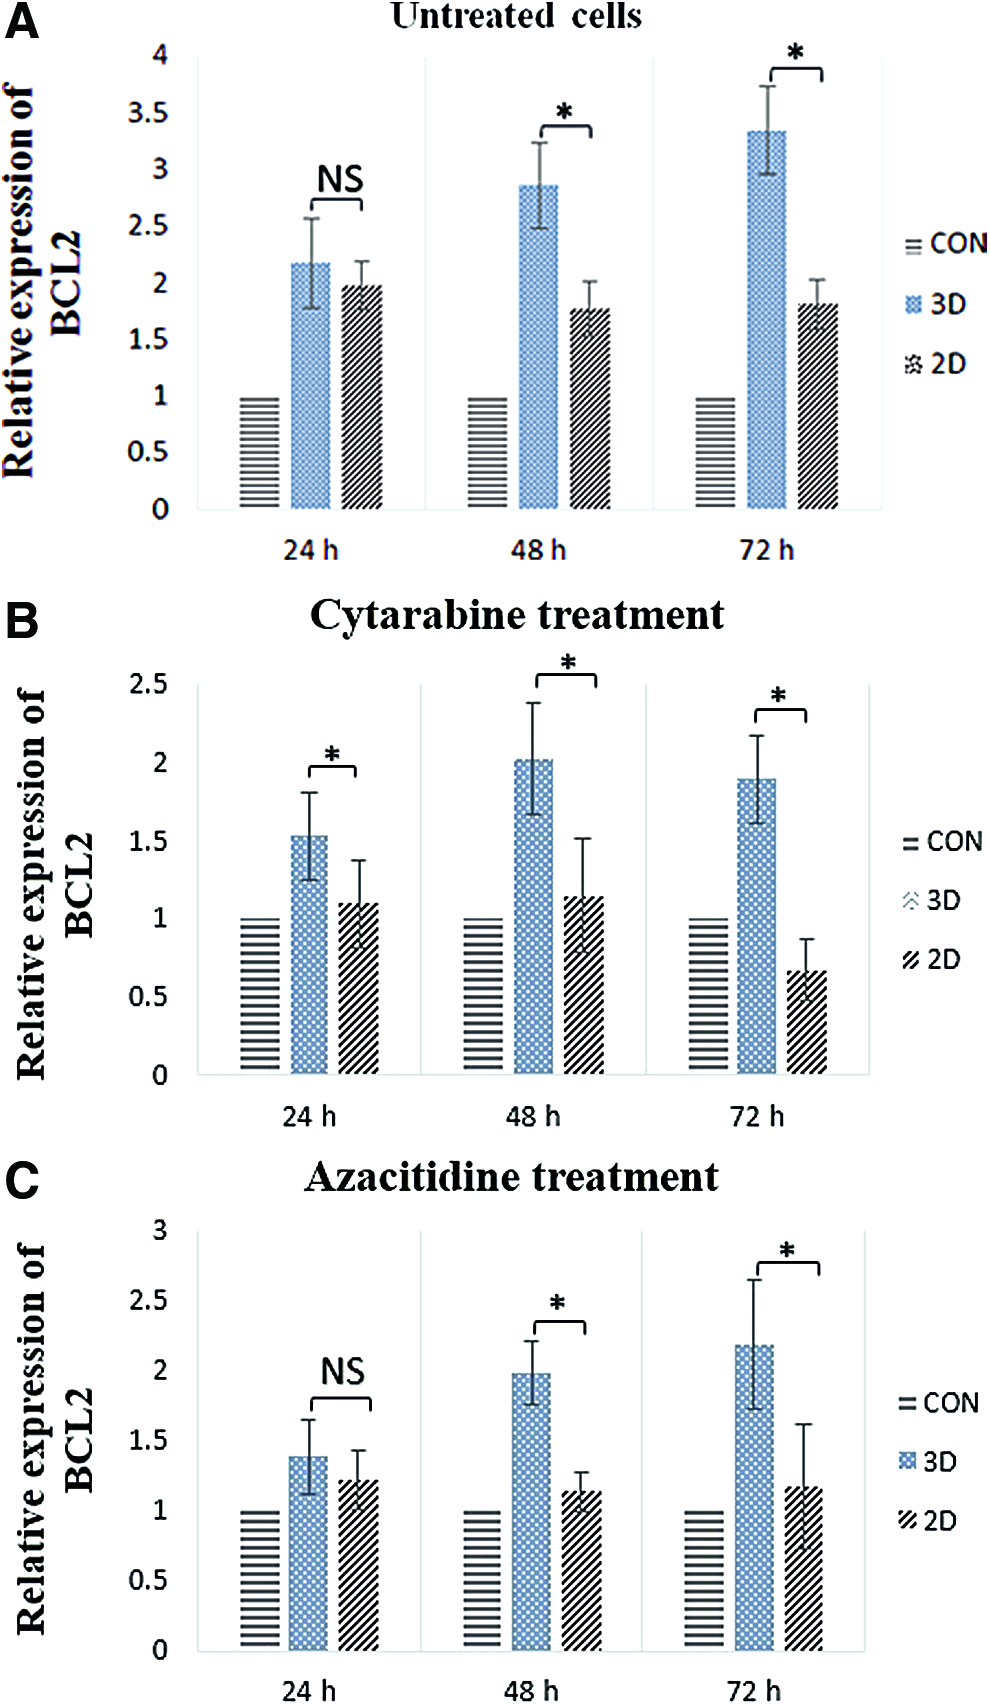
Relative expression of BCL2 in TF1 cells before and after treatment with ara-C and AZA.
Discussion
Bone marrow microenvironment plays an important role in normal hematopoiesis and regulates cells fate. 38 In hematologic malignancies like leukemia, resources of bone marrow microenvironment are harvested by leukemic cells, which result in leukemic development.39,40 The study of bone marrow niche in vitro was initiated by introducing Dexter culture system, 41 but this traditional culture condition cannot recapitulate the bone marrow niche complex properties 42 which even physical structure has effects on cells fate and cells behavior.43,44 MSCs, as a major part of bone marrow microenvironment, play various roles in leukemic conditions.45,46 It has been reported that MSCs in acute lymphoblastic leukemia patients, exhibit TEL-AML1, E2A-PBX translocations, and MLL rearrangement. 47 Along with, these cells in AML and myelodysplastic syndrome patients had some genomic alterations,48,49 and all of these changes may lead to abnormal hematopoiesis due to their role in supporting HSCs.12,50,51
Here, we illustrate a 3D microfluidic platform with seeding MSCs as indispensable part of niche and TF-1 as a leukemic cell line for mimicking leukemic niche for molecular study and drug screening and based on our knowledge this is the first microfluidic platform for mimicking AML niche and the first study that used an allograft bone scaffold for mimicking bone marrow niche.
Due to the importance of phenotype maintenance in leukemic cells, and HSCs in cell culture for the studies and applications21,52 and although it has shown that MSCs play a key role in phenotype maintenance in natural bone marrow 53 the studies showed that in some 2D culture conditions with stromal or cytokine support, the phenotype of cells has been changed during cell culture. 54 Along with these findings, our results indicate the inability of 2D culture condition in maintenance of leukemic phenotype, which the CD34+/CD38− and CD34+/CD33+ cell population has changed. Studies also show that the interaction of leukemic cells with bone marrow microenvironment helps to maintain their morphology, phenotype,55,56 and 3D culture condition by mimicking this structure is a promising tool for retaining these features.23,24 Along with these findings, our results in 3D microfluidic device confirmed the effect of microenvironment on phenotype maintenance of leukemic cells during cell culture.
Coculture condition has some benefits for bone marrow transplantation such as enhancement of migratory potential and retention of HSCs stemness, 57 meanwhile, proliferation rate is significantly higher in 3D-based culture condition due to its resemblance to natural environment.58,59 However, when different cancers are considered, the role of these cells is controversial. Although they migrate and reside into tumor microenvironment,60,61 they may suppress or promote the growth of different cancer cells, either in vivo or in vitro62,63 and make these cells as a challenge source for cell therapy. 64 Therefore, findings confirmed this fact that different tissue microenvironment mimicking would help anticipate different MSCs behavior for cell therapy.65,66
As previously reported, MSCs can increase proliferation of erythroluekemic cells, 67 which was repeated in our culture conditions in both 2D and 3D microfluidic devices, but this increase was remarkably higher in 3D based culture condition. When phenotype retention and high proliferation rate combined together in 3D culture condition, it demonstrates the importance of our 3D-based culture condition to mimic bone marrow microenvironment, whereas 2D culture condition showed lower proliferation rate, and phenotype changes. Meanwhile, as shown in cell cycle analysis, leukemic cells had more arrest in G0/G1 phase and lower S + G2/M phase in 2D culture condition compared to 3D culture condition, which refer to high proliferation rate. As reported by another study, this may demonstrate the effect of microenvironment on cell cycle, which cells interaction and physical structure can regulate. 68 It was reported in a study that using a toxic agent to block cell cycle in leukemia was offset by MSCs, which promoted S phase, 69 and it is clear that upregulation of some signaling pathway such as MAPK and malfunction of cell cycle checkpoint result in the entrance of leukemic cells into S phase and leukemic progression. 70
SEM images of 3D microfluidic device demonstrated cobblestone-like clusters, which have posited that these clusters have a major role in maintenance of leukemic cells.71,72 Cobblestone area formation is escalated when leukemic cells coculture with MSCs and show different patterns of epigenetic in comparison to leukemic cell in suspension 73 and this colony formation that refers to the feature of stem cell 74 occurred in both HSCs 75 and primitive leukemic cells. 76 In 2D device, although cells interact with MSCs, they cannot form colonies that refer to defect of 2D system in mimicking bone marrow niche.
Different types of novel drugs have been developed for treatment of AML from hypomethylating agent to monoclonal antibodies, owing to high prevalence of this form of leukemia.6,77 ara-C as a pyrimidine analog and major drug for treatment of AML for induction and consolidation therapy has been used for three decades. 78 Despite the fact that it induces high complete remission (CR) rate, the disease relapses after some years with a probable drug resistance to ara-C and different mechanisms being involved.79,80 AZA as a methyltransferase inhibitor has been used for treatment of MDS and AML and show higher overall survival in comparison to low dose ara-C. 81
This study shows that coculture of leukemic cells with MSCs increased drug resistance in both 2D and 3D microfluidic devices, while the cells in 3D devices, due to mimicking of bone marrow microenvironment, showed more resistance than 2D culture conditions. Simultaneously, AZA showed less toxicity in our devices in comparison to ara-C, which may refer to lower effect of this drug. Due to the resistance of leukemic cells to different drugs 82 and drug response variability in AML patients,83,84 it is essential to provide a preclinical model for target therapy and test new drugs for AML patients. 85 Although animal models have been used widely for these purposes, ethical problems, expense of these models, and lack of appropriate animal models for some diseases are major problems for this purpose. Meanwhile, drug screening in animal model cannot accurately mimic and predict the response in human and gives rise to the introduction of 3D-based culture conditions, a decent alternative tool, for drug screening and disease modeling in human.86,87
Drug resistance in AML patients attributed to the bone marrow niche by providing physical interaction and secretion of different soluble factors.88,89 The interaction of leukemic and bone marrow cells is a two way system in which leukemic cells are preserved by stromal cells that leads to tumor progression and relapse, while leukemic cells affect and regulate normal hematopoiesis by different mechanism like secreting stem cell factor (SCF) and altering the normal niche.90,91 Simultaneously, MSCs play a pivotal role in cells drug resistance through wnt/β catenin and PI3K/AKt signaling pathways92,93 and increase the expression of BCL2 protein in leukemic cells and consequently, reduce apoptosis. 94 Along with these findings, BCL2 mRNA enhances in cells under 3D and 2D microfluidic devices and expressed much higher in 3D microfluidic platform condition. This finding shows the effect of stromal cells and bone marrow niche in viability of leukemic cells through different pathways. Therefore, targeting bone marrow niche in leukemia plays a critical role in inhibition of leukemic progression.7,95,96
Designing microfluidic platform with more chambers and providing hypoxic condition would help to overcome some limitations in mimicking bone marrow niche but this device can be used for mimicking different tissues and different process like osteogenesis by applying proper scaffold. The proposed 3D microfluidic devices by providing an appropriate condition for development of leukemic cells and mimicking human bone marrow niche offers a great opportunity for clinicians to compare the effect of different drugs and behavior of cells in these devices. Utilizing the cells of the patient determines which process should be adopted to promote the quality of the patient's treatment and reveal the unknown mechanisms in leukemia progression.
Footnotes
Acknowledgments
This experiment was funded by Blood Transfusion Research Center, High Institute for Research and Education in Transfusion Medicine and Council for Stem Cell Sciences and Technologies (Tehran, Iran).
Disclosure Statement
No competing financial interests exist.