
Abstract
Three-dimensional (3D)-bioprinting techniques may be used to modulate electrical/mechanical properties and porosity of hydrogel constructs for fabrication of suitable cardiac implants. Notably, characterization of these properties after implantation remains a challenge, raising the need for the development of novel quantitative imaging techniques for monitoring hydrogel implant behavior in situ. This study aims at (i) assessing the influence of hydrogel bioprinting patterns on electrical/mechanical behavior of cardiac implants based on a 3D-printing technique and (ii) investigating the potential of synchrotron X-ray phase-contrast imaging computed tomography (PCI-CT) for estimating elastic modulus/impedance/porosity and microstructural features of 3D-printed cardiac implants in situ via an ex vivo study. Alginate laden with human coronary artery endothelial cells was bioprinted layer by layer, forming cardiac constructs with varying architectures. The elastic modulus, impedance, porosity, and other structural features, along with the cell viability and degradation of printed implants were examined in vitro over 25 days. Two selected cardiac constructs were surgically implanted onto the myocardium of rats and 10 days later, the rat hearts with implants were imaged ex vivo by means of PCI-CT at varying X-ray energies and CT-scan times. The elastic modulus/impedance, porosity, and structural features of the implant were inferred from the PCI-CT images by using statistical models and compared with measured values. The printing patterns had significant effects on implant porosity, elastic modulus, and impedance. A particular 3D-printing pattern with an interstrand distance of 900 μm and strand alignment angle of 0/45/90/135° provided relatively higher stiffness and electrical conductivity with a suitable porosity, maintaining high cell viability over 7 days. The X-ray photon energy of 30–33 keV utilizing a CT-scan time of 1–1.2 h resulted in a low-dose PCI-CT, which provided a good visibility of the low-X-ray absorbent alginate implants. After 10 days postimplantation, the PCI-CT provided a reasonably accurate estimation of implant strand thickness and alignment, pore size and interconnectivity, porosity, elastic modulus, and impedance, which were consistent with our measurements. Findings from this study suggest that 3D-printing patterns can be used to modulate electrical/mechanical behavior of alginate implants, and PCI-CT can be potentially used as a 3D quantitative imaging tool for assessing structural and electrical/mechanical behavior of hydrogel cardiac implants in small animal models.
Introduction
M
Studies have shown that mechanical properties, printing fidelity and resolution, and electrical behavior of cell-laden hydrogels may be improved by optimizing hydrogel cross-linking strategies,15–17 adjusting printing parameters, 18 and incorporating electrically conductive excipients into hydrogels.19,20 Despite numerous studies on improving hydrogel properties, the influence of the hydrogel 3D-printing pattern on the hydrogel cardiac construct's electrical/mechanical behavior is seldom addressed. A few recent studies have investigated the effect of the geometrical configuration on the mechanical properties of 3D-printed polycaprolactone (PCL) scaffolds.21,22
Olubamiji et al. 21 illustrated that PCL molecular weight, strand size, strand spacing, and strand orientation have effects on the mechanical properties of 3D-printed PCL scaffolds. Ribeiro et al. reported similar observations by means of experimental and computational investigations for 3D PCL scaffolds. 22 These studies suggest that the mechanical properties of 3D-printed PCL scaffolds may be controlled by modulating the scaffold geometrical configuration,21,22 whereas the variation of the mechanical properties over time in a physiologically relevant environment remains to be investigated.
Although PCL is a printable polymer at temperatures above its melting point of 60°C, this temperature precludes its use with living cells. Although it can provide high strength to the scaffolds, it is a synthetic polyester with a hydrophobic surface that prevents hydration, protein absorption, and cell attachment, making PCL alone an undesirable polymer for cell-laden polymer bioprinting. 23 In contrast, hydrogels such as alginate can be laden with cells and bioprinted at cell-tolerable temperatures (e.g., 4–37°C). Unlike PCL, hydrogels (e.g., alginate) swell in aqueous systems, making it crucial to characterize the mechanical and electrical behavior of 3D-printed alginate cardiac constructs over time in a physiologically relevant medium. In addition, the use of a larger PCL strand size can improve the modulus of PCL scaffolds, 21 whereas the size of cell-laden hydrogel strands in a bioprinted alginate implant is limited to the nutrient/oxygen diffusion distance limit (∼100–200 μm)1,24,25 for cell survival.
Limited by the strand size and concentrations of the hydrogel (e.g., alginate) 26 and the cross-linker (calcium chloride), 27 the interstrand distance (ISD) and strand alignment angle (SAA) remain the major printing parameters for potentially modulating the mechanical and electrical behavior of 3D-printed hydrogel implants for cardiac tissue engineering applications. Notably, nondestructive characterization of electrical/mechanical/structural behaviors of the cardiac implants in situ remains a challenge for assessing longitudinal performance of the bioprinted implants.28,29
Our recent studies have shown that synchrotron-based X-ray phase-contrast imaging computed tomography (PCI-CT) offers superiority over magnetic resonance imaging (MRI) and X-ray absorption imaging for qvisualization of hydrogel cardiac patches.28,29 Despite exciting outcomes from the PCI-CT, the development of low-dose quantitative PCI-CT that allows for estimation of porosity, elastic modulus, and electrical conductivity of bioprinted cardiac implants in situ still remains to be investigated.
In this study, we hypothesized that (i) the elastic modulus and impedance as well as porosity of bioprinted hydrogel implants could be modulated with 3D printing, and (ii) a synchrotron X-ray PCI-CT-based quantitative imaging technique may be used for estimation of elastic modulus/impedance/porosity and structural parameters of implanted 3D-printed alginate cardiac patches. We bioprinted alginate implants laden with human coronary artery endothelial cells (HCAECs) followed by assessing the effects of bioprinting patterns on the implant electrical/mechanical characteristics. The PCI-CT-based quantitative imaging performance was evaluated to estimate electrical/mechanical behavior of the surgically implanted cardiac patches through an ex vivo study.
Materials and Methods
Bioprintability assessment and characterization of mechanical/electrical and structural properties of 3D-printed alginate constructs
Cell viability and homogenous cell distribution in printed hydrogel implants are major criteria for assessing hydrogel bioprintability. In this study, endothelial cells, which are among the major cell types with fibroblasts and cardiomyocytes in cardiac tissue engineering, were used as a cell model for bioprintability and cell viability assessment.
Two microarchitectural features defined by ISD and SAA were considered as major factors for assessing electrical/mechanical and structural behavior of 3D-printed alginate constructs. Considering that interconnected microchannels ranging between 50 and 1500 μm in a 3D-printed cardiac construct can contribute not only to the implant prevascularization in vitro30,31 but also to surgical anastomosis of the implant to the host tissue after implantation, the ISD values were chosen to be close to the size of coronary microvessel networks on the order of 100 μm.32–36
Our preliminary experiments showed that some adjacent alginate strands may fuse together at low ISD values (<200 μm), most likely due to the alginate relaxation that occurs immediately after printing. As such, three levels of ISD such as 300 (lower point), 900 (center point), and 1500 μm (upper point) were assigned to alginate bioprinting. Moreover, the theoretical alginate strand thickness (nozzle internal diameter) of ∼200 μm corresponding to the nutrient diffusion distance limit of ∼100 μm24,25 (half the strand thickness) was applied to bioprinting cell-laden alginate constructs.
Further, in consideration of the influence of the strand orientation on cardiomyocyte action potential duration and conduction velocity 37 and scaffold mechanical behavior, 21 three levels of SAA were chosen for alginate bioprinting. Although unidirectional strands seem to provide faster conduction velocity, 37 our preliminary experiments showed that the alginate constructs with SAA of 0/180°–10/170° were structurally unstable (particularly at ISD of 1500 μm), which was likely due to insufficient support from the subjacent layer. In contrast, constructs with SAA of 15/165° were sufficiently stable to be handled with forceps. Thus, the SAA of 15/165° was chosen for bioprinting.
Moreover, since unidirectional strands have shown lack of transverse conduction, 37 the SAA of 0/90° and 0/45/90/135°, which provide perpendicular and star-shape strand patterns, respectively, were chosen to provide axial/transversal strand orientation. Then, alginate was 3D printed into cardiac implants with four different combinations of the defined ISD and SAA values. For each printing pattern, the bioprintability, elastic modulus, impedance, and structural features (e.g., porosity, pore size) of the implant were assessed and the influence of the printing pattern was investigated. Experiments were performed in triplicate.
Cell culturing
HCAECs (Cell Applications, Inc. San Diego, CA) were cultured with MesoEndo Growth Medium (Cell Applications, Inc.). Passages 5–6 were used for the hydrogel cell encapsulation. Cells were counted by using a hemocytometer and then mixed with a precalculated volume of sodium alginate (Sigma-Aldrich Co., Saint Louis, MO) solution in calcium-free Dulbecco's Modified Eagle Medium (DMEM) solution at a final cell density and an alginate concentration of 600,000 cells/mL and 2.5% (w/v), respectively.
Bioprinting and cell viability assessment
The sodium alginate solution at a low concentration of 0.5% (w/v) in deionized water was sterilized by using a filter with a mesh size of 0.2 μm. The sterile alginate was freeze-dried for 72 h and stored at 4°C. The desired alginate concentration (3% w/v) was prepared by dissolving the sterile alginate powder in calcium-free DMEM. After mixing with HCAECs at the final cell density and alginate concentration of 600,000 cells/mL and 2.5% (w/v), respectively, the cell-encapsulated alginate was printed into a cross-linking calcium chloride solution (50 mM) in culture plate wells that were coated with 0.1% w/v polyethylenimine (Sigma-Aldrich) by using a pneumatic 3D-bioplotter system (Envisiontec GmbH, Gladbeck, Germany) (Fig. 1a, b). Three minutes after bioprinting, the cross-linking solution was removed from the wells of the culture plates and replaced by MesoEndo Growth Medium (Cell Applications, Inc.).

The 3D plotting was performed at a needle-moving speed of 8 mm/s under a pneumatic pressure of 0.1 bar by using plastic cone needles (EFD Nordson, Westlake, OH). The alginate constructs were plotted with an overall dimension of 11 mm × 11 mm × 2 mm (W × L × H) layer by layer with four printing patterns defined by ISD and SAA as 300 μm and 15/165° (Fig. 1c), 1500 μm and 15/165° (Fig. 1d), 900 μm and 0/90° (Fig. 1e), and 900 μm and 0/45/90/135° (Fig. 1f). The printed implants laden with HCAECs were kept in an incubator at 37°C under 5% CO2.
Hoechst 33342 (Sigma, ON, Canada) and Calcein-AM (Sigma) at concentrations of 2.5 and 1 μg/mL, respectively, were used for staining cells. The total number of cells and number of live cells corresponding to Hoechst and Calcein-AM staining, respectively, were counted at three different regions of the printed strands, and subsequently, the cell viability was assessed by dividing the number of live cells by the total number of cells. The bioprinting resolution and distribution of live cells in alginate strands laden with HCAECs were assessed by using fluorescence microscopy imaging at different focal planes of the 3D double-layer alginate constructs. These assessments were performed at days 0 (an hour after printing), 1, 5, and 7. Experiments were performed in triplicate.
Measurement of elastic modulus and impedance
Before the measurement of mechanical strength of the implants, the top and side views of the 3D-printed alginate implants were imaged by using a camera attached to a stereomicroscope. The images were analyzed in ImageJ (U.S. National Institutes of Health, Bethesda, MD) to precisely measure the thickness and the surface area of the alginate constructs. Then, the texture instrument was calibrated according to a load cell of 250 N at a crosshead speed of 10 μm/s for a 1 mm displacement (compression).
For each test, the force and the corresponding construct deformation of the alginate construct were recorded through the uniaxial unconfined compression test by using a texture analysis material testing system (Texture Technology Corp., Hamilton, MA). Based on the image-based measurements of the surface area and the initial thickness of each construct, the normal stress (Pa) and strain were calculated by dividing the recorded force and deformation (compression) by the construct surface area and initial thickness, respectively, to obtain the stress–strain behavior of the implant. The stress–strain behavior was measured for four printing patterns (Fig. 1c–f) of the 3D-printed constructs that were incubated in phosphate-buffered saline (PBS) at 37°C over 25 days. The measurements were carried out in triplicate at time intervals of days 0 (after printing), 3, 10, and 25.
For impedance measurements, the 3D-printed hydrogel implants were placed on a spacer to fix the clearance (5 mm) between two gold-coated probes of the instrument for all samples. Before each measurement, the superficial liquid (e.g., PBS) on the alginate construct was removed by using Kimwipes tissue. Then, the gold-coated probes with an A.C. bias sweeping between 12 Hz and 1 MHz were attached to the implant along the length of the construct. The measurements were carried out in triplicate for the 3D-printed implants with four printing patterns over 25 days at days 0 (after printing), 3, 10, and 25. Minimizing the mean squared error of an estimator, the impedance was estimated at the frequency of 1 Hz, which is a physiologically relevant frequency for cardiac tissue. Then, for each 3D-printed construct, the impedance at 1 Hz was estimated and statistically compared.
The influence of the printing patterns on impedance and elastic modulus of the implants was statistically investigated at the significance level of 0.05.
Determination of porosity of the 3D-printed alginate implants
The porosity of the 3D-printed constructs was estimated by using a conceptual approach that was previously developed and validated by our group.
38
Figure 1g depicts the 3D-printed alginate construct with ISD and SAA of 900 μm and 0/90°, respectively, and Figure 1h shows the schematic diagram of the representative volume of the construct structure. The length and orientation characteristics of R, Z, m, n, k, and θ have been indicated in Figure 1g and h. For each of the 3D-printed cuboidal constructs, the porosity (ɛ) was estimated by using the modified conceptual model as
38
:
where m and n are the number of strands in the horizontal plane, k is the number of layers in the vertical direction, R is the strand radius, Z is ISD, θ is the strand orientation angle between two consecutive layers, and hz represents the vertical clearance between two adjacent strands in alternate layers.
39
The parameter of hz can be evaluated from a simplified relationship of:
where Ap is the area of the projection of the contact on a horizontal plane, as indicated in Figure 1i. The structural parameters in Equations (1) and (2) were determined by measuring the characteristic lengths based on top and side view images of the 3D-printed constructs. Table 1 presents the measured values of the structural parameters associated with four printing patterns of the hydrogel implants.
Interstrand distance.
Strand alignment angle.
Number of strands on the horizontal plane.
Number of layers in vertical direction for a 3 mm thickness of the construct.
Actual strand diameter.
Center-to-center distance between two sequential strands on horizontal plane.
The projection of strand–strand contact area on horizontal plane.
ISD, interstrand distance; SAA, strand alignment angle.
Degradation and swelling study
A degradation study based on dry mass loss was performed over 25 days of incubation. After 3D printing, for each sample, the alginate construct was transferred to a 5-mL vial of PBS (Sigma), which was incubated at 37°C. At days 0, 10, and 25, the samples were freeze-dried at −80°C and 0.01 mbar for 48 h and the dry mass was measured for each sample. Dividing the dry mass difference by the original dry mass, the mass loss fraction representing the degradation was calculated for each sample after 10 and 25 days of incubation. For surface morphology assessment, each sample was gold-coated (Q150T; Quorum Technologies, United Kingdom) and then imaged by scanning electron microscopy (SEM) (Hitachi SU8000; Japan) at 5 kV. Experiments were performed in triplicate.
The degree of swelling was determined based on measuring the average weight changes of implants before and after being submerged in PBS at incubation times of 0.5, 2, 3, 5, 10, and 20 days. The average weight changes of the incubated implants were calculated in percent (%).
Ex vivo characterization of implant microstructure using synchrotron PCI-CT
Three-dimensional quantitative imaging of implanted alginate constructs is essential for monitoring the implant degradation and deformation in situ over time. In the second phase of this study, specific synchrotron X-ray imaging parameters (e.g., X-ray photon energy, CT-scan time) were evaluated to achieve a low-dose 3D quantitative in-line PCI-CT for the measurement of alginate strand orientation and thickness, pore size and strand–strand contact area, and determination of implant porosity compared with the results from the first section of this study. The 3D-printed alginate construct was implanted on rat heart myocardium; the heart with the implant was excised after 10 days and was immediately embedded in a tissue mimicking gel for PCI-CT imaging through an ex vivo study.
Selection and implantation of the 3D-printed alginate construct
Based on the results from the first phase of this study, for the imaging experiments, the ISD of 900 μm and SAA of 0/90° were selected as the 3D-printing pattern criteria, which resulted in relatively higher elastic modulus and porosity of the implant compared with the other printing patterns. With ISD of 900 μm and SAA of 0/90°, two structural configurations, vertically aligned (Fig. 2a) and staggered (Fig. 2b) strand placements, were implemented to obtain two different implant structural complexities with the same printing pattern criteria. The staggered strand configuration was obtained by shifting the strand distance from 0 to 200 μm in two consecutive layers. The PCI-CT performance for quantitative evaluation of pore size, porosity, strand thickness, and orientation angle was assessed for these two structural configuration after 10 days postimplantation through an ex vivo study and compared with the values measured in the first phase of this study for verification.

Before the implantation of the implant, surgical fibrin glue (Baxter Healthcare Co., Westlake Village, CA) at final fibrinogen and thrombin concentrations of 4 mg/mL and 2 U/mL, respectively, was applied to the implants so that the pores were filled with the fibrin (Fig. 2c). The implants were surgically implanted as described in our previous study. 29 Briefly, Lewis rats (∼200 g) were anesthetized (2.5% isoflurane), intubated, and ventilated (70 breath per min at 2 mL tidal volume); then, anterior thoracotomy was performed at the fourth intercostal space. The pericardium was carefully removed, and the alginate construct was implanted on the myocardium by using surgical fibrin glue. The ribs, muscles, and skin were closed, and the rats were housed under standard conditions after recovery.
The procedure was conducted in compliance with the guidelines and ethics set by the Canadian Council on Animal Care, and the animal use protocol was approved by the Animal Research Ethics board of the University of Saskatchewan.
PCI-CT ex vivo imaging of implanted constructs
Ten days after the surgery, the heart was arrested by injecting saturated potassium chloride into the right atrium; then, the heart, including the alginate implant, was excised (Fig. 2d, e) and embedded in a tissue mimicking gel (low melting agar gel at 1% w/v 39 ) to avoid the heart motion artifacts during the imaging. The sample was placed on the CT stage at a sample to detector distance of 147 cm.28,29 The PCI-CT imaging was performed in Biomedical Imaging and Therapy Bending Magnet beamline at the Canadian Light Source synchrotron facility (Fig. 2f). The filtered, collimated, and monochromatic X-ray beam (Fig. 2f) with a beam size of 25 mm × 4 mm (W × H) was used for the imaging at four X-ray energies of 25, 30, 35, and 40 keV. The X-ray images were collected in a Hamamatsu ORCA detector (Hamamatsu, Japan) with an effective pixel size of 12.48 μm. The PCI-CT imaging was performed at four levels of CT-scan acquisition time corresponding to total tomography projections of 750, 1000, 1500, and 3000.
Image processing, radiation dose calculation, and PCI-based estimation of implant electrical/mechanical and structural assessment
For image processing, after background correction, phase information of X-ray images was retrieved by applying the phase-attenuation duality Bronnikov Algorithm using phase-sensitive X-ray image processing and tomography reconstruction software.
40
The refractive to absorption index ratio of 3000 was applied for phase retrieval.28,29 Depending on the storage ring current (150–250 mA) and X-ray energy, the absorbed dose rate was calculated by using the derived equations presented in our previous study.28,29 Subsequently, the clinically interpretable effective radiation dose in terms of Sievert (Sv) was calculated for PCI-CT at different X-ray energies and CT-scan acquisition time:
where the quantity in the outer parenthesis is the total absorbed radiation dose (mGy),
To assess the effect of radiation dose reduction on the quality of X-ray images, image correlation coefficient (R2), structural similarity index (SSI), and contrast to noise ratio (CNR) of X-ray images were statistically evaluated and compared. In addition, the performance of the quantitative PCI-CT imaging of the alginate structural features (e.g., SAA, ISD, strand–strand contact area, pore size) as well as elastic modulus and impedance after 10 days of implantation were assessed and compared with the values obtained from the previous section (section “Bioprintability assessment and characterization of mechanical/electrical and structural properties of 3D-printed alginate constructs”) of this study.
Image segmentation was performed, the volumetric fraction of the pores and alginate strands were measured from the PCI-CT images for a selected area of the implants, and the estimated porosity was compared with the values from Equations (1) and (2) and the statistical model. The PCI-based measured values of the implants ISD and SAA were used to estimate elastic modulus and impedance of the implant by using statistical equations derived from experimental data (see section “Bioprintability assessment and characterization of mechanical/electrical and structural properties of 3D-printed alginate constructs”).
The PCI-based estimated values of the implant impedance and elastic modulus were compared with the measurements at day 10 of incubation corresponding to the implantation period in the rat heart model (see section “PCI-CT ex vivo imaging of implanted constructs”). The quantitative low-dose PCI-CT of alginate implants was performed twice for two implant designs defined by aligned and staggered strand alignment patterns. To keep the PCI-CT performance less sample dependent, the implants were fabricated from the same alginate stock solution and under the same printing conditions except 3D-printing patterns. Also, the same embedding gel and surgical fibrin glue were used for stabilizing the samples and implanting the constructs for the ex vivo experiment. In addition, the effect of X-ray photon flux variation on PCI quality was minimized by applying flat field image correction and background elimination based on dark and flat images acquired before and after each CT scan.
Statistical analysis
Comparisons between two or more groups were performed with paired Student's t-test and one-way analysis of variance (ANOVA), respectively. The statistical relationships were obtained through multiple regression analysis by using SPSS software (SPSS, Inc., IBM). The significance level of p-value <0.05 was considered for all statistical analysis.
Results
HCAEC viability in the 3D-bioprinted alginate implants
Homogenous cell distribution and high cell viability are two critical criteria for bioprinting assessment. Figure 3 shows the live cell distribution after 7 days postbioprinting and presents live and total cell density for cell viability assessment at days 0, 1, and 7. The homogeneity of cell distribution throughout the double-layer alginate constructs for two selected printing patterns of group III and group II can be seen in Figure 3a and c, respectively. The magnified views of the strands depict a high bioprinting resolution (Fig. 3b, d), indicating that the printing parameters such as pneumatic pressure, dispensing head speed and temperature, and the cross-linking solution concentration were suitable for bioprinting of alginate (2.5% w/v) laden with HCAECs at a density of 600,000 cells/mL. Figure 3e–g depicts Calcein-stained cells representing live cells in the strands, and Figure 3h–j shows the total number of cells represented by Hoechst-stained cells.
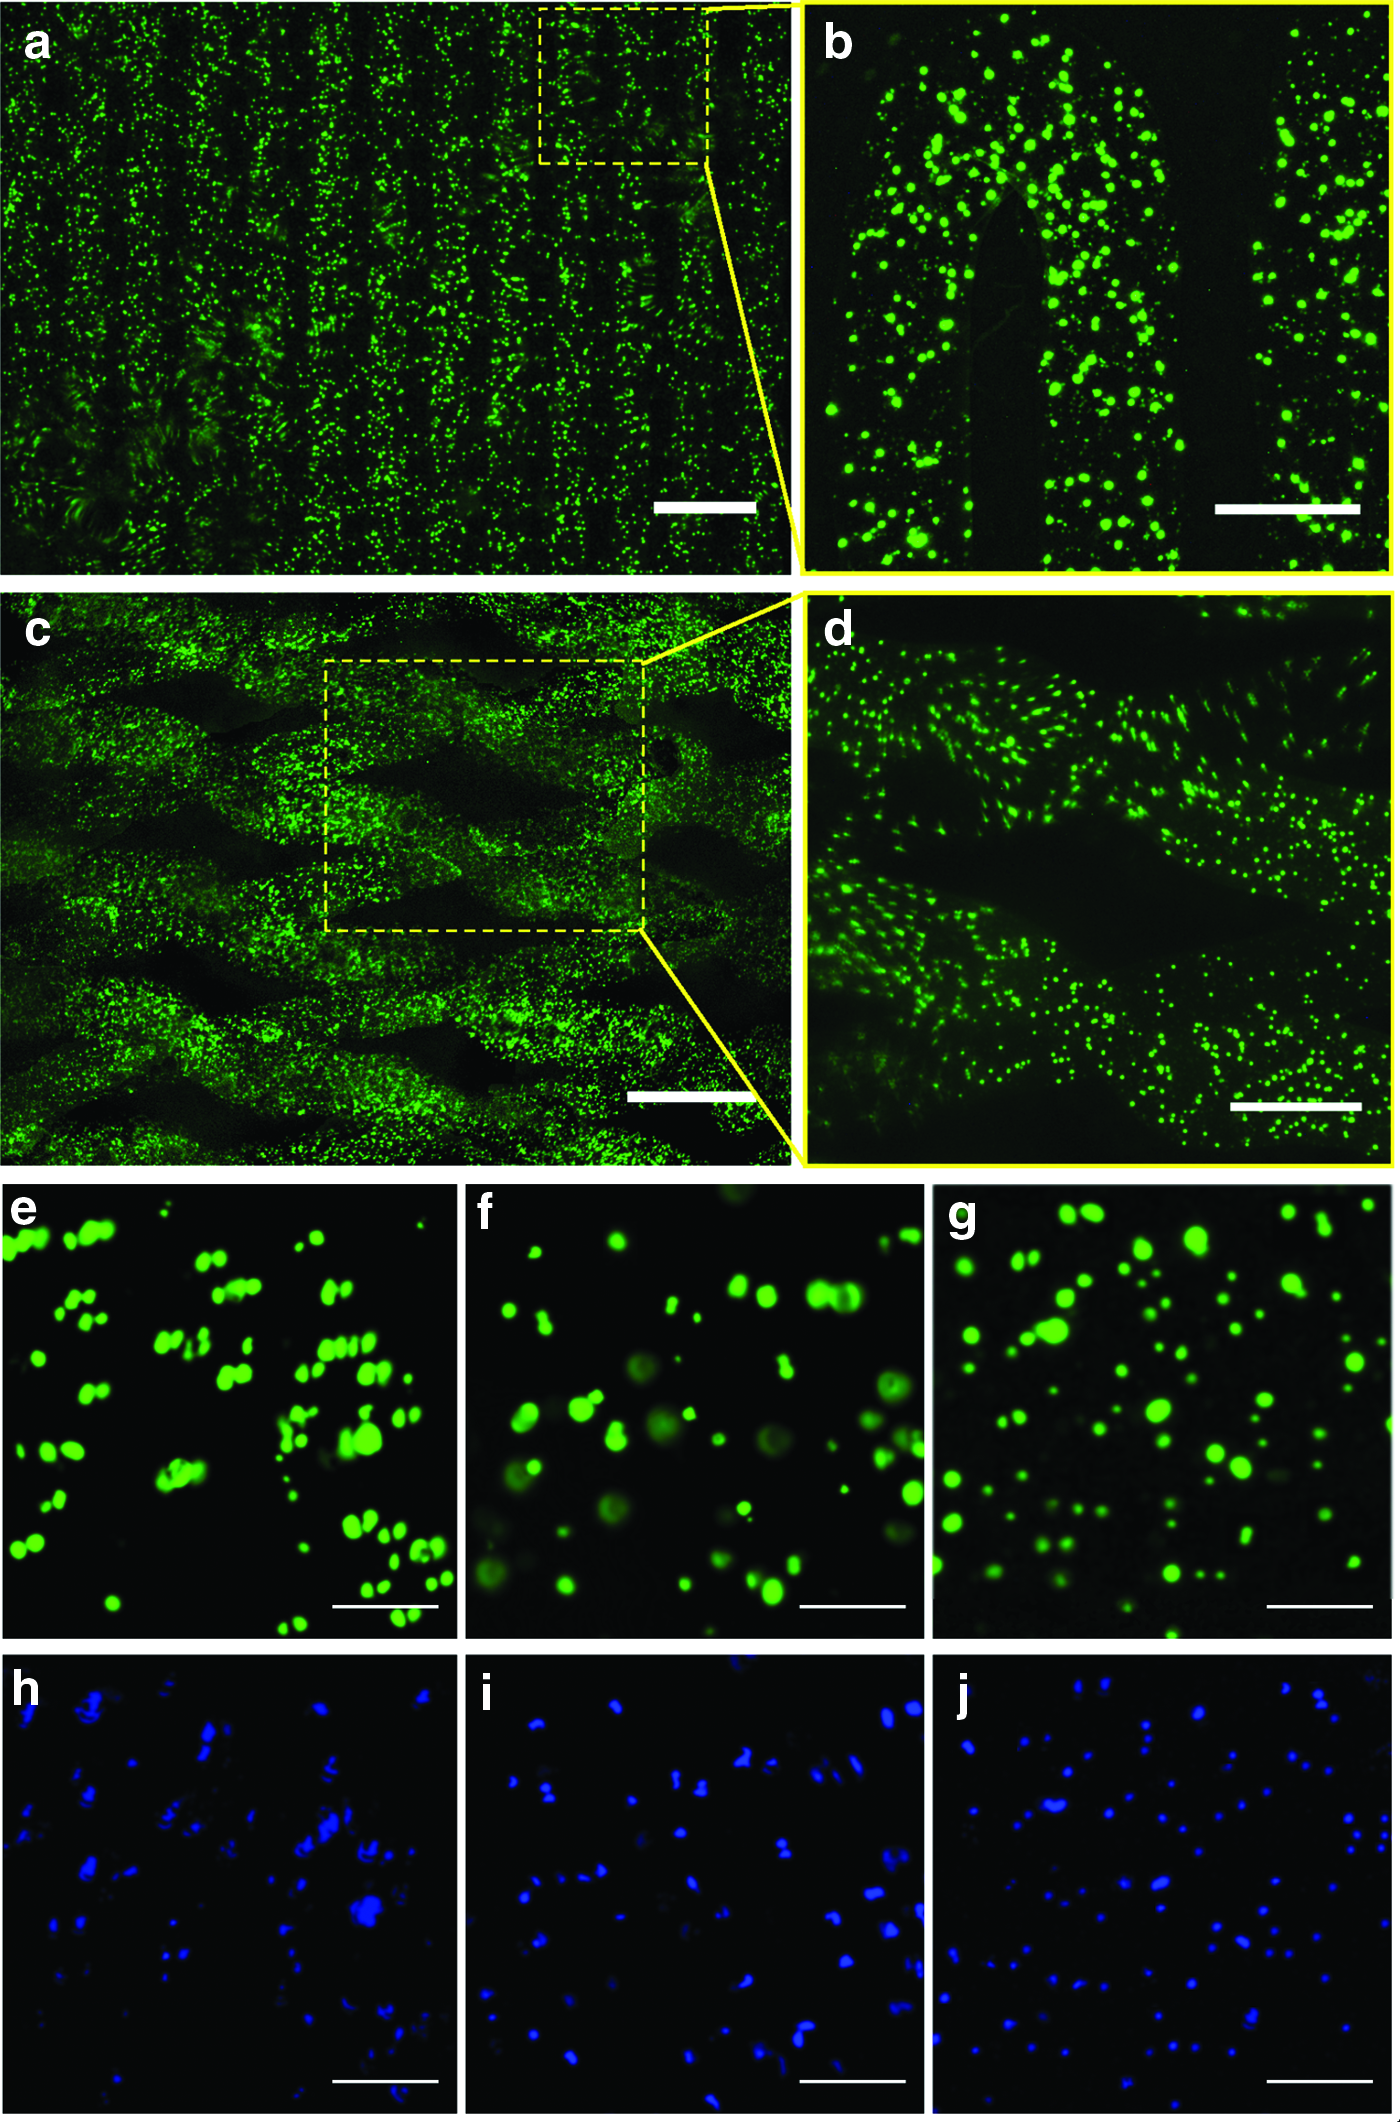
Bioprinting resolution and cell viability of the alginate strands laden with HCAECs over 7 days after bioprinting:
Calculated from the counted live and total cells in three different areas of the strands in the fluorescence microscope images, the cell viability was assessed as 80%, 88%, and 91% at days 0 (after printing), 1, and 7, respectively. Based on the total number of counted Hoechst-stained cells in three different regions of strands associated with the fluorescence images (Fig. 3h–j), the total number of cells that represent cell proliferation significantly increased from day 0 to 7.
The influence of 3D-printed implant architecture on elastic modulus, impedance, and microstructure
Figure 4 illustrates the changes in the elastic modulus, degree of swelling, porosity, and strand thickness of the 3D-printed hydrogel constructs with respect to the printing patterns. Regardless of the printing patterns, nonswollen alginate constructs in calcium chloride after printing (day 0) present lower elastic modulus compared with the swollen ones (e.g., day 3) (Fig. 4a). The implant elastic modulus generally declines after 3 days for all printing patterns except for group II (Fig. 4a). The printing pattern of group IV relatively offers the highest elastic modulus over 25 days of incubation in PBS at 37°C compared with other architectural designs (Fig. 4a). In contrast, the structural design corresponding to the printing pattern of group II exhibits the lowest elastic modulus compared with other printing patterns (Fig. 4a). Further, the elastic modulus of all implants is significantly increased within the first 3 days of incubation (Fig. 4b). The increase in the elastic modulus may be associated with the increase in the degree of swelling of implants within the first 3 days of incubation.

Figure 4c illustrates the average degree of swelling of implants over 20 days of incubation, with the standard deviation associated with printing patterns. The implant swelling reaches its highest value within 3 days (Fig. 4c). Over the first 3 days of incubation, the hydrogel implants with the printing pattern of group III experience ∼30% increase per day in elastic modulus whereas the printing pattern of group IV results in a slight improvement in elastic modulus change per day by ∼5% within the first 3 days (Fig. 4b). The elastic modulus relatively decreases by an average rate of ∼3% (Fig. 4b) from day 3 to 25 except for group II.
Unlike other printing patterns, the architectural design of group II provides an average increase in elastic modulus by ∼4% from day 3 to 10; however, the elastic modulus decreases ∼5% per day from day 10 to 25, which is the highest among different printing patterns (Fig. 4b). ANOVA indicated that the printing pattern parameters of ISD and SAA have statistically significant (p-value <0.05) effects on the compression elastic modulus of the hydrogel implants.
Derived from multiple regression analysis, the statistical equation, as shown in Figure 4b, presents the relationship between the elastic modulus and ISD and SAA (θ) of the implant after 10 days of incubation corresponding to the cardiac construct implantation duration (10 days) in rats (see section “Ex vivo characterization of implant microstructure using synchrotron PCI-CT”).
Figure 4d illustrates the hydrogel implant porosity with respect to the printing patterns. The architectural designs of groups I and II present the lowest and the highest porosity, respectively (Fig. 4d). Comparisons based on the Student t-test between groups I and II, which have same SAA but different ISD, and between groups III and IV, which have similar ISD but different SAA, indicate that the construct porosity may be adjusted by changing ISD or SAA, respectively (Fig. 4d). Figure 4e presents the statistical relationship to estimate porosity with respect to ISD and SAA (θ).
Figure 4f illustrates the strand thickness variability, which was calculated by using ImageJ based on measured values of strand thickness at 20 random regions of the bioprinted implant fluorescence microscope images (Fig. 3a–d) for all replications of each experimental group. The printing patterns given by groups I and IV offer an average strand thickness of 198 ± 24 and 186 ± 19 μm, respectively, which are close to the ideal strand thickness (needle internal diameter) of 200 μm (Fig. 4f). In contrast, printing patterns of groups II and III resulted in average strand thicknesses of 179 ± 18 and 180 ± 14 μm, respectively, which are slightly lower than the needle size of 200 μm (Fig. 4f). However, the printing pattern of group III provided the lowest strand thickness variability, indicating more consistent printing resolution when the strand perpendicular pattern (0/90°) with ISD of 900 μm is applied to bioprinting (Fig. 4f).
Figure 5a–c depicts SEM images of a selected area of the 3D-printed implant of group III incubated in PBS for 0, 10, and 25 days, respectively. Figure 5d–f shows alginate strand surface morphology that represents pore formation due to alginate degradation in PBS over time. The crossing alginate strands present a good architecture with structural integrity (Fig. 5a) and no superficial pores (Fig. 5d) at day 0. After 10 days of incubation in PBS, signatures of structural damage (Fig. 5b) and pore formation (Fig. 5e) are observed in the implant alginate strands. The 3D-printed alginate construct undergoes a significant loss of structural integrity (Fig. 5c) due to the degradation in PBS that leads to mass loss and pore formation (Fig. 5f).
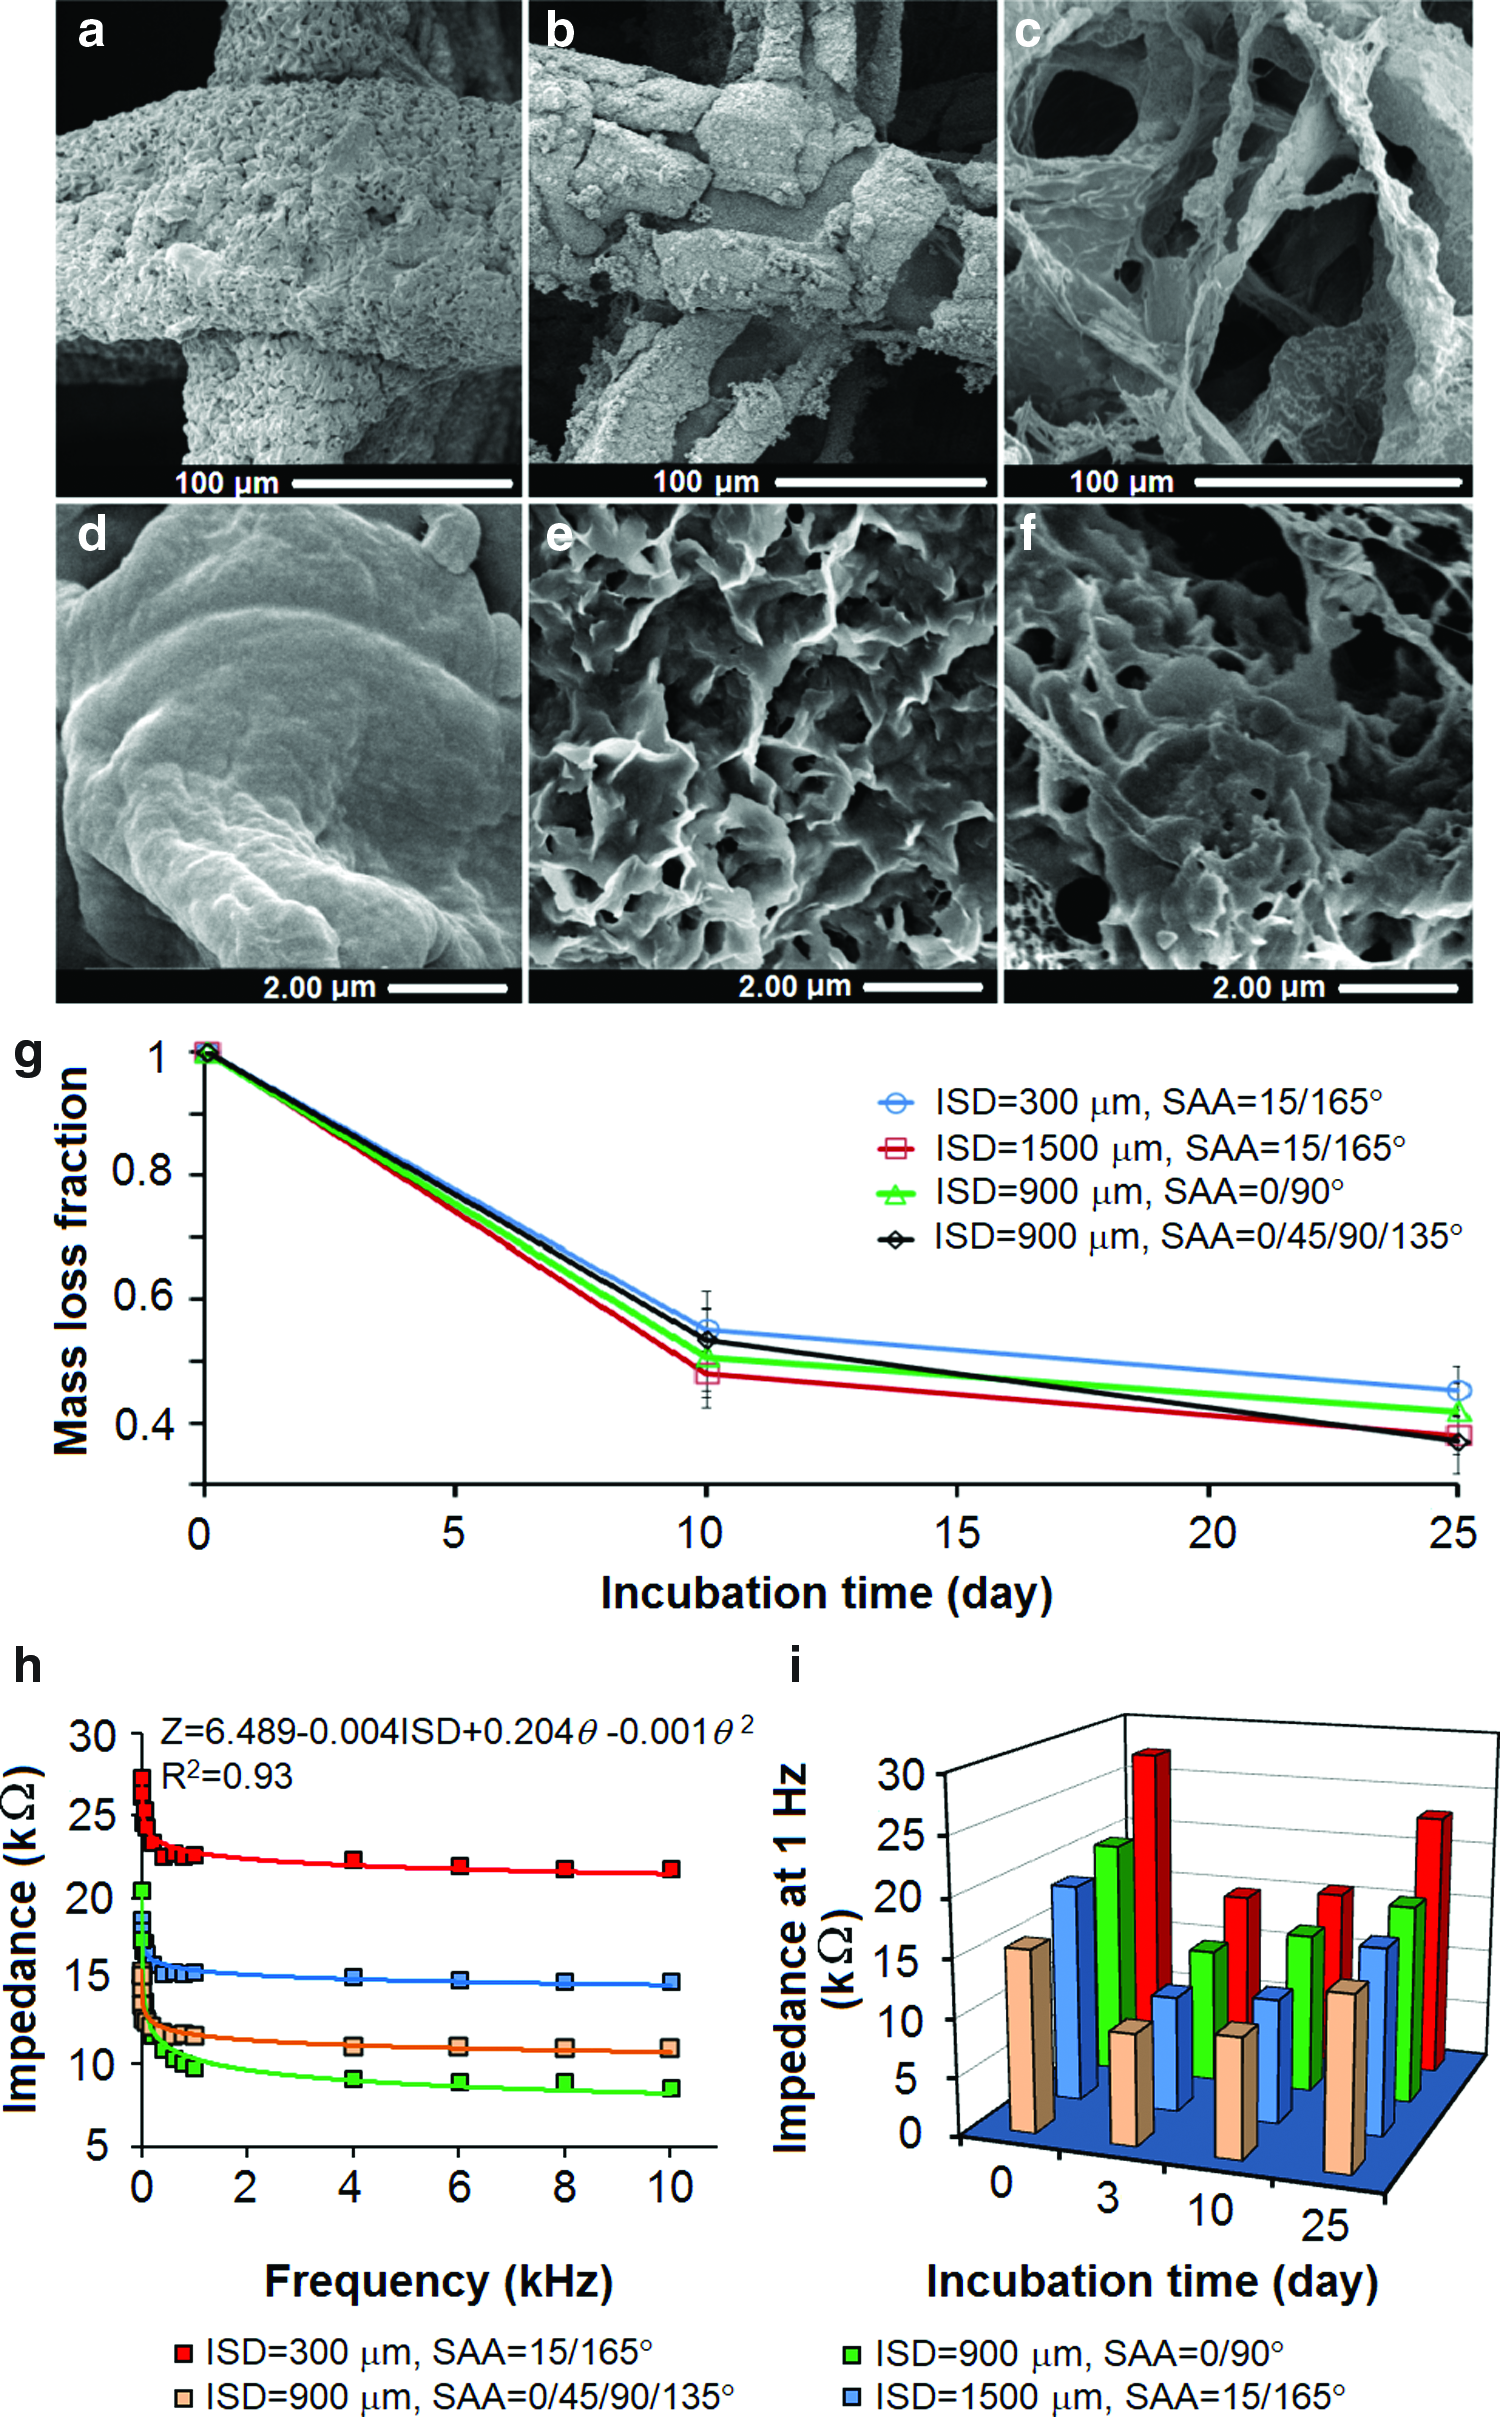
Scanning electron microscopy images of
Figure 5g illustrates the quantitative mass loss (fraction) of the alginate implant over 25 days of incubation in PBS. Although the printing pattern has no statistically significant effect on the degradation, the implants associated with the printing patterns of groups I and II exhibit a slightly lower and higher degradation, respectively, compared with other printing patterns (Fig. 5g).
Figure 5h illustrates the impedance of the 3D-printed hydrogel implants for a range of frequency from 1 Hz to 10 kHz after printing. The impedance of the implants decreases with frequency and is significantly (p-value <0.01) affected by the 3D-printing patterns (Fig. 5h). Generally, the printing patterns of group I offer the lowest electrical conductivity (Fig. 5h). In particular, for the physiologically relevant frequency of 1 Hz, the 3D-printed hydrogel implants of group IV provide higher electrical conductivity over 25 days of incubation time compared with other printing patterns (Fig. 5i).
Quantitative low-dose phase-contrast visualization of alginate implants
Figure 6 depicts the phase-retrieved PCI images of the heart tissue and the implants at different X-ray energies and demonstrates the quantitative visualization of the alginate strands compared with the stereomicroscope images of the implants. The visibility of the alginate strands of the implant (yellow arrows) decreases with increasing X-ray energy from 25 to 40 keV (Fig. 6a–d). This can be attributed to the higher X-ray photon flux and refractive index at the lower X-ray energies. 28
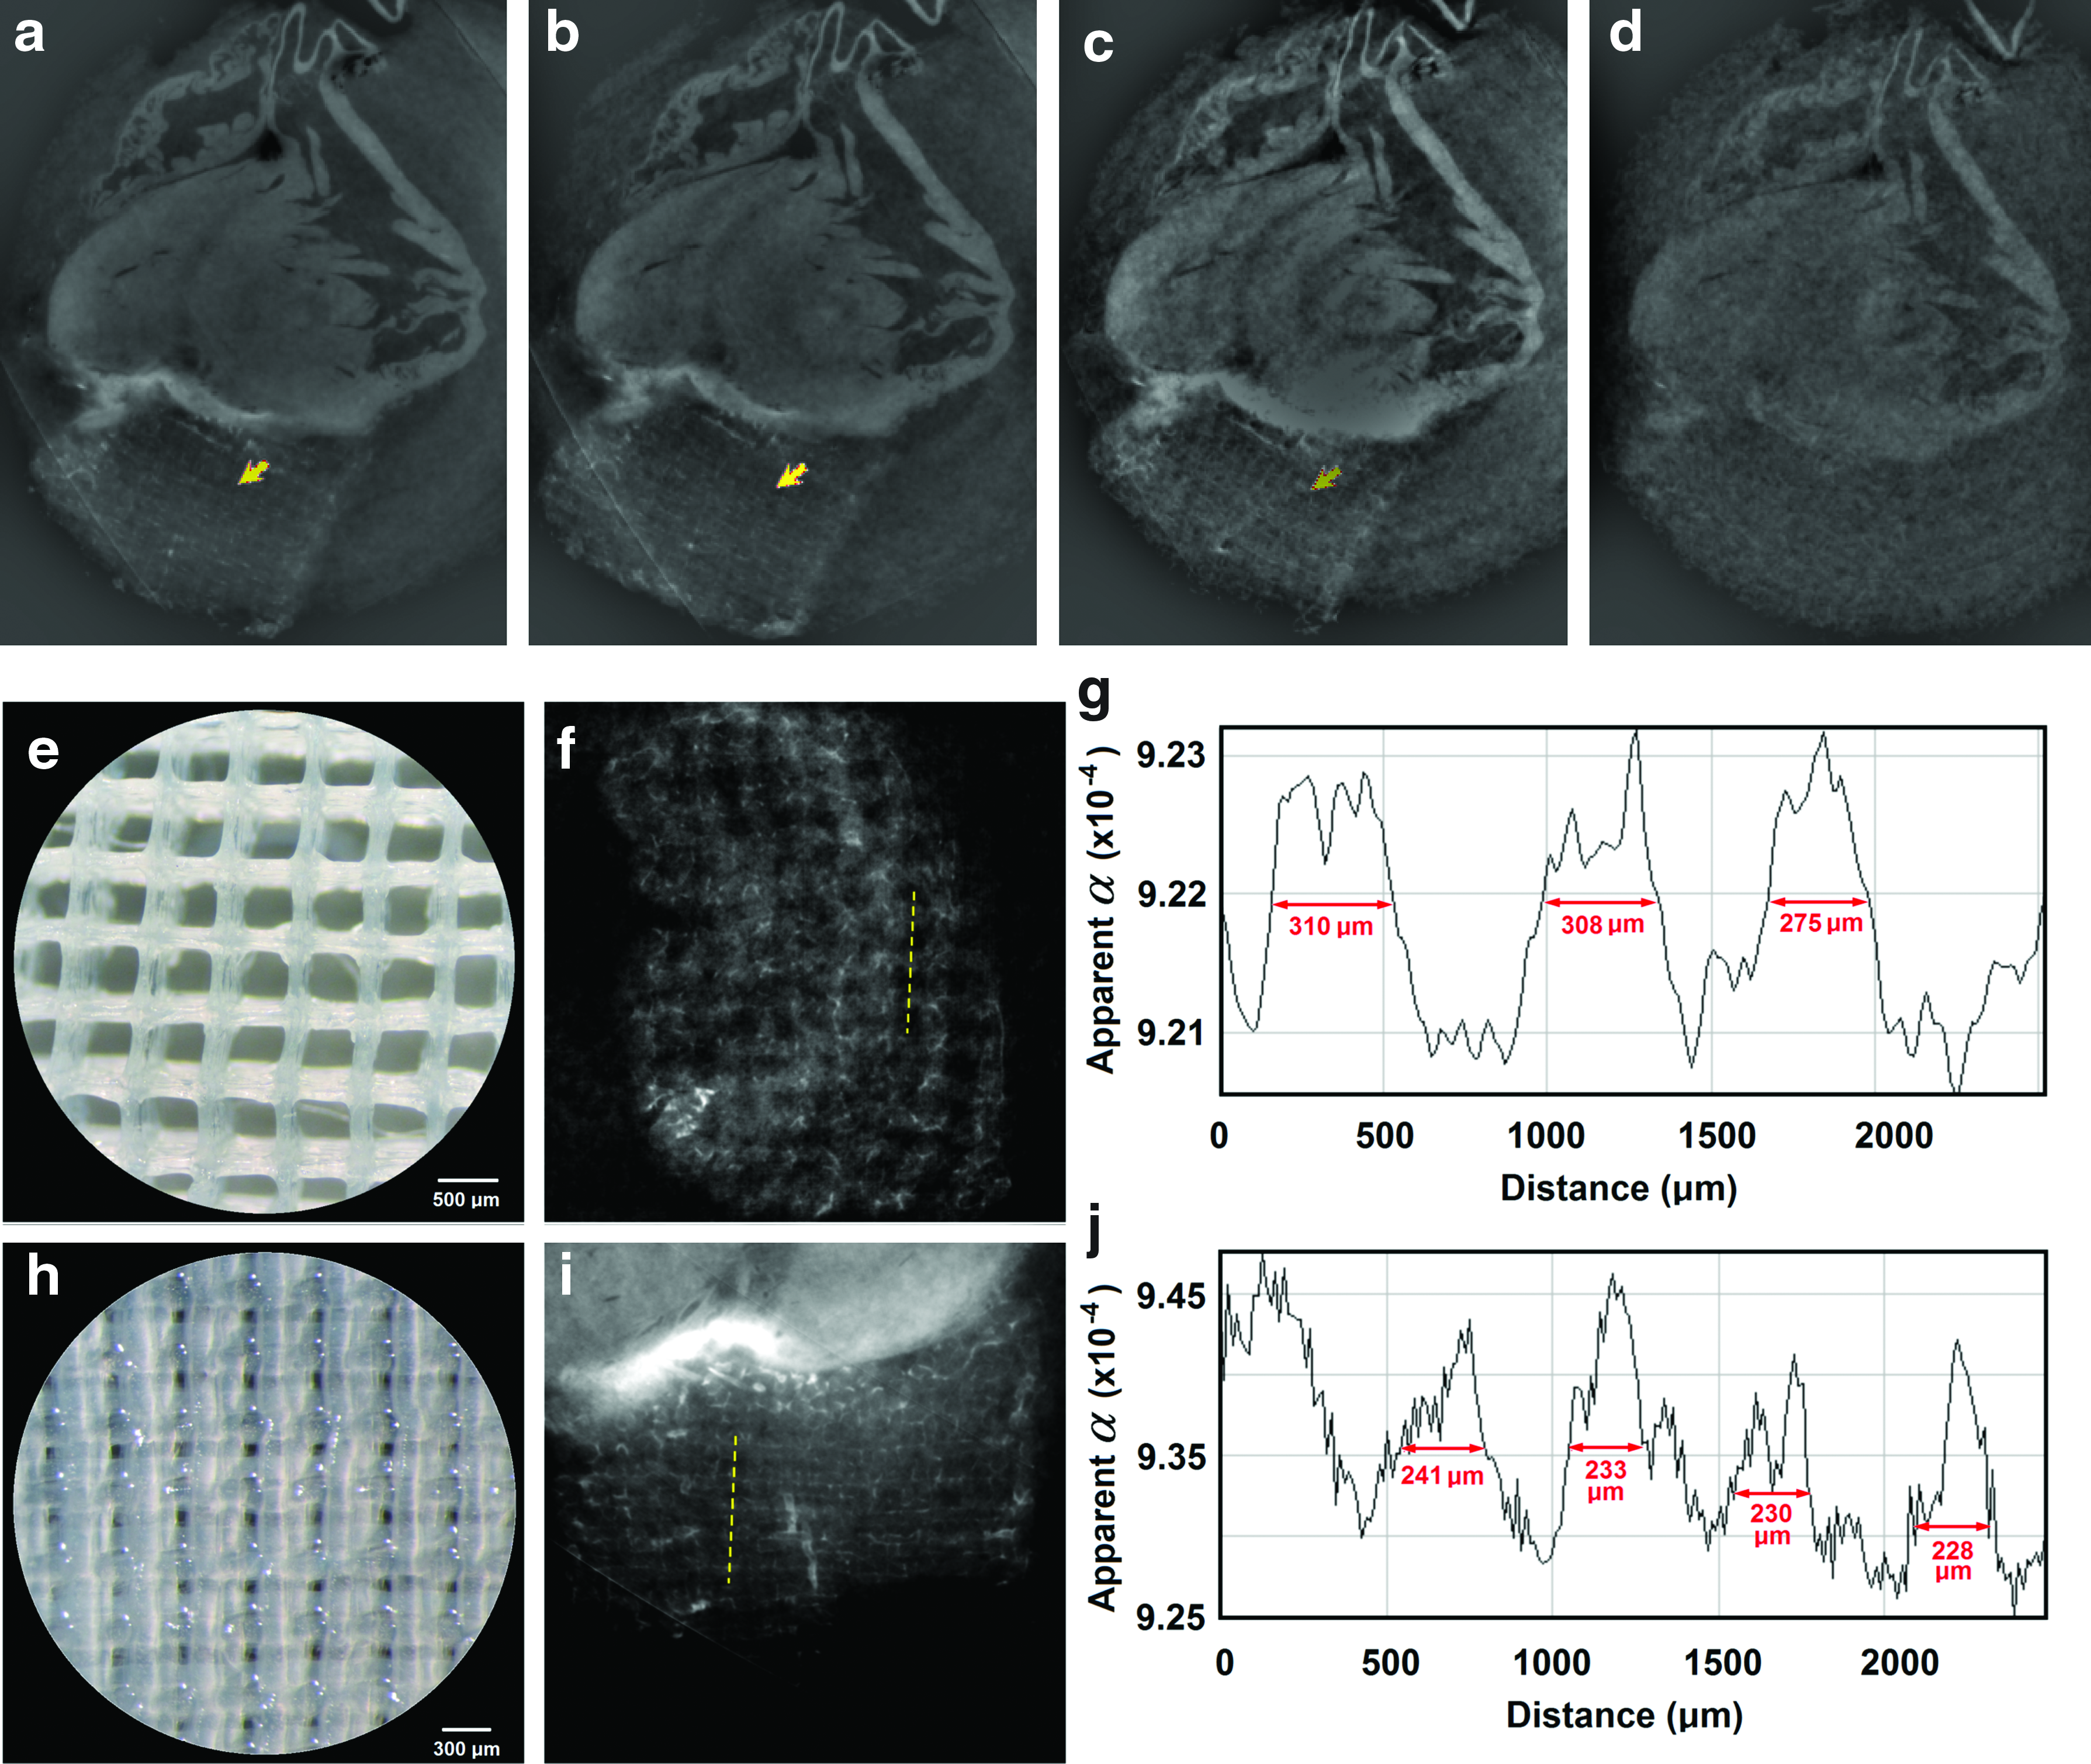
Phase-retrieved PCI-CT images demonstrating the visibility of the alginate implant (yellow arrow) at X-ray energies of
Figure 6e and h demonstrates the stereomicroscope images of the implant strands compared with the PCI-CT images (Fig. 6f, i) representing the aligned (Fig. 6e, f) and staggered (Fig. 6h, i) strand configurations. Figure 6g and j illustrates the apparent refractive index profiles along the line (dashed line) on the PCI-CT images of the implants to demonstrate the phase contrast of the alginate for measuring the thickness of the strands. The periodic pattern of the profile indicates that PCI-CT is able to distinguish between alginate strands and fibrin-filled pores, both of which are made of more than 97.5% water. The PCI-based estimations of the strand thickness were 278 ± 53, 230 ± 67, 276 ± 67, and 264 ± 79 μm corresponding to X-ray energies of 25, 30, 35, and 40 keV, respectively. The measured values of the strand thickness (Fig. 6g, j) are consistent with the actual strand thicknesses of 250 and 200 μm measured from the stereomicroscope images corresponding to the aligned (Fig. 6e) and staggered (Fig. 6h) strand configurations, respectively.
Figure 7a–c illustrates the variations of CNR, SSI, and dose with X-ray energy and number of tomography projections. The CNR per pixel of images is reduced as the number of tomography projections decreases from 3000 to 750 (Fig. 7a). In contrast, a slight reduction in SSI can be identified when energy and tomography projections are increased and decreased, respectively (Fig. 7b). However, the radiation dose is significantly decreased by reducing the number of tomography projections (Fig. 7c). Aiming at minimizing the dose and maximizing CNR and SSI for a region of interest of 1 mm2 of the alginate implant, an optimum window of the imaging parameters was identified to achieve a low-dose (100–150 mSv corresponding to 0.8–1.6 Gy) PCI-CT for measuring the alginate implant structural features (Fig. 7d–f).
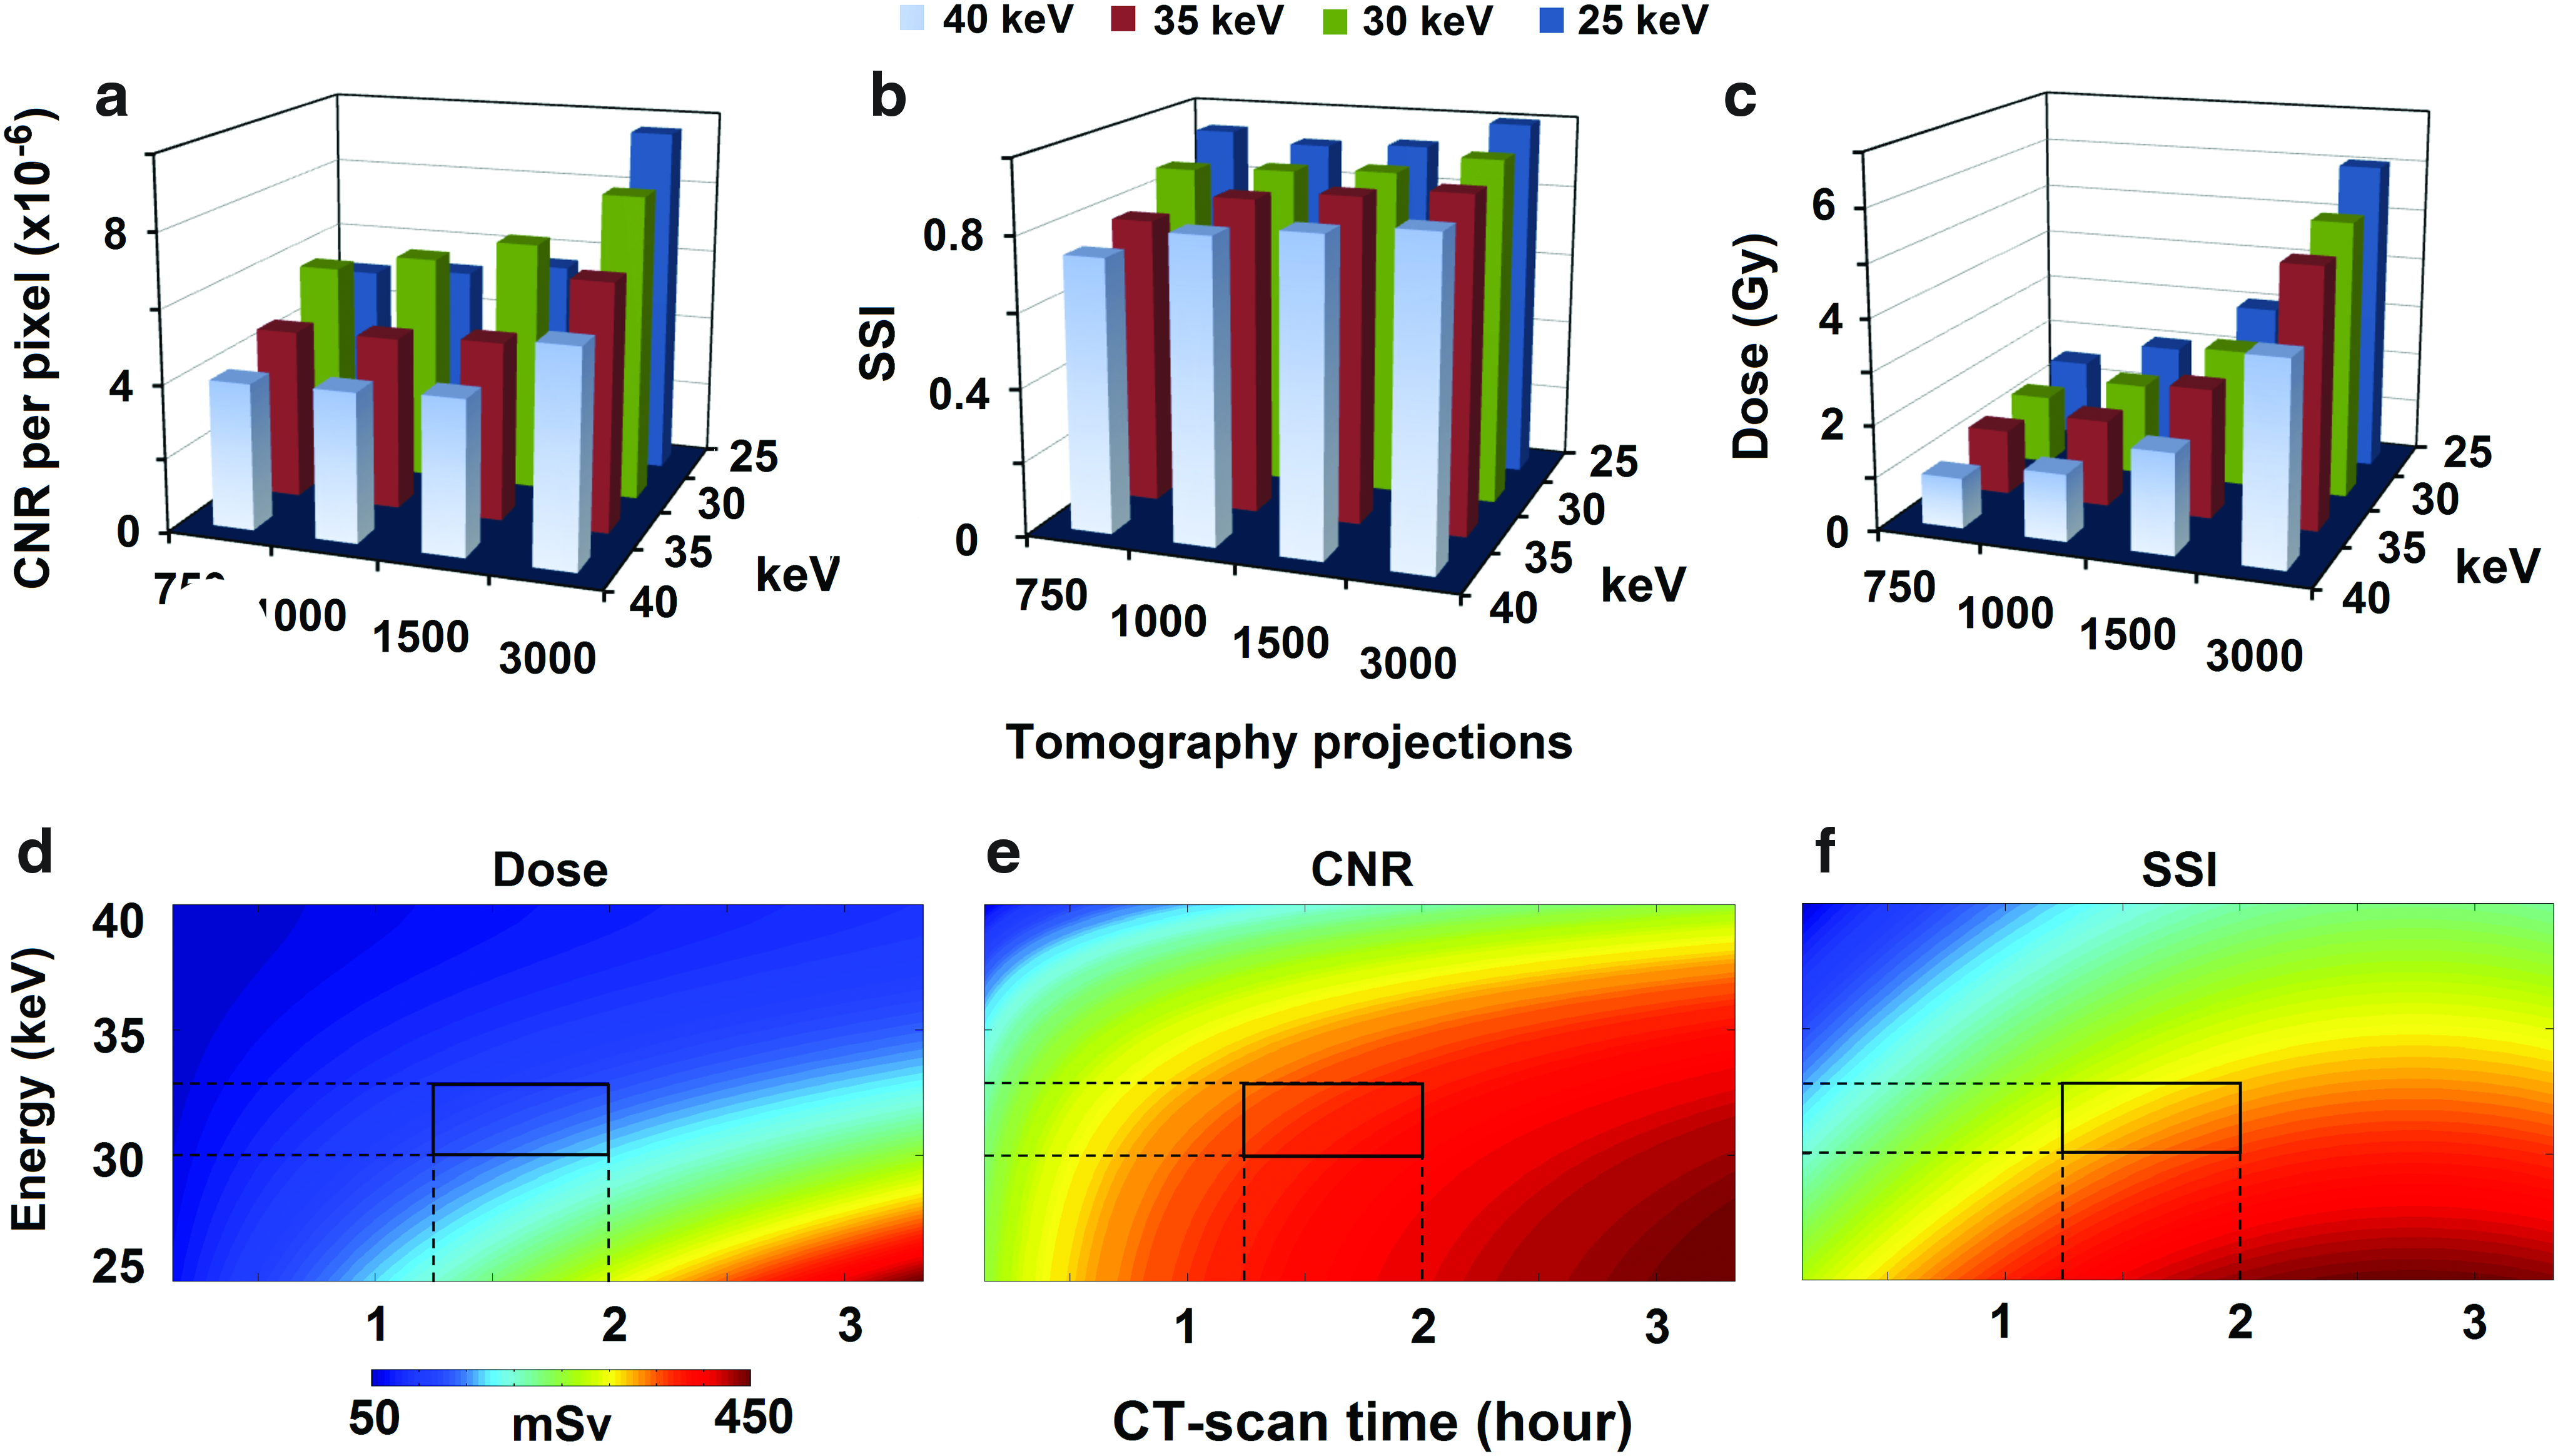
The variation of
Figure 8a depicts the 3D-rendered image of the heart and the implanted alginate implant based on the reconstructed PCI-CT phase-retrieved images. The region of interest for image analyses and measurements of the implant structural features is indicated in Figure 8a. Figure 8b shows the x–z plane of the hydrogel implant from which the thickness and vertical orientation of alginate strands can be visualized. The strand–strand contact area cross-section that exhibits an elliptical shape, rather than a round shape, and the vertical pore interconnectivity can be seen from the X-ray image (Fig. 8b).
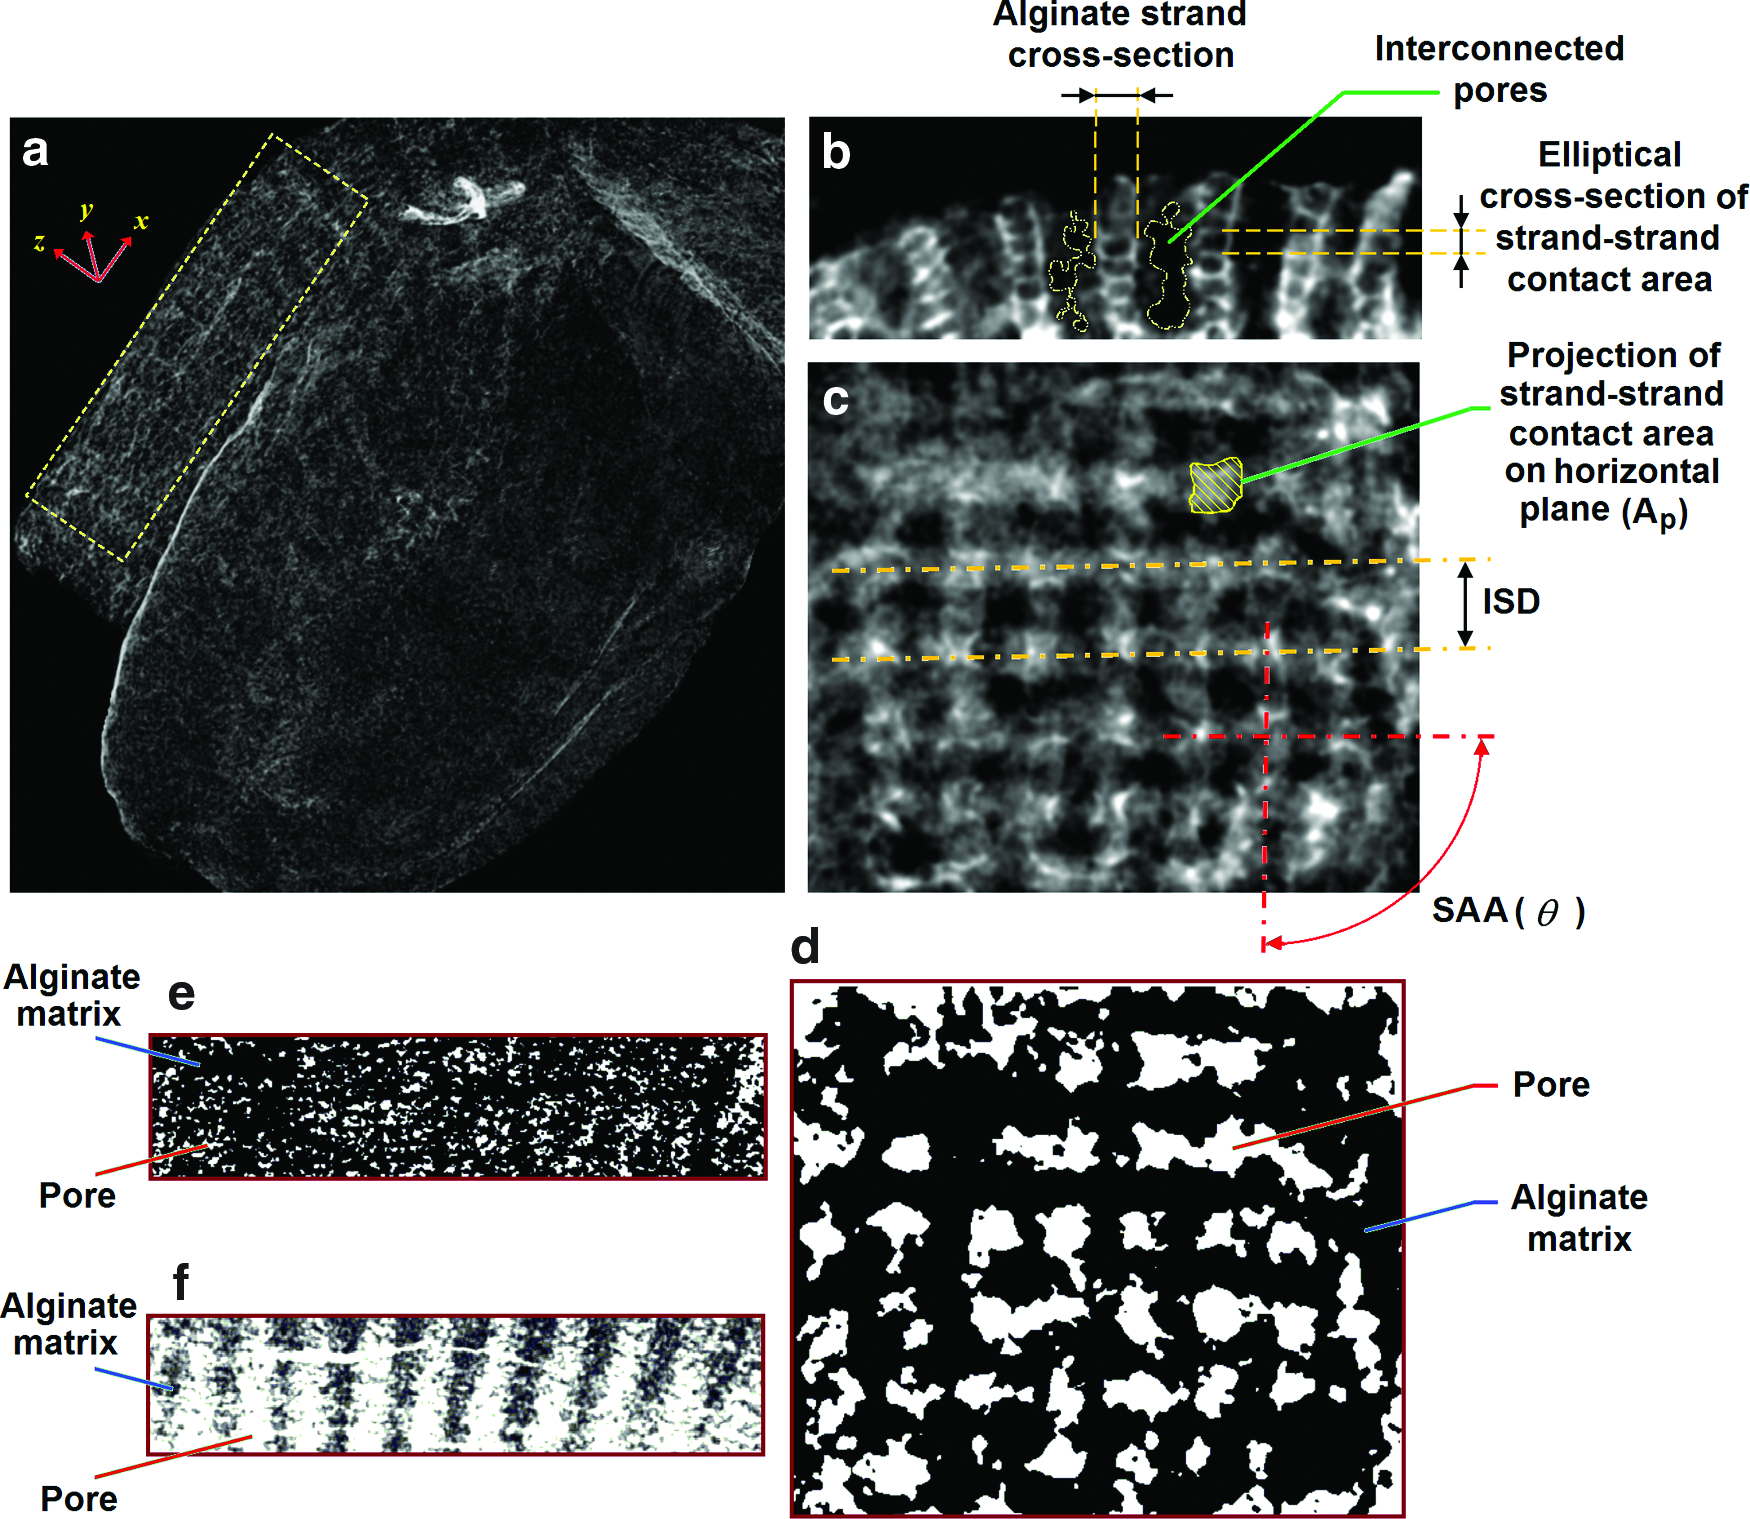
The low-dose PCI-CT performance for quantitative assessment of the 3D-printed hydrogel implants:
The elliptical cross-section is attributed to the normal stress imposed by the printing strands onto the top of the lower layer strands. Figure 8c depicts the PCI-CT slice in the x–y plane of the implant based on which ISD, SAA (θ), and the projection of the strand–strand contact area on the horizontal plane (Ap) can be identified and measured. Figure 8d–f shows the processed images representing the segmentation of the pores and alginate strands in the x–y plane (Fig. 8d), y–z plane (Fig. 8e), and x–z plane (Fig. 8f). Based on the image segmentations, the porosity of the implanted construct was determined by dividing the volumetric measurements of the pores by the volume of the selected region of the implant.
Table 2 presents the PCI-CT-based estimations of porosity, microstructural parameters, elastic modulus, and impedance of the implant compared with those obtained from direct/indirect measurements.
Measurements based on reconstruction of phase-retrieved PCI-CT images of the implanted hydrogel cardiac patch (swollen) in rat hearts after 10 days postimplantation.
The values based on applying PCI-measured ISD and SAA to statistical equations in Figures 5b and 6a, respectively.
Direct measurements of elastic modulus and impedance (Figs. 5b and 6a) and indirect estimation of porosity based on Equations (1) and (2) and the statistical equation (Fig. 5d).
Measured ISD of nonswollen alginate construct after 3D printing.
Porosity estimation using Equations (1) and (2).
Porosity estimation using statistical equation in Figure 5d.
The measured value corresponding to 10 days of incubation time at 37°C and 5% CO2.
PCI-CT, phase-contrast imaging computed tomography.
Discussion
Ensuring that electrical/mechanical and structural properties of hydrogel-based cardiac constructs are comparable to those of the native myocardium is an area of intensive research. Although bioprinting enables precise control over spatial cell deposition within a 3D cardiac construct, printing patterns can affect the electrical/mechanical behavior, along with structural features, of the implants. In this study, we examined the influence of hydrogel 3D-printing patterns defined by four different combinations of ISD and SAA on the electrical conductivity, elastic modulus, and porosity of 3D-printed alginate implants over 25 days of incubation at 37°C. In addition, we evaluated cell viability, relative bioprinting resolution, and bioprinting fidelity of the printed implants laden with HCAECs over 7 days. Further, we assessed the potential of synchrotron-based PCI-CT as a promising tool for estimation of impedance, elastic modulus and porosity, as well as microstructural features of the 3D-printed hydrogel constructs implanted onto the rat heart via an ex vivo study.
Alginate was selected as a hydrogel implant model because of its extensive usage in cardiac regenerative medicine and its approval for phase II clinical trials for MI treatment.41–45 The results from mechanical tests suggested that elastic modulus of the 3D-printed alginate implants was significantly (p-value <0.05) affected by ISD and SAA. The results support the idea that the mechanical behavior of 3D-printed constructs may be modulated by changing the geometrical configuration of 3D-printed constructs as reported in previous studies.21,22,46
Similar to the observations reported by Olubamiji et al. 21 for PCL scaffolds, the compressive modulus and porosity of alginate implants were significantly decreased and increased, respectively, with increasing ISD (at the same SAA) (Fig. 4a, d). Moreover, for the ranges of ISD (900–1500 μm) and SAA (15/165°–0/45/90/135°), our results showed an inverse relationship between porosity and compressive modulus at day 0 (Fig. 4a, d), which agrees with the measurements reported by Olubamiji et al. 21 But our estimated value of porosity (68.4 ± 6.2) at day 0 for the 3D alginate construct with ISD of 900 μm and SAA of 0/90° (group III) was higher than the porosity of 56.8 ± 2.6 reported by Olubamiji et al. 21 for the PCL scaffold with similar geometry. 21 This difference may be attributed to the smaller strand size (∼180 μm) (Fig. 4f) of the alginate implant of group III compared with the PCL strands (200 μm) as reported by Olubamiji et al., 21 leading to a higher porosity of the alginate implant with the same geometrical configuration as the PCL scaffold.
Our results showed that the elastic modulus of the 3D-printed alginate implants initially increased within the first 3 days of incubation but then decreased with time. Notably, the alginate implants with different printing patterns demonstrated different mechanical behavior in terms of elastic modulus changes per day over the first 3 days of incubation in PBS. In particular, the 3D implant with ISD of 900 μm and SAA of 0/45/90/135° exhibited significantly lower changes in compressive modulus per day compared with other patterns, which is likely attributed to the pore blockage effect.
As can be seen from the top view of the 3D-printed alginate patch with SAA of 0/45/90/135° (Fig. 1f), some strands and pores partially or completely overlap, which block pores and lead to a higher elastic modulus at day 0 (Fig. 4a). In comparison, printed constructs with SAA of 15/165° and 0/90° had well-interconnected pores (Fig. 1c–e). Affected by pore blockage (less pore interconnectivity) associated with SAA of 0/45/90/135°, pores can be completely closed with the compaction during the compressive test. In contrast, for the implants with SAA of 0/90° (Fig. 1e), the well-interconnected and aligned pores are less likely to be completely closed with the axial compaction during the compression test. 22 Thus, the modulus of the construct with SAA of 0/45/90/135° is already larger than that of the construct with SAA of 0/90° at day 0 before incubation (Fig. 4a).
Within 3 days of incubation, the alginate strands reach a significant degree of swelling (Fig. 4c), which can reduce the pore size (and porosity) and, consequently, increase the elastic modulus of the construct. For the well-interconnected pores of constructs with SAA of 0/90°, the pore blockage due to swelling may be significant. In contrast, because the pores of the constructs with SAA of 0/45/90/135° had been already partially blocked, the change in pore blockage should be small during swelling. Thus, for the same ISD of 900 μm, the implants with SAA of 0/45/90/135° demonstrate smaller changes in elastic modulus per day within the first 3 days compared with those with SAA of 0/90° (Fig. 4b).
In terms of the magnitude of compressive modulus, the measured values of the alginate 3D construct compressive modulus were within the range of 9–50 kPa reported by other studies for altered myocardial matrix hydrogels47–49 and printed cell-laden alginate constructs. 17 In particular, ISD of 900 μm and SAA of 0/45/90/135° provided stiffer hydrogel constructs with an elastic modulus that decreased from 35 to 28 kPa over 25 days of incubation in PBS at 37°C, which was most likely due to the matrix chain relaxation, swelling, and degradation attributed to calcium ion exchange between alginate matrix and DMEM/PBS. 50
Our degradation study showed that the alginate implants underwent a significant mass loss over 25 days of incubation in PBS. The surface morphology assessment from SEM images revealed a remarkable degree of pore formation and loss of structural integrity of alginate strands during the incubation, which are considered as major factors affecting the implant elastic modulus over time in a physiologically relevant medium (PBS). Although the measured compression modulus (28–35 kPa) of the hydrogel implant with ISD of 900 μm and SAA of 0/45/90/135° was lower than that of the human native myocardium (425 kPa), the implant elastic modulus was close to that of native adult rat heart tissue (∼46.2 kPa). 51 This suggests that the alginate implants with the given ISD and SAA may not hinder the rat myocardium contraction after implantation while maintaining an elastic modulus similar to the tissue for in vivo studies.
One limitation of our study on the mechanical behavior of the 3D-printed alginate constructs is associated with the uniaxial mechanical test. Based on the fact that the 3D-printed constructs with different patterns (specifically those with SAA of 15/165°) are anisotropic, the construct mechanical behavior depends on the load direction. In this study, considering that the 3D implant plane (x–y plane, as shown in Fig. 8a) is perpendicular to the myocardium movement (axial or z) after implantation, we applied the uniaxial mechanical test along the z-axis of the 3D-printed constructs to compare the stiffness of different printing patterns. The load-direction-dependent mechanical behavior of the 3D-printed cardiac constructs needs to be assessed further in future works.
In addition, the implants with ISD of 900 μm and SAA of 0/45/90/135° offered a higher electrical conductivity (lower impedance) at the physiologically relevant frequencies of 1–5 Hz, suggesting that the implant 3D-printing pattern of group IV offers an electrical/mechanical advantage over other printing patterns examined in this study. The low-frequency impedance (9.5 kΩ) of the alginate implants (ISD of 900 μm and SAA of 0/45/90/135°), which was measured after 3 days of incubation, was slightly larger than the measured value of alginate bead impedance at 5 Hz (6.7 kΩ corresponding to 0.015 Sm−1) reported by Esch et al. 52 for the same alginate concentration of 2–2.5% (w/v) as our study.
Regardless of the printing patterns, the low-frequency impedance of the implants decreased over the first 3 days of incubation followed by a gradual increase after 10 and 25 days (Fig. 5b). This behavior of the implants may be explained by the dynamic internal conductivity of the alginate matrix over the incubation time that contributes to the matrix hydration and mobility of free ions within the hydrogel porous structure.
When alginate implants are placed in DMEM or PBS, the sodium ions present in the external medium undergo an ion-exchange process with the cross-linking calcium ion in the alginate matrix. As a result, chain relaxation takes place due to the electrostatic repulsion among carboxyl groups that enhances the matrix pore size and water intake. 50 Esch et al. 52 have shown that the low-frequency ionic conductivity of hydrogels is reduced by a factor of 3–7 compared with the suspension solution, indicating that the ion mobility within the alginate matrix is significantly enhanced as a result of the swelling. Thus, the significant reduction in the impedance of the alginate matrix with the first 3 days (Fig. 5b) may be attributed to the alginate matrix swelling. This agrees with the structural measurements on alginate hydrogels using the small-angle X-ray scattering technique. 53 The alginate implants exhibit an impedance increase over the next 10 and 25 days of incubation. The increase in the impedance over time might be attributed to the loss of polymeric chains associated with alginate matrix degradation over time.
As revealed by SEM images of alginate strands, the degradation leads to the formation of larger pores within the alginate matrix over time, which can enhance the diffusion of free ions from the hydrogel matrix to the external medium, reducing the internal ionic conductivity of the hydrogel. The results from cell-laden alginate bioprinting suggested that HCAEC viability was >80% immediately after bioprinting, and the cell viability was maintained above 90% over 7 days. In addition, the bioprinted alginate implants laden with HCAECs retained bioprinting fidelity for all printing patterns over 7 days postprinting.
From an ex vivo characterization point of view, findings from this study have shown that X-ray refraction at the interface between the alginate strands and fibrin-filled pores can produce sufficient phase-contrast accentuating microstructural features of alginate implants, which are made of >97.5% water and invisible to X-ray absorption radiography.28,29 Due to the refractive index difference between alginate and fibrin, a very small X-ray phase shift, so called “interference fringes,” is produced at the interface between alginate strands and adjacent fibrin-filled pores. As the X-ray continues to travel in the free space behind the sample, the phase shift is developed and creates an image contrast at the detector.
It should be noted that for PCI-CT imaging there is a need for a sufficiently small detector pixel size to capture the X-ray intensity variation arising from X-ray refractive index variations at boundaries of structural features. In this study, the pixel size of 12.48 μm, which provides a significantly higher spatial resolution than clinical CT and MRI, 29 was 10 times smaller than the size of the implant structural features (e.g., ISD, strand thickness) on the order of 100 μm. Although a synchrotron X-ray detector with a smaller pixel size could be used for a higher image resolution, it requires a higher scan time and a smaller field of view, which will, consequently, increase the radiation dose and limit the imaging region of interest.
Our results have shown that the PCI performance at 25 and 30 keV is higher than that at 35 and 40 keV in terms of visibility and descriptive structural features of the implant (Fig. 6a–d). Although X-ray energies of 25 and 30 keV present similar PCI-CT performance, in consideration of a higher body penetration depth that is essential for in vivo experiments, the X-ray energy of 30 keV may be suitable for PCI-CT of the alginate implants. Despite a better visibility and descriptive structural phase contrast associated with X-ray energies of 25–35 keV compared with 40 keV (Fig. 6a–d), there is no statistically significant difference between PCI-based estimation values of strand thickness at different X-ray energies and the actual strand thickness of 250 μm. This indicates that higher X-ray energies, which provide higher tissue penetration depth, may be used for PCI-based estimation of the implant strand thickness. However, a combination of different factors, including dose, CNR and SSI, along with X-ray energy, should be taken into account for PCI-CT imaging.
Our graphical optimization approach (Fig. 7d–f) suggested that X-ray energy ranging between 30 and 33 keV and the CT-scan time between 1 and 1.2 h are likely the most suitable imaging parameters for low-dose (0.8–1.6 Gy) PCI-CT of the alginate implants. This range of absorbed dose agrees with the acceptable absorbed dose up to 5 Gy for in vivo imaging of small animal models.54,55
Through an ex vivo study, the potential of the low-dose PCI-CT was assessed for evaluating microstructural features, elastic modulus, and impedance of the alginate cardiac implants after 10 days of implantation. The PCI-CT measurement of porosity was smaller than the value estimated from Equations (1) and (2). This difference is most likely attributed to the implant swelling that occurred in situ after implantation. In fact, the measured ISD and R for the theoretical model were associated with the nonswollen implants after printing in calcium chloride. As presented in Table 2, ISD and R values in the theoretical model are higher and lower, respectively, than those measured by PCI-CT. The fact that the strand thickness (2R) and ISD are increased and decreased, respectively, due to the hydrogel swelling suggests that the porosity should decrease after implantation.
Also, the PCI-CT-based estimation of porosity was smaller than the predicted value from the statistical model (Table 2). This might be explained by the fact that the statistical model is based on the implant structural features measured under ideal conditions in PBS, whereas the hydrogel matrix can potentially undergo deformation during surgical procedures and in a dynamic environment at the implantation site in situ. However, in consideration of the PCI-CT measurement uncertainty (±18.4) for the porosity (Table 2), the overestimated values from the regression equation are not statistically significant (p-value >0.05). In contrast, the PCI-CT-based estimations of elastic modulus and impedance (at 1 Hz) have a reasonably good agreement with the corresponding in vitro measurements for the alginate construct (Table 2) incubated for 10 days at 37°C and 5% CO2.
In addition, the PCI-CT-based estimation variability of ±0.4 kPa and ±0.2 kΩ for the implant elastic modulus and impedance, respectively, is significantly lower than that of porosity (±18.4). Given these points, the synchrotron-based PCI-CT could potentially serve as a nondestructive tool for quantitative assessment of the structural and electrical/mechanical behavior of bioprinted hydrogel implants in situ. Future works will require to assess in vivo quantitative imaging performance of the PCI-CT.
Conclusion
The 3D-bioprinted alginate implants laden with HCAECs offered homogenous cell distribution and high cell viability over 7 days postprinting in vitro. The 3D-printing patterns presented statistically significant effects (p-value <0.05) on the compression modulus, porosity, and electrical conductivity of the alginate cardiac implants. Among the examined architectural designs, the 3D-printing pattern defined by ISD of 900 μm and SAA of 0/45/90/135° provided the highest compression modulus (∼35 kPa) and the highest electrical conductivity over 25 days of incubation, which was consistent with the elastic modulus of the altered cardiac matrix and adult rat myocardium reported in literature. The implant impedance decreased within the first 3 days of incubation, likely due to the hydrogel swelling, but the impedance increased over the next 22 days, regardless of the alginate printing pattern. The decrease and increase in the implant elastic modulus and impedance, respectively, over time could be related to polymeric chain loss associated with alginate matrix degradation, as clearly shown in SEM images. Through an ex vivo study, a low-dose synchrotron-based PCI-CT enabled us to assess the microstructural features, elastic modulus, and impedance of the implanted alginate constructs in situ.
The X-ray energy and CT-scan time ranging between 30–33 keV and 1–1.2 h, respectively, resulted in a low-dose (0.8–2 Gy) PCI-CT, which was consistent with the acceptable absorbed dose for in vivo imaging of small animal models reported in literature. The impedance (at 1 Hz), elastic modulus, and porosity of the implants were estimated from the PCI-CT images using statistical equations with respect to the visualized microstructural features after 10 days of implantation. The PCI-CT-based estimated values of the implant elastic modulus and impedance had a good agreement with in vitro measurements acquired after 10 days of incubation at 37°C.
Footnotes
Acknowledgments
The authors acknowledge the Canadian Institutes of Health Research (CIHR) for financial support. This research was supported in part by the College of Medicine at the University of Saskatchewan through the Post-Doctoral Fellowship Award (M.I.). The PCI-CT presented in this study was performed at the Canadian Light Source, which is supported by the National Sciences and Engineering Research Council (NSERC) of Canada, CIHR, the National Research Council Canada, the Province of Saskatchewan, Western Economic Diversification Canada, and the University of Saskatchewan. This research was partially funded by Saskatchewan Health Research Foundation/Heart and Stroke Foundation of Saskatchewan Clinical Stroke Research Chair (M.E.K.).
Disclosure Statement
No competing financial interests exist.