
Abstract
The lack of tools for assessing engineered tissue viability and function in a noninvasive manner is a major regulatory and translational challenge facing tissue engineers. Label-free, nonlinear optical molecular imaging (OMI) has utilized endogenous nicotinamide adenine dinucleotide and flavin adenine dinucleotide fluorescence to indicate metabolic activity. Similarly, second harmonic generation (SHG) signals from myosin and collagen can measure overall muscle structural integrity and function. The purpose of this study was to demonstrate these OMI techniques for the first time in engineered skeletal muscle and to develop a novel method for evaluating our engineered skeletal muscle units (SMUs) before implantation. Three experimental groups were studied: Control, Steroid Supplemented, and Metabolically Stressed SMUs. After imaging and analysis in ImageJ, a redox ratio (RR) metric was calculated to indicate metabolic activity, and a structure ratio metric was calculated to reflect structural composition. In addition, function was evaluated as tetanic force production in response to electrical stimulation. In living tissues, the RRs successfully distinguished control and metabolically stressed SMUs in both monolayer and 3D form. OMI of myosin and collagen SHG similarly differentiated control SMUs from the steroid supplemented group. With respect to function, steroid supplementation significantly increased active force generation. When comparing functional and OMI measures, a significant correlation was present between overall myosin density and active force generation. This work demonstrates the potential for using label-free OMI to evaluate tissue-engineered skeletal muscle constructs. The positive correlation between structural OMI measures and force production suggests that OMI could potentially serve as an accurate predictor of functional behaviors, such as integration and tissue regeneration, after implantation. This noninvasive OMI methodology, demonstrated for the first time in engineered skeletal muscle, could prove invaluable for assessing our tissue engineering technology and confirming release criteria for validation.
Introduction
T
To meet the need for a rigorous, quantitative methodology for evaluating engineered tissues in a nondestructive manner, multiphoton microscopy is a promising novel technology. In comparison to the gold standards of histology and immunohistochemistry (IHC), multiphoton microscopy presents several beneficial aspects.6,10 The combination of histology and IHC can provide spatial information about cells and matrix proteins in a quantitative manner that has been accepted by regulatory scientists, whereas multiphoton microscopy adds the ability to acquire the same information in living tissues in real time without irrevocably damaging the engineered tissue. 11 Multiphoton excitation microscopy is a form of nonlinear optical microscopy utilizing laser scanning in an extremely thin focal plane. It differs from conventional optical microscopy techniques, such as wide-field microscopy or confocal microscopy, by localizing sample excitation to the focal spot via multiple photons of approximately equal energy.9,12 As a result, excitation requires less energy, minimizing potential photodamage or photobleaching, and it typically utilizes longer wavelengths in the infrared range. Less scattering of infrared excitation occurs in tissues, making multiphoton excitation microscopy advantageous as a means of imaging in thicker tissues. Using such a technology, imaging up to 500 μm into a sample with spatial resolution on the order of 1 μm becomes possible, 9 importantly without the need for labeling reagents.
Optical molecular imaging (OMI) techniques utilizing multiphoton microscopy have been demonstrated in native skeletal muscle9,13,14 and in select engineered tissues,10,12,15–17 but they have not been applied to engineered musculoskeletal tissues. In particular, the following OMI approaches have been identified: (i) excitation of endogenous nicotinamide adenine dinucleotide (NADH) and flavin adenine dinucleotide (FAD) fluorescence to evaluate metabolic activity, (ii) second harmonic generation (SHG) imaging of myosin in skeletal muscle sarcomeres and of collagen in extracellular matrix to assess structural composition, and (iii) quantitative evaluation of tissue morphology based on the spatial distribution of cells and proteins targeted by the previous two techniques. We sought to demonstrate the applicability of such OMI approaches to noninvasively evaluate the structure and metabolic activity in our engineered skeletal muscle.
For studying metabolic activity, multiphoton excitation fluorescence targeting NADH and FAD was monitored. These two mitochondrial coenzymes are necessary for cell metabolism and oxygen consumption and can act as endogenous cellular fluorophores. The reduced and oxidized states of these coenzymes naturally fluoresce in response to multiphoton excitation.9–11,18 Captured images of intracellular concentrations of NADH and FAD in engineered tissues can be used to characterize cell size, morphology, and organization.19–21 In addition, NADH and FAD signals can be used to calculate a redox ratio (RR) metric, calculated as [FAD]/[NADH] + [FAD], 10 as an indication of metabolic activity. Intensity ratios such as the RR metric measure metabolic variations with increased sensitivity by reducing intensity-based artifacts, including signal variations due to optical loss, which may be difficult to quantify or control in tissues. Previous work with engineered oral mucosa fabricated from primary human cells demonstrated the ability of this OMI method to detect significantly different RR values in metabolically stressed constructs as compared with controls. 10
Similar nonlinear OMI and quantitative analytic methods were applied in this study to noninvasively assess the viability of engineered skeletal muscle constructs. In both our previous and current studies, label-free OMI of local tissue structure and biochemistry characterized morphologic and functional differences between controls and metabolically stressed constructs. Unlike traditional histological and functional tissue analyses, label-free OMI has the advantage of being noninvasive.
To study structural composition at a molecular level, SHG is a useful tool. SHG is a nonlinear optical technique collecting light from nonlinear scattering processes. SHG depends on the interaction of light with highly polarizable, no centrosymmetric structures.9,14 Myosin in skeletal muscle sarcomeres and collagen in ECM are two of the few biomolecular structures that are capable of generating an SHG signal.9,12,14,22 Myosin is a filamentous protein with a coiled rod region and a cross-head region that is responsible for interaction with actin filaments. 13 The SHG signal arises from the coiled rod region, specifically, due to the noncentrosymmetric structure of this domain. Several researchers have used myosin SHG to examine native skeletal muscle, extracting measures of sarcomeric spacing correlated to contractile function.13,23–25 In one such study, muscle biopsies from healthy patients and those with Pompe disease were analyzed by myosin SHG. 23 Pompe disease is characterized by enlarged, glycogen-filled lysosomes and autophagic debris in muscle fibers, resulting in widespread sarcomere disruption. After acquiring myosin SHG images, subsequent processing of sarcomeric spacing and alignment data were used to generate a score indicating the condition of the muscle. These values were then used to distinguish between healthy and diseased patients, providing a potential tool for assessing muscle health. Similarly, collagen SHG has been used to image the triple helical fibrillar collagen structure in a range of tissues. 22 The SHG signal is sensitive to the fiber structural organization and especially to changes due to disorders such as fibrosis and connective tissue disorders. In engineered tissues specifically, it has been utilized to assess structural organization of engineered heart valves and oral mucosa, detecting the difference in collagen deposition by cells cultured under normal and supraphysiological conditions.10,26,27
Although these studies demonstrate the efficacy of the OMI techniques proposed, to date most have collected data from fixed samples, not living tissues. Further, the majority of published data examines native tissues, not engineered tissues.9,10,13,23,24 Thus, there exists a lack of knowledge about label-free, nonlinear OMI in engineered tissues. In this study, we combine these two complementary OMI methods to obtain RR values that are indicative of metabolic activity and SHG of structural organization as measures of the overall integrity of our tissue-engineered skeletal muscle units (SMUs). Thus, our goal was to use known protocols to alter the structural integrity and metabolic activity within our engineered tissues and to determine whether these perturbations could be monitored by using OMI. In addition, we investigated the applicability to engineered skeletal muscle tissue of the reliable method previously demonstrated in our work 10 for nondestructive and quantitative evaluation and characterization. Such optical measures could serve as reliable release criteria for cell-based tissue-engineered constructs before human implantation, thereby addressing a critical regulatory need in regenerative medicine.
Materials and Methods
Animal care
All animal care procedures followed The Guide for Care and Use of Laboratory Animals, 28 according to a protocol approved by the University Committee for the Use and Care of Animals. All tissues were harvested from female Fischer 344 rats, and all SMUs were engineered by using cells isolated from soleus muscles and bone marrow from the same animals. Animals were acclimated to colony conditions for 1 week before any procedure and were fed Purina Rodent Chow 5001 and water ad libitum. Intraperitoneal injections of sodium pentobarbital (65 mg/kg, NADA No. 119-807; Merck Animal Health, Madison, NJ) were used to induce a deep plane of anesthesia. Supplemental pentobarbital doses were administered as required to maintain adequate anesthesia depth.
Muscle dissection and cell isolation
Both soleus muscles were removed under aseptic conditions and sterilized in 70% ethanol. The muscles were minced by using a razor blade, placed under ultraviolet light for 15 min in 15 mL of Ham's F12 (Cat. No. 11765-047; Gibco BRL, Carlsbad, CA), and added to a dissociation solution of 32 U dispase (1.8 U/mg, Cat. No. 17105-04; Gibco) and 2390 U type IV collagenase (239 U/mg, Cat. No. 17104-019; Gibco) in 20 mL of Ham's F12. The mixture was maintained at 37°C with agitation for 90 min. The resulting suspension was then filtered with a 40 μm mesh filter (Cat. No. 22363549; Fisher Scientific, Waltham, MA) before centrifugation. The dissociation solution was finally aspirated, and the cells were resuspended in growth medium for seeding.
SMU formation
SMUs were engineered by using cells isolated from Fischer 344 rats as described in previous work from our laboratory.29,30 In this study, three variations of this established SMU fabrication protocol were used. The first group (Control) contained SMUs fed every 48 h as per our published protocol, 29 before studying the addition of dexamethasone. The second group (Metabolic Stress) had its metabolic activity altered through feeding every 72 h. The third group (Steroid Supplement) of SMUs were fed every 48 h and supplemented with dexamethasone to generate improved myogenesis and structural advancement. 30 Each group contained n = 9 engineered tissues. Isolated cells were divided evenly between experimental groups, allowing all three to begin with cells that were essentially equivalent.
To accommodate the constraints of the microscope, custom 60 mm polystyrene dishes were used for SMU fabrication. After curing polydimethylsiloxane (PDMS, Cat. No. 4019862; Dow Chemical Corp., Midland, MI) onto each plate, the substrate was removed and punched with a 46 mm punch (Cat No. 3418A46; McMaster-Carr, Elmhurst, IL). This central portion of this layer of PDMS was then replaced in the polystyrene dish, coated with laminin at 1 mg/cm2, and used for seeding. After initial plating, cells were left unaltered for 4 days to allow attachment and were subsequently fed muscle growth medium 29 as per the feeding schedule for each experimental group until becoming fully confluent on day 7 with a network of elongating myotubes. At this point, 5 mm tissue-engineered bone-tendon anchors were pinned onto the cell monolayers at a spacing of 2.5 cm, and the media were switched to muscle differentiation medium (MDM). 29 After a week on MDM, the monolayers delaminated from the plates on day 14, rolling into cylindrical muscle constructs, held at length by the engineered bone anchors.
Evaluation of SMU contractile properties
To evaluate force production,29–31 one end of the SMU was attached to a force transducer with a 0–5 mN range and a 0.4 μN resolution (Cat. No. SI-KG7A; World Precision Instruments, Sarasota, FL), and platinum wire electrodes were placed along either side of the SMU for field stimulation. Passive tension was measured before stimulation. Peak tetanic force was determined after subtracting the passive tension baseline in response to a 1 s train of 5 ms pulses at 90 mA and 60 Hz, and data files for force traces were recorded and analyzed by using LabVIEW 2013 (National Instruments, Austin, TX).
Nonlinear OMI
OMI was performed on a Leica TCS SP5 microscope that was equipped with an ultrafast-pulsed Ti:sapphire laser (Cat. No. “Mai-Tai”; Spectra-Physics, Mountain View, CA). The excitation laser source and emitted light were coupled through an inverted microscope with a 25 × water immersion objective lens (0.95 numerical aperture (NA), 2.5 mm working distance) to image developing muscle monolayers and 3D SMUs. Before measurement on the inverted microscope, the PDMS substrate and monolayers were flipped over onto custom measurement dishes with the polystyrene bottom removed and replaced with a coverslip. All images were collected in a controlled environment at 37°C with 5% CO2 to mimic normal tissue culture conditions. Before each measurement, the excitation power at the specimen surface plane at both excitation wavelengths with a 10 × objective was calibrated at 20 mW for cell monolayers and 30 mW for 3D SMUs to limit photobleaching and nonreversible changes in the sample.9,32 All imaging was thus performed at incident power levels below 30 mW, since such excitation has proved nondamaging after thousands of scans. 32 Further, the ability of the engineered tissue to assume 3D form and produce contractile force comparable to historical values29,30 suggests that OMI analysis did not adversely affect tissue health or function.
These monolayers were analyzed on day 11 of the fabrication protocol. Because this procedure is sterile and noninvasive, the same monolayers were evaluated again on day 16 after 3D formation and contractile properties measurement. Three-dimensional SMUs were transferred onto similar measurement dishes with a coverslip bottom and the addition of stainless steel pins to constrain the engineered tissue.
For imaging of NADH and FAD molecules, two-photon excitation at 715 and 900 nm was used, respectively. Backscattered fluorescence for NADH and FAD was filtered through a band pass (440–490 nm for NADH and 500–550 nm for FAD) before collection with nondescanned photomultiplier tubes (PMT) to increase collection efficiency. High-resolution images (1024 × 1024 pixels) were collected at a 200 Hz line-scanning rate, with a line average of eight to reduce noise. This line average value indicates that each line of pixels is scanned eight times, with the resulting intensities combined and displayed as an average. The PMT gain was maintained at its maximum to keep measurements consistent between images and samples.
For SHG imaging, 860 nm excitation was used to generate a myosin SHG signal.13,14 To isolate this SHG signal, a 425–435 nm filter was placed in front of the PMT. For the collagen SHG signal, 900 nm excitation and a 395–405 nm filter were used.13,14 Since SHG is a scattering process, its intensity is highly dependent on direction. In relatively thicker samples, such as the 3D SMU, back-scattered myosin and collagen SHG signals dominate, and a PMT on the same side of the sample as the excitation was employed. For the thinner monolayers, forward-scattered SHG signals were captured with a PMT on the opposite side of the sample from the excitation. As with metabolic activity imaging, high-resolution images (1024 × 1024 pixels) were collected at a 200 Hz line-scanning rate with a line average of eight to reduce noise. The PMT gain was set at maximum for every measurement.
From each sample, ni = 6 images were captured by sequentially scanning for myosin SHG, collagen SHG, FAD, and NADH. These sample sizes were chosen based on previous work using OMI to detect differences in control and stressed engineered oral mucosa. 10
RR calculation
Analysis of metabolic activity was based on a technique previously developed by Chen et al. 10 The raw fluorescence images of NADH and FAD were inputs into ImageJ software (Fig. 1). The collagen SHG signal was also incorporated into this analysis. These three images were then processed with a 3 × 3 median filter to increase image contrast. A threshold value, set as the average fluorescence intensity signal from the whole image, created a binary mask to reduce background fluorescence signals. This binary mask filtered each raw NADH and FAD fluorescence image. In the collagen SHG image, pixels having intensity greater than the average SHG signals from the whole image were subsequently subtracted from the corresponding NADH and FAD fluorescence images. After removal of background noise and collagen signals, the processed NADH and FAD images were then used to derive an RR at each image pixel as [FAD]/([NADH] + [FAD]). Ultimately, the average RR across the entire image was used to quantify local intracellular metabolic activity, providing a quantitative parameter with minimized background artifacts.33–36
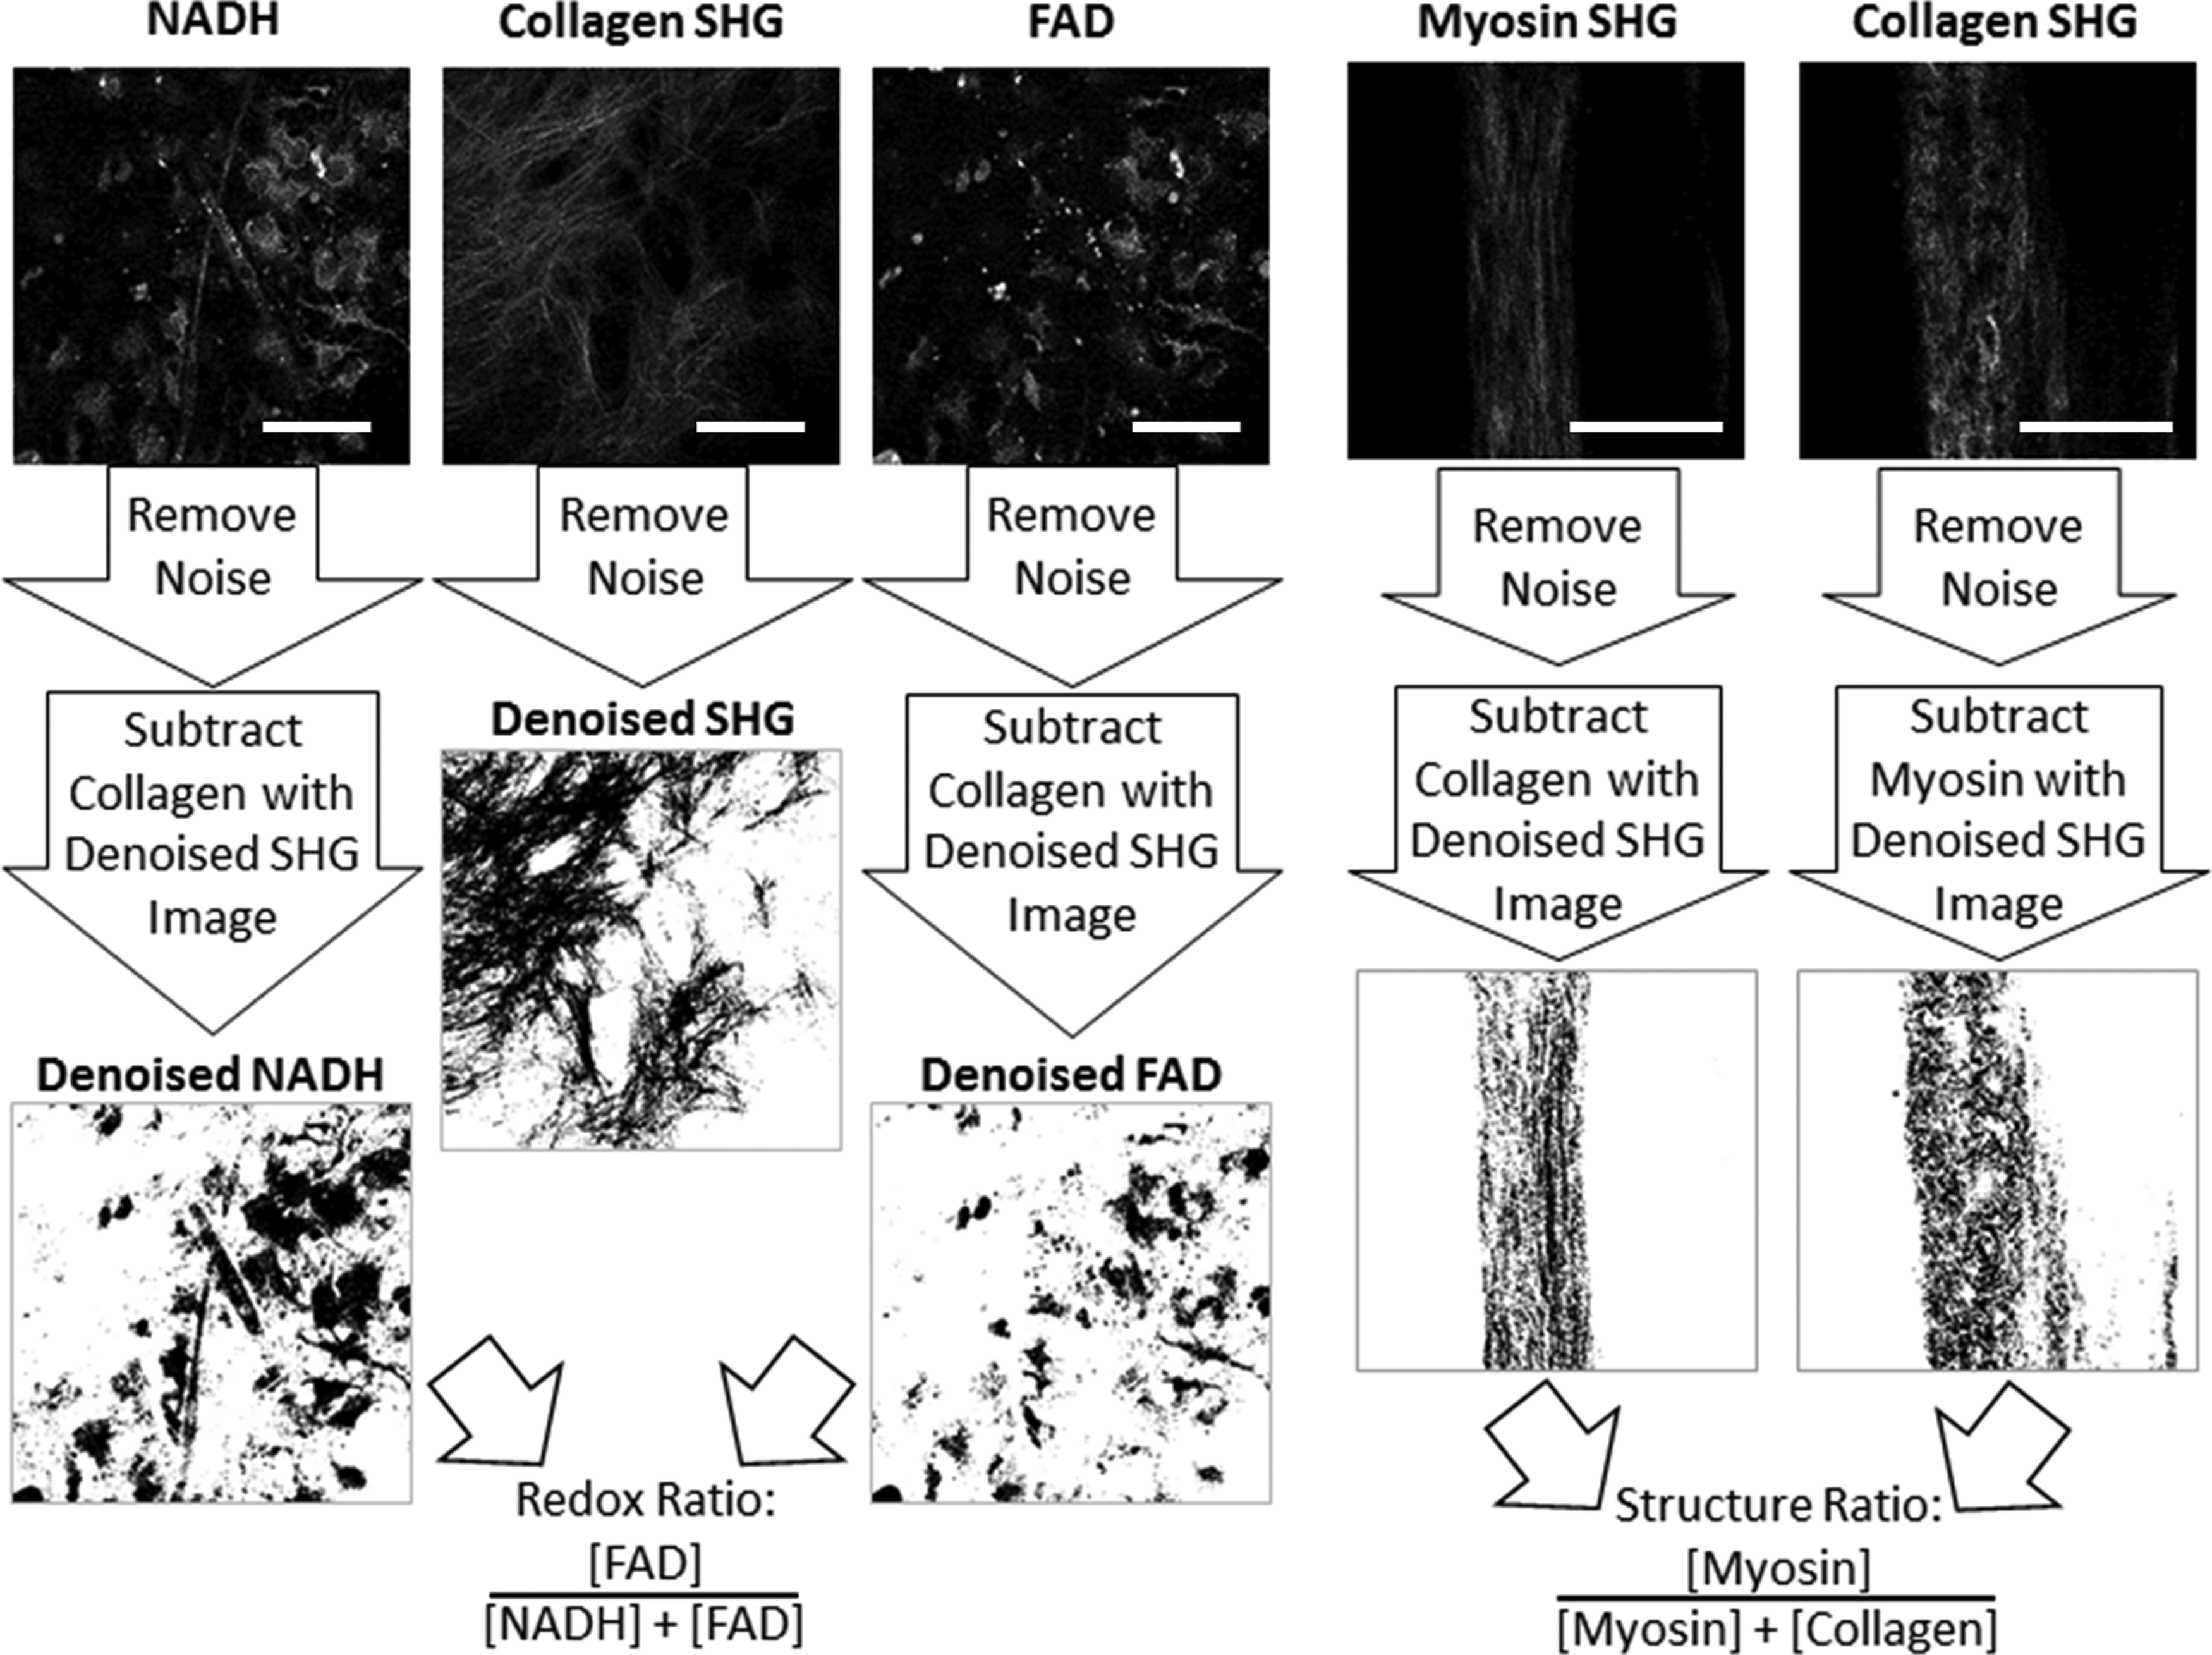
OMI processing schematic. Raw images were analyzed in ImageJ. Preprocessing involved noise reduction with a 3 × 3 median filter and subtraction of background fluorescence signals. For the metabolic indicators, NADH and FAD, the collagen SHG signal was subtracted to remove collagen regions (scale bar = 50 μm). For structural indicators, myosin and collagen, each SHG signal was subtracted from the other to remove overlapping regions (scale bar = 200 μm). FAD, flavin adenine dinucleotide; NADH, nicotinamide adenine dinucleotide; OMI, optical molecular imaging; SHG, second harmonic generation.
Structure ratio calculation
Myosin and collagen SHG signals were analyzed to obtain a structure ratio (SR) metric indicative of engineered tissue structural composition (Fig. 1). Each pair of images was first processed with a 3 × 3 median filter in ImageJ to increase image contrast. A binary mask, based on a threshold at the average image intensity, was used to reduce background. Next, pixels having an intensity greater than the average collagen SHG signal from the whole image were subsequently subtracted from the corresponding myosin SHG imaging, and vice versa. After removing noise and overlapping SHG signals, an average SR was calculated for each image as [Myosin]/([Myosin] + [Collagen]).
Immunocytochemical and immunohistochemical analysis
To validate the NADH signal, MitoTracker® (Cat. No. M-7512; Fisher), an exogenous fluorescence dye that only fluoresces within mitochondria, was used to stain developing muscle monolayers. A 50 nM MitoTracker solution was added to MDM on day 11 of SMU fabrication and incubated for 30 min. Fresh medium was then resupplied, and samples were imaged for colocalized fluorescence from both MitoTracker and NADH as previously described. 10 In addition, media containing a metabolic inhibitor, 4 mM potassium cyanide (KCN, Cat. No. 60178; Sigma), or an uncoupler, 0.5 mM carbonilcyanide p-trifluoromethoxyphenylhydrazone (FCCP, Cat. No. C2920; Sigma), were employed to vary cellular metabolism during imaging. Variations in both NADH and FAD signals were monitored for 10 min, and KCN or FCCP was administered immediately after acquiring the first image.
To confirm the accuracy of myosin and collagen SHG signals, after force testing and OMI evaluation, 3D SMUs were fixed in −20°C methanol for 10 min and set aside for IHC. Samples were washed for 10 min in 0.1% Triton X-100 in Dulbecco's phosphate-buffered saline (DPBS) (PBST, Cat. No. T8787; Sigma) and blocked with PBST containing 3% bovine serum albumin (PBST-S, Cat. No. A2153; Sigma) at room temperature. Samples were then incubated overnight at 4°C with primary antibodies diluted in PBST-S. Immunofluorescent staining was performed by using the following primary antibodies: mouse anti-myosin heavy chain (1:100 dilution, Cat. No. MF20; DSHB) and rabbit anti-collagen I (1:200 dilution, Cat. No. orb312178; Biorbyt, San Francisco, CA). After three PBST washes for 5 min each, samples were incubated in a 1:500 dilution of Alexa Fluor secondary antibodies (Life Technologies) for 3 h at room temperature. After three washes in PBST for 15 min each, samples were preserved in Prolong Gold with 4′,6-diamidino-2-phenylindole (DAPI, Cat. No. P36935; Life Technologies) and cover slipped. Samples were then examined for co-localization of the antibody fluorescence and SHG signals.
Statistical analysis
All values are presented as mean ± standard error. Measurements of significant differences between means were performed by using GraphPad software. Means were compared by using either a Student's t-test or one-way ANOVA with Tukey post hoc comparisons. Correlation between experimentally measured OMI metrics and contractile force values was assessed based on the Pearson correlation coefficient, r. Differences were considered significant at p < 0.05.
Results
Metabolic activity in muscle monolayers and 3D SMUs
The multiphoton fluorescence signal for NADH was validated by using cells labeled with MitoTracker. Colocalization of the NADH and MitoTracker signals confirmed the presence of NADH in cell mitochondria as expected (Fig. 2). Treatment with the metabolic inhibitor, KCN, and the metabolic uncoupler, FCCP, also produced the expected variations in NADH and FAD (Fig. 2). Specifically, KCN inhibits complex IV of the electron transport chain, increasing NADH and decreasing FAD concentrations. After KCN addition, the normalized NADH intensity for treated cells increased ∼3-fold over the 10 min of observation, whereas the FAD intensity decreased by half. On the other hand, FCCP uncouples electron transport and drives the metabolic pathway to oxidation, decreasing NADH and increasing FAD concentrations. In living cells, an initial increase in FAD intensity was observed 2 min after FCCP treatment, before values returned to baseline levels. The normalized NADH intensity decreased ∼4-fold in response to addition of FCCP.
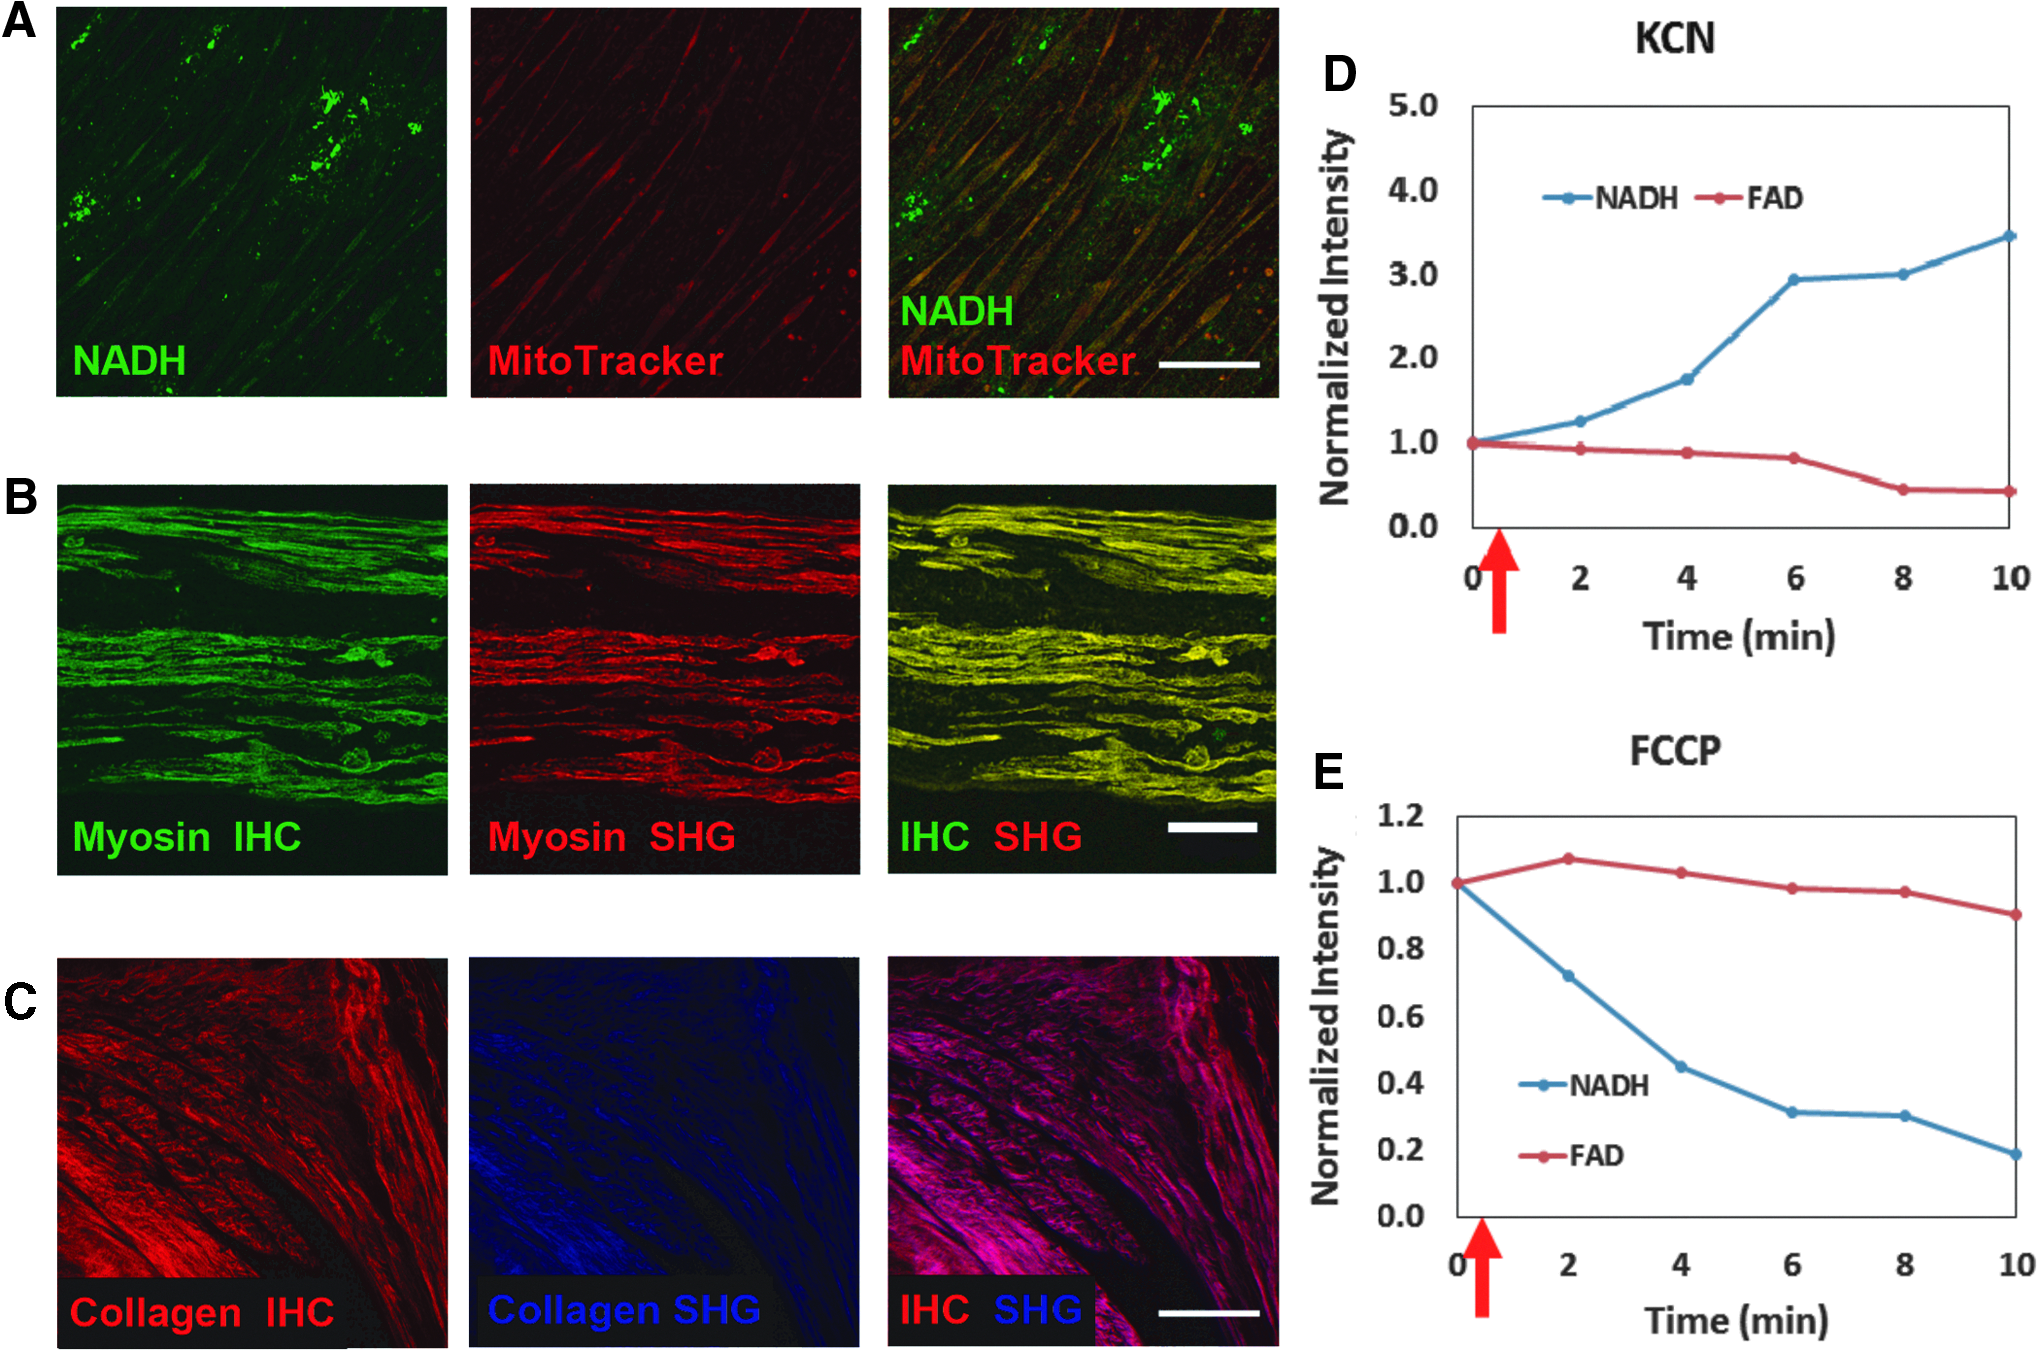
OMI signal validation.
After confirming the sensitivity of the NADH and FAD signals to variations in metabolic activity, images from the control and metabolically stressed tissues were analyzed to obtain RR values. As previously mentioned, the RR, defined as [FAD]/([NADH] + [FAD]), 10 is a quantitative metric to compare relative metabolic rates of measured samples. Because a lower RR indicates a higher cellular metabolic rate, with relatively lower FAD fluorescence and higher NADH fluorescence, values in this study are presented as the inverse RR. As a result, higher inverse RR values indicate greater metabolic activity.
This inverse RR metric was used to assess cell metabolism in engineered skeletal muscle monolayers and in 3D SMUs. Representative raw fluorescence images from which RR metrics were extracted are shown in Figure 3. In monolayer form, control plates (n = 9 plates, ni = 6 images/plate) exhibited significantly greater (p = 0.02) inverse RR values (0.66 ± 0.04) than metabolically stressed cells (0.55 ± 0.03). For reference, the average FAD value used in the RR calculation was 3.1 ± 0.52 in controls in comparison to 2.4 ± 0.64 in metabolically stressed plates (p = 0.37). The average NADH intensity of 6.4 ± 1.6 in control monolayers was significantly greater than 2.8 ± 0.65 with metabolic stress (p = 0.043). Similarly, after formation of a 3D SMU, images of control tissues (n = 9 SMUs, ni = 6 images/SMU) yielded average inverse RR values of 0.46 ± 0.02, which were significantly greater than 0.40 ± 0.02 in the metabolic stress group (p = 0.04). In control SMUs, the average FAD intensity was 6.5 ± 1.0, not significantly different from the value of 8.2 ± 1.5 in the metabolic stress group (p = 0.33). The average NADH intensity was 5.7 ± 1.1 in control SMUs, and this value was not significantly different from the metabolic stress value of 6.1 ± 1.6 (p = 0.82). When comparing all values for metabolic activity by imaging time point, a significant decrease (p < 0.01) in inverse RR value was observed in 3D SMUs (0.46 ± 0.02) relative to the cells in monolayer (0.62 ± 0.08).
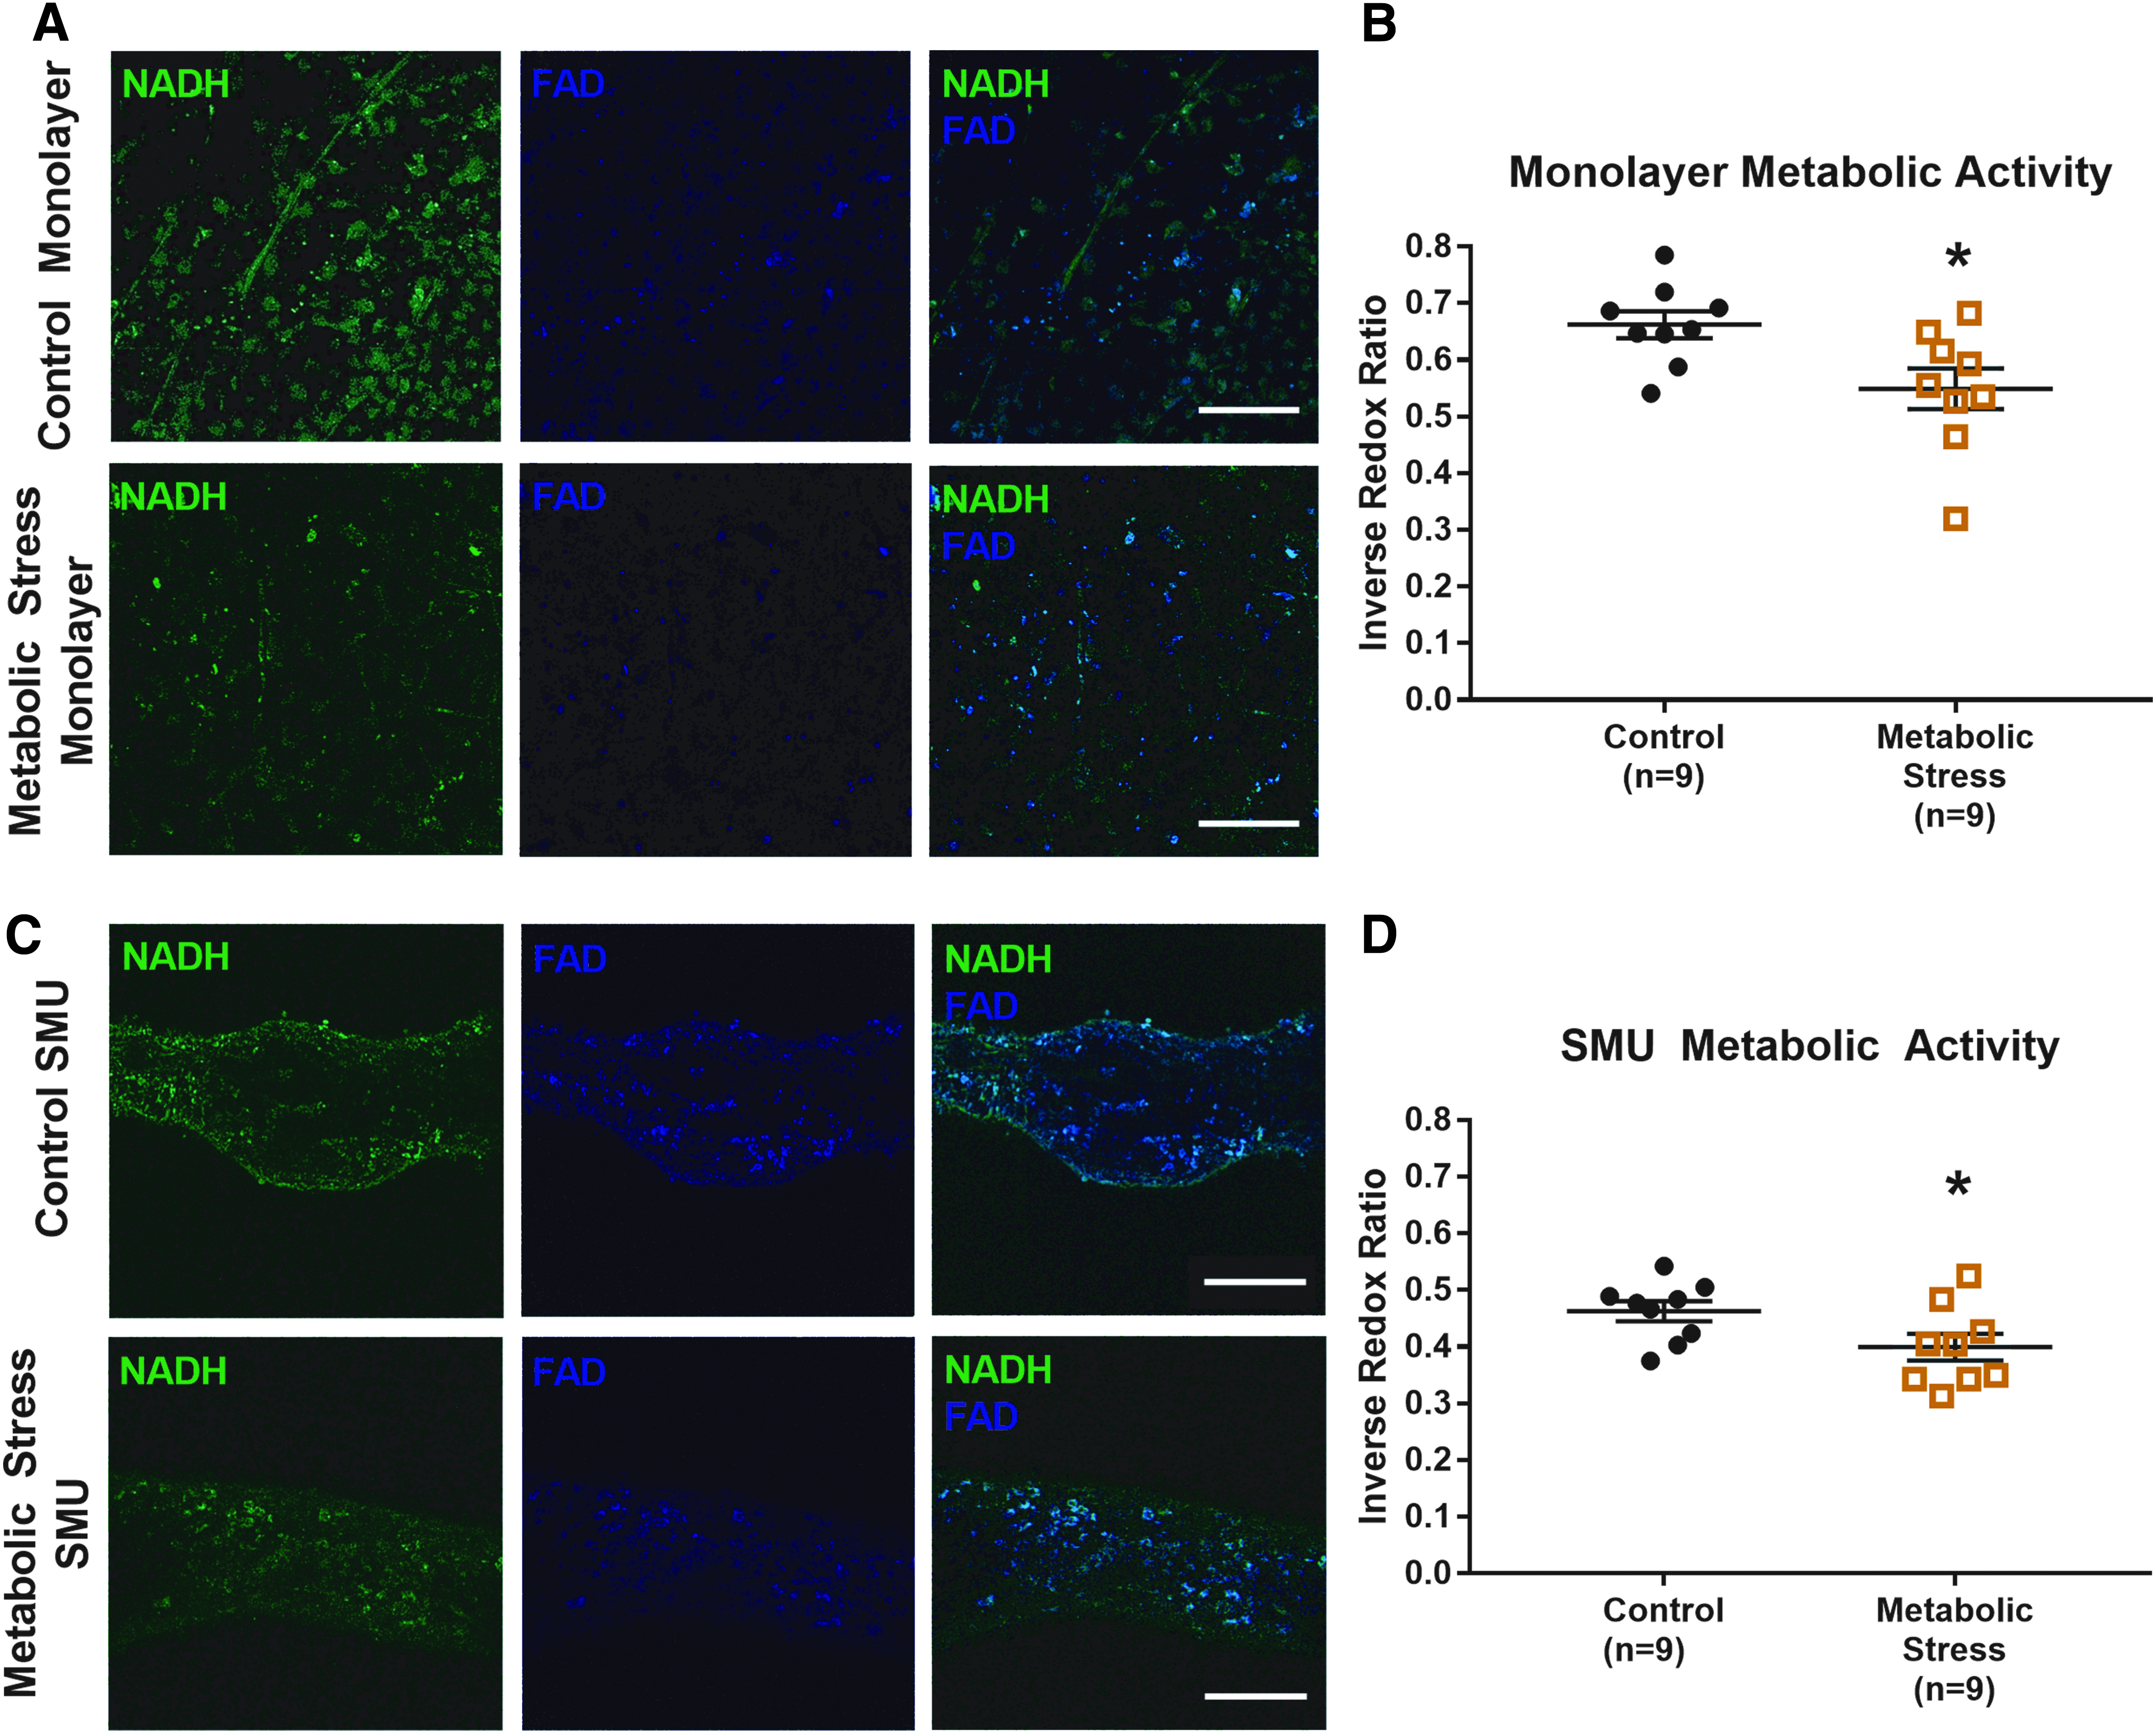
Endogenous NADH and FAD fluorescence as indicators of metabolic activity. NADH and FAD are mitochondrial coenzymes that function in cell metabolism and oxygen consumption. NADH fluorescence was excited at 715 nm, and emitted light was filtered in a band from 400 to 475 nm. FAD fluorescence was excited at 900 nm and was captured from 500 to 600 nm. Representative images of these signals are shown above for engineered tissues
Structural organization in monolayers and 3D SMUs
As with the metabolic fluorescence signals, engineered tissues were simultaneously analyzed with both OMI and IHC to validate the source of the myosin and collagen SHG signals. After cryosectioning and staining with fluorescent antibodies for either myosin heavy chain or collagen type I, samples of 3D SMUs were imaged and examined for co-localization of the SHG signal with the antibody fluorescence (Fig. 2).
Further, the myosin SHG signal in fixed samples of native and engineered skeletal muscle was examined for the presence of advanced sarcomeric organization. Without any exogenous labeling reagent, both native and engineered myofibers exhibited a dense network of parallel sarcomeres (Fig. 4A, B). The average sarcomere length measured in these images (2.5 ± 0.4 μm in native, 2.6 ± 0.2 μm in engineered SMUs) matched the historical range from 2.4 to 2.9 μm. In addition, in living engineered SMUs, sarcomeric organization was evident during collection of the myosin SHG signal (Fig. 4C).
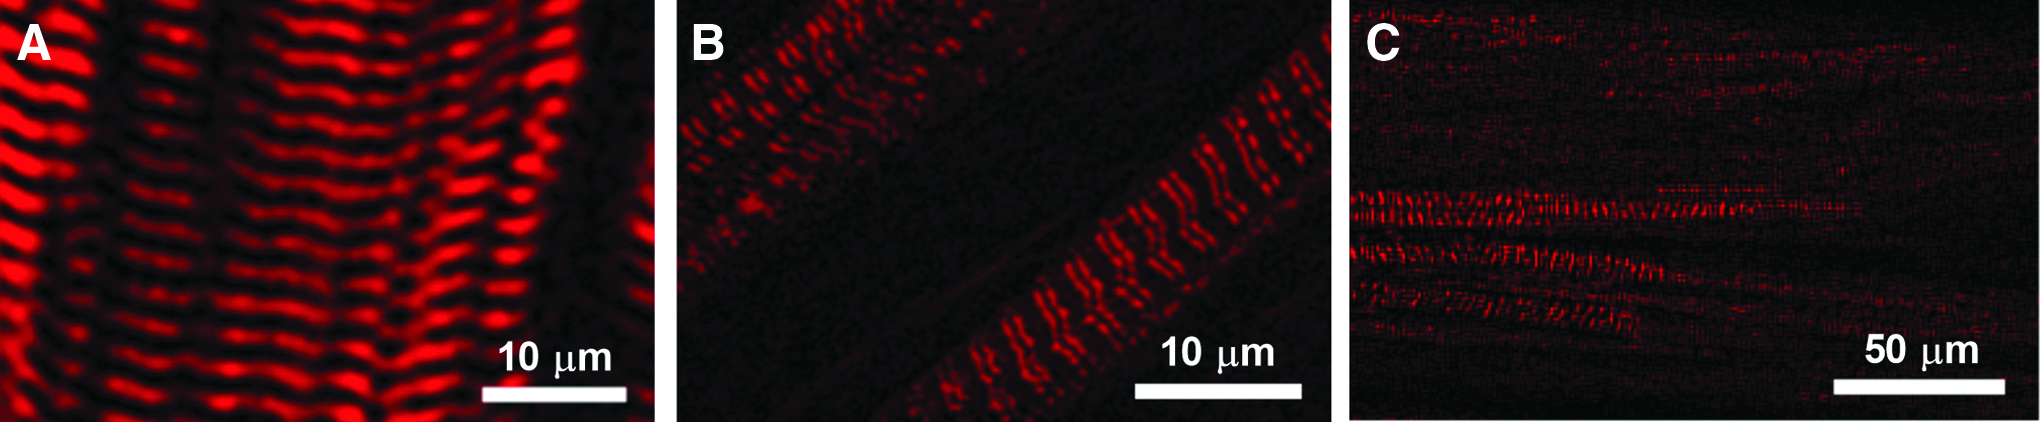
Myosin SHG in native and engineered skeletal muscle. Light scattered from myosin filaments was captured from fixed samples of
After confirming the accuracy of the myosin and collagen SHG signals, images from the control and steroid supplemented tissues were analyzed to obtain SR values modeled after the RR metric in the previous section. The SR was defined as [Myosin]/([Myosin] + [Collagen]) to create a quantitative metric for comparing the relative structural composition of these two key proteins. Representative raw images of the myosin and collagen SHG signals are shown in Figure 5. From these images, SR values were calculated and used to compare experimental groups.
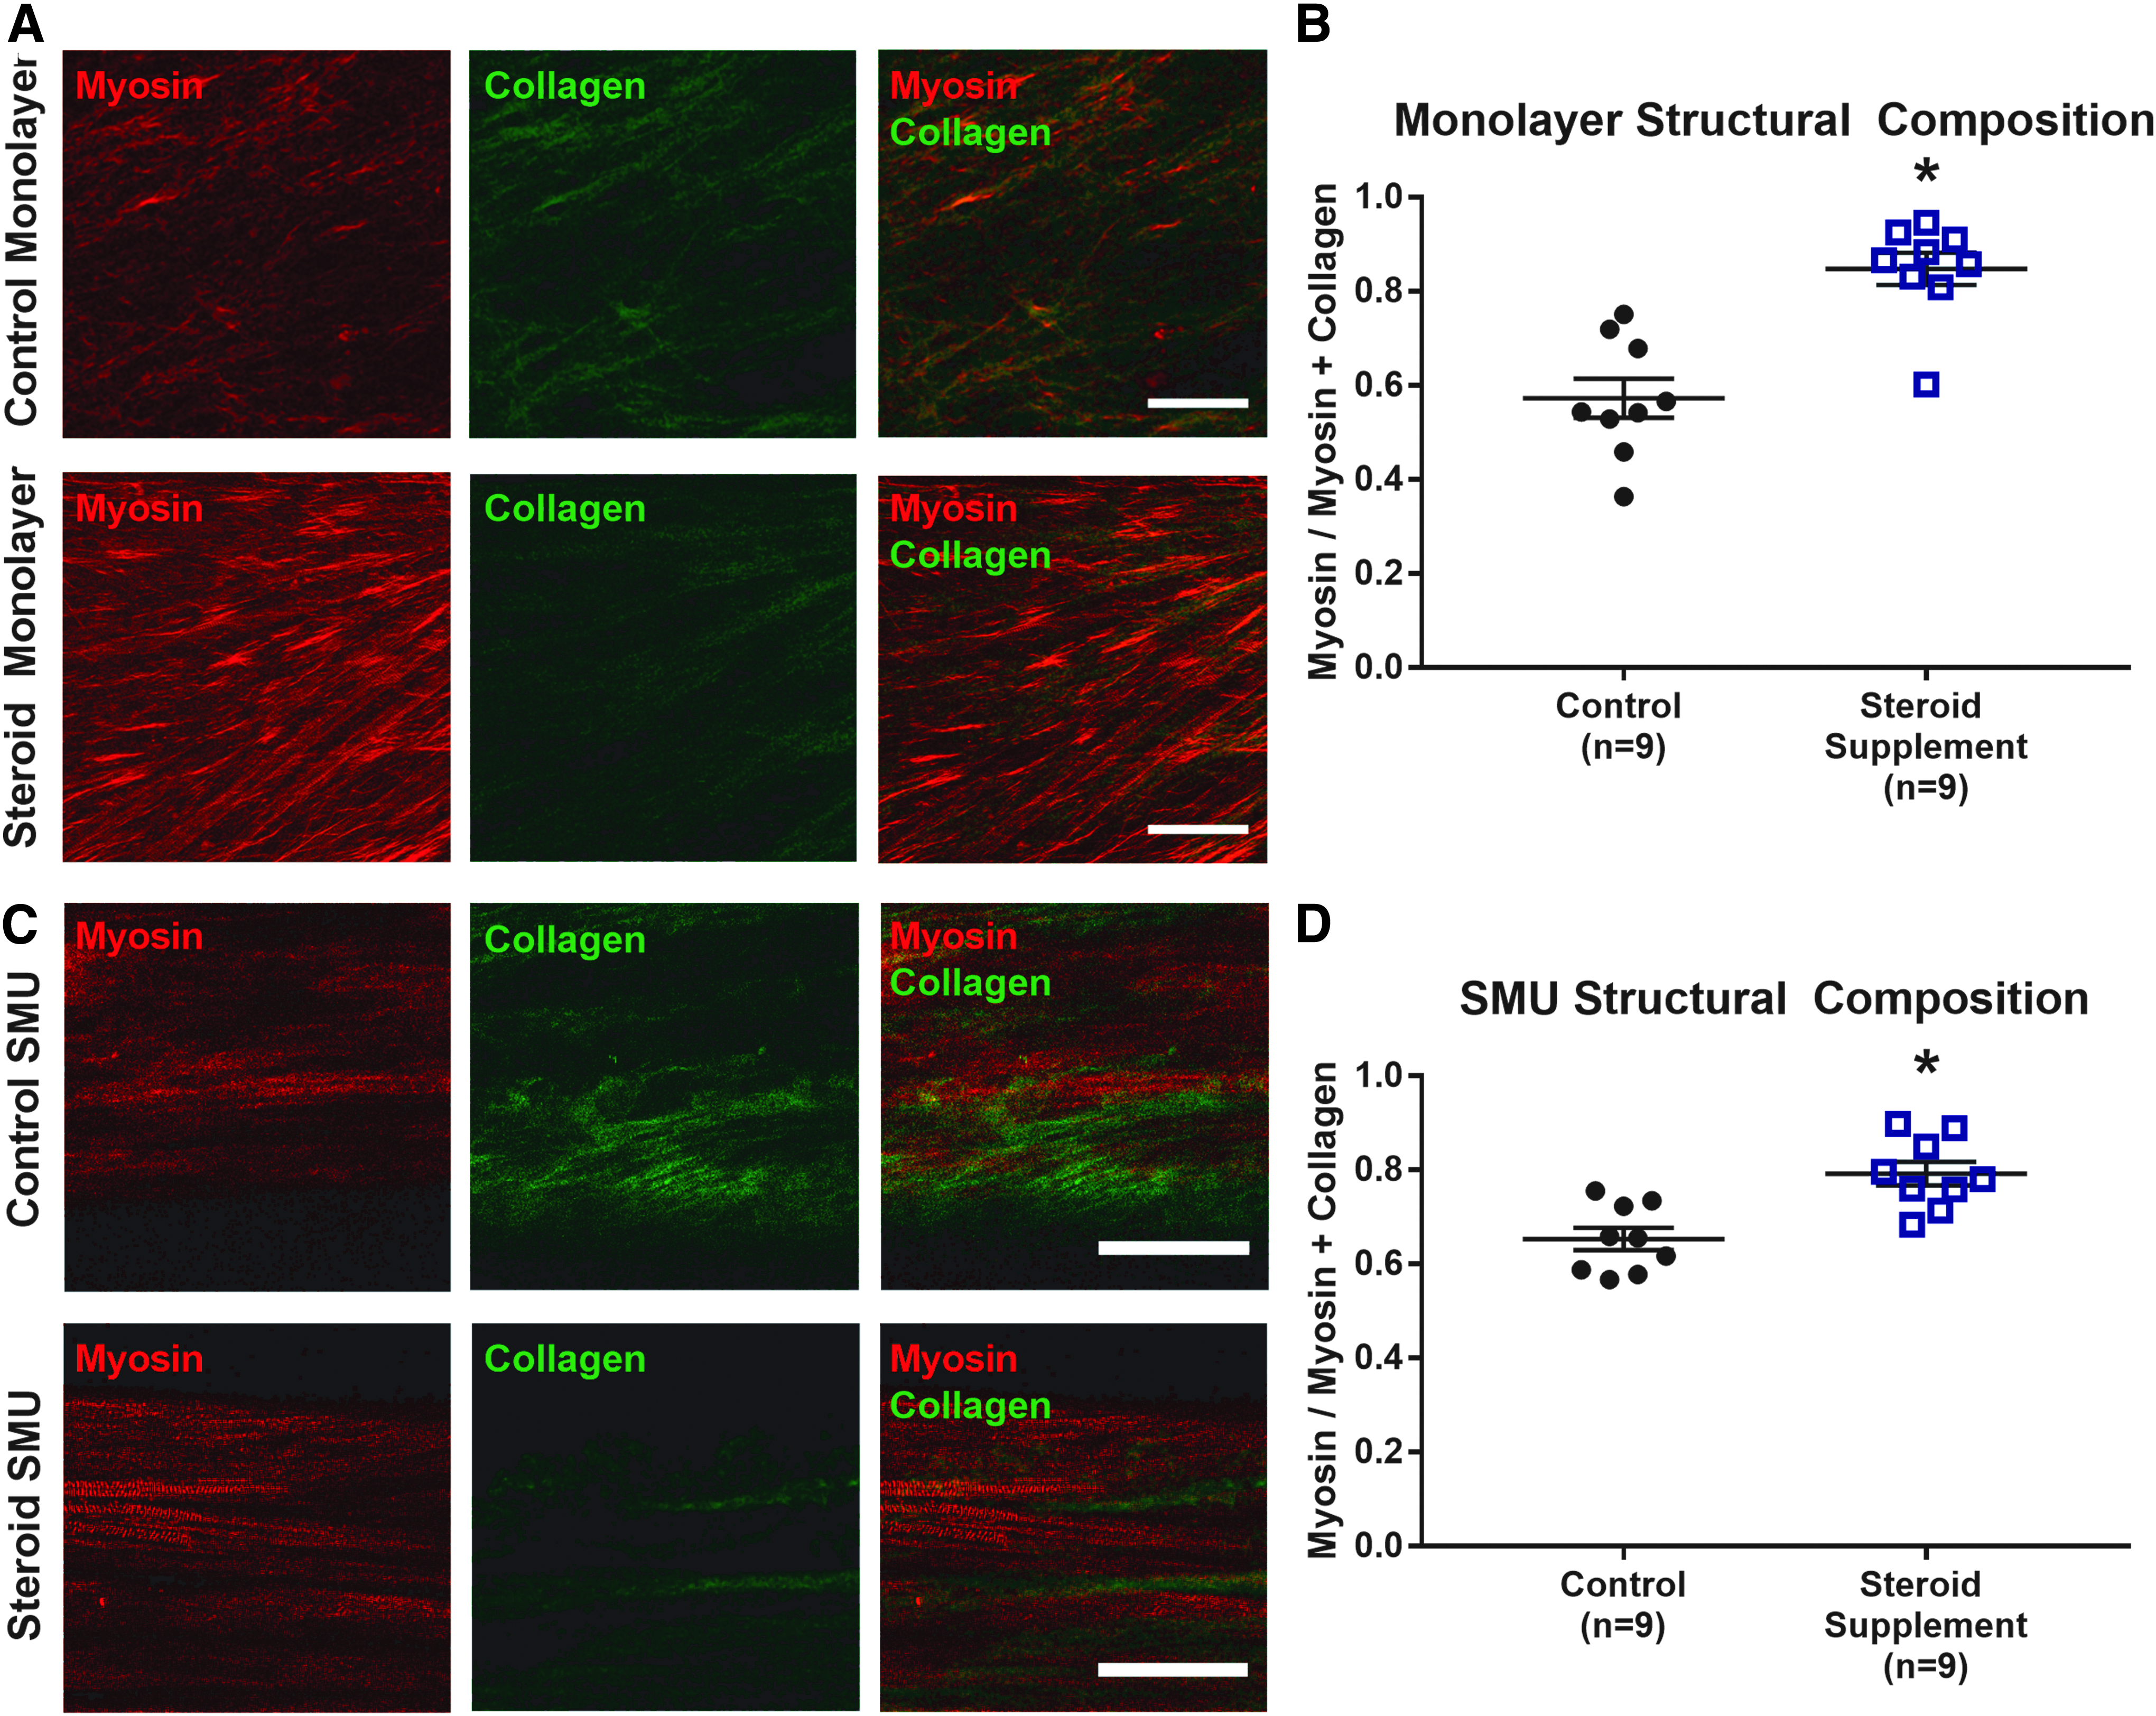
Myosin and collagen SHG as indicators of structural organization. SHG signals from myosin and collagen were collected in response to excitation at 860 and 920 nm, respectively. Due to the nature of SHG, scattered light was captured at half the excitation wavelength, 425–435 nm for myosin and 455–465 nm for collagen. Representative images of the two are pictured in
Steroid supplemented monolayers (n = 9 plates, ni = 6 images/plate) yielded significantly greater (p < 0.01) SR values (0.85 ± 0.03) than control plates (0.57 ± 0.04). In 3D SMU form, steroid supplemented tissues (n = 9 SMUs, ni = 6 images/SMU) exhibited average inverse SR values of 0.79 ± 0.02, which were significantly greater (p < 0.01) than the average of 0.65 ± 0.03 in controls. When comparing structural composition values by imaging time point, no significant difference (p = 0.70) in SR value was observed between monolayers (0.65 ± 0.03) and 3D SMUs (0.67 ± 0.02).
Contractile properties of 3D SMUs
The overall function of engineered SMUs was assessed by measuring passive tension and contractile force production on day 15, after monolayer delamination and capture in 3D form. As shown in Figure 6, no significant differences in passive force generation were observed among the three groups. Control SMUs (n = 9) exhibited average passive tensions of 2370 ± 785 μN, slightly higher (p = 0.208) than the average tension of 1260 ± 333 μN in steroid supplemented SMUs, and slightly lower (p = 0.554) than the average tension of 2970 ± 591 μN in metabolically stressed SMUs. The peak isometric tetanic force generated in response to electrical stimulation was also similar in control SMUs (67 ± 22 μN) and metabolically stressed SMUs (45 ± 12 μN, p = 0.391). SMUs in the steroid supplemented group exhibited active forces of 287 ± 82 μN, significantly greater than control forces (p = 0.028).
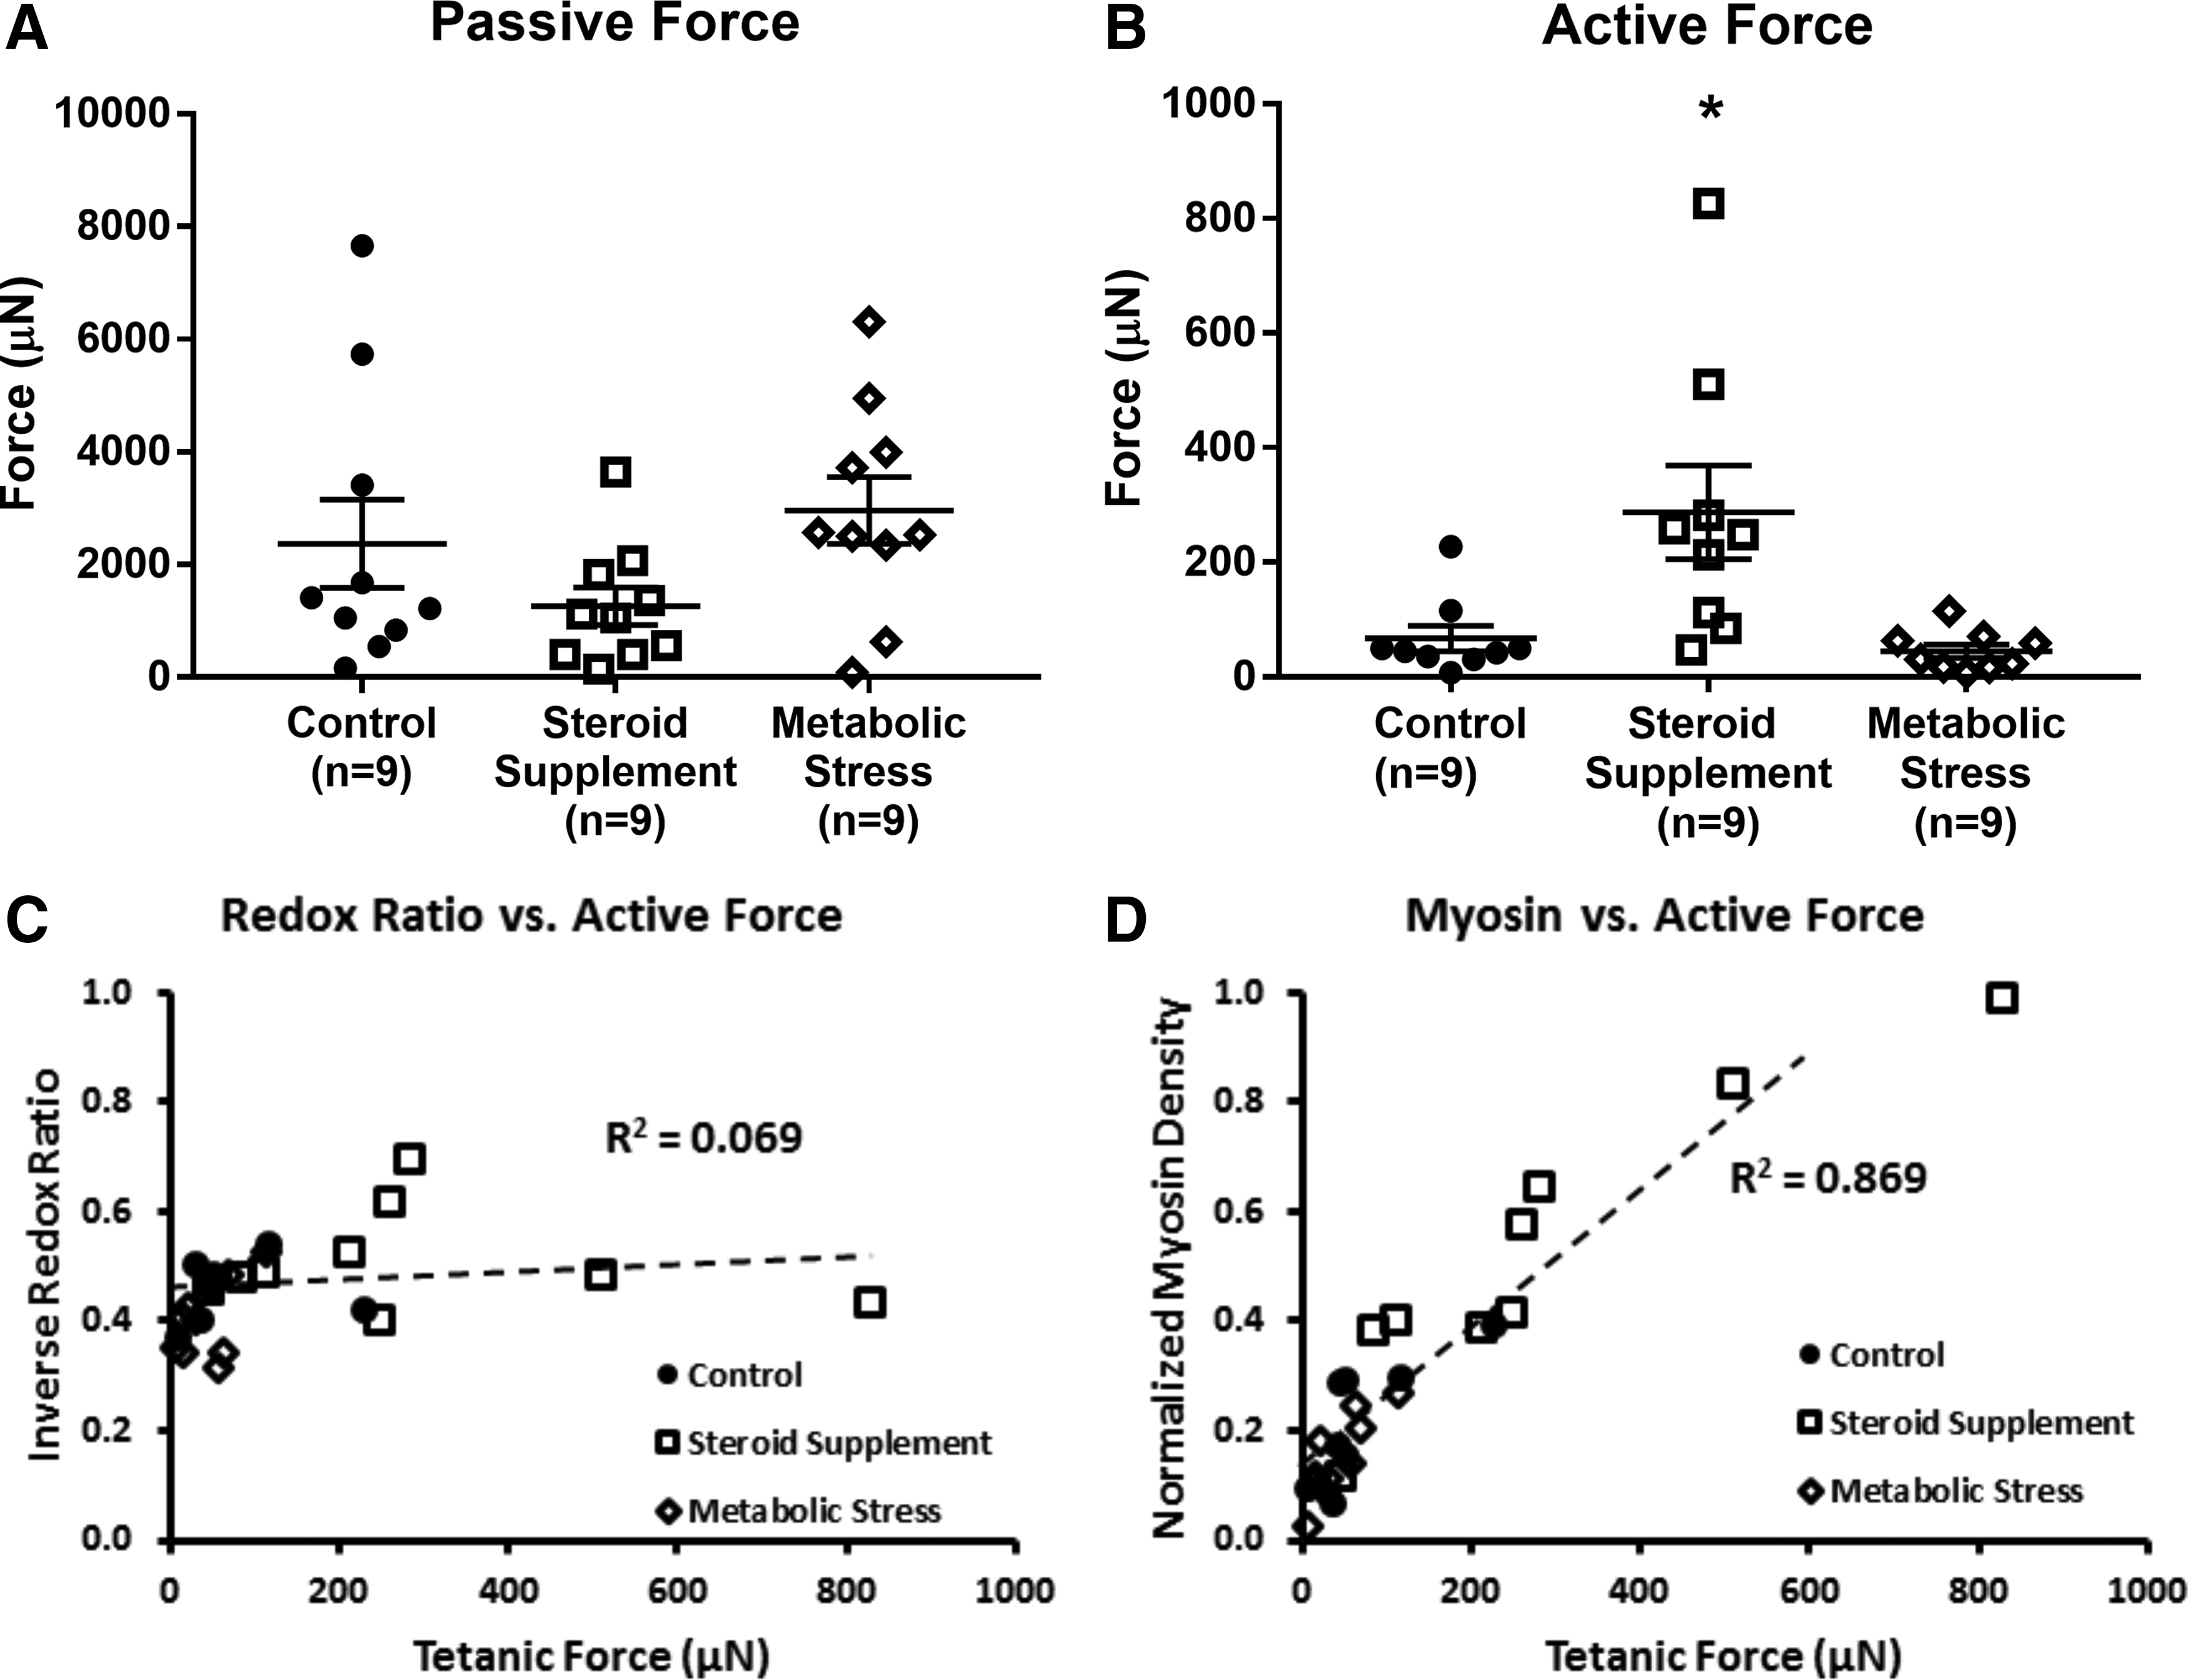
Comparison of SMU contractile properties and OMI measures. The ability of 3D SMUs to generate force was used to measure tissue function.
Correlation between OMI metrics and functional measures
To evaluate the potential of the OMI metrics for evaluation of engineered skeletal muscle tissue, RR and SR values from samples were compared with the current gold standard for functional evaluation, contractile force production. A weak, nonsignificant correlation (Pearson r = 0.26, p = 0.19) was observed between inverse RR and force production in 3D SMUs (Fig. 6). On the other hand, a significant correlation (p < 0.01) was measured between SR and force production, with a Pearson correlation coefficient of 0.62. Further, comparing OMI measures of myosin density alone with force production values demonstrated the strongest correlation (r = 0.93, p < 0.01).
Discussion
This work demonstrates the potential for using label-free OMI to characterize and evaluate tissue-engineered skeletal muscle constructs. In both monolayers and 3D SMUs, the novel OMI measures successfully evaluated metabolic activity and structural organization. Previous work with tissue-engineered SMUs has determined that generation of contractile force greater than 100 μN serves as a suitable threshold with which to judge constructs that are viable for implantation.29,31,37,38 As a result, the optical approaches described in this work were first validated in tissue-engineered skeletal muscle and subsequently compared with the standard preimplantation measure—functional evaluation of peak tetanic force production.
The potential of label-free OMI for evaluation of tissue viability has been demonstrated in biopsies from native skeletal muscle13,23,25 and in engineered oral mucosa, 10 and the ability to use such methods for a diverse range of engineered tissues holds great promise for advancing the field as a whole. In this study, cell metabolic activity, primarily contained within fluorescence signals from metabolic coenzymes NADH and FAD, was obtained by imaging thin optical cross-sections of cellular monolayers and 3D tissues. Because OMI was performed in a noninvasive manner without the need for preservation or exogenous labeling reagents, metabolic activities were evaluated at multiple time points without adversely affecting the tissue engineering process.
Using the RR metric extracted from these signals, we successfully differentiated control and metabolically stressed engineered tissues. Overall, decreased metabolic activity was detected through the RR metric in both metabolically stressed monolayers and 3D SMUs. A nonsignificant correlation relating increased metabolic activity to increased force production was observed, suggesting that OMI measures of metabolism alone may not be sufficient to evaluate SMU suitability for implantation. It is also worth examining the individual NADH and FAD signals used to calculate the RR metric. Specifically, both the NADH and FAD signals were weaker, significantly so in the case of NADH, in metabolically stressed monolayers as opposed to controls. This decrease in fluorescence signal could be due to a decrease in cell density as a result of metabolic stress. Such results emphasize the wealth of information obtained from NADH and FAD images of individual cells in engineered tissues. Our main goal in this study was to generate a quantitative measure of metabolic health, but an examination of these metabolic enzymes can also characterize cell size, morphology, and cellular organization that can potentially be used to distinguish various cell types, disease states, or stages of differentiation. Although metabolic activity was correlated to force production, it is clearly useful to gather these metabolic coenzyme signals as a means for noninvasively evaluating the cells within our engineered SMUs.
In addition, OMI captured essential information describing structural composition through myosin and collagen SHG signals. The myosin SHG signal, in particular, shows great promise for the evaluation of organized sarcomeric structure in tissue-engineered skeletal muscle. In this study, we captured high-resolution images of myosin SHG in fixed native and engineered tissues and extracted sarcomere lengths indicative of tissue structural maturity. Further, we demonstrated novel applicability of myosin SHG by imaging sarcomeric structure in living engineered tissue. Utilizing the ratio of myosin to collagen SHG signals, we were able to quantify structural development in our engineering tissues. The efficacy of the SR metric was then demonstrated by distinguishing between dexamethasone-supplemented and control samples. Using OMI, we were able to show that the addition of dexamethasone increased the relative myosin content, quantified by the SR metric, in both developing muscle monolayers and 3D SMUs relative to control tissues. The lack of a significant difference between SR values in monolayers and 3D SMUs was somewhat surprising, given the consensus that culturing muscle cells in 3D leads to more highly organized and advanced skeletal muscle structures. Perhaps with greater time in 3D form, the SMUs would develop this advanced organization. Images were captured ∼48 h after SMU formation, and it is likely that these engineered tissues were still remodeling after the delamination process. Future studies may examine further structural advancement in SMUs over time in 3D culture, and the noninvasive nature of the OMI methods would make such experiments more manageable.
Finally, a clear relationship between the structural OMI measures and force production was evident. As would be expected based on skeletal muscle contractile mechanics, increased myosin density observed through OMI was significantly correlated to increased force production. Ultimately, this positive correlation suggests that OMI measures of SMU structure could potentially serve as an accurate predictor of successful implantation and tissue regeneration. To advance this area of research, we hope to use OMI measures of myosin to evaluate structural organization within our engineered tissues. Since we were able to visualize organized sarcomeres, we are excited at the possibility of evaluating metrics such as sarcomeric spacing and alignment that could better indicate maturation of our engineered SMUs.
Conclusions
In this work, we demonstrated the potential of noninvasive optical techniques to provide manufacturing release criteria that correlate to functional measures of engineered skeletal muscle. The optical methods described here were previously used for quality control of tissue-engineered oral mucosa, 10 and this use in an engineered skeletal muscle in this work suggests applicability for a variety of other tissues. Because nonlinear OMI has the ability to optically penetrate several 100 μm into tissues, this approach should be suitable for other engineered cell-based devices. In addition, this approach could be employed to evaluate the integration and maturation of implanted tissues in vivo during the regeneration process, whether through a microendoscope and/or an imaging window.13,18 This work illustrates how OMI techniques could benefit the fabrication of tissue-engineered products by enabling nondestructive analysis of engineered tissues in real time. Using this approach, reliable tools for providing quantitative measures of engineered tissue viability can enable selection of the healthiest engineered tissues for implantation, thereby improving therapeutic outcomes and enhancing patient care.
Footnotes
Acknowledgment
The authors would like to acknowledge the support of NIH R01 grant: AR067744-011.
Disclosure Statement
No competing financial interests exist.