
Abstract
The steep increasing incidence of bone diseases and fractures provides a commanding impetus and growing demands for bone tissue engineering research. Pulsed electromagnetic fields (PEMFs) have been documented to promote bone fracture healing in nonunions and to enhance the maturation of osteoblastic cell, which is the key element in bone tissues. However, the optimal parameters for PEMF stimulation are still being explored. In this study, we investigated the effects of PEMF treatment on the proliferation, differentiation, and mineralization of osteoblast precursor cells MC3T3-E1 to explore the cell growth profile under different PEMF exposure durations (15, 30, and 60 min daily) with a magnetic field strength of 0.6 mT, at a frequency of 50 Hz, and cultured in media with or without osteogenic supplements for 28 days. Cell viability and metabolic activity were accessed by confocal microscopy, and alamarBlue time-course measurements and results indicated that there were no adverse effects under designated PEMF condition. After 7 days of PEMF exposure, in comparison with negative controls, cell numbers increased when exposed to PEMF in culture medium and were independent of osteogenic supplements. However, PEMF might not have significant impact on cellular mineralization as observed from calcium deposition analysis, even though osteogenic gene expression was upregulated for cells with PEMF exposure. Von Kossa and Alizarin Red staining indicated that extracellular matrix mineralization occurred at day 28 with osteogenic supplements only, and no significant differences were found among those samples with different PEMF treatment durations. In summary, our results suggested that PEMF stimulation for as short as 15 min could improve cell proliferation but not mineralization in vitro. Thus, this study highlights the importance of choosing appropriate PEMF parameters to achieve the desired effect on target cells. The optimization of PEMFs will enhance the efficiency of its usage as a clinical, adjuvant therapeutic treatment for bone defect regeneration.
Impact Statement
We present the study about how the parameters of pulsed electromagnetic field (PEMF) stimulus affected calvarial osteoblast precursor cell in terms of growth, viability, and differentiation. This research provides insight and foundation to clinical application of noninvasive therapy using PEMF to improve bone regeneration.
Introduction
The number of incidence for bone disorders such as fractures and osteoporosis has steeply increased, and it is expected to double by 2020, which might be caused by aging population coupled with increased obesity and poor physical activities. 1 Statistics show that 50% of women and 20% of men older than 50 years would suffer from fragility fractures globally. 2 Currently, autologous bone grafting is considered the gold standard as it confers complete histocompatibility while possessing osteoinductive, osteoconductive, and osteogenic healing potentials.1,3 However, the concerns of limited supply and donor site complications are still not resolved. 1 Therefore, there is an urgent need for alternative therapies for this pathological condition.
Pulsed electromagnetic field (PEMF) therapy had proved to be safe and also shown promising therapeutic effectiveness on bone- and cartilage-related pathologies, including knee and cervical spine osteoarthritis.4,5 Research performed by NASA had also shown that PEMF could improve the bone density of astronaut living in outer space whose bones were weak due to the lack of stress exerted to the bones in the absence of gravity and geomagnetic field. 6 Even though this therapy is still in its infancy, it holds great potential as a form of noninvasive treatment for bone repair. Furthermore, PEMF stimulation had been approved by the U.S. Food and Drug Administration (FDA) for the treatment of cervical and lumbar spinal fusion, one of the most challenging nonunion fractures.5,7
Several studies had been conducted to explore the effects of PEMF on osteoprogenitor cells and the skeletal system.8–14 Studies had shown electromagnetic fields (EMFs) to promote osteoblast-like cell proliferation, or contrarily, to induce differentiation and enhance mineralization. This effect of magnetic field could even alter cell spreading attachment properties through nanoscale ligand manipulation to enhance osteogenic differentiation of stem cells.15,16 However, typically, these disparities have been attributed to methodological differences. 17 Lim et al. 10 reported that PEMF of frequencies 50 and 100 Hz developed synergistic effects on the proliferation and differentiation of mesenchymal stem cells (MSCs), resulting in intense formation of mineralized nodules and increased expressions of osteogenesis-related genes.
Furthermore, Kang et al. 18 suggested that low-frequency PEMF might influence osteoblastic viability and function with the increased ratio of the efflux of Ca2+ through the cellular membrane. They also observed that PEMF of frequencies 30–45 Hz provides stronger osteogenic effects than lower frequencies. Studies also found that effects of PEMF were intensity-dependent. In the study by Luo et al., PEMF exposure with an intensity of 1 mT had a better effect on bone mineral density and structural integrity of rabbit femur than that with an intensity of 2 mT. 19 Besides, another study using osteoblasts as the target concluded that higher intensity of PEMF does not mean higher growth of the cells. 20 The intensity of PEMF is indeed a critical factor that can regulate the growth and even differentiation of T cells or tissues. 21
Despite numerous studies of the effect of PEMF stimulations on cells responses,22–24 there is no general consensus on the optimal parameters that will promote bone growth and healing. 25 For instance, PEMF exposure as short as 10 min has been found to increase the extracellular matrix (ECM) secretion as well as enhancing the osteogenic gene expression. 26 Another study performed using rat models testing the effect of PEMF exposure to rotator cuff tears healing found that 1 h of exposure shows the most consistently positive healing process compared with longer exposure. 27 In addition, some studies reported that prolonged exposure to high EMF-emitting device could possibly cause health issues, even higher chance of cancer. 28
In this study, we investigated the effect of various exposure durations of PEMF stimulation on the proliferation, osteogenic differentiation, and mineralization of osteoblastic cells. The uniformity of PEMF was accessed by direct measurement with EMF sensor and verified with simulation using the COMSOL software. We selected PEMF with a frequency of 50 Hz and an intensity of 0.6 mT based on the finding by Yan et al. that shows that these parameters improve proliferation and differentiation of rat calvarial osteoblast. 29 We chose a set of varying duration of PEMF exposure at 0, 15, 30, and 60 min daily on MC3T3 cells as previous study shows that PEMF exposure longer than 1 h did not show significant healing property in vivo. 27
Materials and Methods
Cell culture
Murine MC3T3-E1 Subclone 4 cells (CRL-2593) were obtained from the American Type Culture Collection (ATCC) and supplied at passage 3. The MC3T3-E1 cells were expanded in supplier-recommended modified alpha minimum essential medium (α-MEM) cells containing
The passage number of cells used in this study was five to six, and the cell seeding density was 1000 cells/cm2. Osteogenic medium consisted of the growth medium supplemented with 10 mM β-glycerophosphate, 0.2 mM ascorbic acid, and 10 nM dexamethasone (Sigma–Aldrich). After cell seeding, cells were allowed to adhere for 24 h before osteoinduction started through osteogenic media and PEMF. The media change occurred every 2–3 days.
PEMF exposure system
PEMFs were induced in two identical paralleled connected solenoids powered by a function generator (OR-X Model 630). Given the position of the solenoids and the characteristics of the pulse generator, the electromagnetic stimulation had the following parameters: average magnetic field intensity equal to 0.60 ± 0.01 mT, output amplitude equal to 4.40 ± 0.04 V, signal frequency of 50.00 ± 0.01 Hz, and pulse duration of 3.00 ms. COMSOL Multiphysics software was used to simulate the distribution of EMF in the solenoid coils (Fig. 1) and verified with a Hall Effect transverse Gaussmeter probe (Vernier LabQuest®2), and the temporal pattern of the electromagnetic signal was evaluated by a digital oscilloscope (LeCroy).
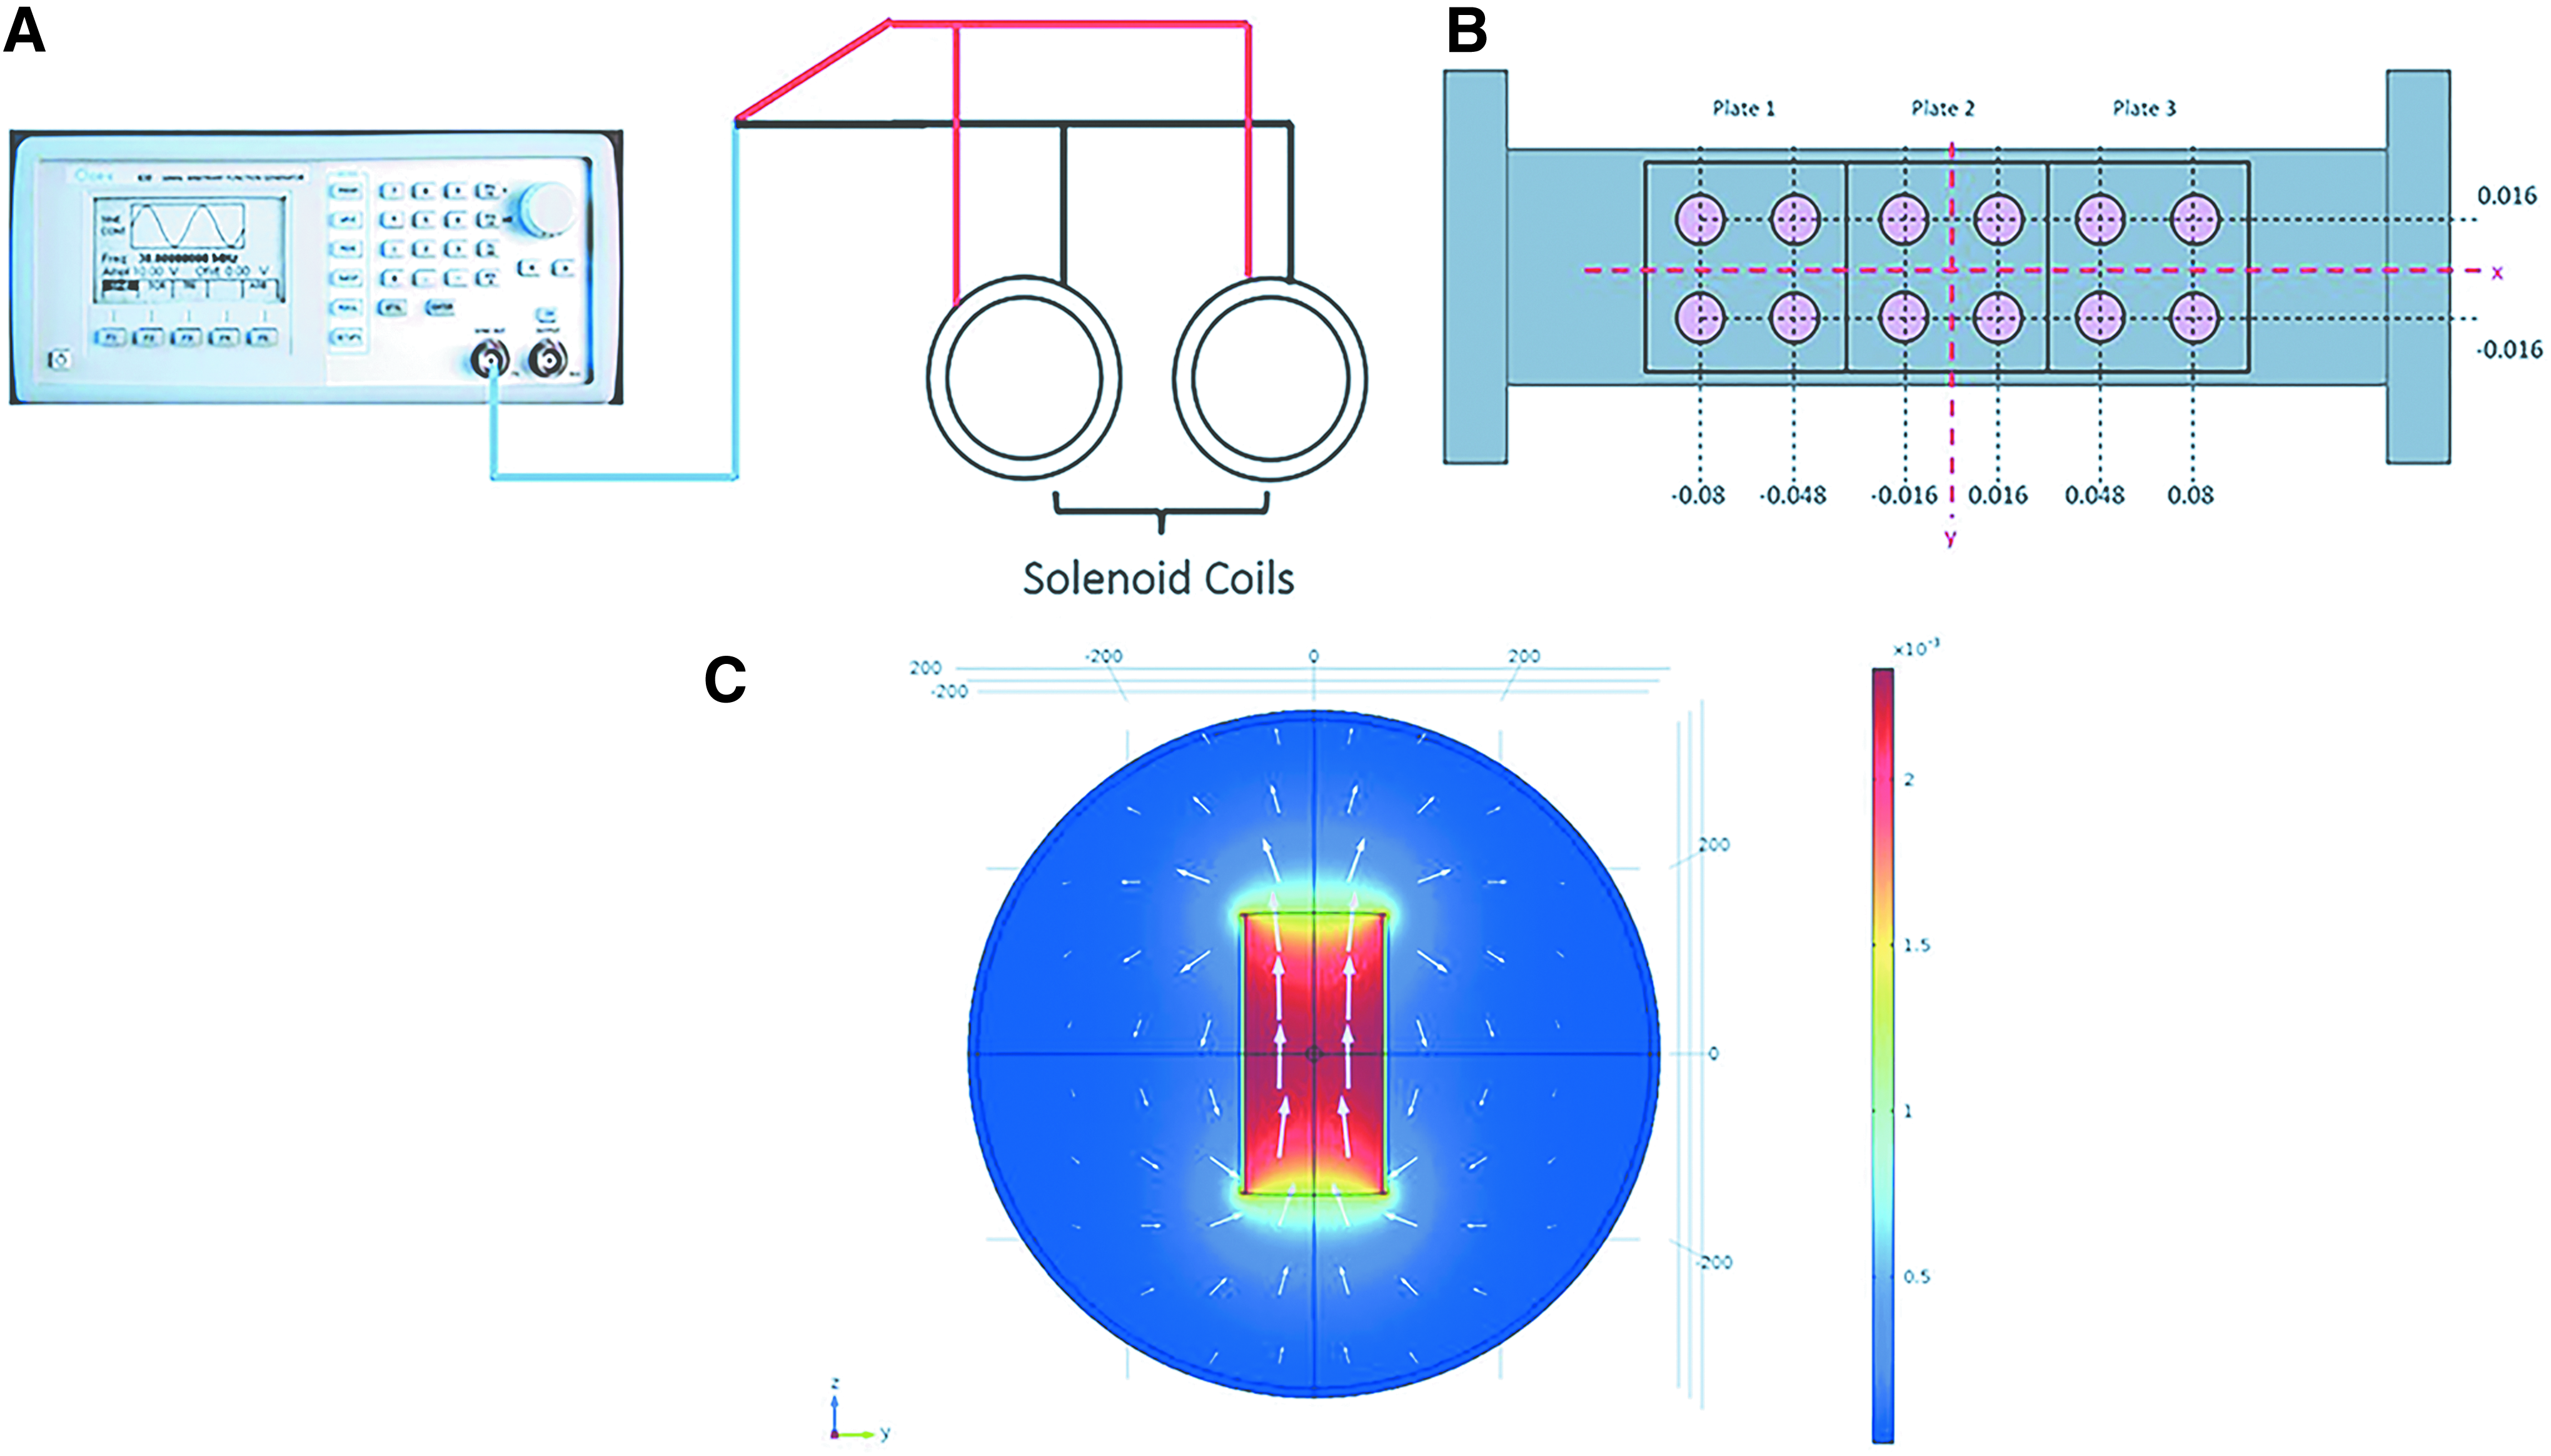
Schematic illustration of experimental setup to generate PEMF.
The magnetic field intensity was measured using the Gaussmeter probe placed in the interior of solenoid and summarized in Table 1. The distribution of magnetic field intensity in solenoid is qualitatively demonstrated in Figure 1C, and cell culture plates were placed in the middle (Fig. 1B) of solenoid. To expose all cells to as close to the magnetic field intensity of 0.6 mT as possible, the magnetic field of 0.63 mT was produced at x. This resulted in all cells receiving magnetic field intensities from 0.57 to 0.63 mT, with 0.6 mT as the average. The magnetic field strengths in certain locations in solenoid were measured by Gaussmeter probe and listed in Table 1. Cells were allowed to adhere for 24 h before PEMF exposure and from then on stimulated daily until day 28.
Pulsed Electromagnetic Field Distribution Based on Location Inside Solenoid Coil
The samples were divided into eight groups based on the media they were cultured in and the duration of PEMF exposure as listed in Table 2. In our experimental settings, the solenoids were placed into a standard cell culture incubator in a 37°C, 5% CO2 environment.
Study Groups of Cells Under Pulsed Electromagnetic Field Exposure
PEMF, pulsed electromagnetic field.
Cell viability
Cell viability, based on membrane integrity, of MC3T3-E1 was assessed 24 h after PEMF exposure for both control and exposure groups (ND-T60 and D-T60) using calcein-AM and ethidium homodimer-1 (Molecular Probes; Invitrogen) staining. The images were obtained with a confocal microscope (LSM 800; Zeiss).
Cell metabolic activity
The alamarBlue colorimetric assay was used to access the metabolic activity of cells on day 3, 7, and 28 according to the manufacturer's instructions (ThermoFisher). Briefly, the cells were washed with phosphate-buffered saline and incubated in 10% alamarBlue solution in α-MEM for 3 h. After which, the reduced alamarBlue solutions were transferred to a clear 96-well plate to be read in a microplate reader (SpectraMax M5; Molecular Devices) at absorbance wavelengths of 570 and 600 nm.
Cell proliferation
Cell proliferation was illustrated by DNA amount at every time points during the study period. DNA amount was measured using Quant-iT PicoGreen dsDNA Assay Kit (ThermoFisher) according to the manufacturer's protocol. Briefly, the cells were harvested using an enzymatic solution of 0.1% (v/v) trypsin and 0.1% (w/v) collagenase and lysed through three freeze-thaw cycles. After which, the samples were transferred to a black 96-well plate and mixed with working reagent. The fluorescence intensity of each sample was measured using a microplate reader (SpectraMax M5, excitation wavelength at 485 nm and emission at 530 nm; Molecular Devices). A standard curve plotted with known amount of DNA was used to determine the amount of DNA in samples.
Calcium quantification
Calcium content was measured by the QuantiChrom Calcium Assay Kit (BioAssay Systems) according to the manufacturer's instruction. Briefly, the calcium deposits were dissolved in 400 mL of 0.5 N acetic acid for 24 h, and then, 5 μL of the samples were transferred to a clear 96-well plate and mixed with the 200 μL of working reagent. After which, it was incubated at room temperature in dark for 5 min. The samples were read using a microplate reader (SpectraMax M5; Molecular Devices) at absorbance wavelength of 612 nm. A standard curve plotted with known amount of calcium was used to determine the calcium in samples.
Alizarin Red staining
Alizarin Red S (Sigma–Aldrich) was used to visualize the calcium deposition indicating mineralization of cells. Briefly, cells in four-well plates were washed with phosphate-buffered saline and fixed in 10% (v/v) formaldehyde (Sigma–Aldrich) at room temperature for 15 min. After washing with excess distilled water (dH2O), Alizarin Red solution (2% w/v in dH2O) was used to cover cells for 30 min. After aspiration of the unincorporated dye, the samples were washed thoroughly with dH2O and observed under a light microscope.
Von Kossa staining
Von Kossa stain was performed using 2% silver nitrate solution, which was prepared by dissolving silver nitrate (Sigma–Aldrich) in dH2O. This will stain the phosphate ions that are present in the calcified cells as phosphate binds to calcium ions to form calcium phosphate. The cell samples were fixed in 4% paraformaldehyde for 1 h and rinsed with dH2O twice before soaked in the silver nitrate solution for 10 min in the dark, followed by the exposure to ultraviolet light for 30 min. The samples were then washed thoroughly with dH2O and viewed under the light microscope.
Real-time polymerase chain reaction analysis
The upregulation of expression of specific gene markers associated with osteogenic differentiations was assessed by real-time polymerase chain reaction (RT-PCR). After 7 and 28 days of cell culture, the RNA of the cell was extracted using RNeasy Protect Mini Kit (Qiagen), and reverse transcription was performed using iScript cDNA Synthesis Kit (Bio-Rad) with thermal cycler T100 (Bio-Rad). Real-time polymerase chain reaction (PCR) was conducted using the KAPA SYBR Fast qPCR Kit (Sigma–Aldrich) with thermal cycler CFX Connect System (Bio-Rad) according to the manufacturer's instructions. Three different gene primers (AIT Biotech) such as glyceraldehyde-3-phosphate dehydrogenase (GAPDH), bone sialoprotein (BSP), and osteocalcin (OC) were used (listed in Table 3). Results are presented as fold change expression normalized against the calibrators: GAPDH as the endogenous housekeeping gene. 30
Primer Sequences for the Genes Used in Real-Time Polymerase Chain Reaction 28
BSP, bone sialoprotein; GAPDH, glyceraldehyde-3-phosphate dehydrogenase; OC, osteocalcin.
Statistical analyses
All statistical analyses were performed using Microsoft Excel. Independent samples t-tests were carried out for the metabolic function, calcium content, and proliferation tests between untreated and PEMF-treated samples within the same time point and same culture media groups. Difference within the same treatment among different days was tested by one-way analysis of variance. Results are presented as mean ± standard deviation. Significant level was set up at 0.05.
Results
Cell morphology
Live MC3T3-E1 cells were observed through phase-contrast microscope (PCM), whereas the fixated ones were examined using scanning electron microscope (SEM) with a high magnification. On day 3, cells were visible under PCM with 30–40% confluency (Fig. 2A). In SEM images (Fig. 3A), the cells' spreading could be seen clearly and with elongated cell morphology, which indicated that cells attached well on the surface of cell culture plates. On day 7, both SEM and PCM images showed that cells reached more than 90% confluency (Figs. 2B and 3B). The cell morphology changed into a spindle-shaped, or often called fibroblast-like morphology. On day 28, deposition nodules on top of the confluent cells could be observed clearly on both PCM and SEM images for cells in differentiation media.
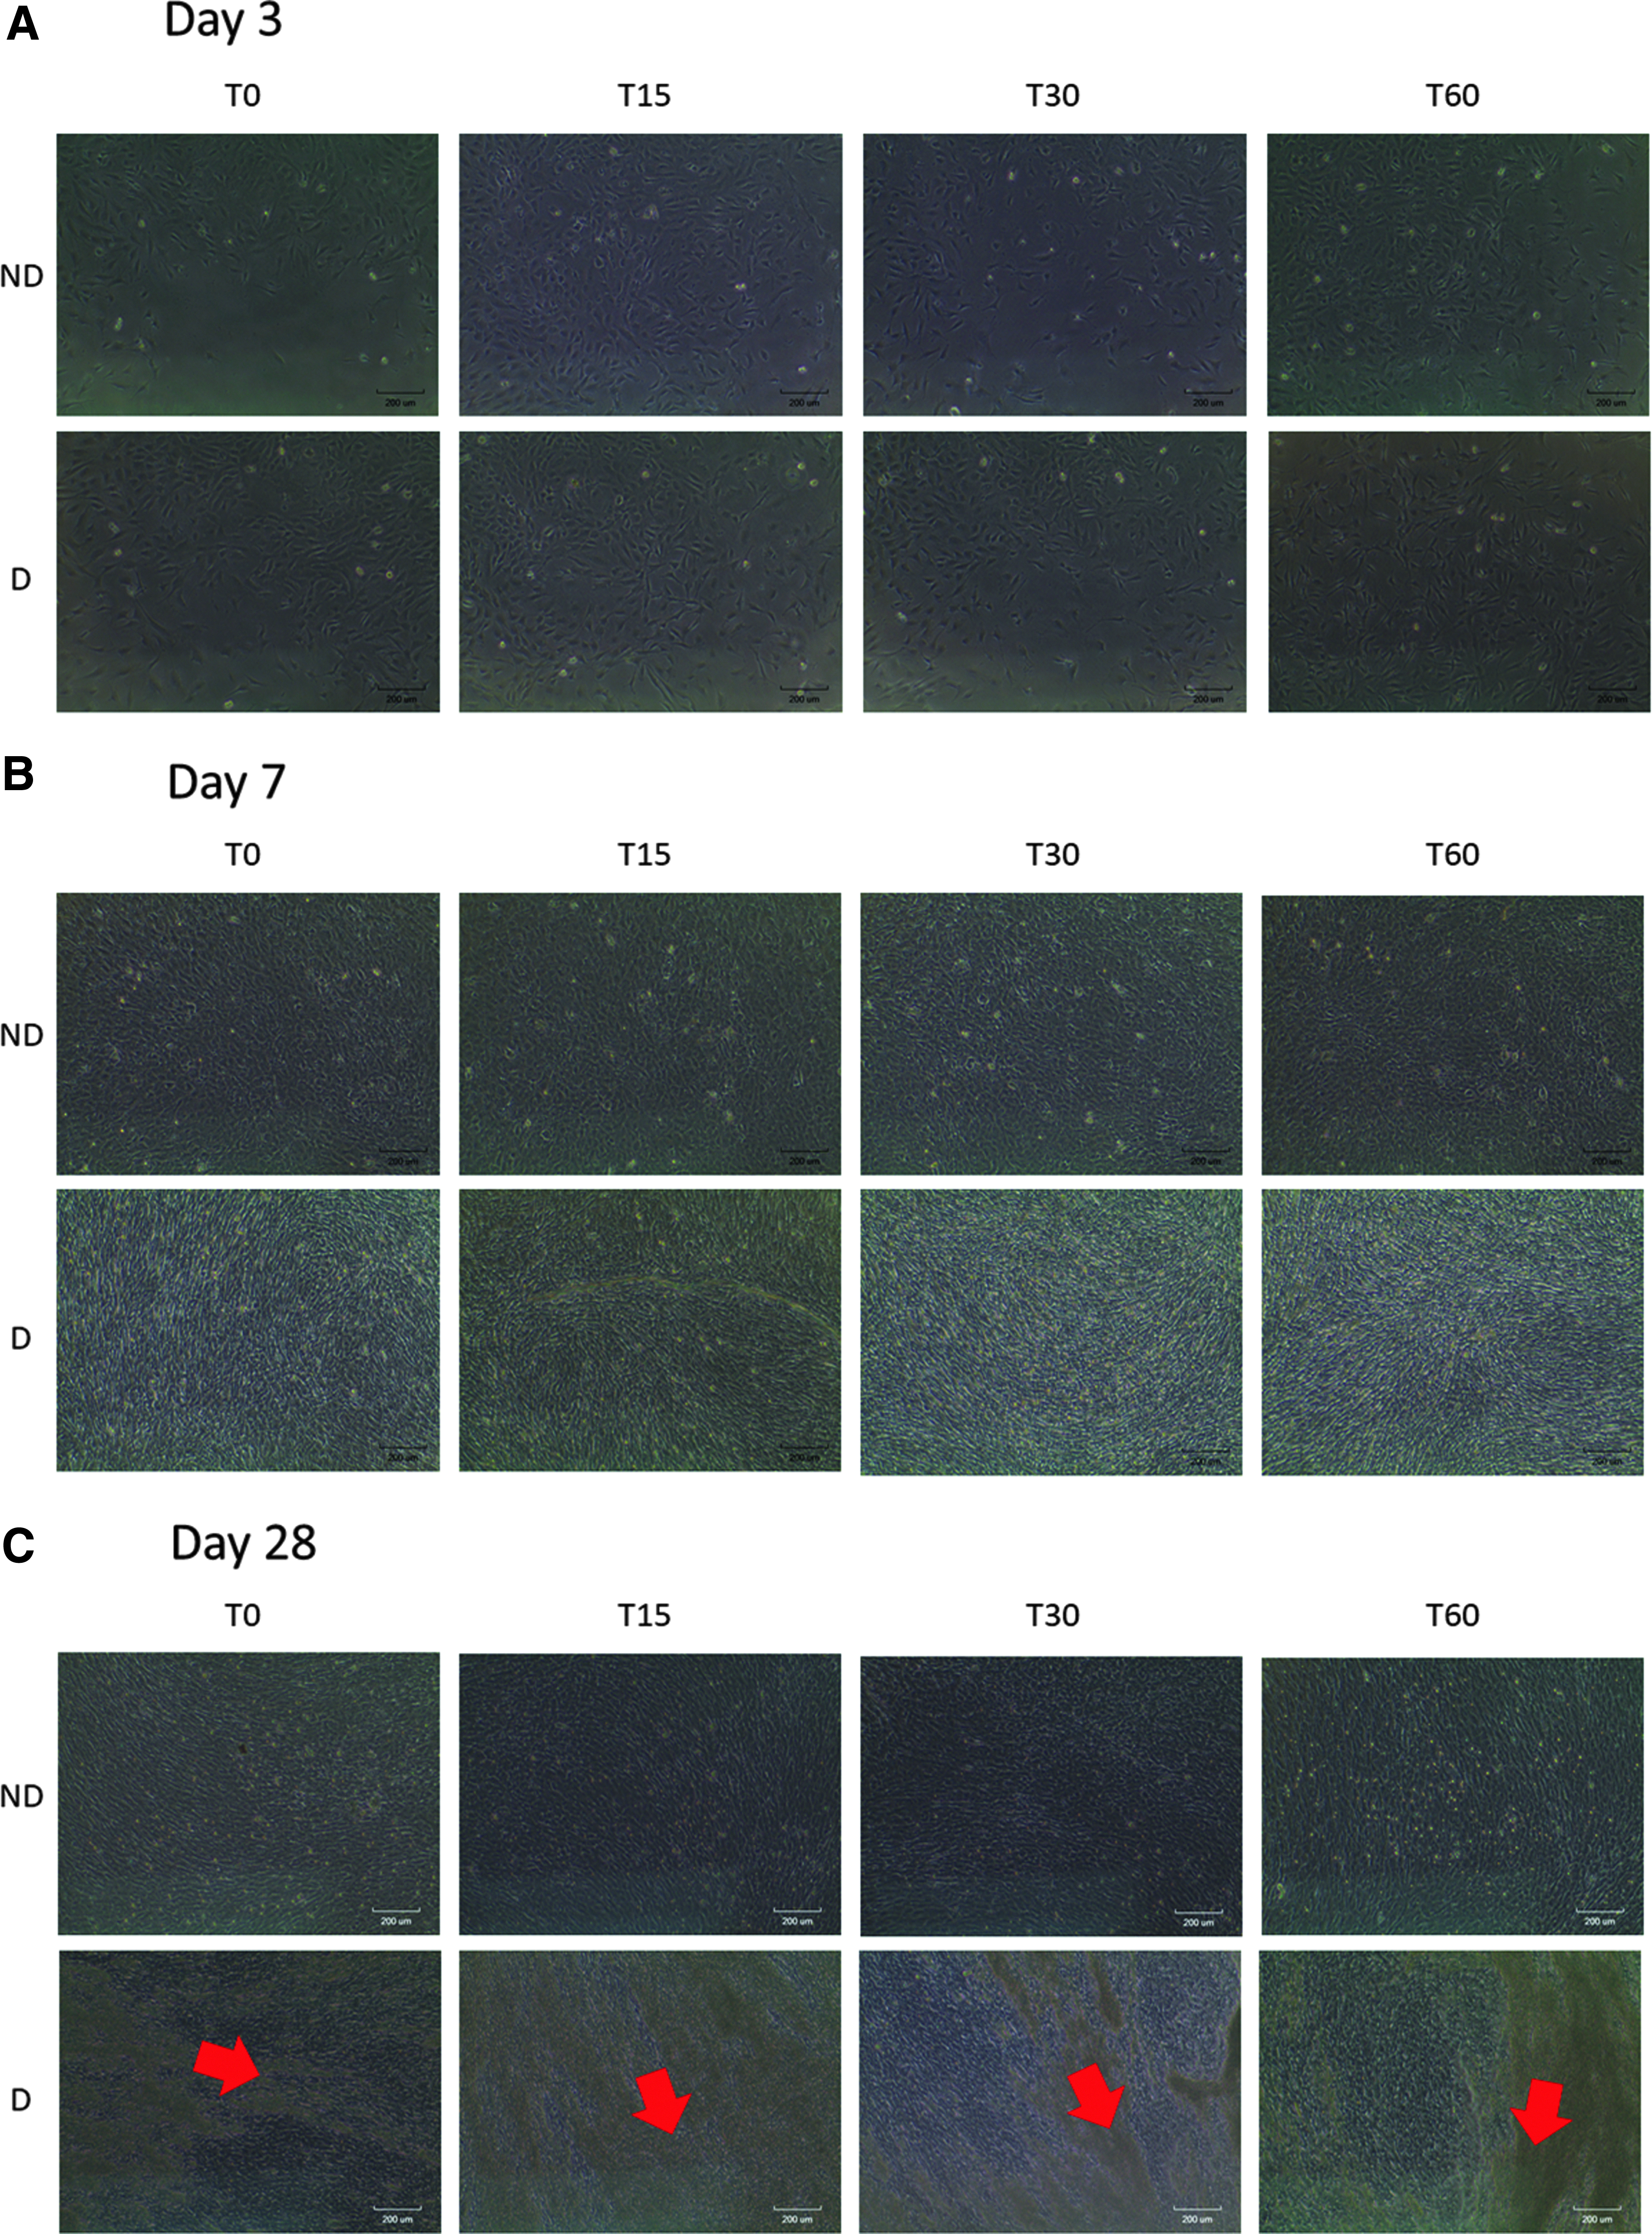
Cell morphology of the untreated (T0) and PEMF-treated groups (T15, T30, and T60) using phase-contrast microscope taken on
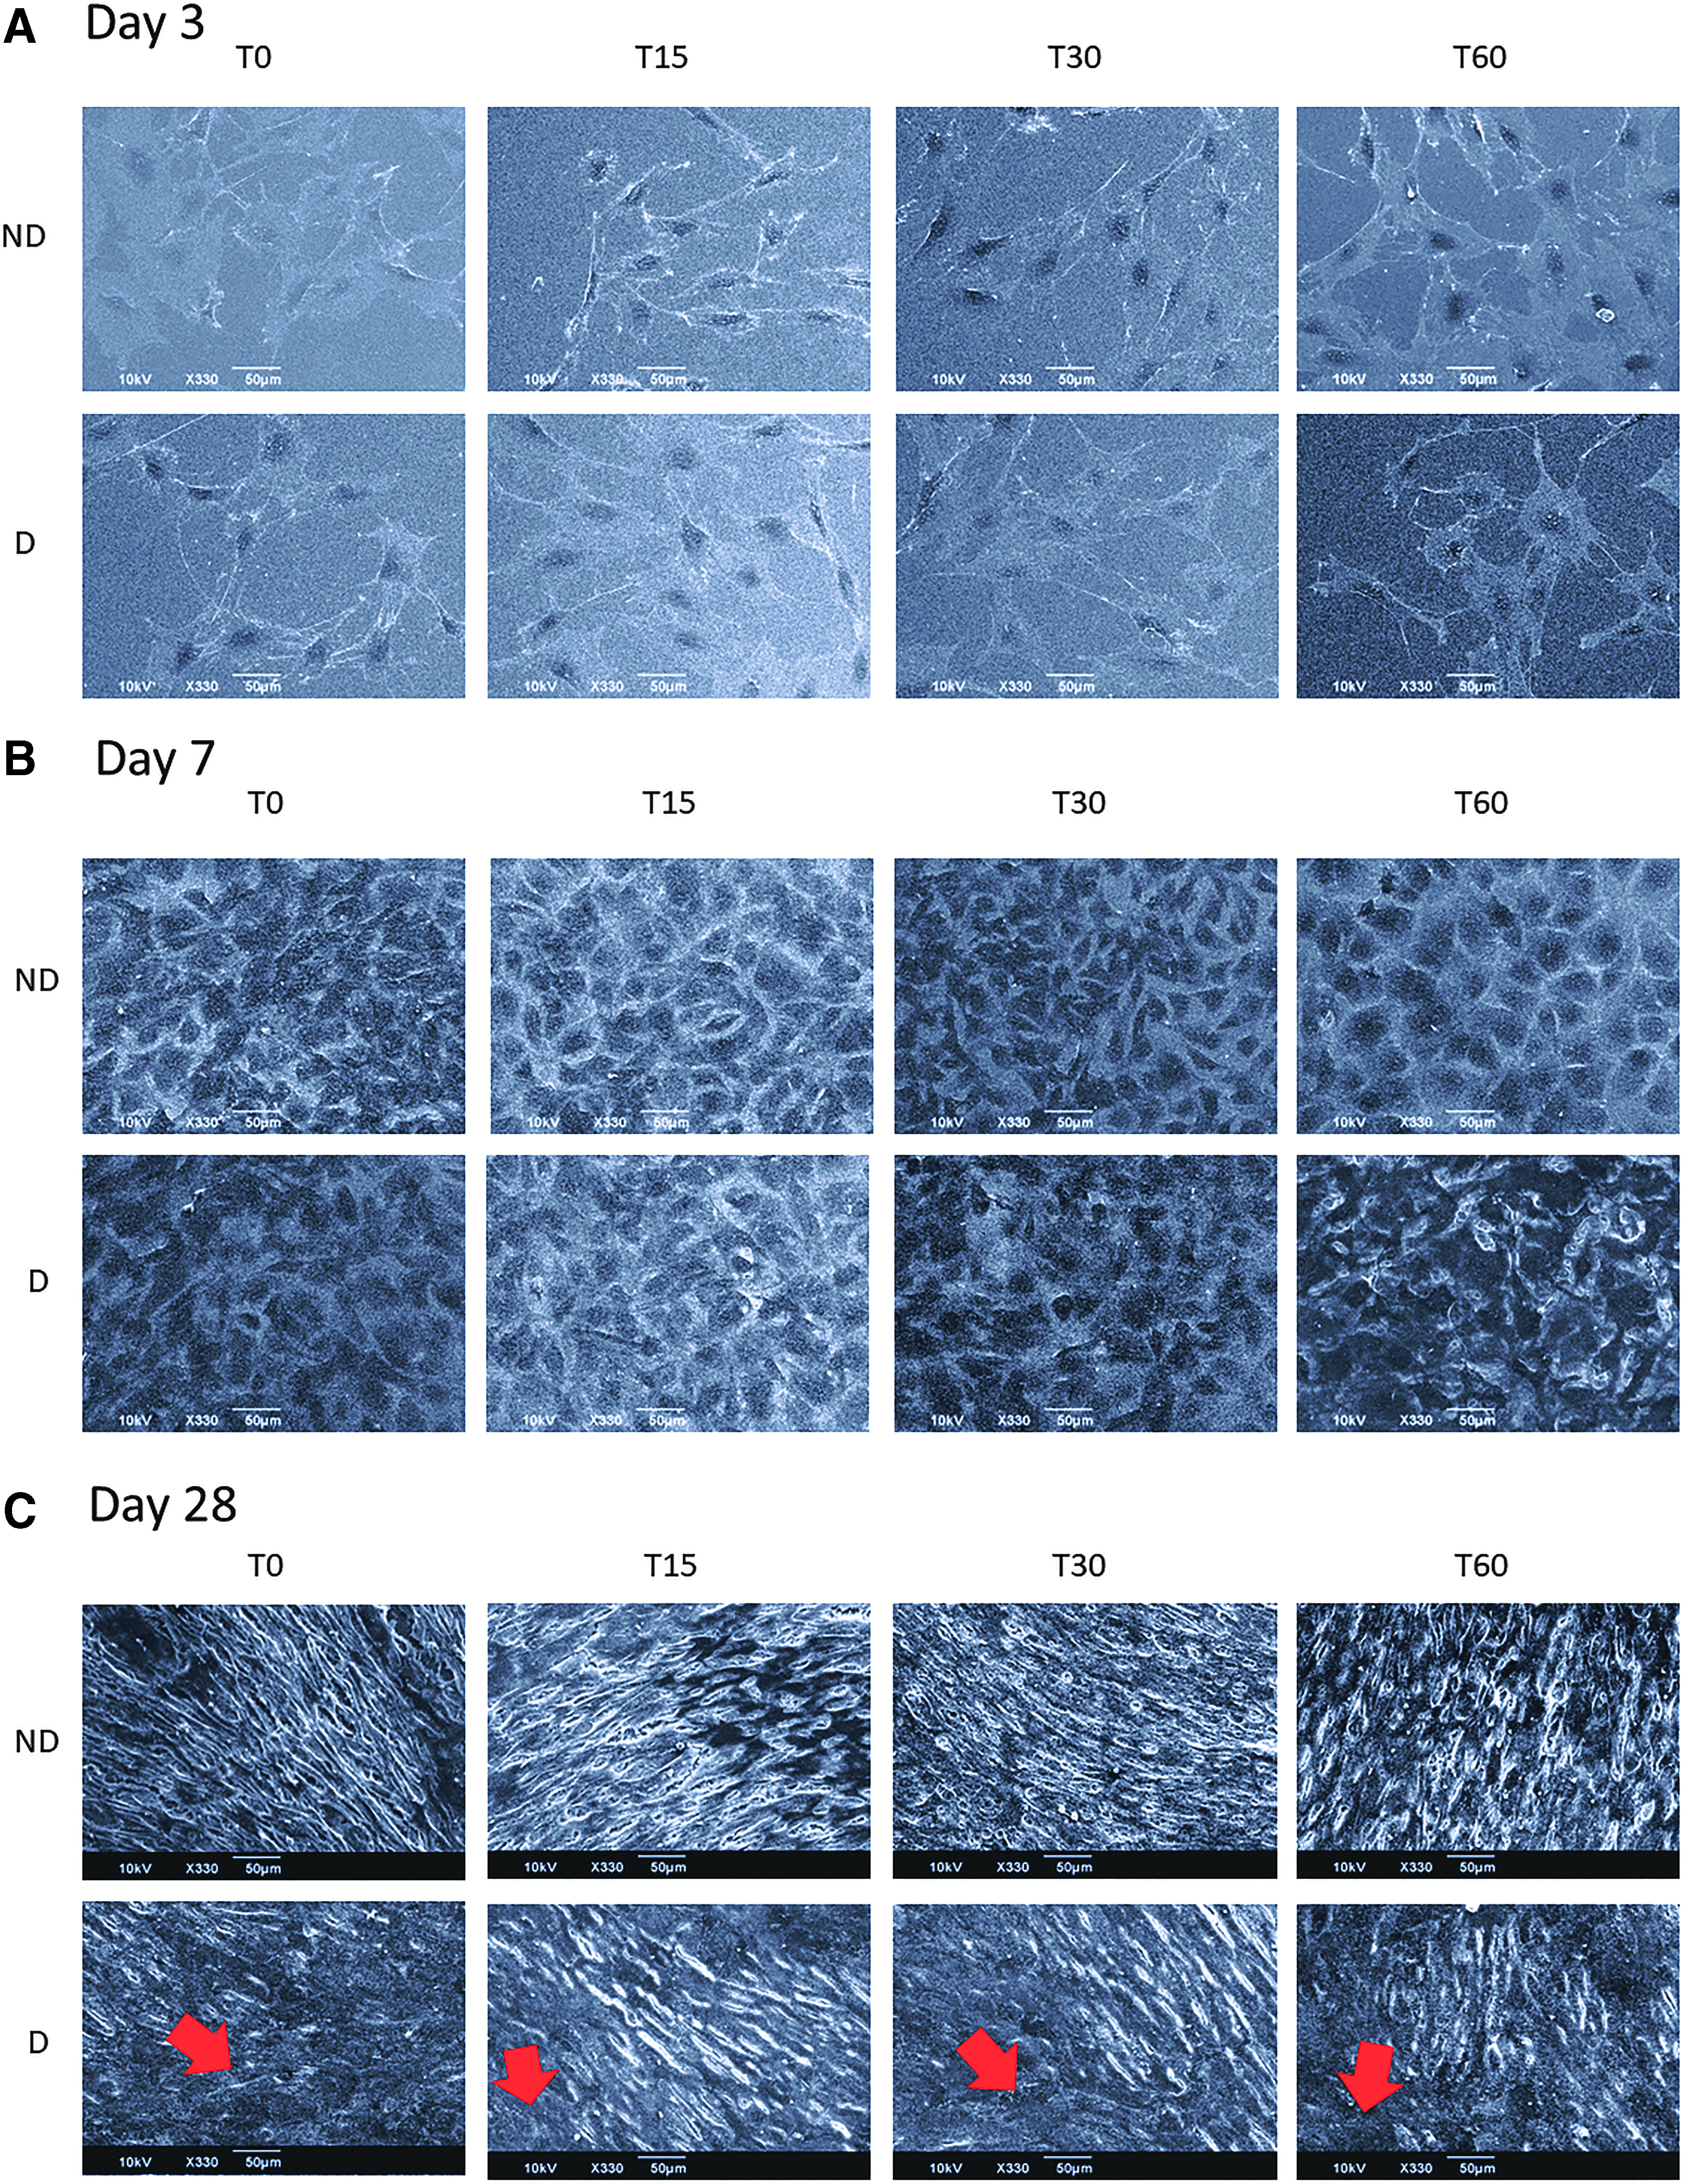
Fixed cell morphology of the of the untreated (T0) and PEMF-treated groups (T15,T30, and T60) using scanning electron microscope taken on
However, although cells cultured in growth media were just as confluent, they did not show any formation of this deposit. The cells in all groups showed a fibrous morphology on day 28, which was different with it on day 7.
Cell viability and metabolism
Live/dead viability staining was performed to assess the MC3T3-E1 viability with the longest exposure (60 min) to PEMF of this study in both osteogenic medium and growth medium (Fig. 4). The results showed that the viability of the cells was qualitatively similar to the control cells, which were not exposed to PEMF. This was indicated by calcein-AM stain (green) for live cells and ethidium homodimer-1 stain (red) for dead cells. Furthermore, the metabolism activity of the cells was quantified by the alamarBlue assay (Fig. 5). D groups generally have higher metabolism activity on day 7 and 28 compared with ND groups, regardless of the PEMF exposure duration. On day 3, ND and D groups showed similar value of alamarBlue reduction across all groups tested. On day 28, the cell metabolism activity for both ND and D groups dropped as the exposure time increased, and the cells that were not exposed to PEMF showed highest value of cell metabolism activity.

Live/dead staining using calcein-AM (green) and ethidium homodimer-1 (red).
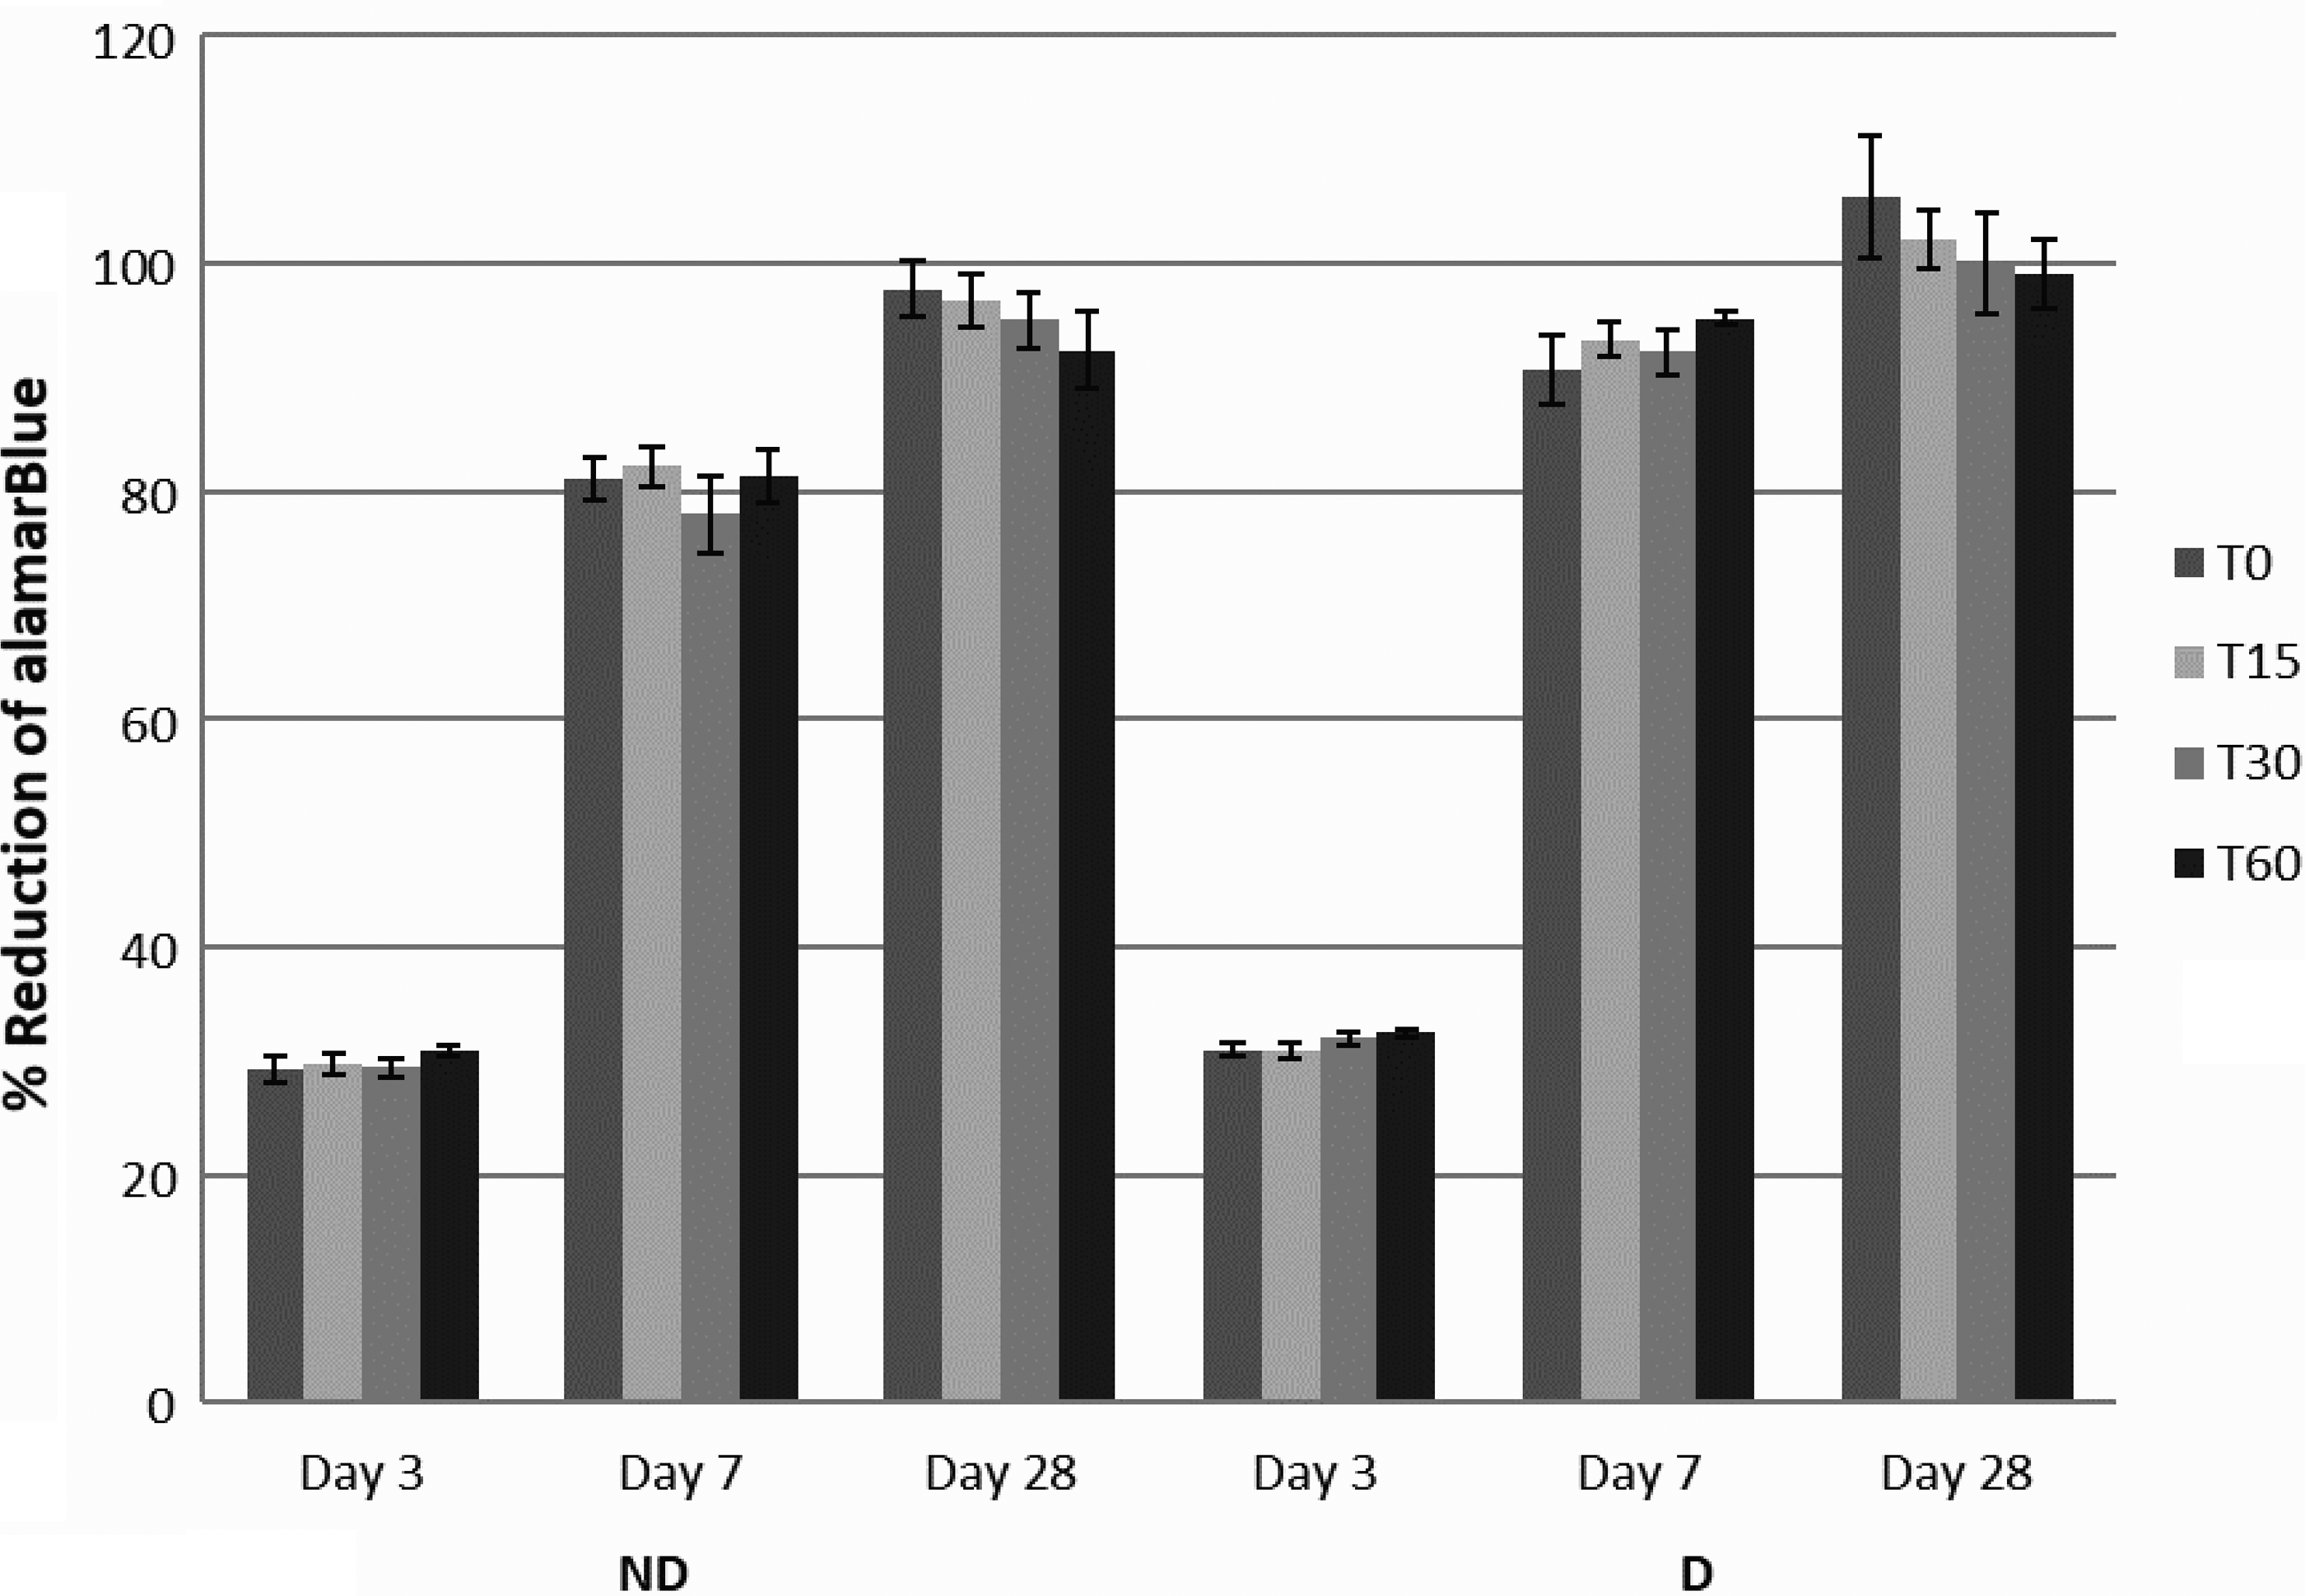
Percentage of reduction for alamarBlue, which is related to the viability of the cells through measured metabolic activity, shows no significant difference for PEMF groups compared with control of each time point (p < 0.05, n = 3).
Cell proliferation
DNA quantification of the cells was used to indicate cell numbers over the 28-day study (Fig. 6). Comparing the two groups based on the media used, it was obvious that cells in osteogenic differentiation media (D groups) had higher cell amount compared with those in growth media across the study in general and was independent on the effects of PEMF exposure. On day 3, the cells exposed to PEMF for 30 min had the highest value compared with the control. As the cells grew and approached confluency on day 7, T15 showed the most cell amount for both ND and D groups, even though the effect was most prominent in the cells grown in the ND media. On day 28, the cells cultured in ND media showed similar trend to those on day 7 with ND-T15 having the highest DNA quantity followed by ND-T30 and ND-T60. On the contrary, the effect of PEMF on cells cultured in D media was shown prominently by those exposed for 30 min daily. D-T30 showed the highest cell proliferation, which was followed by D-T60.
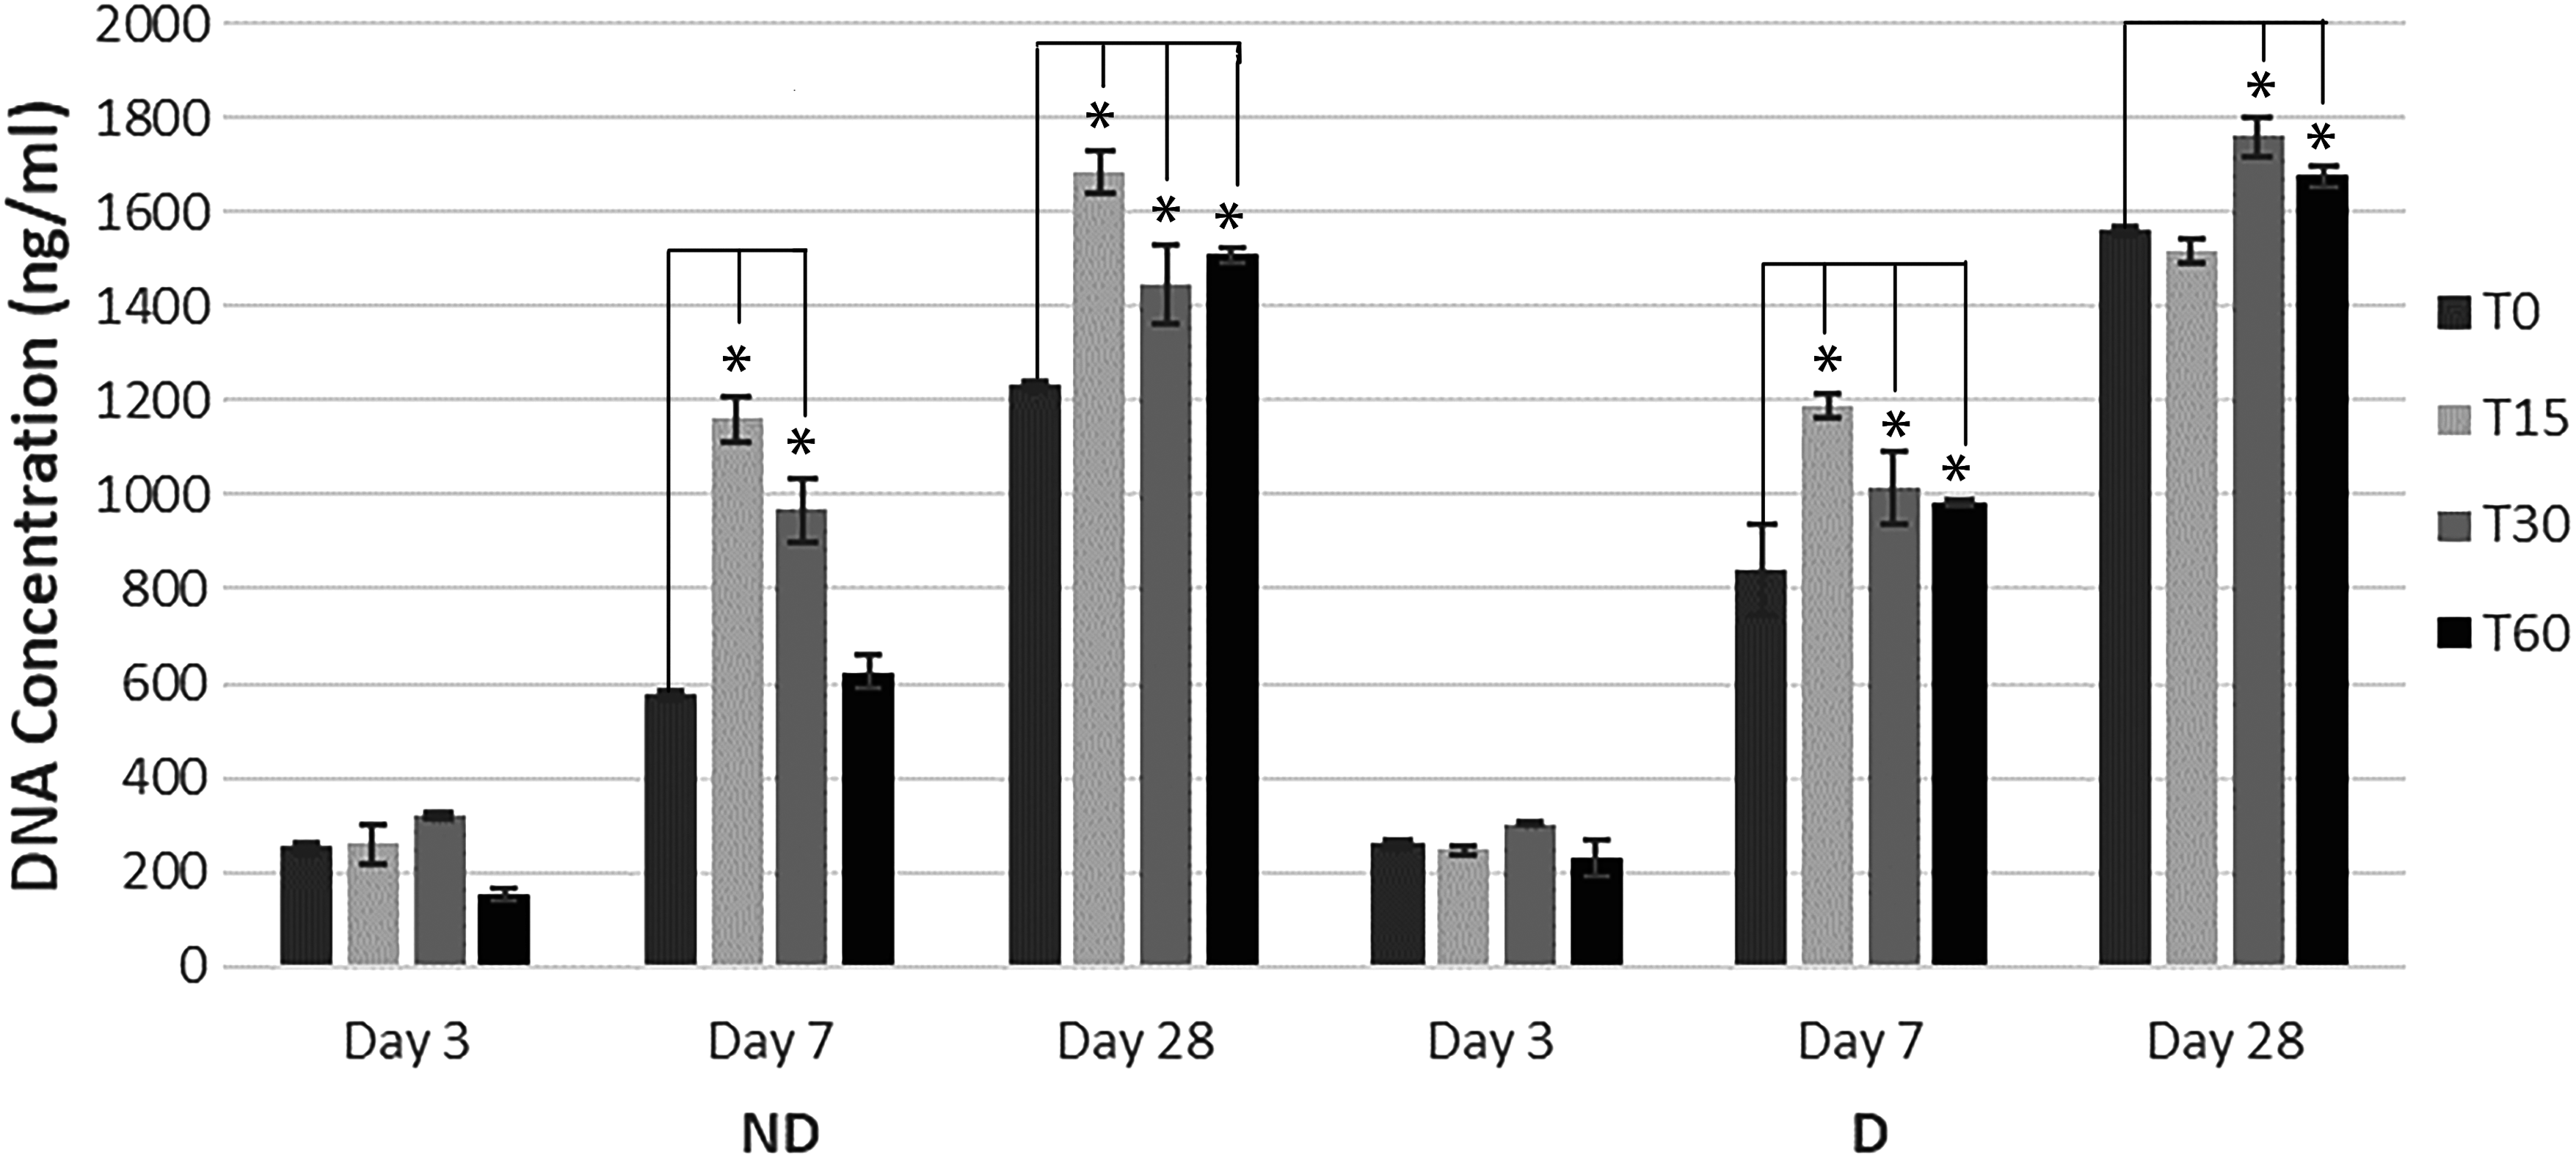
Concentration of DNA from lysed cells was quantified to indicate the cell number and proliferation; it was performed over the course of 4 weeks (*p < 0.05 compared with the control of each time point, n = 3).
Cell mineralization
Cell mineralization is indicated by the formation of mineralized nodules or the so-called calcium deposition in ECM, which can be quantified through calcium ion concentration quantification. The fixated cells' nodules could also be stained using Von Kossa and Alizarin Red dyes.31,32 The amount of calcium ions quantified from the samples was normalized against the DNA quantification, and it is presented in Figure 7. On day 7, the calcium ions concentration was considerably low for all the groups. On day 28, calcium ions detected for those cultured in growth medium were similar to what had been observed on day 7. However, for cells cultured in differentiation media, there was at least 10-fold increase of calcium content across all groups including the control (D-T0). PEMF-exposed samples in differentiation media did not show significant difference compared with the control.
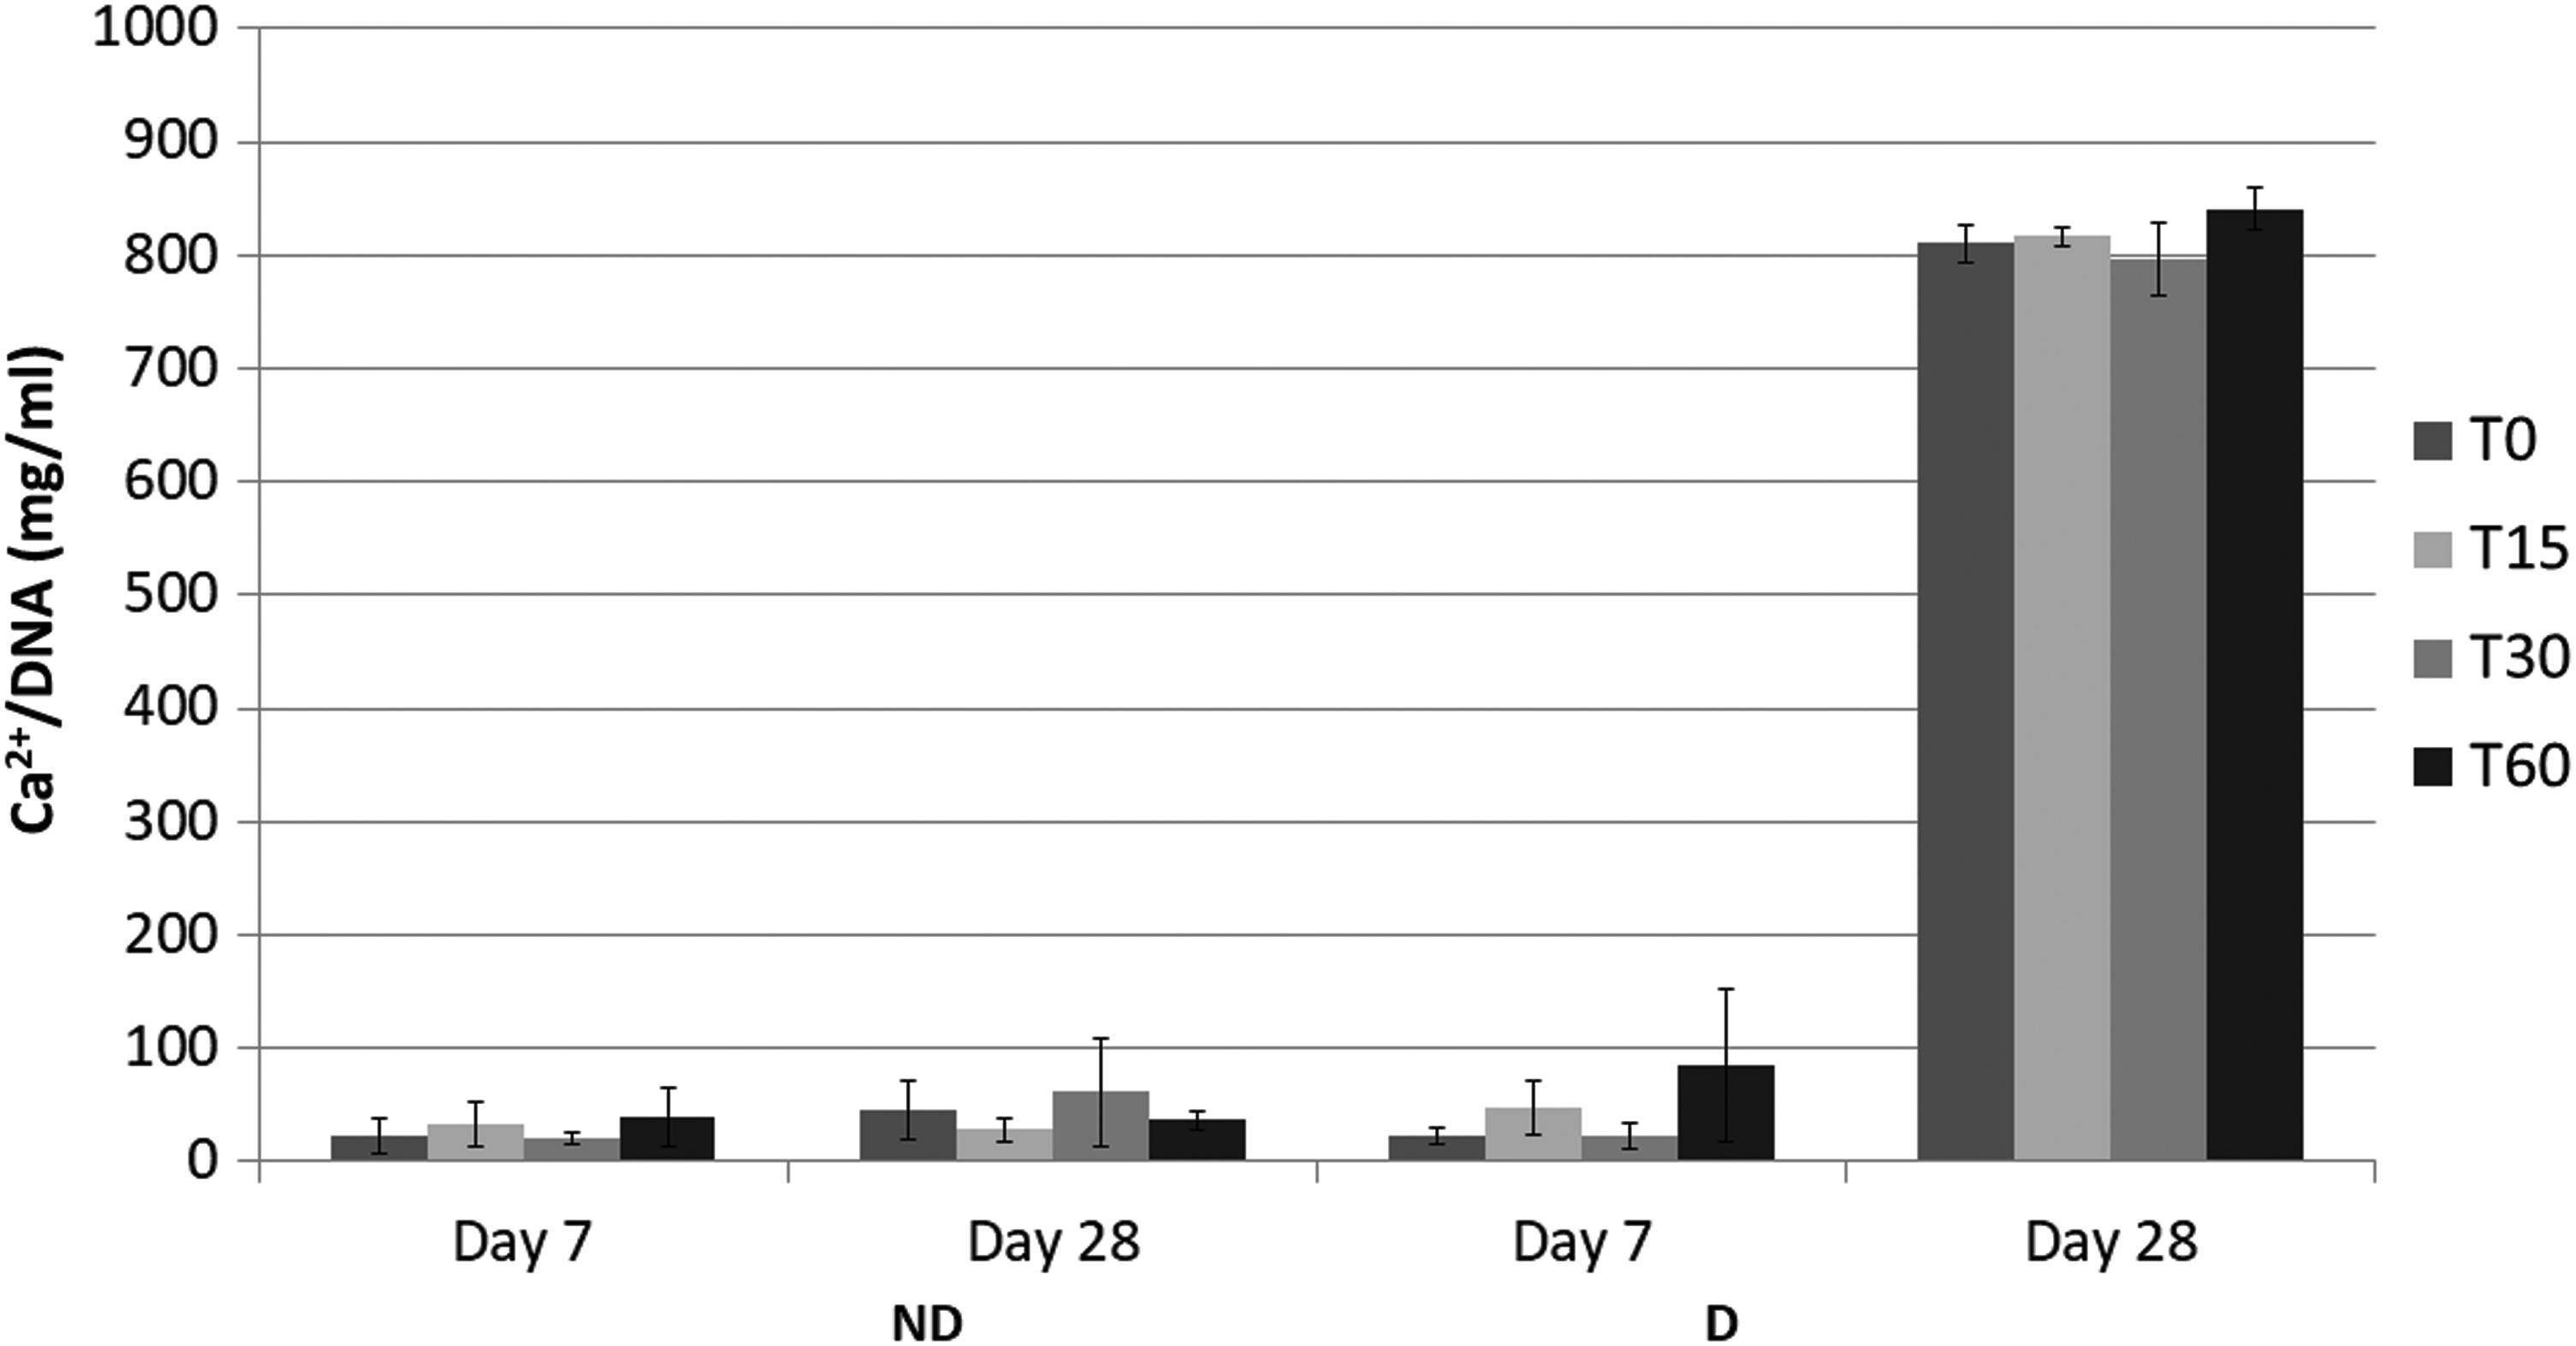
Calcium ions quantification on early proliferative stage (day 3 and 7) and late differentiation stage (day 28) after normalization with DNA concentration (n = 3).
The presence of mineralization nodules on day 28 were obviously observed as shown in Figure 8. Von Kossa method stains the phosphate group in calcium salt, turning the color into metallic black as shown in Figure 8B, whereas Alizarin Red S stains the nodules by chelation with calcium ions, resulting in a red color (Fig. 8A). 32 The intensity of the stain that covered part of the wells was similar across the groups.
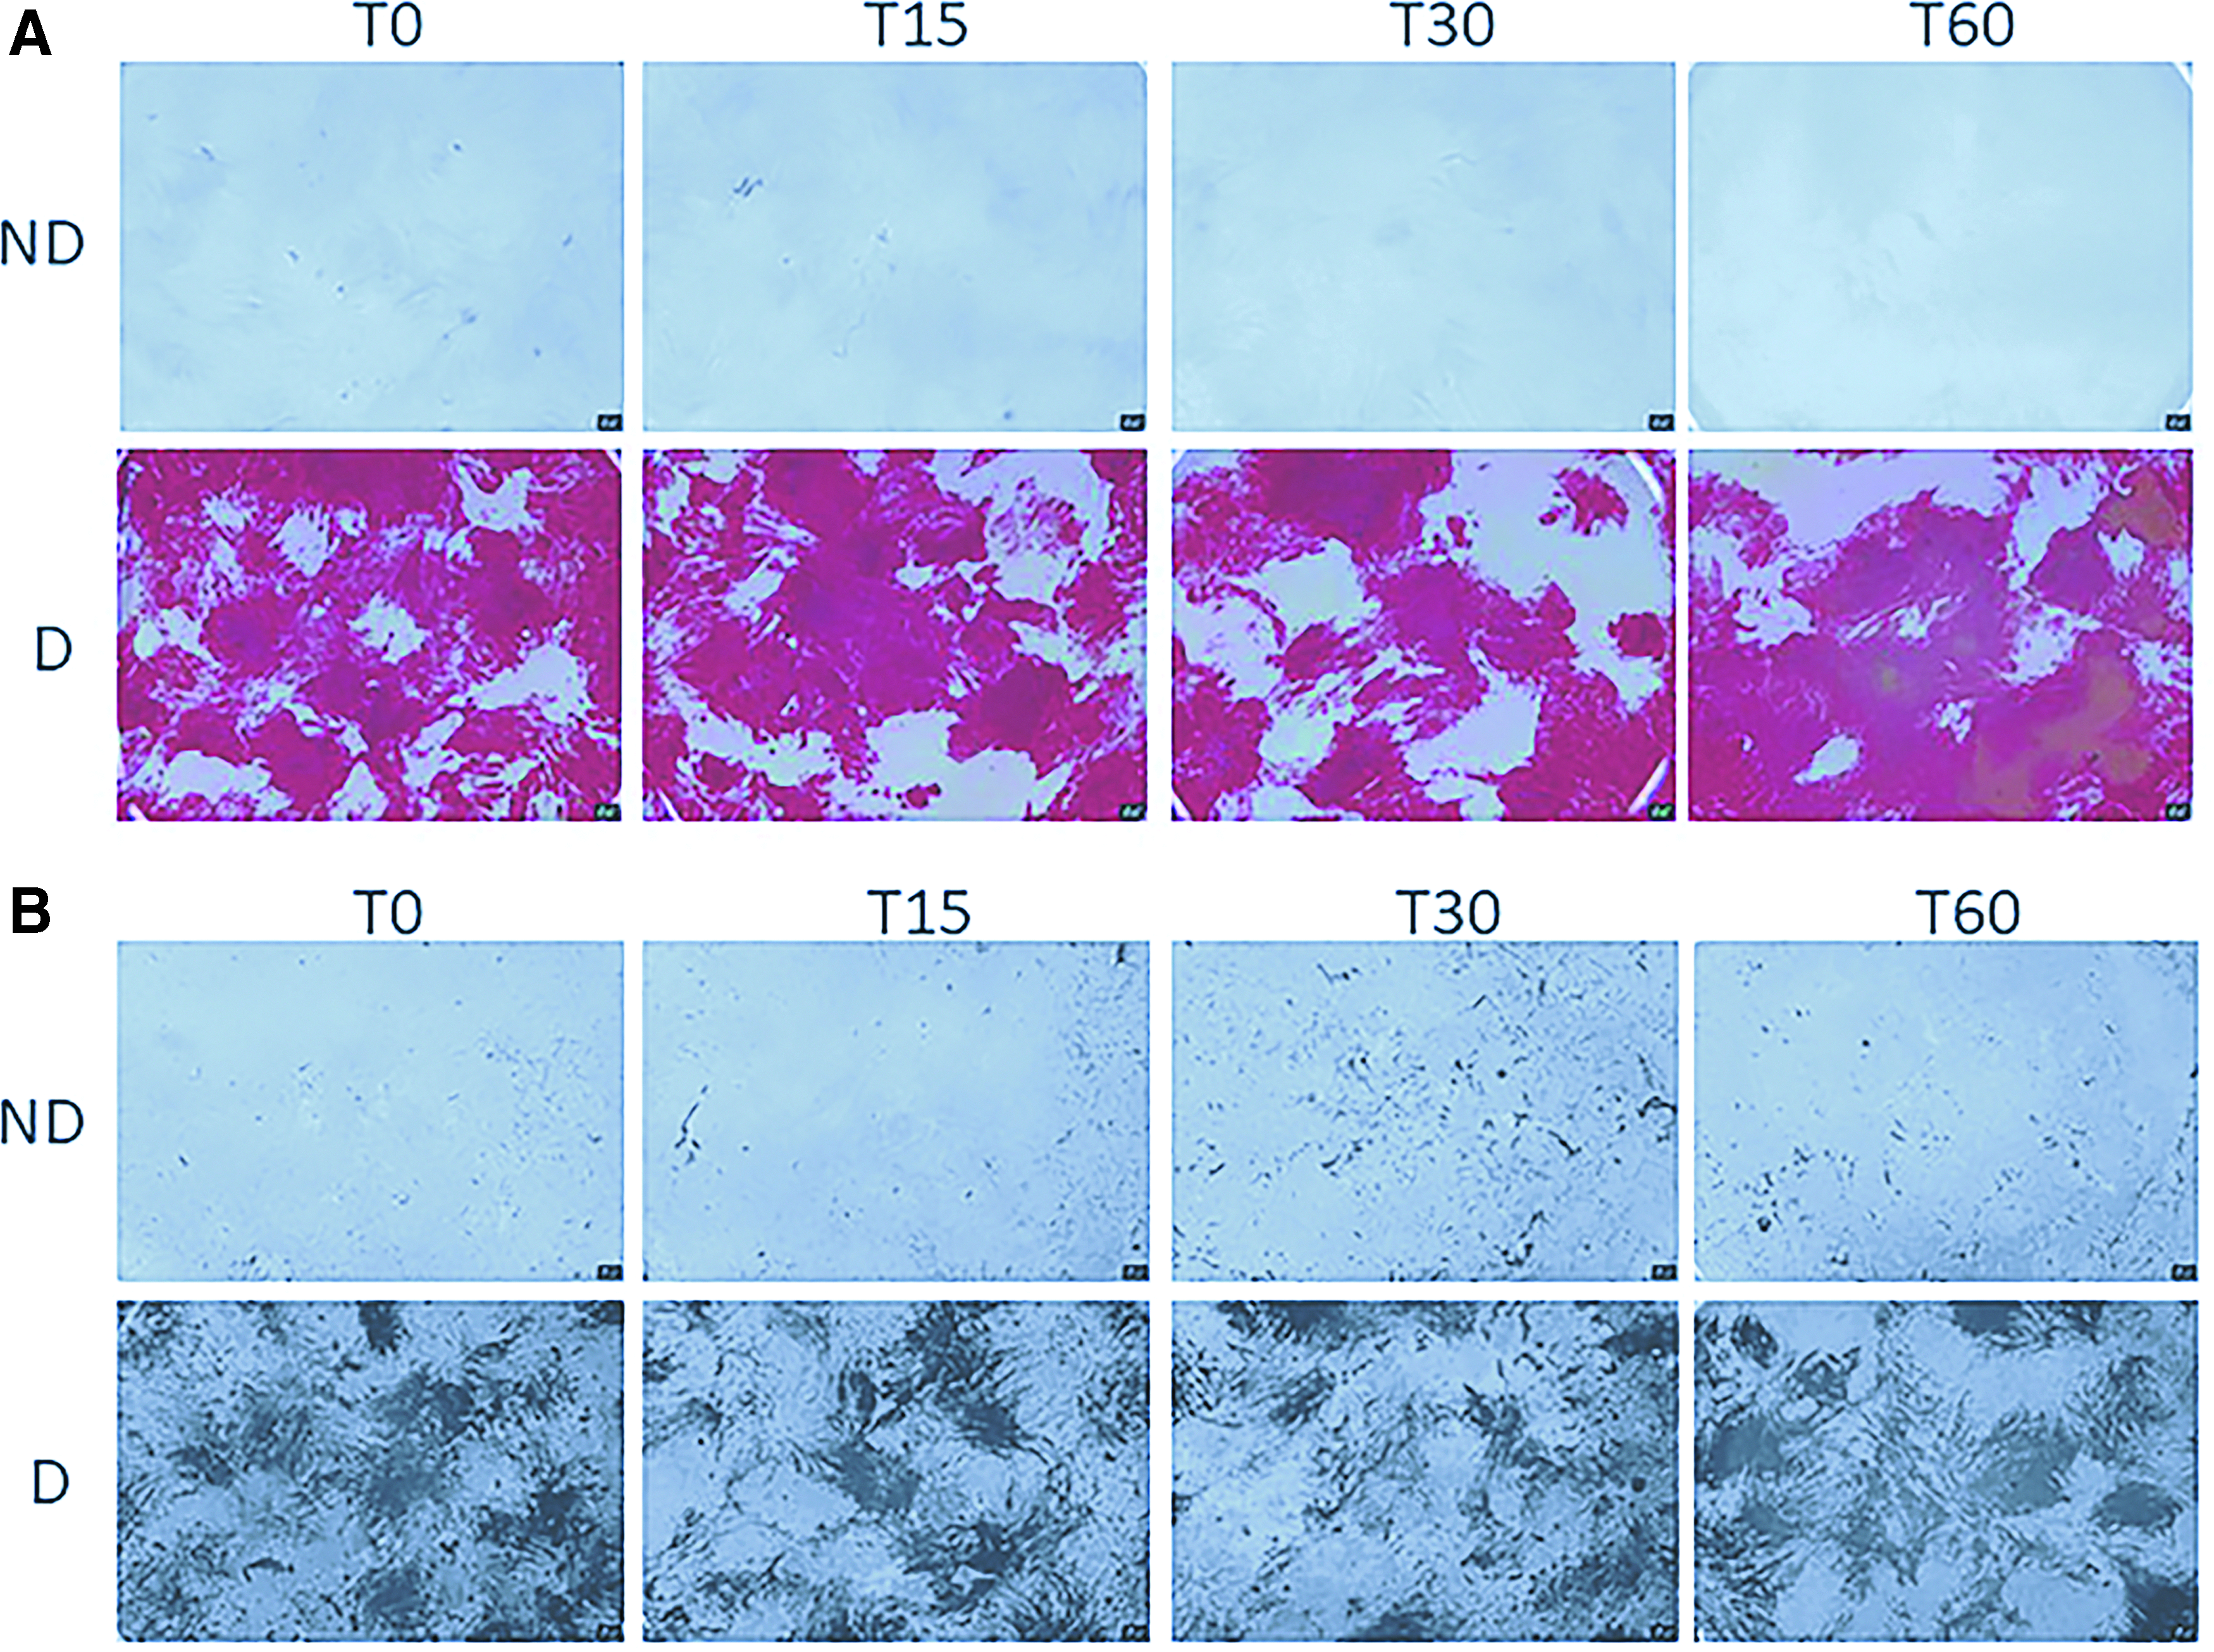
Mineral deposition staining on day 28.
Osteogenic gene expression
Two osteogenic-related gene markers were evaluated and quantified: BSP and OC. Both markers were normalized to housekeeping gene marker-GAPDH. On day 7, all D groups showed significant upregulation for BSP, an early bone osteogenic differentiation marker (Fig. 9A), whereas all ND groups demonstrated negligible upregulation (data not shown). D groups displayed higher relative normalized expression (RNE) values compared with ND groups, ranged from approximately two- to eight-fold higher. D-T30 had approximately three times higher RNE values compared with D-T0. On day 28, a late bone marker, OC, was upregulated in all samples. The PEMF-untreated samples cultured in differentiation media (D-T0) showed the highest RNE value, at least 1.2 times more compared with the PEMF-treated groups cultured in osteogenic media.
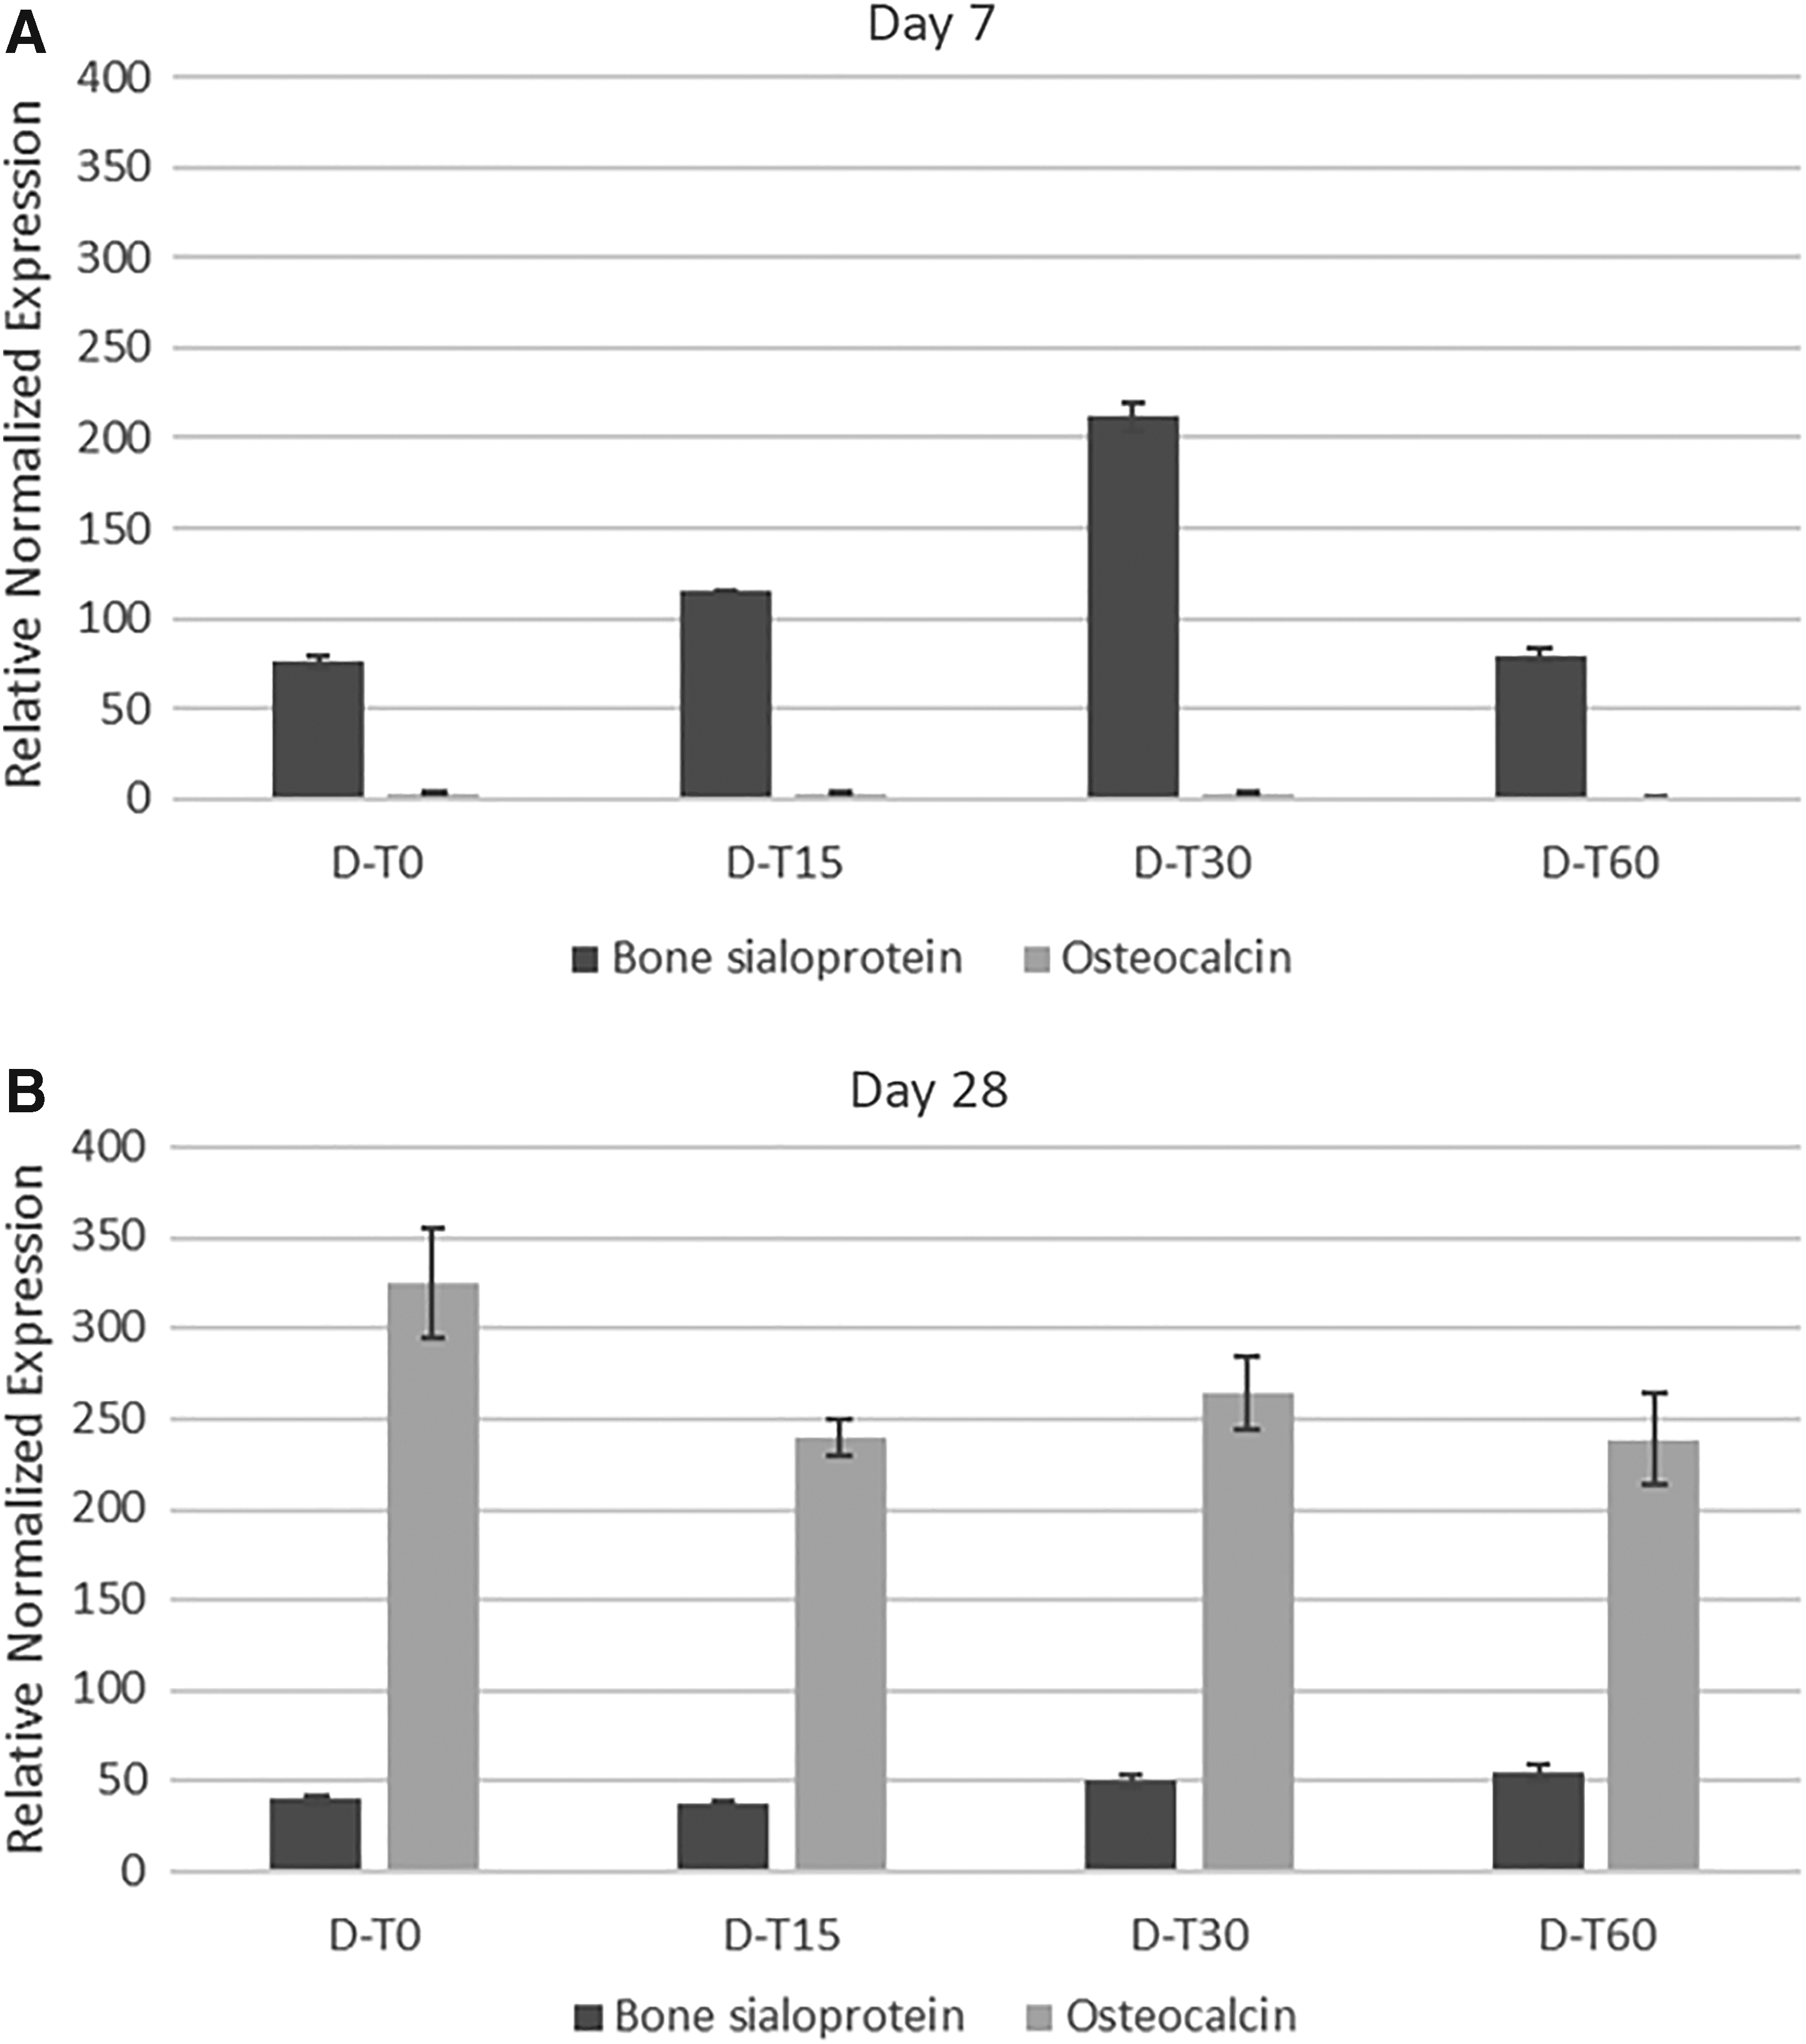
Gene expression of early (bone sialoprotein) and late bone markers (osteocalcin) on
Discussion
Over the past decades of research, PEMF has clearly shown to have impacts on cell behavior, such as cell growth and differentiation in different types of cells including osteoblasts and bone MSC, whether it is suppressive or enhancement effect.13,22,23,29,33 For instance, Jansen et al. found that PEMF has aided human bone MSC to enhance osteogenic differentiation, at the expense of suppressed proliferation, 33 whereas other study using MSCs found that both osteogenic differentiation and proliferation are enhanced. 34 The treated samples show the proliferation of cells stopped at day 9 when the mineralization started. Therefore, they concluded that PEMF affects the earlier upregulation of certain osteogenic genes like BMP-2 to boost up early mineralization at the expense of staled proliferation. However, other study performed by Ferroni et al. on MSC showed that PEMF emitted by miniaturized electromagnetic device, which is originally used to enhance osseointegration in clinical setting, improves both proliferation and differentiation of MSCs through mTOR pathway in the presence of inflammation.
The results showed that the effect of PEMF was still present despite these conditions, indicated by higher upregulation of many osteogenic markers such as Runx, osteopontin, osteonectin, OC, collagen type I, ALP, and BMP-2 compared with untreated samples. 34
Our study was carried out on murine preosteoblastic cell line, MC3T3-E1, on a specific frequency of 50 Hz and intensity of 0.6 mT. PEMF is known for its ability of selective targeting, which means that at a certain range of frequency, duration, and intensity, PEMF would affect the viability of cells. 35 For example, a study performed with a breast epithelial cell line, MCF10, shows that PEMF with frequency ranging from 20 to 50 Hz, intensity ranging from 2 to 5 mT, and duration ranging from 30 to 90 min maintained the viability of MCF10. 35 This result was similar to what we found in MC3T3 cells metabolism. Even though there was a slight decrease of cell metabolism activity as exposure duration increases on day 28 (reflected in alamarBlue result in Fig. 5), there was no statistically significant difference between the PEMF-treated and untreated samples. The live/dead staining implied the similar viability among the two groups (Fig. 4). MC3T3 cells were able to withstand the effects of PEMF leaving the viability mostly unaffected could be an indication of the ability of nonmalignant cells to buffer the calcium signal altering as previous studies had shown.36–38
Enhanced cell proliferation observed was demonstrated by the amount of DNA quantified, which is proportional to the cell number. 39 On day 28, the DNA content of each sample group was still higher than day 7, indicating that the cells were still proliferating even though they were already confluent (Fig. 2). The hypothesis explaining this phenomenon would be the ability of MC3T3 cells to forming layer over layers postconfluency as stated by Sudo et al. previously 40 or the change in cell size. 41 Fifteen minutes of daily exposure to PEMF had shown to increase the cell numbers by nearly double the amount of the untreated groups on day 7 even in the absence of osteogenic supplements, which were known to be able to boost cell proliferation before differentiation stage. 42
Similar results were observed in another study performed using MC3T3 by Jing et al., which showed that cell proliferation was significantly enhanced under the effects of PEMF. 43 Generally, the DNA concentration for PEMF-treated groups are still higher compared with untreated samples on day 7 and 28. However, the longer the duration of exposure was, the less prominent effects it had on the cell proliferation. Our result was in agreement with some other studies that show longer exposure of PEMF did not always mean better cell growth; overexposure to PEMF had even caused detrimental effects in some cases as it suppressed cell proliferation and increased the chance of chromosomal aberration.35,44,45 Therefore, this particular set of PEMF parameters (0.6 mT, 50 Hz, and 15 min) has shown to enhance proliferation before differentiation without affecting the cell viability.
One of the physical signs for osteogenic differentiation of cells in vitro is ECM deposition and calcification. 31 On day 28, the calcification has occurred in D groups, which had been successfully stained by Alizarin Red and Von Kossa. These two methods confirmed the presence of calcification. Von Kossa's silver nitrate solution stained phosphate group presented in calcium salts. 46 Von Kossa method does not specifically bind to calcium; and Alizarin Red needs to be done to confirm the presence of calcium as it forms a chelate with calcium cation. 32 The calcium nodules found in phase-contrast images on day 28 (Fig. 2C) were similar to what have been found in mouse calvarial osteoblast in the study by Taylor et al., where they have reported that these nodules appeared at the last stage of differentiation. 31
In our experimental setting, we have found that matrix mineralization occurred mainly due to the chemical stimulation by osteogenic components supplemented in D media and was not heavily influenced by the PEMF exposure. This phenomenon was apparent on day 28 when only the cells cultured in D media showed a steep increase of calcium ion numbers compared with those cultured in ND media. The untreated samples (D-T0) show similar quantity of calcium content to the PEMF-treated ones.
Our finding was in agreement with the previous studies where PEMF did not affect cell mineralization in both MSCs 3 and calvarial osteoblasts. 47 Previous studies on calvarial osteoblast had shown that PEMF affected the cell growth more during the proliferative stage by regulating and enhancing the intracellular calcium ions to activate a cascade of reactions directing the cell population to reach confluency since cell ECM secretion usually starts when cells are confluent. 47 Thus, it suggested that PEMF may improve the bone formation through the enhancement of cell numbers in the beginning, not by increasing matrix mineralization. 47
Although PEMF does not seem to affect the cell mineralization, our study shows that PEMF affects osteogenic differentiation on mRNA level, as demonstrated from RT-PCR result of BSP and OC gene expression. These two genes were chosen because they had shown a prominent correlation between the upregulation of genes and cell mineralization. 30 It is also widely known that both genes play important roles in the formation of bone, even though each is expressed in different timing.
Through p38/MAPK signaling cascades, BSP is upregulated during early formation of bone, whereas OC is upregulated during the late stage of osteogenesis.48,49 BSP was upregulated in D groups on day 7 when D-T30 showed the highest expression of the marker. Similar result was reported by Jansen et al. whereby the BSP upregulation was observed early on day 9 of the experiment in the presence of osteogenic media. 33 This finding suggested the idea that PEMF affects cells osteogenic induction dominantly before confluency and mineralization stage.
However, late bone gene marker, OC, was upregulated in D groups, even though PEMF-treated samples did not show higher gene expression at the late stage of differentiation. This upregulation might be due to the effects of the combination of PEMF and osteogenic supplements that induce the differentiation and mineralization.24,47 However, the induction by PEMF alone may not reach the threshold to trigger mineralization in ND groups.
Conclusion
In summary, PEMF with intensity of 0.6 mT and 15 min exposure time influenced MC3T3-E1 cell proliferation, demonstrating the most enhancing effect on proliferation. However, PEMF alone, regardless of exposure time, did not significantly influence the mineralization or cellular viability of MC3T3 cells. Interestingly, exposure of 30 min (day 7) managed to upregulate BSP, a significant early bone marker, whereas the late bone marker OC was affected mostly by the osteogenic supplements in the media. Taken together, the results from this study suggested that optimal PEMF stimulation parameters and osteogenic media supplements are needed to effectively regulate cell proliferation, differentiation, and mineralization. There are indeed no “one size fits all” parameters of PEMF stimulation. Synchronization of these parameters of PEMF is essential for noninvasive treatment modality in a clinical setting to achieve the desired effects in osseous defects.
Footnotes
Acknowledgment
The authors acknowledge the financial support from the MOE2016-T2-2-108 and A*STAR (IAF-PP, H17/01/a0/0S9).
Disclosure Statement
No competing financial interests exist.