
Abstract
Low back pain related to intervertebral disk (IVD) degeneration has a major socioeconomic impact on our aging society. Therefore, stem cell therapy to activate self-repair of the IVD remains an exciting treatment strategy. In this respect, tissue-specific progenitors may play a crucial role in IVD regeneration, as these cells are perfectly adapted to this niche. Such a rare progenitor cell population residing in the nucleus pulposus (NP) (NP progenitor cells [NPPCs]) was found positive for the angiopoietin-1 receptor (Tie2+), and was demonstrated to possess self-renewal capacity and in vitro multipotency. Here, we compared three sorting protocols; that is, fluorescence-activated cell sorting (FACS), magnetic-activated cell sorting (MACS), and a mesh-based label-free cell sorting system (pluriSelect), with respect to cell yield, potential to form colonies (colony-forming units), and in vitro functional differentiation assays for tripotency. The aim of this study was to demonstrate the efficiency of three widespread cell sorting methods for picking rare cells (<5%) and how these isolated cells then behave in downstream functional differentiation in adipogenesis, osteogenesis, and chondrogenesis. The cell yields among the isolation methods differed widely, with FACS presenting the highest yield (5.0% ± 4.0%), followed by MACS (1.6% ± 2.9%) and pluriSelect (1.1% ± 1.0%). The number of colonies formed was not significantly different between Tie2+ and Tie2− NPPCs. Only FACS was able to separate into two functionally different populations that showed trilineage multipotency, while MACS and pluriSelect failed to maintain a clear separation between Tie2+ and Tie2− populations in differentiation assays. To conclude, the isolation of NPPCs was possible with all three sorting methods, while FACS was the preferred technique for separation of functional Tie2+ cells.
Impact Statement
Tissue-specific progenitor cells such as nucleus pulposus progenitor cells of the IVD could become an ultimate cell source for tissue engineering strategies as these cells are presumably best adapted to the tissue's microenvironment. Fluorescence-activated cell sorting seemed to outcompete magnetic-activated cell sorting and pluriSelect concerning selecting a rare cell population from IVD tissue as could be demonstrated by improved cell yield and functional differentiation assays.
Introduction
In our aging society, low back pain (LBP) has become an increasing problem for individuals as well as the society.1–3 LBP is often associated with intervertebral disk (IVD) degeneration, mainly in the elderly, and IVD injury, which is more frequent in the younger population. Possible treatment options for LBP range from medical therapies, removal of IVD tissue followed by fusion of adjacent vertebrae, to IVD prosthesis, while preferring nonfusion approaches for younger patients. 4 The common drawback of all these methods is that they do neither restore the IVD tissue properties nor target the cause of pain and rather aim to reduce the symptoms of LBP. Moreover, spinal fusion can, apart from perioperative complication, lead to long-term adverse outcome as nonfusion or adjacent segment degeneration. Novel therapeutic approaches on the molecular and cellular levels are highly desirable.5,6 Hence, recent research has drawn its focus on the application of stem cells or cells native to the IVD to restore the biological function of the disk.5,7,8 The challenge of cell therapy for IVD regeneration lies in the fact that the avascular IVD microenvironment is acidic, hypoglycemic, and hypoxic, which forms an obstacle for the application of exogenous cells to survive and exhibit their therapeutic function. 9 Diverse cell populations have been proposed for cell-based IVD therapies, and were presented in clinical trials, mesenchymal stromal cells (MSCs) being the most commonly clinically evaluated cell type.5,7,10–13 Thus far the administration of cells, mostly performed through injection into the IVD, seems to be safe and to alleviate pain, whereas disk regeneration has often not appropriately been assessed as in patients the follow-up treatment focuses mainly on pain assessment and magnetic resonance imaging.5,7
Traditionally, there were four cell types identified in the IVD: (1) nucleus pulposus (NP) cells (NPCs), (2) annulus fibrosus cells (AFCs), (3) notochordal cells (NCs), and (4) cartilaginous endplate (CEPC) cells.14,15 The recent discovery of a new cell candidate, the NP progenitor cell (NPPC) (Fig. 1), advances this research focus as this cell type might be involved in the innate maintenance of disk health. 16 NPPCs represent a rare subpopulation (∼1–5%) of the total NP cell population that possesses the ability for multilineage differentiation,16,17 and was shown to decrease markedly with age and to be nearly absent in persons >40 years. 16 Such NPPCs were identified and successfully isolated from human, bovine, murine, and canine NP tissues using fluorescence-activated cell sorting (FACS) through the angiopoietin-1 receptor (Tie2). 18 It is still to be clarified how these Tie2 positive (Tie2+) cells are related to MSCs and the recently closer characterized notochordal cells. 19 So far a study reported the expression of two classical MSC markers, CD29 and CD105, in NPPCs when compared with umbilical-cord-derived MSCs. 20 This result is in accordance with findings of niches for pluripotent stem cells in the disk itself or possibly in the nearby bone marrow of the vertebrae close to the CEPCs.21–23 It was reported that these NPPCs express to a fewer extent CD29 and CD105, the two classical MSC markers, when compared with umbilical-cord-derived MSCs using patient-derived cells. 20 There seems to be a niche for pluripotent stem cells in the disk itself or possibly also in the nearby bone marrow of the vertebrae close to the CEPCs.21–23
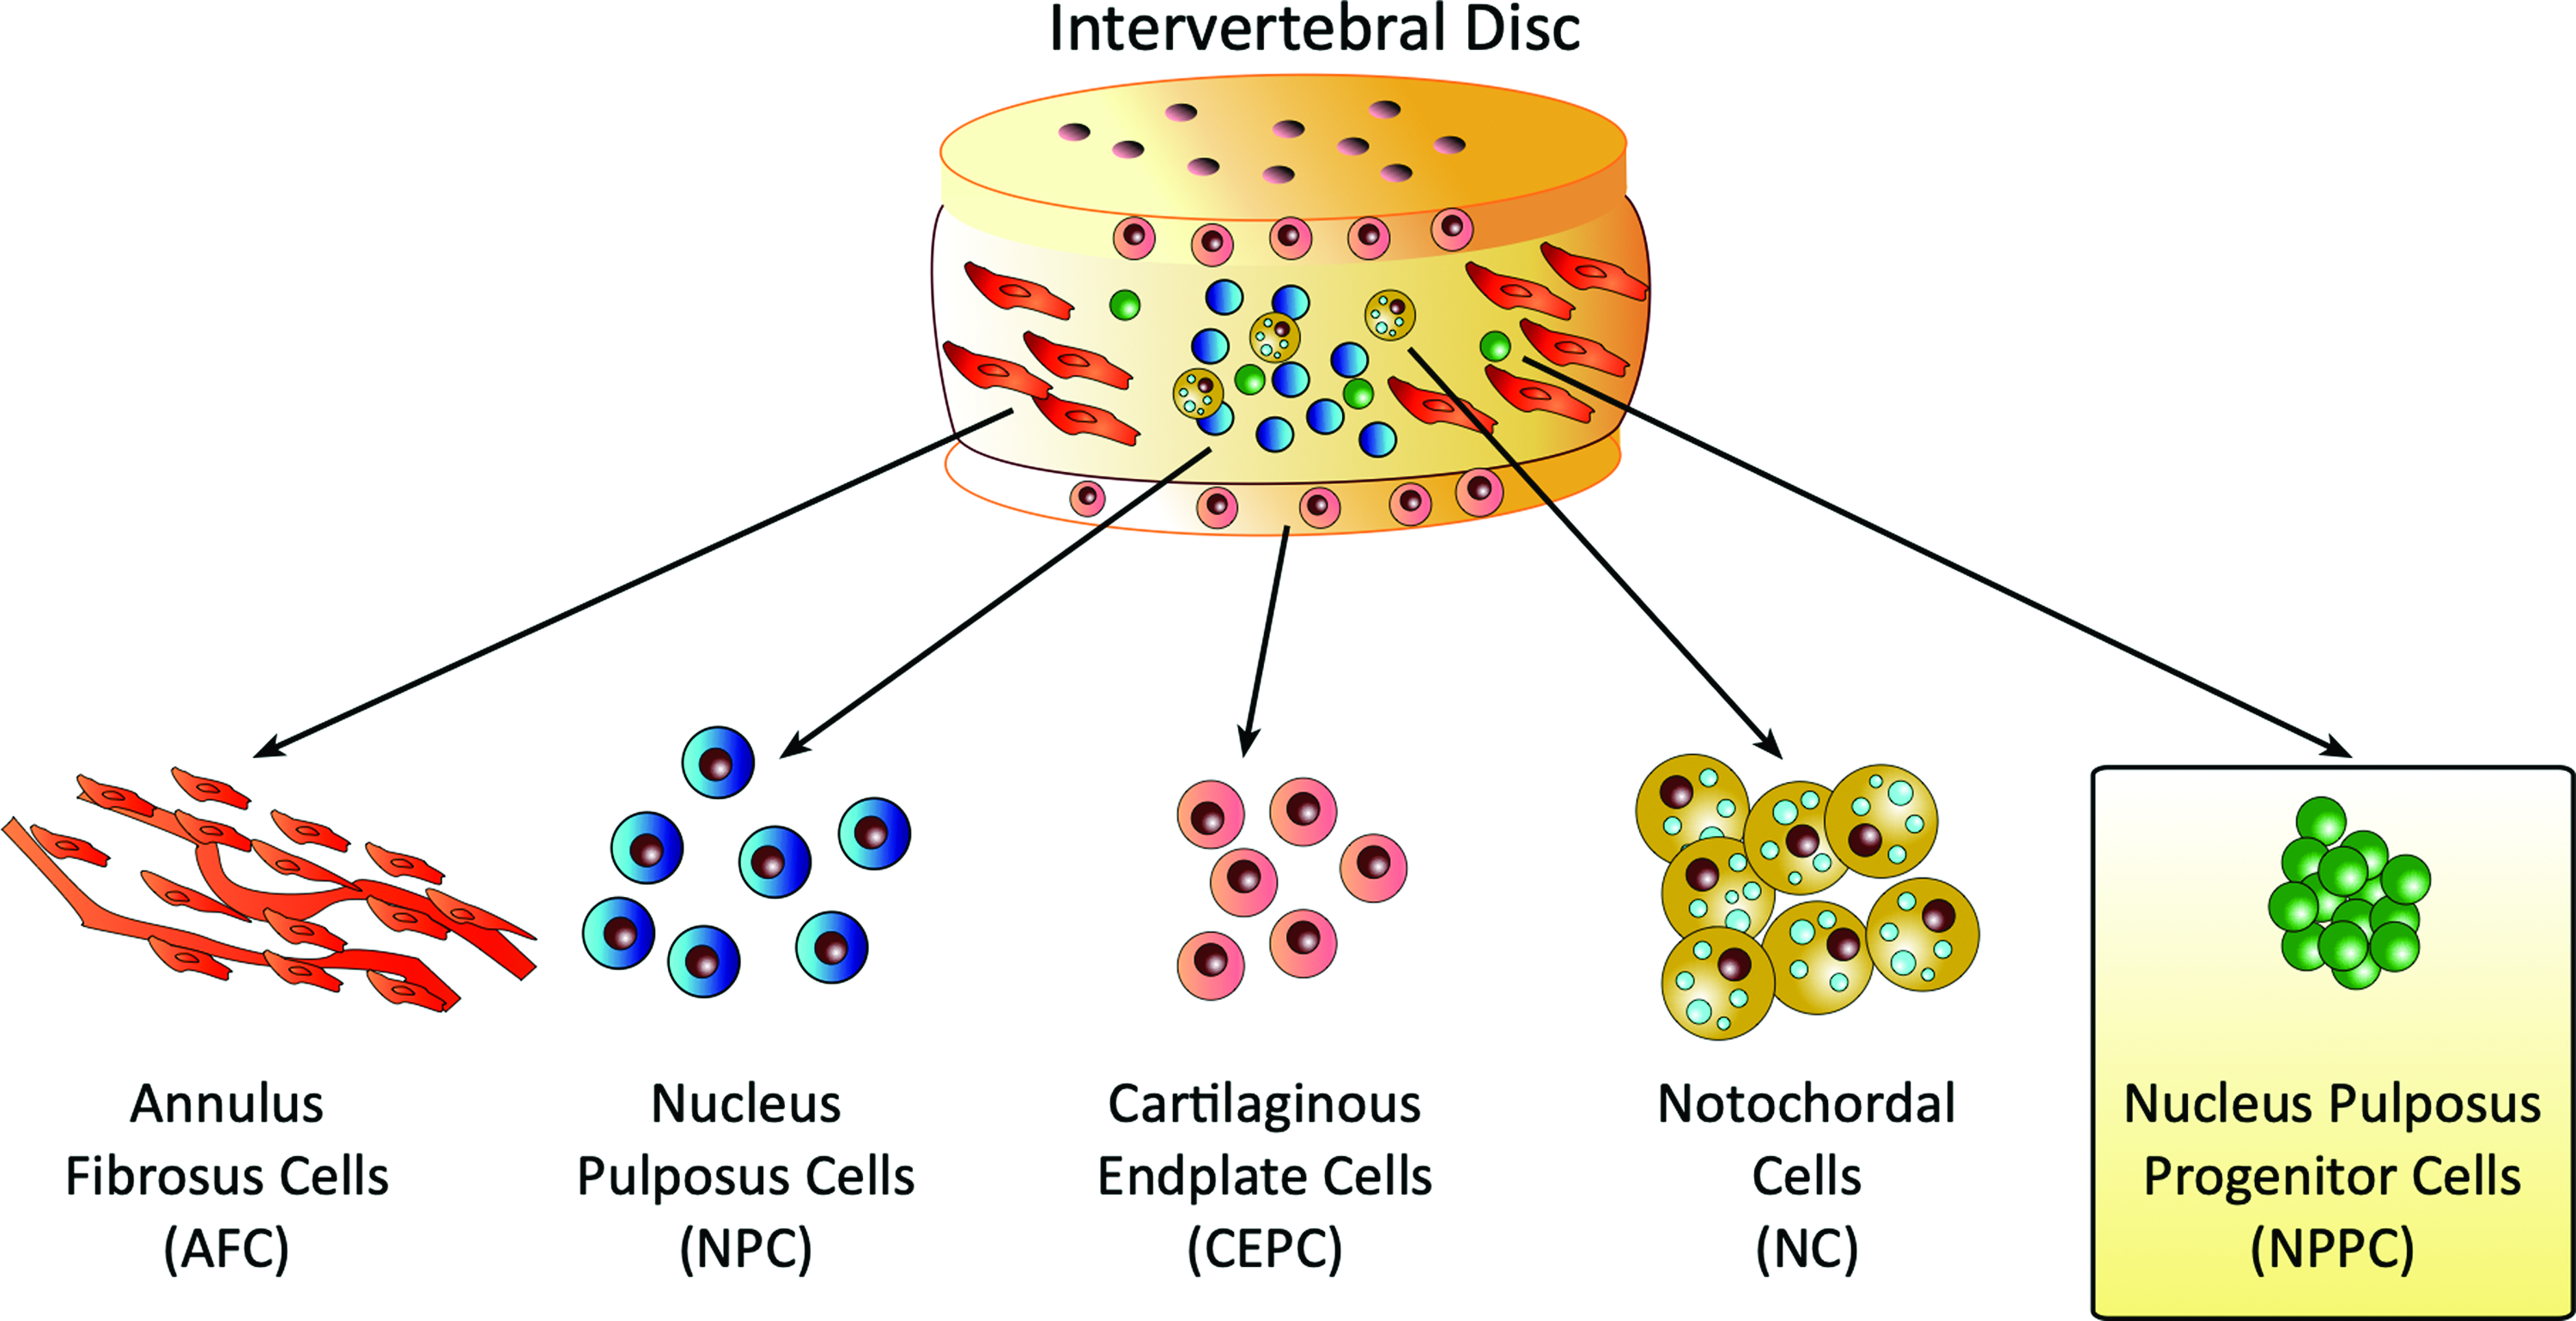
The “fifth element” in the IVD. Schematic drawing of the four major cell types for the IVD tissue that were known for a longer time: (1) AFC, (2) NPC, (3) CEPC, (4) NC, and very recently (5) NPPC. AFC, annulus fibrosus cell; CEPC, cartilaginous endplate; NC, notochordal cells; NPC, nucleus pulposus cells; NPPC, nucleus pulposus progenitor cells. Color images are available online.
Recently, it was reported that the ability to form colonies of isolated NPPCs from human surgical samples is dependent on Pfirrmann grading of the disk.24,25 Despite their early fading, the study of this marginal subpopulation within the NP might give rise to a better understanding of how these cells affect IVD health, and what conditions are required to maintain them longer. Moreover, a deeper understanding might lead to new approaches for regeneration of the IVD. Considering possible clinical application of NPPCs, in this study we aimed to investigate new methods for the isolation of NPPCs from NP tissue, that is, magnetic-activated cell sorting (MACS) and pluriSelect, a size-based cell sorting system (Fig. 2). These techniques do neither involve high-voltage acceleration nor non-FDA-approved fluorescent staining nor internalization of magnetic beads, rendering them more suitable for accelerating research and translation of NPPC toward the clinic. The three sorting methods, that is, FACS, MACS, and pluriSelect were compared for yield of Tie2+ cells. Furthermore, the sorted Tie2+ and Tie2-negative (Tie2−) cells were characterized by their effect on colony formation, and their functional capacity for differentiation toward the adipogenic, osteogenic, and chondrogenic lineage was assessed.
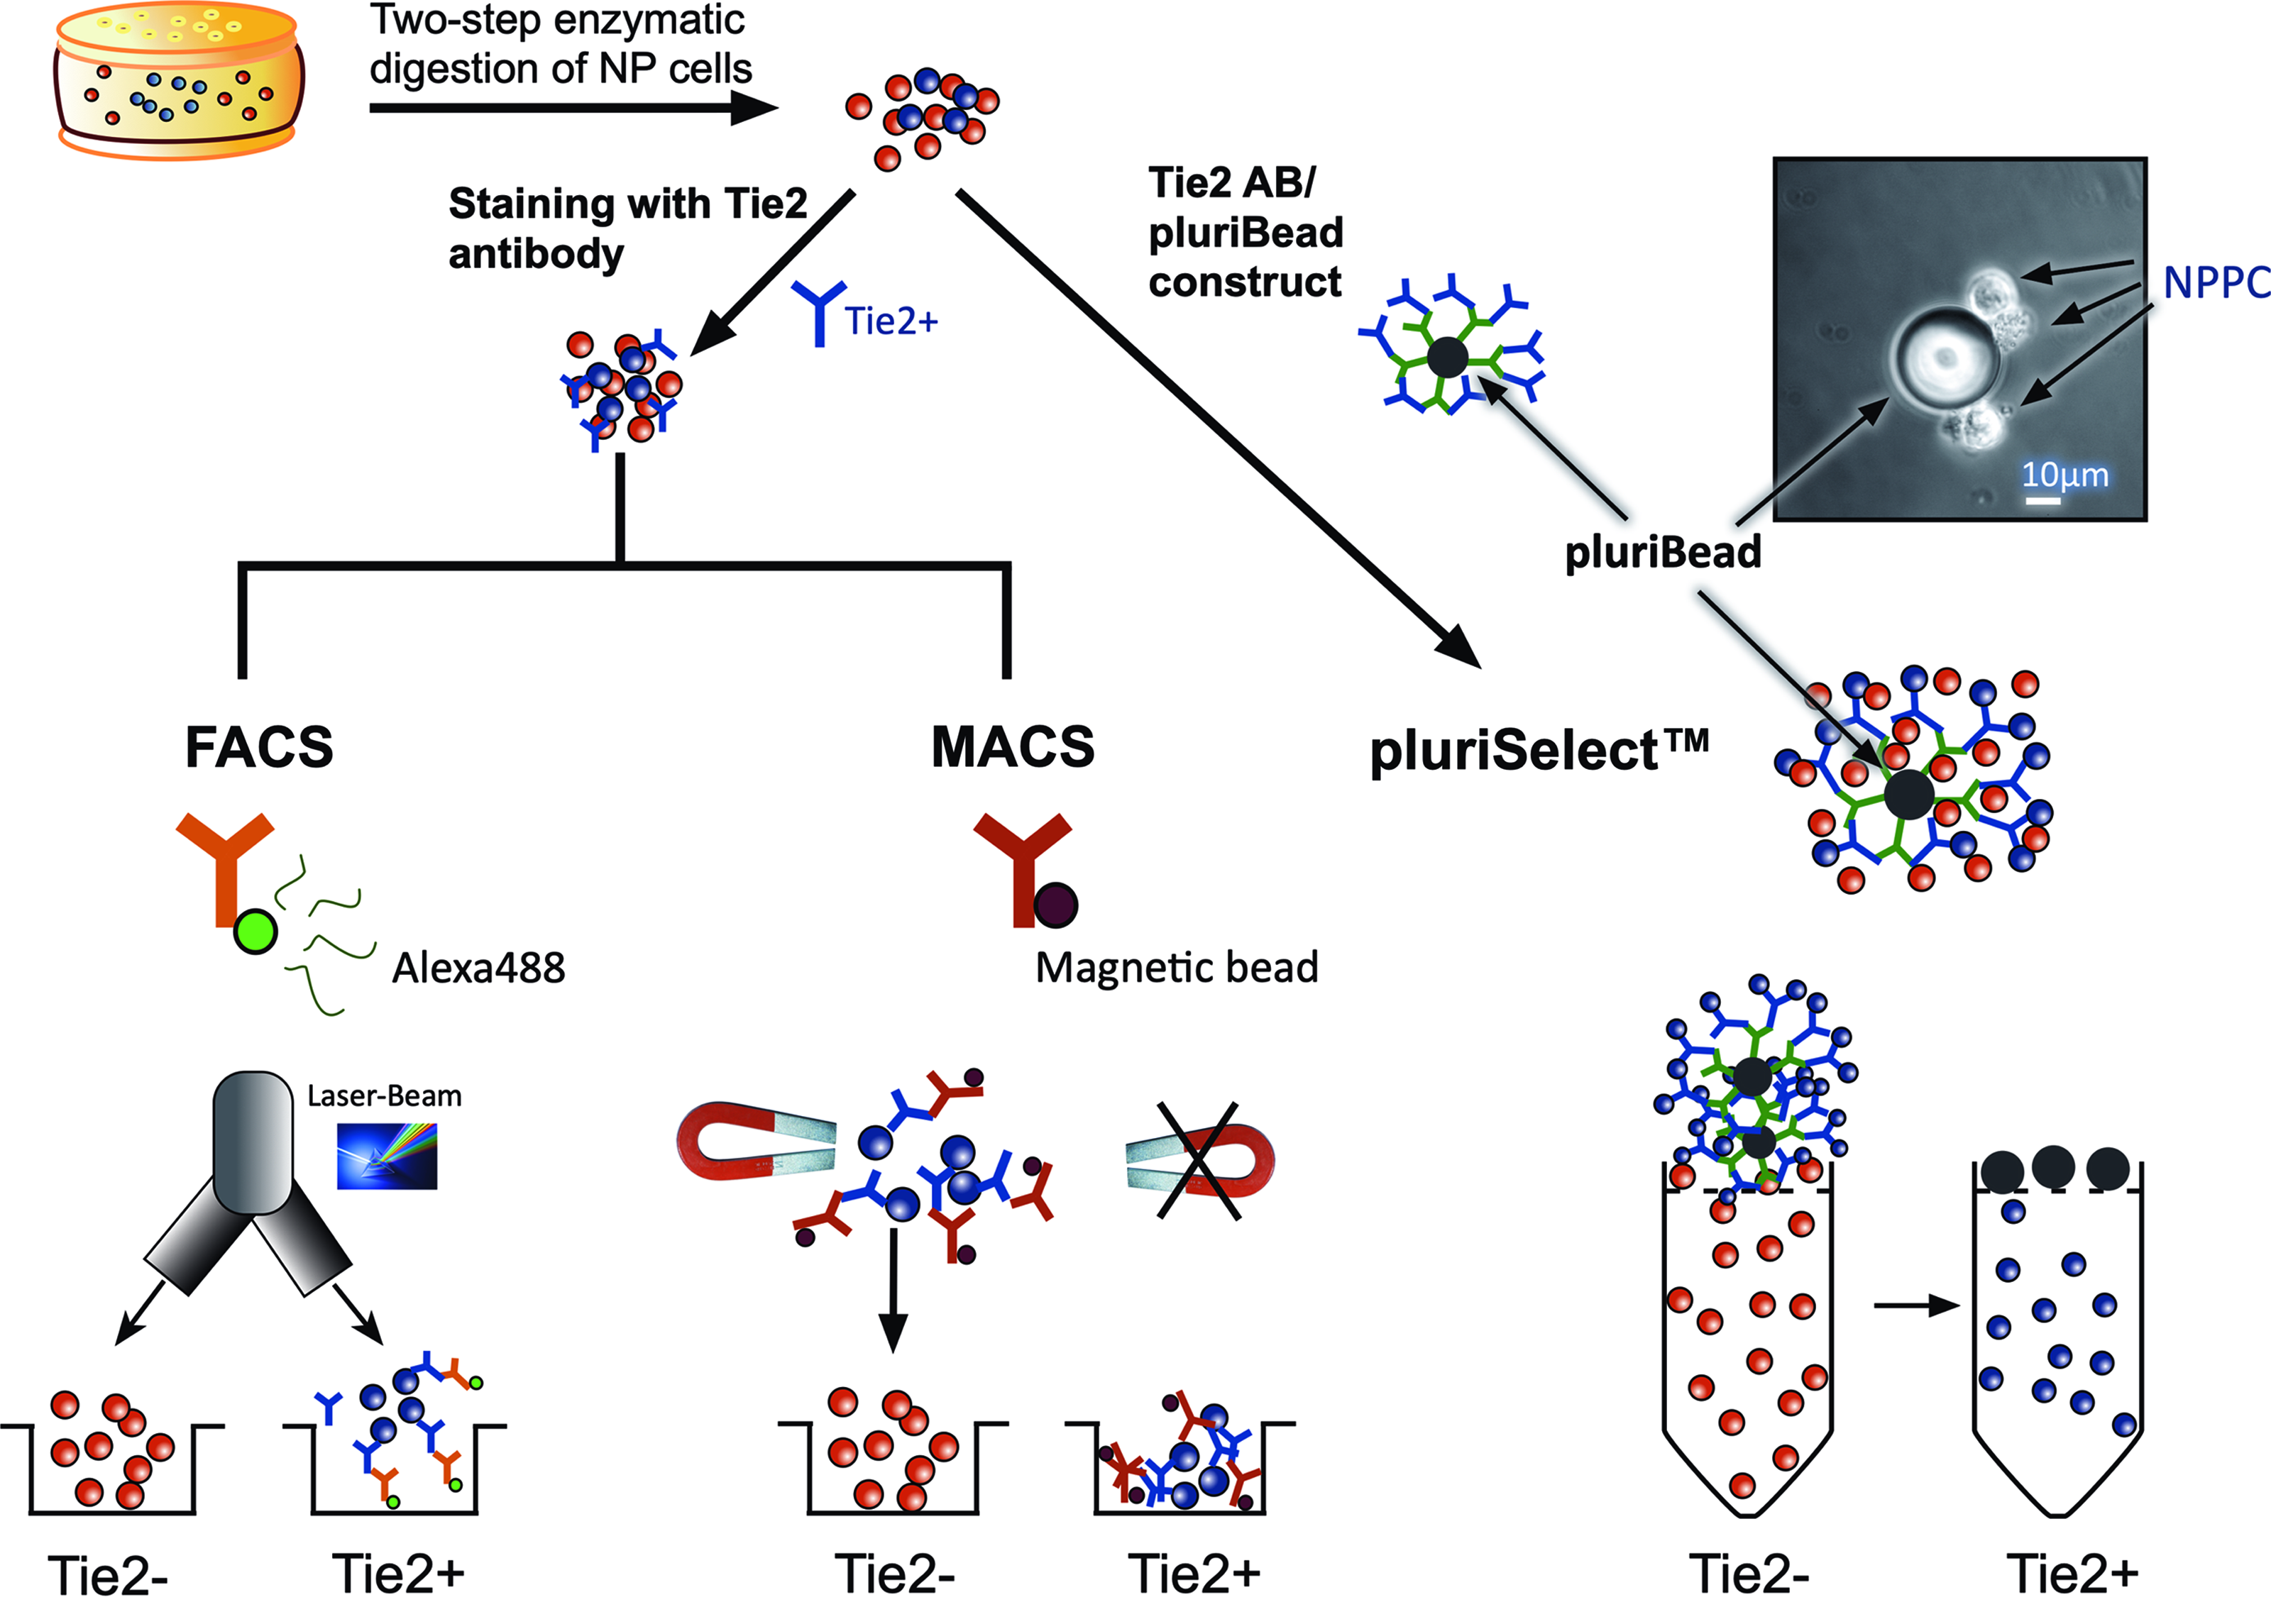
Experimental design. Different cell sorting methods used to isolate Tie2+ NP cells. After sequential matrix digestion by 0.19% pronase and 825 U collagenase type II NP cells are sorted either by, from left to right, FACS, MACS, and pluriSelect (insert shows NPPC Tie2+ cells attached to a pluriBead). FACS, fluorescent-activated cell sorting; MACS, magnetic-activated cell sorting; NP, nucleus pulposus; Tie2+, Tie2 positive. Color images are available online.
Materials and Methods
NPC isolation
NP tissue was harvested from coccygeal bovine IVDs of 10- to 14-month-old animals that were obtained from a local abattoir within 4 h after death. For each cell sorting method, NP cells of two bovine tails were pooled. Due to the rarity of these cells the three sorting methods were tested sequentially and not in parallel. NP tissue was minced, the matrix was digested following a sequential digestion protocol.18,26 In brief, the tissue was first incubated in a 0.19% pronase solution (Roche, Basel, Switzerland) for 1 h, followed by overnight digestion in collagenase type II (825 U/mL; Worthington, London, United Kingdom). The following day the remaining tissue debris was removed by filtering the cell suspension through a 100 μm cell strainer (Falcon; Becton Dickinson, Allschwil, Switzerland). The cell viability was determined by trypan blue exclusion, and the cells were immediately processed for further analysis.
Fluorescence-activated cell sorting
Tie2+ cells were sorted using FACS as previously described.17,18 In short, freshly isolated NPCs (N = 9) were incubated with antirat Tie2/CD202b polyclonal rabbit antibody (10 μg/mL, clone bs-1300R; Bioss Antibodies, Woburn, MA) for 30 min on ice in 100 μL of FACS buffer (phosphate-buffered saline [PBS] with 0.5% bovine serum albumin [BSA] and 1 mM EDTA, all from Sigma-Aldrich, Buchs, Switzerland), followed by incubation with goat antirabbit antibody conjugated with goat antirabbit IgG (H+L) cross-adsorbed secondary antibody, Alexa Fluor 488 (cat. no. A-11008; ThermoFisher Scientific, Basel, Switzerland) for 30 min on ice and protected from light. Propidium iodide (Sigma-Aldrich) was used to exclude dead cells. Cell sorting was performed by FACS Diva III (BD Biosciences, Brussels, Belgium) and analyzed with FlowJo software, version 10.4.2 for Mac OS X (Treestar, Ashland, OR) based on the procedure previously reported by Sakai et al. 18 IgG Isotype control (BD Biosciences) was used to set the gate for sorting as described previously. 17
Magnetic-activated cell sorting
Magnetic separation was performed by incubation of NPCs (N = 7) for 30 min on ice with the identical primary antibody used for FACS against Tie2 (20 × 106 cells) in 100 mL of MACS buffer (PBS supplemented with 0.5% BSA and 2 mM EDTA, pH 7.2). This was followed by a washing step and resuspension in 80 μL of MACS buffer with 20 μL antirabbit IgG MicroBeads according to the protocol of the manufacturer (#130-048-602; Miltenyi Biotec GmbH, Bergisch Gladbach, Germany). The cells were washed once more after 15 min of incubation at 4°C. After conditioning the MACS column (MS Column #130-042-201; Miltenyi Biotec GmbH) with 500 μL MACS buffer, the cell suspension was added, and the column was washed three times with 500 μL MACS buffer to collect Tie2− cells. For Tie2+ cell collection, the column was removed from the magnet, and the cells were released from the column by using 1 mL MACS buffer and a plunger.
PluriSelect
Isolated cells (N = 6) were resuspended in Buffer B (#60-00060-12; pluriSelect Life Science, Leipzig, Germany) and Wash Buffer (#60-00080-10; pluriSelect Life Science), and filtered through a 30 μm cell strainer (pluriStrainer® S/30 μm #43-50030-03; pluriSelect Life Science). Then, the cell suspension was incubated at room temperature (RT) for 30 min on a roller shaker (pluriSelect Life Science) with a construct formed of the identical primary antibody against Tie2 used for FACS and MACS coupled to pluriBeads (32 μm; customized order assembled by pluriSelect Life Science using Tie2 bs-1300R antibody, Bioss). Thereby, the Tie2+ cells bind to the pluriBeads (Fig. 2). Using a second 30 μm cell strainer and washing with 20 mL of Wash Buffer, the Tie2− cell population was collected. By adding activated Buffer D (#60-00040-12; PluriSelect Life Science), the attached 32 μm pluriBead (Fig. 2) was cleaved off from the Tie2+ cells that were obtained by a final washing step by reversing the filter and rinsing.
Colony-forming assay
Immediately after cell sorting, the ability of the sorted cells to form colonies was investigated in a colony-forming assay by seeding 103 Tie2− and Tie2+ cells in 1 mL of methylcellulose-based medium (MethoCult™ H4230; Stem Cell Technologies, Vancouver, Canada) in 35 mm diameter Petri dishes that were cultured for 7 days as previously described. 17 The experiment was carried out in biological triplicates. Colonies consisting of ∼10 cells were considered as one colony using a light microscope. Further, colonies were stained with 2 μL/mL calcein-AM (Sigma-Aldrich) for 2 h at 37°C to allow imaging with a confocal laser scanning microscope (cLSM 710; Carl Zeiss, Jena, Germany).
Adipogenic differentiation
Tie2+ and Tie2− cells were seeded at a density of 5 × 10³ – 10 × 103 cells/well in a 24-well plate (Techno Plastics Products, Inc., Trasadingen, Switzerland). Cells were grown to 90% confluence in monolayer culture using an expansion medium (alpha Minimum Essential Eagle [α-MEM] supplemented with 10% fetal calf serum [FCS], Sigma-Aldrich, 1% penicillin/streptomycin [P/S, 100 μg/mL and 100 IU/mL, respectively; Merck, Darmstadt, Germany], and 2.5 ng/mL fibroblast growth factor 2 [FGF2; #100-18B; PeproTech, London, United Kingdom]). The medium was changed to adipogenic differentiation medium (α-MEM with 10% FCS, 1% P/S, 12.5 μM insulin, 100 nM dexamethasone, 0.5 mM 3-isobutyl-1-methylxanthine, and 60 μM indomethacin [all from Sigma-Aldrich]) and incubated for 21 days. 27 Unsorted cells in expansion medium were used as control. Medium was changed three times a week, and differentiation was carried out in biological duplicates.
Adipogenic differentiation was evaluated by light microscopy after staining of lipid vacuoles with Oil Red O (Merck). In short, samples were fixed with 4% formaldehyde; the cell layer was rinsed with 50% EtOH and stained for 20 min with 0.2% (w/v) Oil Red O in 60% (v/v) 2-propanol (Sigma-Aldrich), followed by a counterstain with Mayer's hematoxylin for 3 min. The fat droplet formation was then visualized under an inverted microscope and photographed. For quantification purposes, the Oil Red O was also extracted with 100% 2-propanol and analyzed by measuring the absorbance at 500 nm with the microplate reader SpectraMax M5 (Molecular Devices, San Jose, CA, distributed by Bucher Biotec, Basel, Switzerland).
Osteogenic differentiation
For osteogenic differentiation, Tie2+ and Tie2− cells were seeded at 5 × 10³ cells/well in a 24-well plate and expanded for ∼1 week until 80–90% confluence prior changing to the osteogenic medium. Medium for differentiation consisted of α-MEM supplemented with 1% P/S, 10% FCS, 100 nM dexamethasone, 10 mM β-glycerophosphate, and 50 μM L-ascorbic acid-2-phosphate (all from Sigma-Aldrich). 28 Expansion medium was used as a control. The culture was maintained for 21 days, and the medium was refreshed three times a week. The differentiation assay was carried out with biological duplicates.
The cells were fixed in 4% formaldehyde, and the calcium deposition of the cell layers was evaluated by 2% Alizarin red staining (ALZR) solution (Sigma-Aldrich) for 45 min. The ALZR was released from the cell layers by addition of 10% cetylpyridinium chloride solution (Sigma-Aldrich) for 1 h under agitation. Optical density was measured at 570 nm with the microplate reader SpectraMax M5.
Chondrogenic differentiation
After sorting Tie2+ and Tie2− cells, cells were seeded at a density of 25,000 cells/well (Tie2+) and 40,000 cells/well (Tie2−) in six-well plates for 7–10 days in expansion medium. Then the cells were trypsinized, and 250,000 cells/15 mL tube were centrifuged and kept in pellet culture either in chondrogenic medium (HG-DMEM supplemented with 1% Pen/Strep, 100 nM dexamethasone, 1% insulin-transferrin-sodium selenite [ITS+, cat. no. I2521; Sigma-Aldrich], 1% nonessential amino acids (Gibco, Thermo Fisher Scientific, Basel, Switzerland), 250 μM-ascorbic acid, 10 ng/mL transforming growth factor beta 1 [TGF-β1; Peprotech, London, United Kingdom]) or in control medium (serum-free medium, i.e., HG-DMEM supplemented with ITS+ with 1% P/S), and cultured for 21 days under normoxia.29,30 Medium was changed three times a week, and differentiation was carried out with biological duplicates. The formed pellets were fixed in O.C.T. Compound (TissueTek™; Sakura, Inc., Finland) for 20 min and then snap-frozen in liquid nitrogen. Cryosections of 8 μm were cut with a cryotome (microm HM560; Thermo Fisher Scientific).
After removal of the O.C.T. compound, the cryosections were stained with 0.02% Fast Green solution (Merck) for 10 min. The samples were rinsed with 1% acetic acid, and then immersed in 0.1% Safranin-O (Merck) at pH 2.5 for 15 min to stain sulfated glycosaminoglycans (GAGs). In addition, cryosections were stained for sulfated GAG with 1% Alcian blue 8GX (Sigma-Aldrich) in 3% acetic acid at pH 1.0. 31 Once dehydrated and mounted, slides were imaged using an inverted microscope (Eclipse Ti-E, Nikon, Tokyo, Japan), and single images were taken at 4 × magnification and stitched by using NIS Elements microscope imaging software (Nikon) and edited for easier comparison with ImageJ 1.51j8 (National Institute of Health).
In addition, cryosections were stained for proteoglycans (PGs), aggrecan (ACAN) and Tie2 by immunohistochemistry. For this, the sections were permeabilized in methanol for 2 min, then rehydrated in PBS. Unspecific staining was prevented by blocking using 10% FCS in PBS for 1 h. After washing, the samples were incubated with the primary antibody against PGs (MAB2015 mouse; Millipore), Tie2 (bs-1300R antibody; Bioss 1:50) or with the ACAN primary antibody (TA336492; Origene, Herford, Germany, diluted 1:50) overnight at 4°C in PBS containing 0.5% BSA. On the next day, after stringent washing, slides were incubated for 1 h at RT with the secondary antibody (Alexa Fluor 555 goat antimouse IgG cat. no. A-31621; 1:200 diluted; FisherScientific) for the PG and with Alexa 488 secondary antibody (cat no. A-11008, see above, 1:200 diluted) for ACAN and Tie2 on separate sections. Finally, slides were mounted in DAPI containing embedding medium (Fluoroshield™ cat. no. ab104139; abcam plc, Cambridge, United Kingdom). Images were then taken with a confocal laser scanning microscope at a 10 × magnification and using tile imaging (cLSM710; Carl Zeiss, Jena, Germany).
Statistics
Statistical analysis of cell yield, colony number, and histological quantification was performed by using Kruskal–Wallis test, followed by Dunn's multiple comparisons test. A p-value <0.05 was considered significant. The analysis was performed using GraphPad Prism (version 7.0d for MAC OS, GraphPad Software, Inc., La Jolla).
Results
Cell yield
The Tie2+ cell yield in the different sorting methods did not differ significantly (Fig. 3). From the whole NPC population, Tie2+ cells constituted 5.0% ± 4.0% (mean ± SD) for FACS, 1.6% ± 2.9% for MACS, and 1.1% ± 1.0% for pluriSelect. The Tie2+ population tended to be larger by FACS as compared with pluriSelect (p = 0.06). The gating strategy for Tie2+ and Tie2− cells is depicted in Supplementary Figure S1. The postsorting analysis of FACS-sorted cells revealed a purity of ∼100% for the Tie2− and ∼80% for Tie2+ cells (Supplementary Fig. S1).
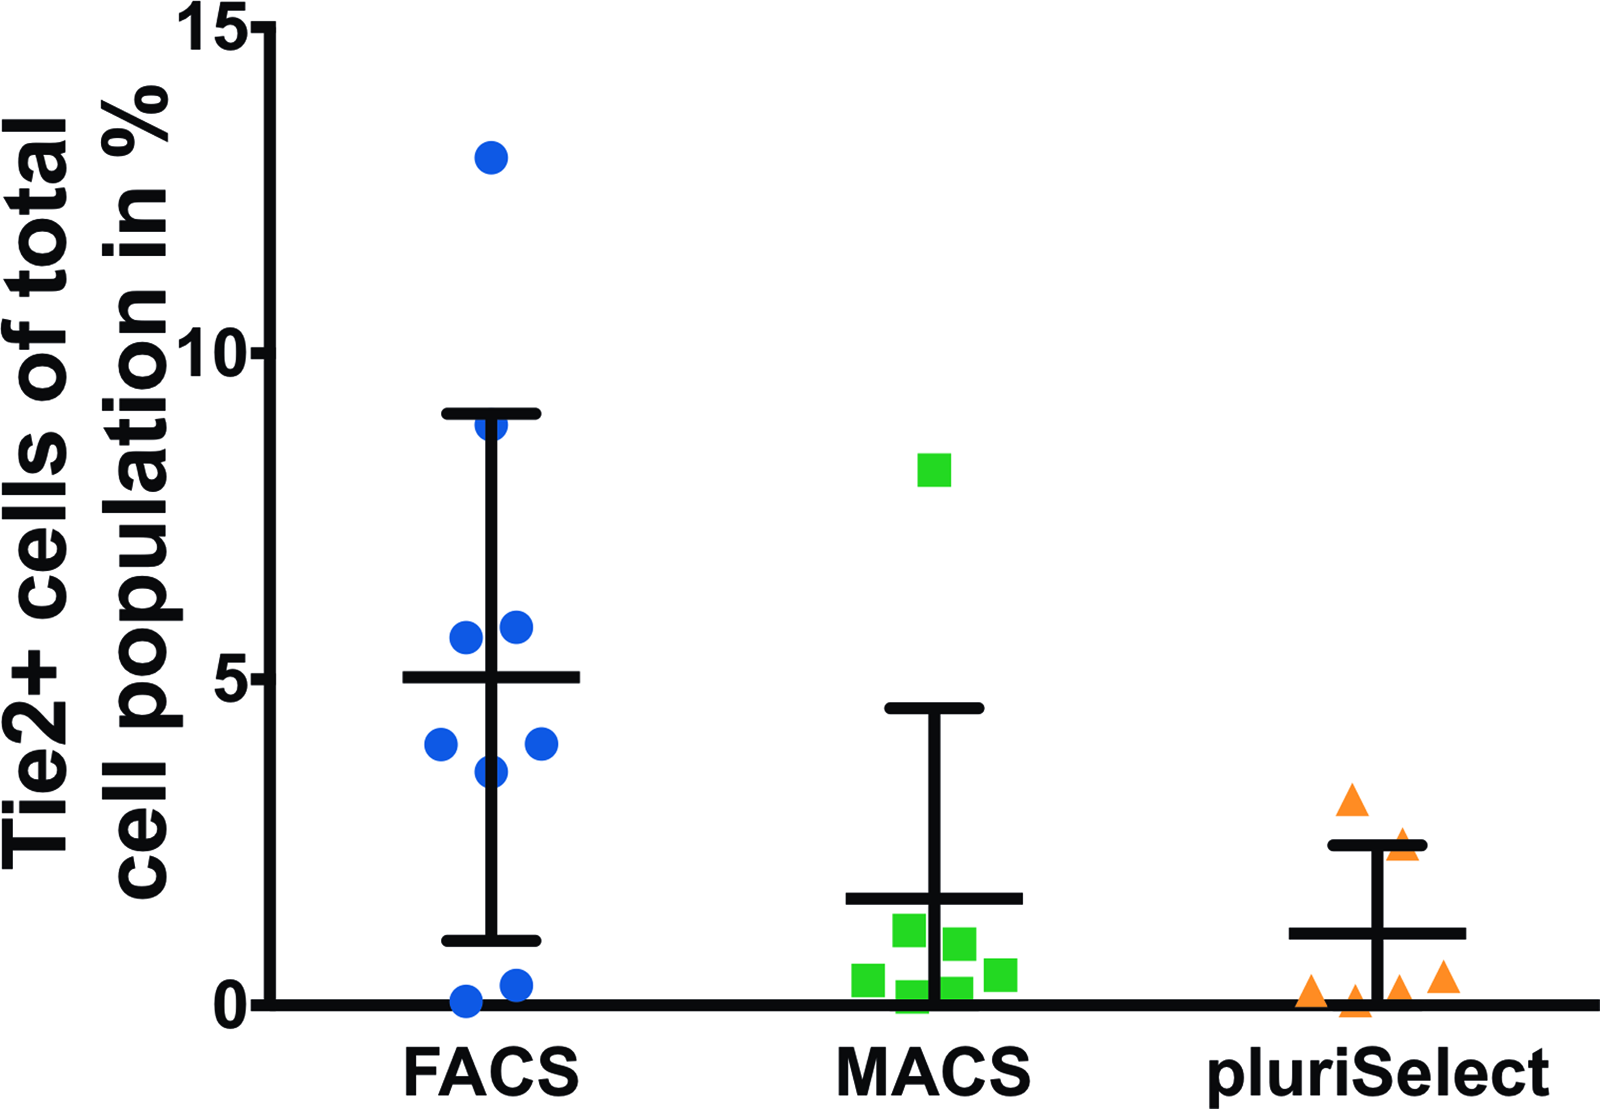
Yield of Tie2+ cells as percentage of initial NPC number for FACS (N = 9), MACS (N = 7), and pluriSelect (N = 6), mean ± SD. SD, standard deviation. Color images are available online.
Colony-forming unit assay
There was no significant difference in the number of colonies formed from Tie2− and Tie2+ seeded cells (Fig. 4) between the different sorting methods (FACS [Tie2+: 282.5, Tie2−: 187.0], pluriSelect [Tie2+: 113.8, Tie2−: 91.3], and MACS [Tie2+: 527.0, Tie2−: 296.9]) after 7 days of culture. However, the morphology of colonies differed for all sorting methods for the Tie2+ and Tie2− cells. Whereas the predominant shape for the Tie2− cells was rather spread, the Tie2+ cells tended to form spherical colonies (Fig. 5). Further, FACS resulted in bigger colonies for Tie2+ cells as compared with MACS and pluriSelect, which rendered smaller and denser colonies.
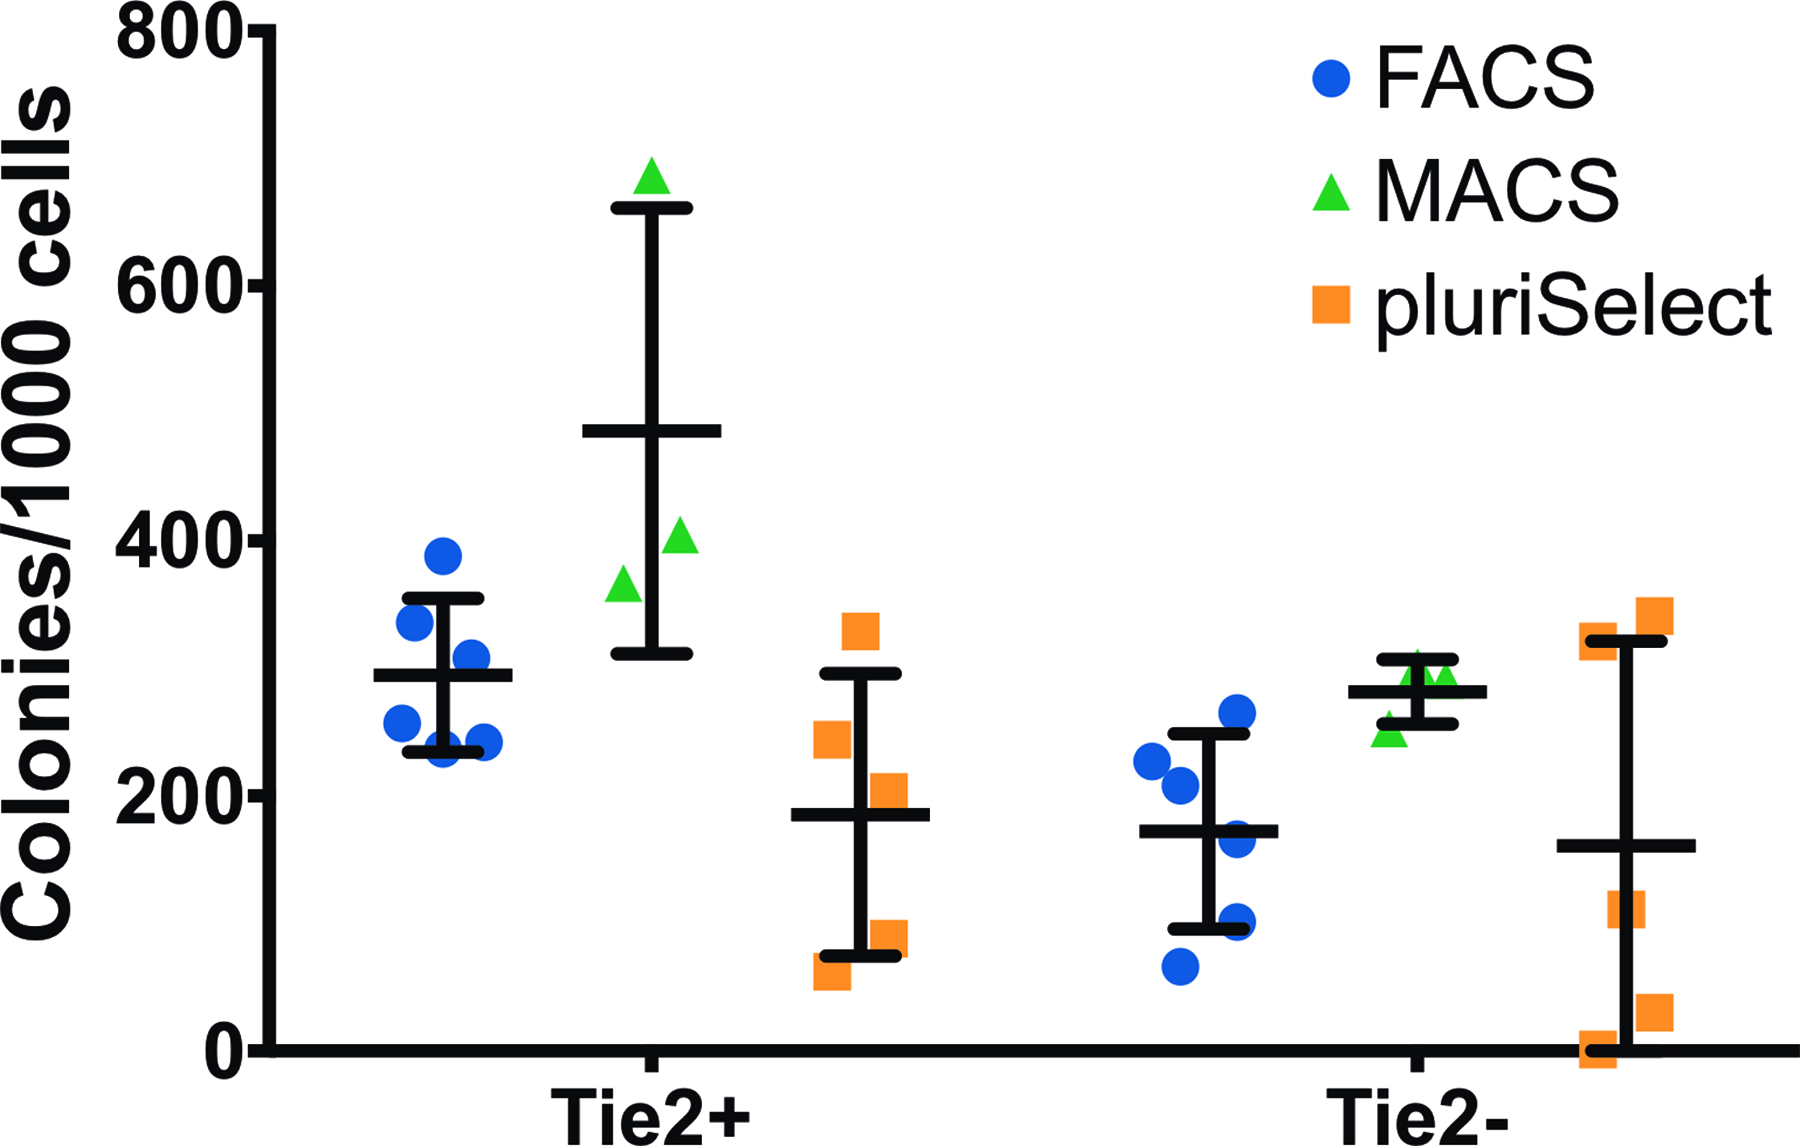
Number of colonies per 1000 Tie2+ and Tie2− cells after 7 days of incubation in methylcellulose-based medium. Colonies of ≥10 cells were counted as one colony by using a light microscope. FACS (N = 6), MACS (N = 3), and pluriSelect (N = 5), mean ± SD. Color images are available online.
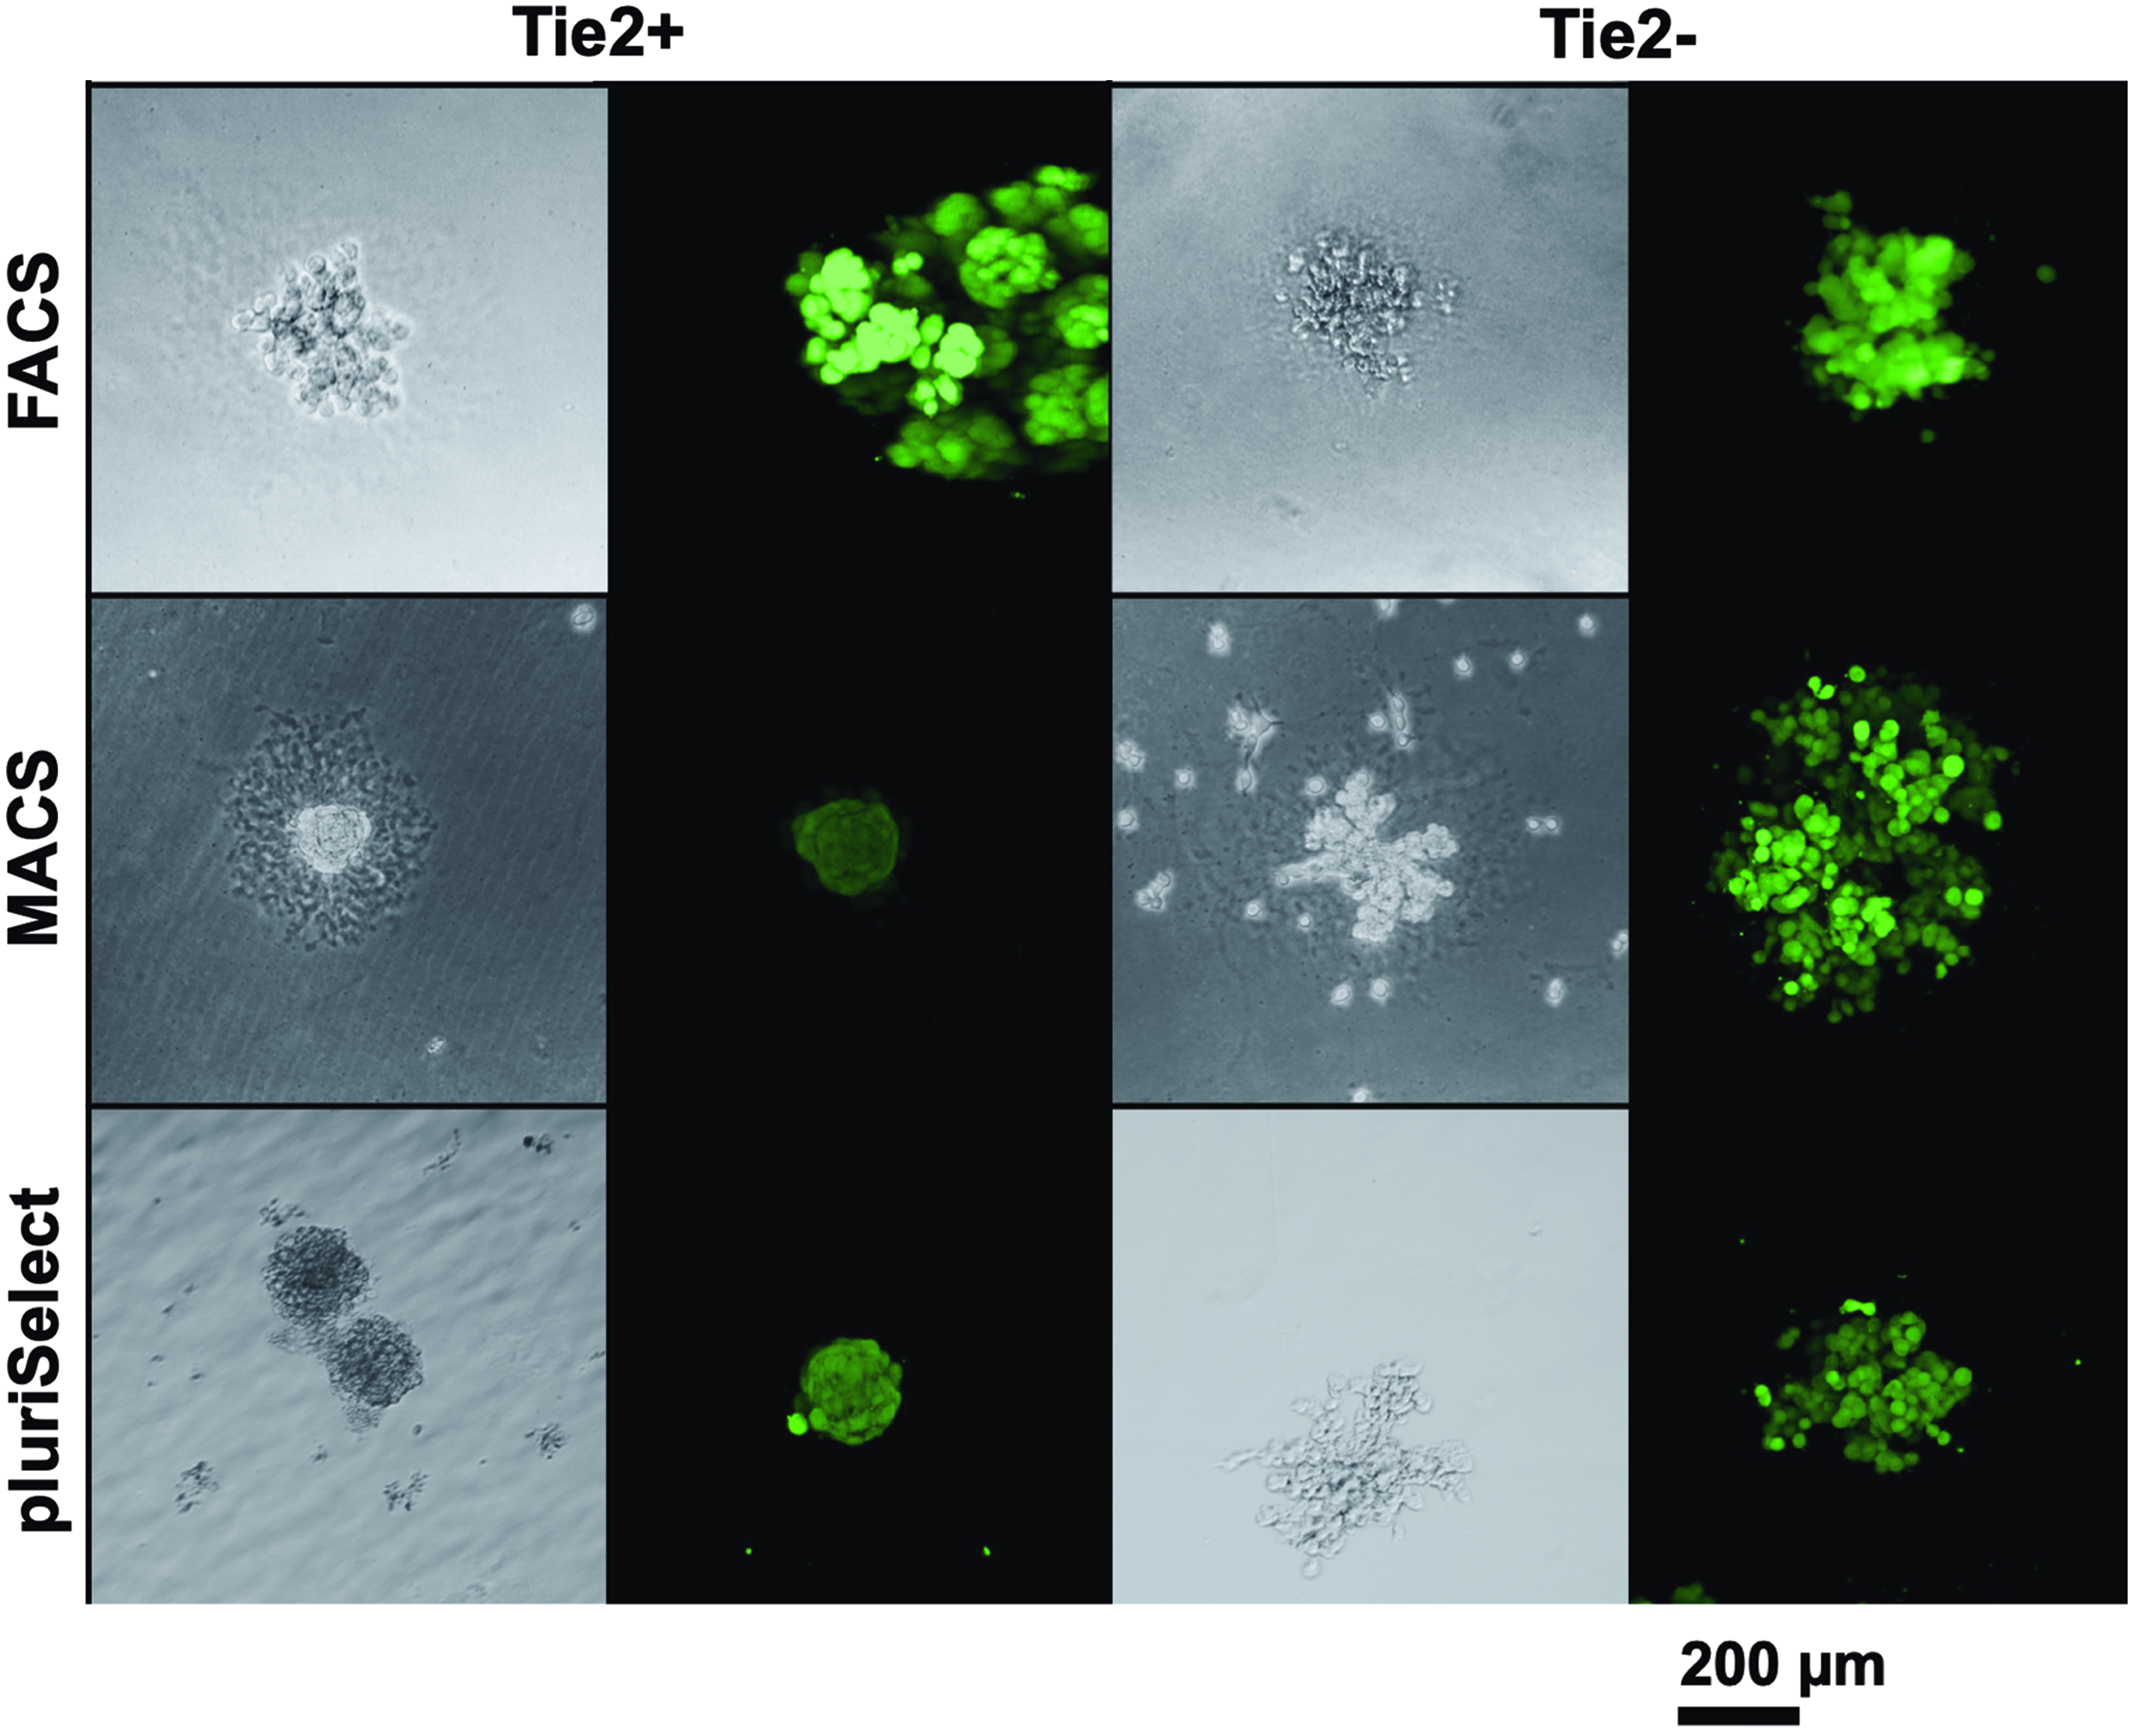
Light and cLSM of Tie2+ and Tie2− cell colonies after 7 days of culture in methylcellulose-based medium stained with calcein AM (live stain) and ethidiumhomodimer-1 (dead cell stain). Colonies for cLSM were stained with calcein-AM (green) after 7 days of culture in MethoCult™ medium (Stemcell Technologies, GmbH, Köln, Germany). cLSM, confocal laser scanning microscopy. Color images are available online.
Differentiation
The ability of the sorting method to select for the NPPC was further explored. Provided that Tie2+ cells have been demonstrated to maintain their differentiation potential, after sorting Tie2+ and Tie2− cells with FACS, MACS, and pluriSelect the trilineage differentiation assays were performed. Since the quantification of osteogenic, adipogenic, and chondrogenic differentiation using FACS has been previously published in Tekari et al. 17 we report here solely on the quantitative potential of MACS- and pluriSelect-sorted cells. Osteogenic and adipogenic differentiation over 21 days in monolayer resulted in a clear distinction between Tie2+ and Tie2− cells for FACS (Fig. 6). The ALZR staining indicated higher calcium deposition and lipid vacuoles accumulation, respectively, for Tie2+ cells. In NPCs sorted by MACS, the distinction between the two populations was less noticeable, as also the Tie2− population showed calcium mineralization as well as lipid vacuoles. In the case of osteogenic differentiation, the distinction between Tie2+ and Tie2− cells was not possible by ALZR staining for pluriSelect. However, adipogenic differentiation showed slightly smaller lipid vacuoles for the Tie2− than for the Tie2+ cell population. This outcome was confirmed by eluting the stains and evaluating by spectrophotometry (Fig. 7). For both, ALZR and Oil Red O staining, no significant difference was found between Tie2+ and Tie2− cell population for MACS (ALZR: Tie2 + 0.15 ± 0.03 μM/well Tie2 − 0.09 ± 0.15 μM/well; Oil Red O: Tie2 + 0.04 ± 0.07 OD, Tie2 − 0.03 ± 0.04 OD) and for pluriSelect (ALZR Tie2 + 0.25 ± 0.15 μM/well, Tie2 − 0.24 ± 0.16 μM/well; Oil Red O: Tie2 + 0.10 ± 0.07 OD Tie2 − 0.08 ± 0.05 OD).
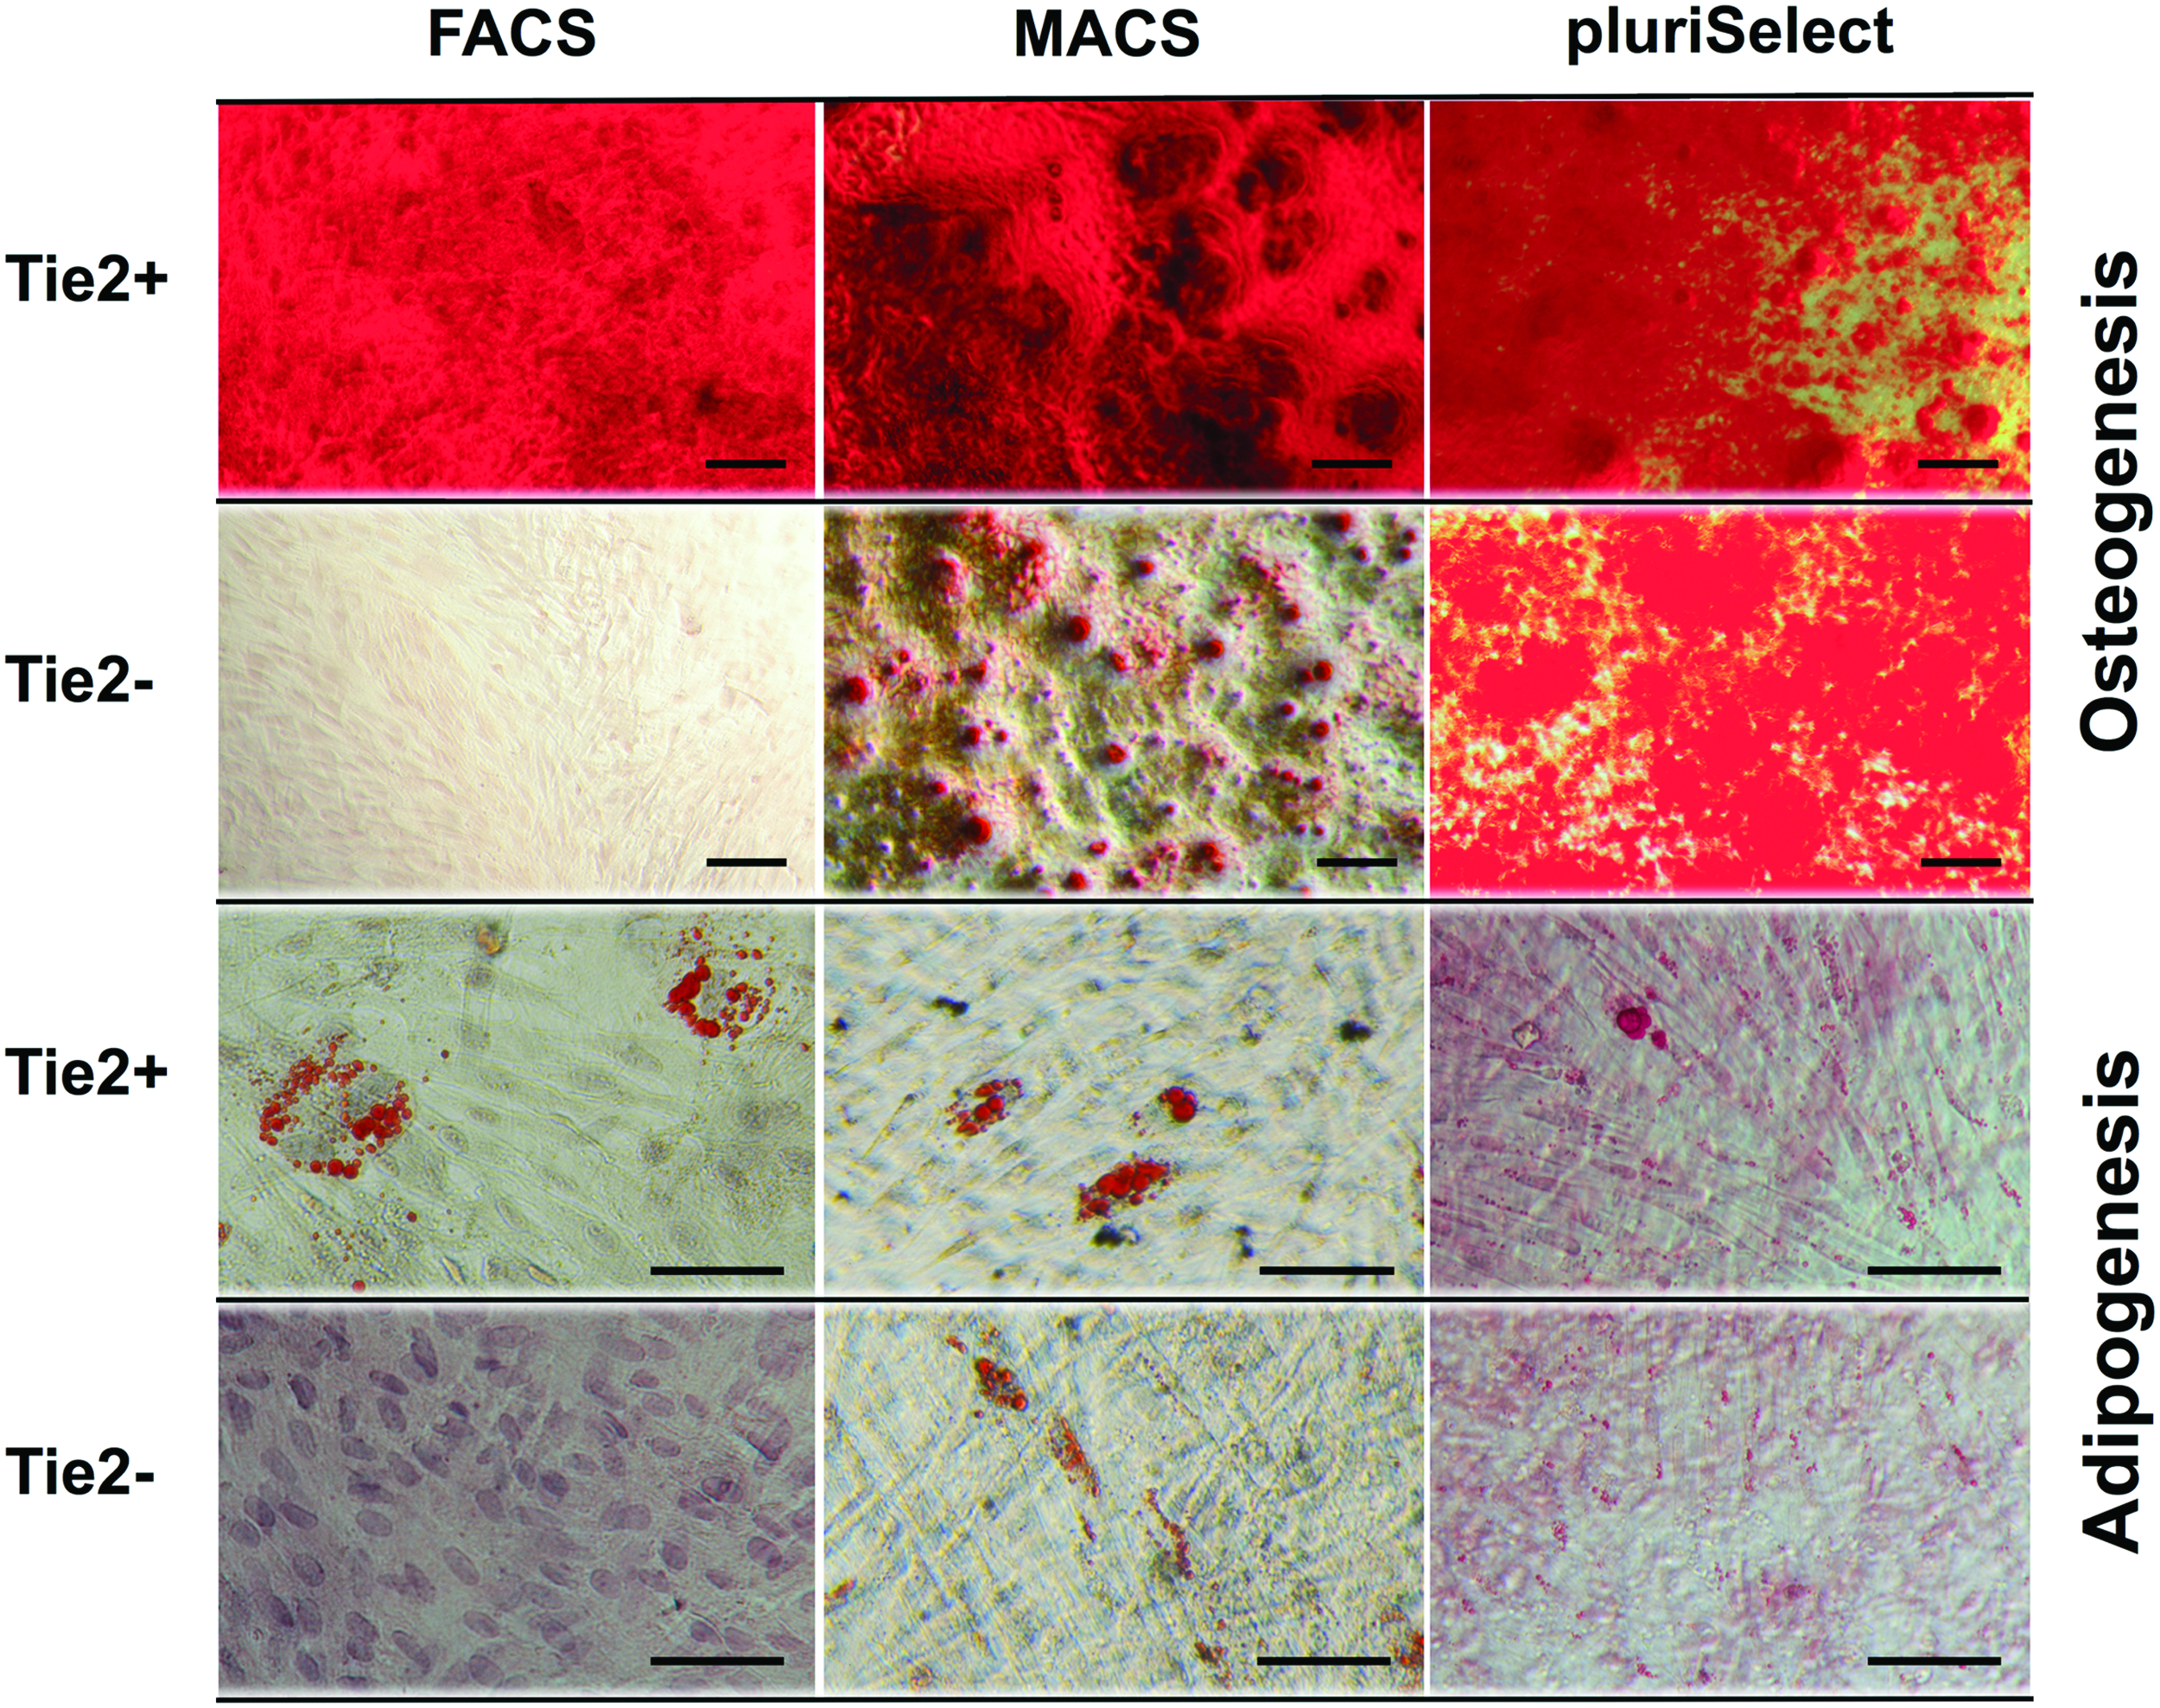
Bright field microscopy of 2D monolayer osteogenic (top) and adipogenic (bottom) cultures of Tie2+ and Tie2− cells after 21 days of differentiation. Scale bars represent 100 μm. Color images are available online.
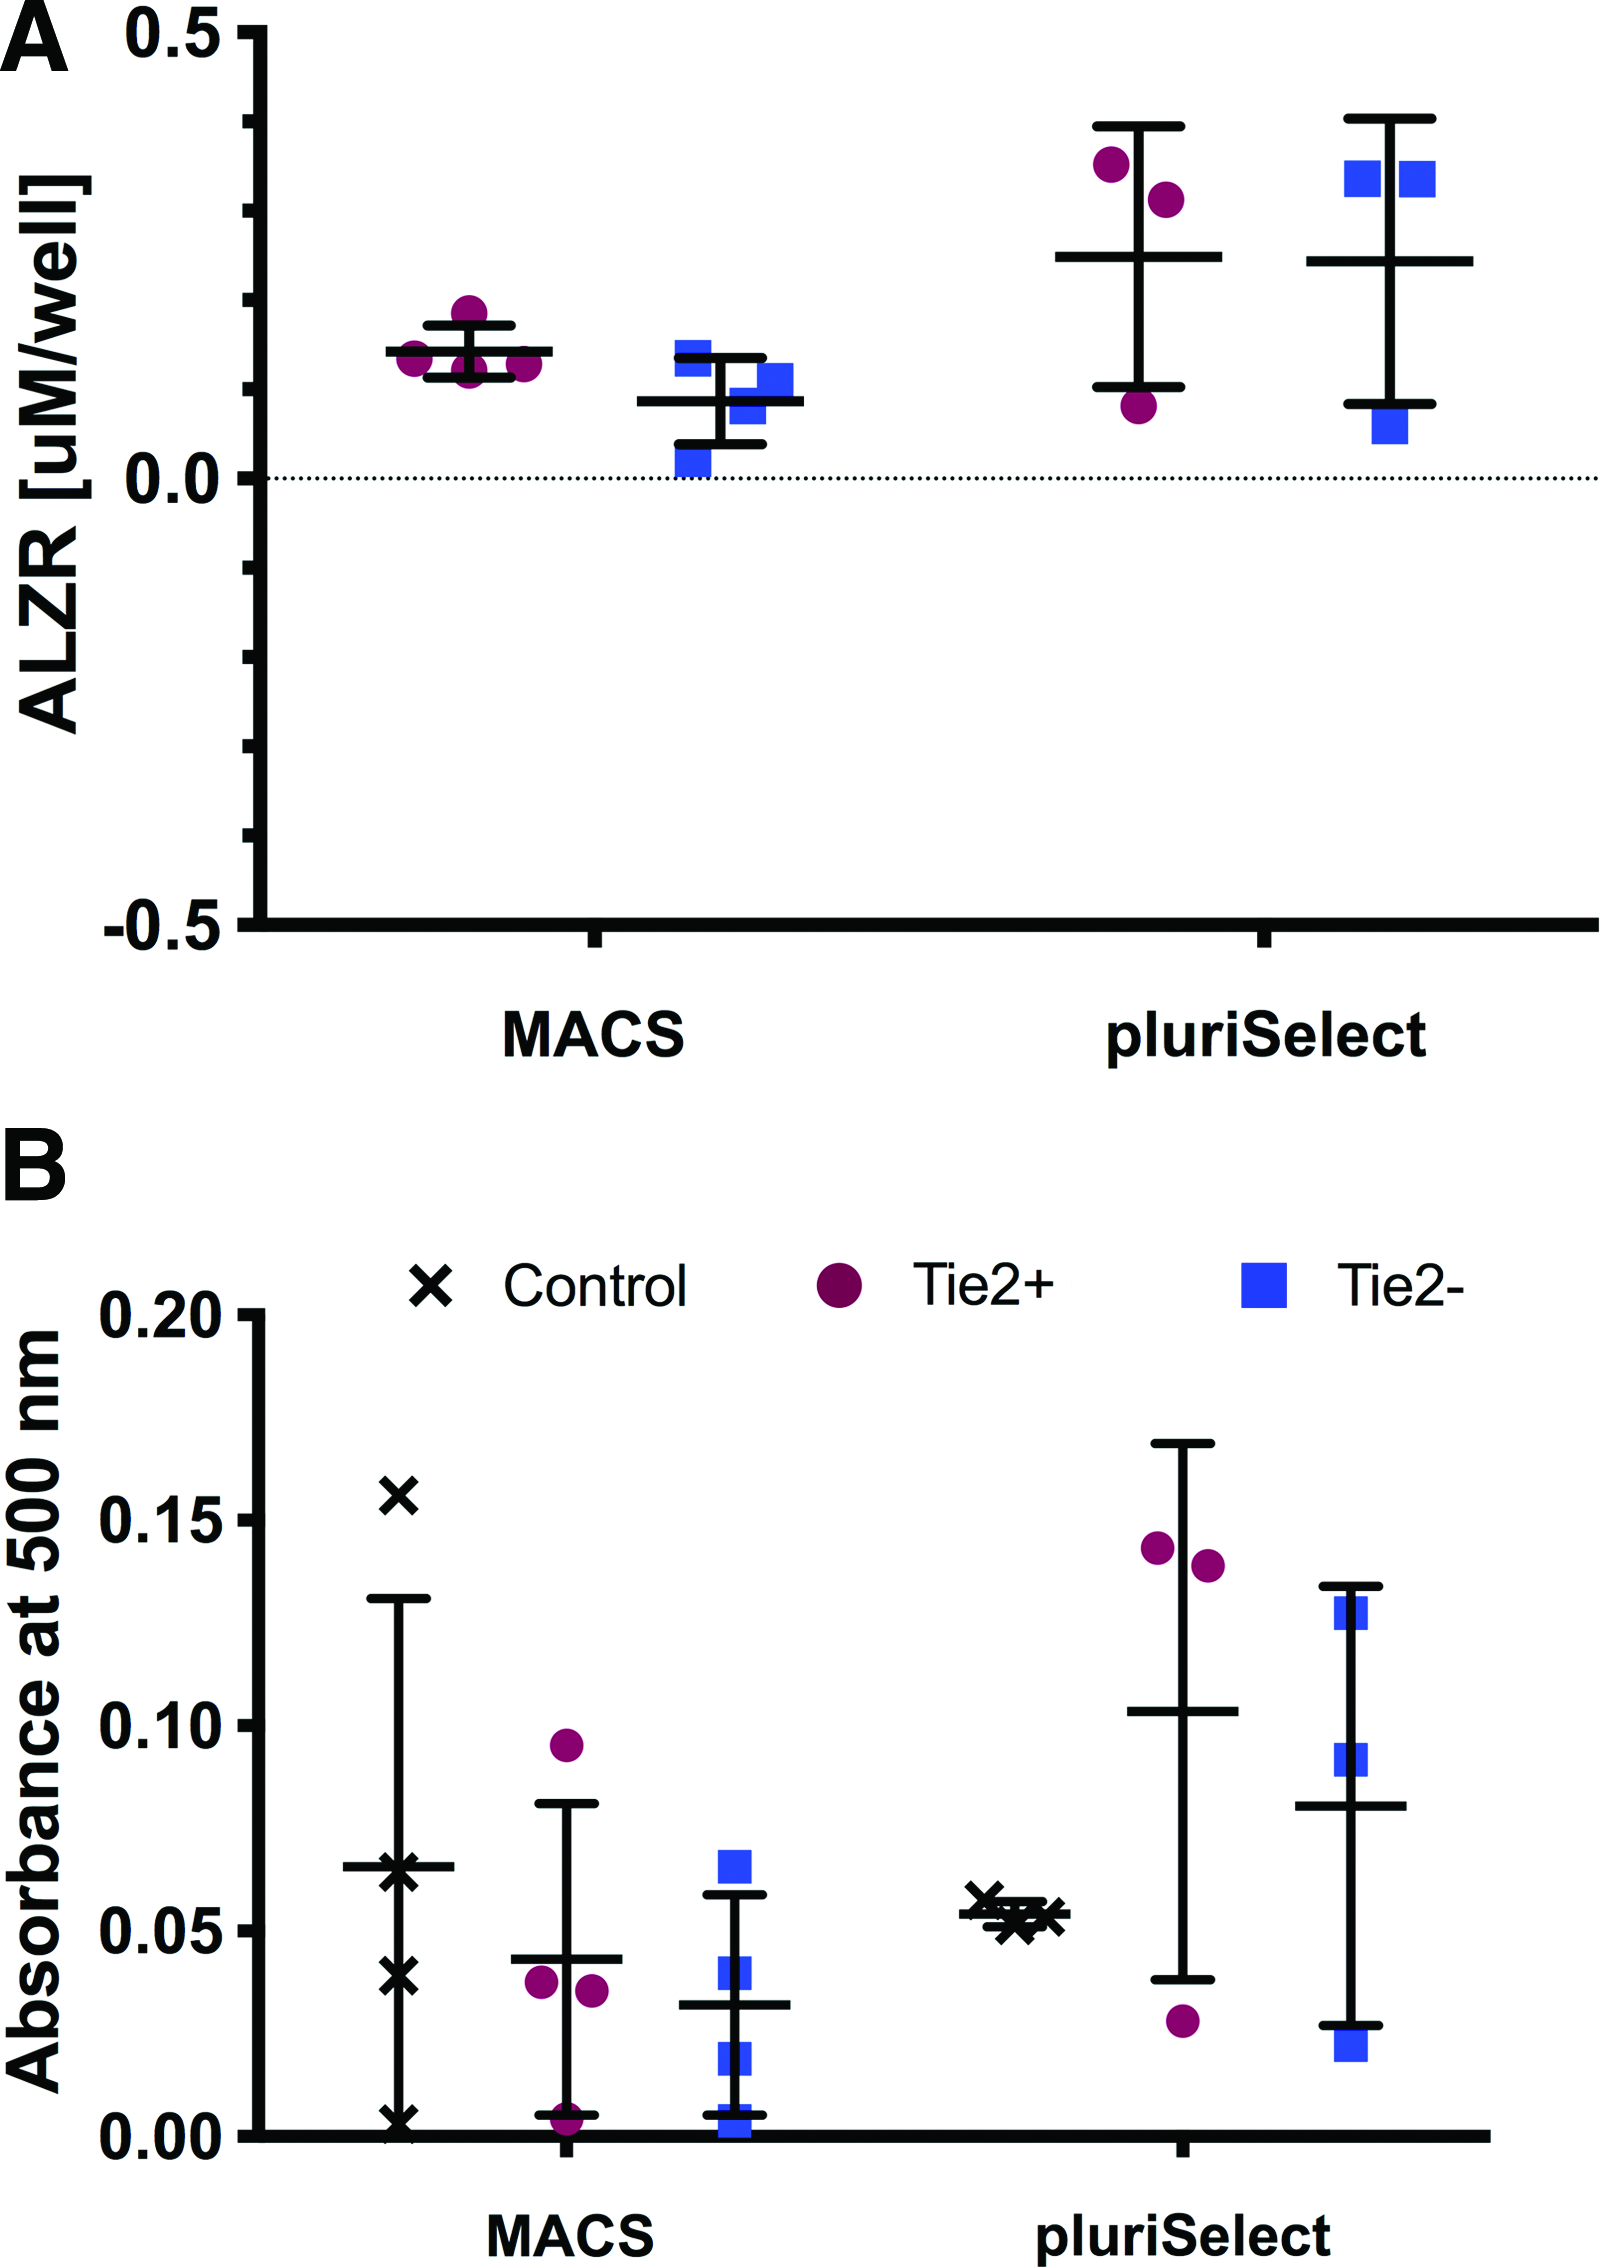
Quantification of histological staining relative to expansion control of
After 21 days the 3D pellets in the chondrogenic medium supplemented with TGF-β were larger compared with control medium for both Tie2+ and Tie2− cells (data not shown). In many cases, Tie2+ cell pellets were macroscopically larger than Tie2− (Fig. 8, top). Immunostaining of Tie2 on cell pellets after 21 days confirmed the presence of Tie2+ cells; these were apparently more distributed in the outer layers of the pellet (Fig. 8). Immunohistochemistry suggested that the PG content was higher in pellets derived from Tie2+ cells when sorted with FACS (Fig. 8, middle). This higher PG content was also confirmed by Safranin-O/Fast-Green and partially by Alcian Blue (Supplementary Fig. S2); while there were no differences in PG content of pellets derived from Tie2+ or Tie2− sorted cell by MACS and pluriSelect (Fig. 6 and Supplementary Fig. S2). ACAN expression was generally relatively weak in all pellets (Fig. 8).
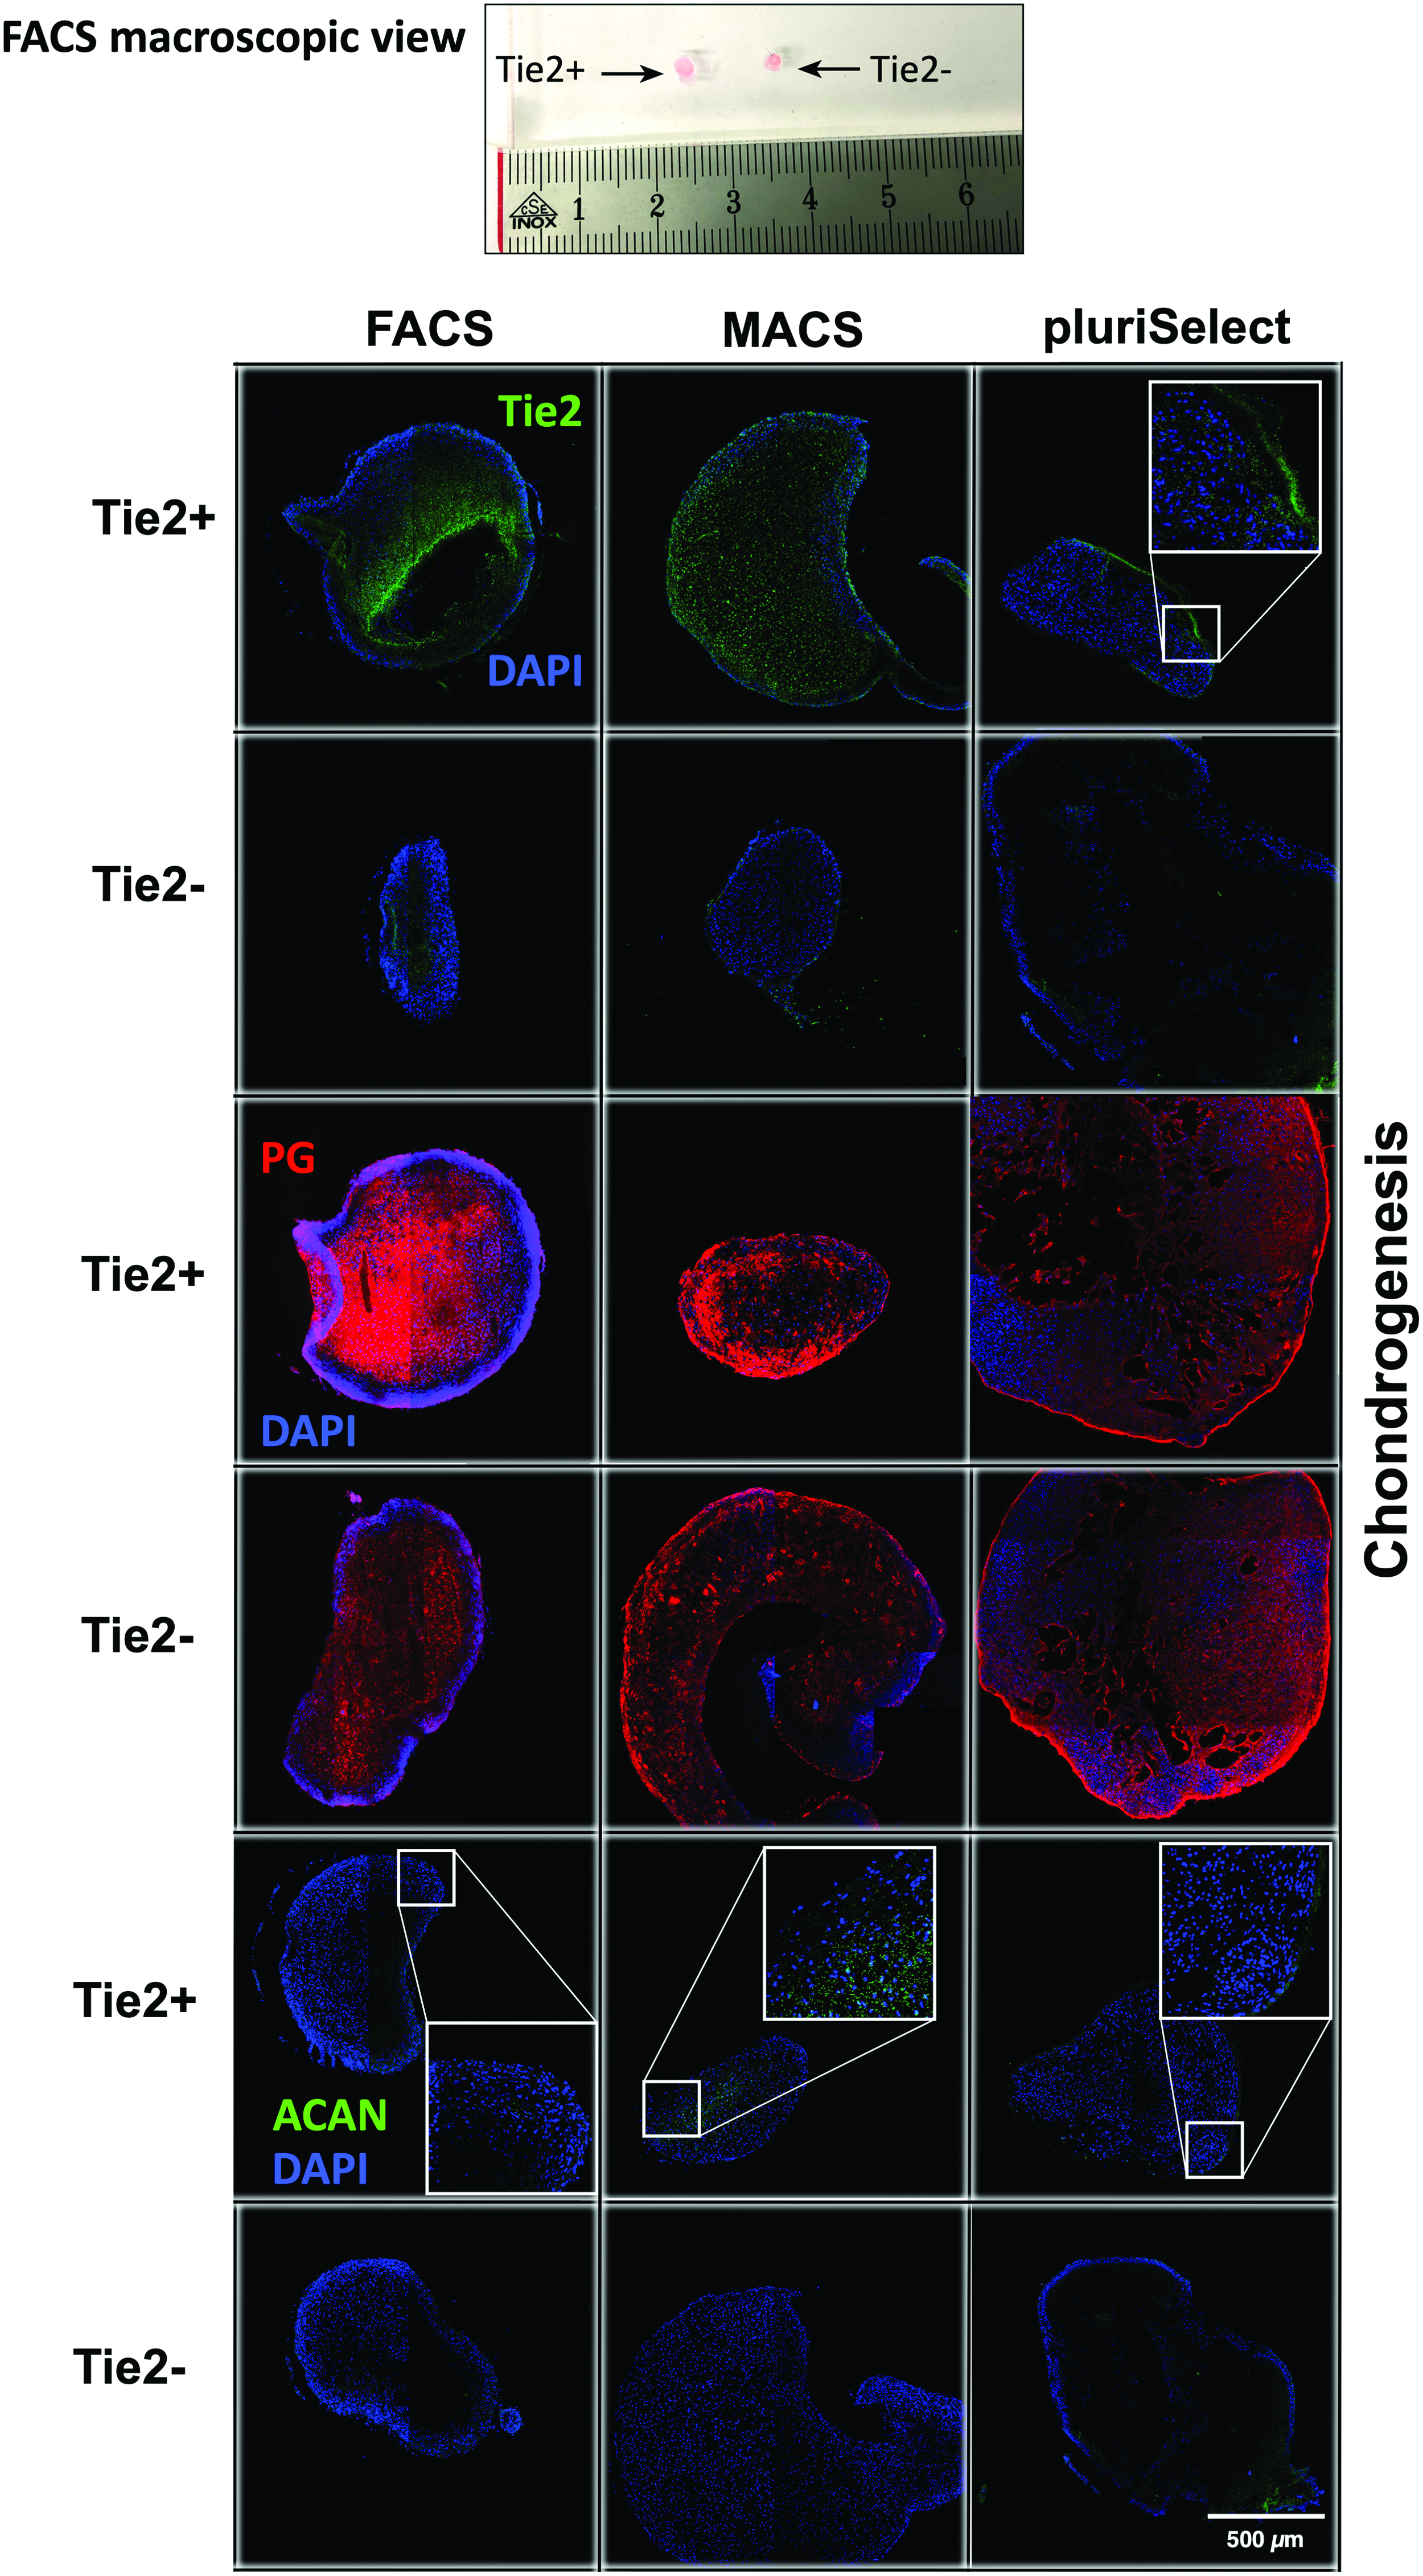
Chondrogenic differentiation potential of Tie2+ and Tie2− sorted cells in 3D pellet culture after 21 days using three different sorting methods; that is, FACS, MACS, and pluriSelect. Macroscopic view of 3D pellets (top), taken from a FACS-sorted experiment, confocal laser microscopy for Tie2 staining (in green; top two rows), proteoglycan staining (in red; middle two rows) and for ACAN staining (in green; bottom two rows), in blue = nuclei. Scale bar = 500 μm. Color images are available online.
Discussion
In this study we aimed to address the feasibility of different sorting methods to select the NPPC within the IVD. Here, we were able to detect Tie2+ cells from bovine NP cells using a Tie2−specific antibody. However, the yields of Tie2+ cells differed widely among the three methods, with FACS resulting in the highest percentage of sorted living NPPC, despite the additional exclusion of dead cells by live/dead stain. Hence, it seemed that although MACS and pluriSelect are possibly less invasive sorting methods they were not able to sort more viable Tie2+ cells. Nevertheless, this difference might, at least partially, be observed from operating the FACS device as the gating profoundly influences the final yield. 18 In this respect, pluriSelect and MACS are at an advantage compared with FACS, as gating cannot be manipulated in these two systems. Another factor in favor of pluriSelect and MACS is their ease of use and nondependency on relatively expensive flow cytometers.
Apart from these points also the later application for IVD regenerative medicine downstream application requires further points that have to be addressed for selecting the optimal method, that is, maintaining sterility throughout sorting and safety concerns regarding the remaining fluorescent and magnetic labels of the antibodies used for FACS and MACS, respectively. The pluriSelect approach if successful would be GMP compliant as it does neither involve fluorescence nor the incorporation of magnetic beads that could potentially affect the viability, phenotype, and function of the progenitor cells. 32 As such, further optimization of pluriSelect-based methods has potential for translation into the clinics and represents a less-harsh method for fishing of NPPCs. The manipulation of cells renders them an advanced therapy medicinal product, and FACS may be problematic in this respect. Sorting-based cell therapies may be challenging due to regulations regarding the sorting procedure, the antibodies, and their label approval. Here, pluriSelect could be advantageous compared with the other two regarding the labeling as by cleaving of the pluriBead only a linker protein remains on the cell surface that will later be completely phagocytized.
The ability of the sorting methods studied here to properly select for the NPPCs that maintain their progenitor characteristics, the number of colony-forming units (CFUs), and the ability for trilineage differentiation were evaluated. While the number of CFUs did not differ between the Tie2+ and Tie2− cell populations and among sorting methods, FACS was able to distinguish two functionally well-separated cell populations: A multipotent Tie2+ fraction that could differentiate into the adipo-, osteo-, and chondrogenic lineage and a Tie2− fraction that did not show any plasticity to differentiate into other lineages, except for the chondrogenic pathway. Such a clear distinction between cell populations could not be shown for MACS- and pluriSelect-sorted cells, especially for the osteogenic differentiation (Fig. 6). In a future study, the use of specially coated well plates or 3D culture might facilitate cell maintenance and proliferation for downstream assays, that is, differentiation. It is very likely that the expansion might have further influenced the outcome of the differentiation assay. The most plausible reason for the superior trilineage differentiation results of Tie2+ cells when sorted by FACS is the more precise gating.
Limitations
NPPCs represent a rare cell population, and as such their sorting and further characterization are challenging. From a technical perspective, we had to study the three sorting methods employing NP tissue from different animals aged 10–14 months. The exact age, however, was not known. Considering that, age has a direct effect on the initial number of Tie2+ cells present as was shown by Sakai et al. 16 for human NPPC, which most likely also applies for bovine NPPCs, and as such introduces a cofounder that may have affected the results of this study.
Another limitation of this study was the necessity to expand cells in monolayer prior differentiation assays due to low cell yield. The precise effect and shift of Tie2+ versus Tie2− cells during monolayer cell expansion on the sorted cells—a step that was required to obtain sufficient cells for differentiation assays—are not yet fully understood. Moreover, possible dedifferentiation of Tie2+ cells might occur during this period, despite the addition of FGF2, which was previously demonstrated to provide a more stable outcome.17,33 Possibly, laminin coating or spheroid-like cultures could help maintain the cell phenotype after cell isolation similar to notochord-like cells or induced pluripotent stem cells. 34 This limitation might pose the biggest challenges for the chondrogenic differentiation where the highest initial cell number for pellet culture was required (Fig. 6 and Supplementary Fig. S2).
Finally, an additional limitation to consider is the assessment of the entire colonies, without distinguishing between spherical and fibroblastic CFUs. The NPC and NPPC can give rise to spherical and fibroblastic CFUs, so called CFU-S and CFU-F with the cells forming spherical CFUs possessing greater cell potency and regenerative capacities.16–18 We have established previously16–18 that Tie2− populations result primarily in CFU-F, and Tie2+ NPCs engender predominantly spherical CFUs. Here the distinction between the two types of colonies was not made, which likely resulted in the limited discrepancy between the number of colonies by Tie2+ and Tie2− NPCs (Fig. 4). Based on our previous reporting, the colonies resulting from the Tie2− cells are likely comprised of predominantly fibroblastic colonies, while the number of colonies by Tie2+ NPCs will contain higher rates of spherical CFUs. 16 A future study will need to determine the effect of the three analyzed sorting methods on spherical and fibroblastic CFU frequencies and their emerging potency.
Less clear were the results for chondrogenic differentiation between Tie2+ and Tie2− cells: Here, we noticed an increased PG production in Tie2+ sorted cells (Fig. 8 and Supplementary Fig. S2) in pellets in chondrogenic medium. However, this was seen mostly for FACS-sorted cells as obtained previously. 17 3D pellet culture of these Tie2+ cell populations was challenging as in some repeats the cells died after initiation of 3D culture. Noteworthily, the number of CFUs was found to be correlated with Pfirrmann grading scheme of disk degeneration in human NPPC.16,24 The Tie2 immune staining of 3D pellet culture (Fig. 8) was expected to stain specifically the membranes as it is a surface marker also known as CD202b. However, as found in previous studies using human umbilical vascular endothelial cells a cytoplasm-specific staining was obtained in NP cells. 35
An optimal cell density for injection of cells for IVD repair has not been determined so far. Previous studies have suggested that lower cell densities seem to outperform higher cell densities transplant products for MSC 36 and for NP progenitor-like cells.37,38 Of special interest in this respect is the clinical study by Orozco et al., 39 which could successfully demonstrate pain relief after autologous stem cell transplantation, possibly because of the immune-modulatory properties. 40 These are promising results also considering the small initial cell yield of the Tie2+ NPPC. It is currently unclear if NPPCs have similar anti-inflammatory properties.
Thus, the method of choice remains FACS despite MACS and pluriSelect being more straightforward with shorter amount of steps. Future sorting methods could be a lab-on-chip design to achieve even more reliable cell sorting for these rare cells.41,42
Furthermore, it is currently unknown whether these recently detected Tie2+ cells in the IVD could play a central role in inflammation and IVD degeneration as Tie2 signaling has been linked to mechanism of systemic inflammation and microangio-related pathologies.43,44 These Tie2+ cells might be a critical element to understand pathologies of the IVD and to develop novel therapeutic perspectives using tissue-engineered constructs.
Conclusions
In this study, three different sorting methods for the isolation of the novel Tie2+ NPPC were compared for the first time. It could be shown that all three sorting methods tested (FACS, MACS, and pluriSelect) were able to pick out Tie2+ cells. Although all sorting methods showed similar abilities to form colonies, they differed widely in the NPPC fraction retrieved and their behavior in the differentiation assays. Thereby, FACS resulted in the biggest Tie2+ fraction, and only the differentiation assays for adipo-, osteo-, and chondrogenesis of FACS-sorted cells resulted in very different outcomes for Tie2+ and Tie2− cells (Figs. 6 and 8; Supplementary Fig. S2). Whereas MACS and pluriSelect were only able to produce a very low number between the Tie2+ and Tie2− cell populations, these were also not apparent in the differentiation assays. The fact that flow cytometry was able to pick only live cells as compared with the other two could be an additional important factor for the various outcomes, especially for downstream differentiation.
Footnotes
Acknowledgments
The authors thank Eva Roth and Selina Steiner for their technical assistance. FACS was conducted at the FACSlab core facility, and the imaging part was realized on equipment of the Microscopy Imaging Center (MIC) facility at the University of Bern, Switzerland. X.Z. was supported by China Scholarship Council (CSC) fellowship. The study was partially financed by the Horizon2020 Project “iPSpine” #825925. J.S. and A.B. were supported by the Swiss Paraplegic Foundation. The financial support of the Dutch Arthritis Society (Project LLP22) to the group of M.T. is greatly acknowledged.
Disclosure Statement
No competing financial interests exist.
References
Supplementary Material
Please find the following supplemental material available below.
For Open Access articles published under a Creative Commons License, all supplemental material carries the same license as the article it is associated with.
For non-Open Access articles published, all supplemental material carries a non-exclusive license, and permission requests for re-use of supplemental material or any part of supplemental material shall be sent directly to the copyright owner as specified in the copyright notice associated with the article.