
Abstract
Over the past two decades, the increase in prevalence of cardiovascular diseases and the limited availability of autologous blood vessels and saphenous vein grafts have motivated the development of tissue-engineered vascular grafts (TEVGs). However, compliance mismatch and poor mechanical properties of the TEVGs remain as two major issues that need to be addressed. Researchers have investigated the role of various culture conditions and mechanical conditioning in deposition and orientation of collagen fibers, which are the key structural components in the vascular wall; however, the intrinsic complexity of mechanobiological interactions demands implementing new engineering approaches that allow researchers to investigate various scenarios more efficiently. In this study, we utilized a coupled agent-based finite element analysis (AB-FEA) modeling approach to study the effect of various loading modes (uniaxial, biaxial, and equibiaxial), boundary conditions, stretch magnitudes, and growth factor concentrations on growth and remodeling of smooth muscle cell-populated TEVGs, with specific focus on collagen deposition and orientation. Our simulations (12 weeks of culture) showed that biaxial cyclic loading (and not uniaxial or equibiaxial) leads to alignment of collagen fibers in the physiological directions. Moreover, axial boundary conditions of the TEVG act as determinants of fiber orientations. Decreasing the serum concentration, from 10% to 5% or 1%, significantly decreased the growth and remodeling speed, but only affected the fiber orientation in the 1% serum case. In conclusion, in silico tissue engineering has the potential to evolve the future of tissue engineering, as it will allow researchers to conceptualize various interactions and investigate numerous scenarios with great speed. In this study, we were able to predict the orientation of collagen fibers in TEVGs using a coupled AB-FEA model in less than 8 h.
Impact Statement
Tissue-engineered vascular grafts (TEVGs) hold potential to replace the current gold standard of vascular grafting, saphenous vein grafts. However, developing TEVGs that mimic the mechanical performance of the native tissue remains a challenging task. We developed a computational model of the grafts' remodeling processes and studied the effects of various loading mechanisms and culture conditions on collagen fiber orientation, which is a key factor in mechanical performance of the grafts. We were able to predict the fiber orientations accurately and show that biaxial loading and axial boundary conditions are important factors in collagen fiber organization.
Introduction
Tissue engineering and regenerative medicine, despite all challenges, has been one of the fastest growing fields over the past 20 years. The dominant approach in the field has been to develop functional tissue-engineered constructs by mimicking the form of the native tissue, 1 whereby research has been strongly focused on developing new biomaterials, 2 improving manufacturing techniques,3–5 and improving the techniques in cellular biology. 6 However, hidden in the “form follows function” dictum, are biological contributions to the function, which are the caveats to reverse engineering the tissue construct, since these missing parts of the puzzle expand the solution space exponentially. Fortunately, in silico tissue engineering merits potential for improving our understanding of the tissue construct by narrowing down the solution space and by optimizing the manufacturing processes,1,7 specifically in the case of TEVGs, where the net of mechanobiological events, involved in regulating the growth and remodeling of the tissue, stretches across several temporal and spatial length scales and conceptualizing these processes is a daunting task.
TEVGs are emerging as an alternative to saphenous vein grafting and autologous blood vessels.8,9 However, the application of TEVGs, specifically in the case of small-caliber arteries (<6 mm), remains limited due to low patency rates9,10 associated with poor mechanical strength and compliance mismatch.11–13 Achieving the mechanical properties of the native tissue has been a challenge since the development of the first TEVG by Weinberg and Bell. 14 Niklason and Langer 15 were among the very first groups that tried to address this issue by developing a novel bioreactor that allowed culturing TEVGs under conditions of pulsatile flow. Since then, various groups have tried to improve the mechanical strength of TEVGs by application of various loading regimens and/or manufacturing techniques.16–18
Agent-based modeling (ABM), finite element analysis (FEA), and coupled AB-FEA have been widely used to study mechanobiological interactions in various diseased and healthy states, such as Duchenne muscular dystrophy,19,20 volumetric muscle loss, 21 neovascularization in porous stents, 22 and vascular tissue engineering. 23 ABM is a computational technique for simulation of complex adaptive systems, 24 in which the overall response of the system is defined by the culmination of interactions and behaviors of individual agents (e.g., cells), and their response to external stimuli. These interactions and behaviors are defined using “rules,” which can be in the form of mathematical equations or logical expressions.
In this study, we extend a coupled AB-FEA computational modeling framework, previously developed by our group, 25 to investigate the effect of various loading scenarios (uniaxial, biaxial, and equibiaxial), boundary conditions, stretch magnitudes, and growth factor concentrations on growth and remodeling of TEVGs. We set up the model based on the work of Huang et al. 16 The AB-FEA model reported the production and alignment of collagen fibers, proliferation of the smooth muscle cells (SMCs), and concentrations of platelet-derived growth factor (PDGF), transforming growth factor-β (TGF-β), and vascular endothelial growth factor (VEGF) over time. For validation of the model, we compared the collagen content, SMC density, and fiber orientation with Huang et al. 16
Methods
We used a modified version of a coupled AB-FEA computational framework, which was previously established by our group, 25 to study the growth and remodeling of TEVGs under various loading scenarios. The coupled AB-FEA framework utilizes REPAST Simphony libraries 24 for the ABM simulations and the commercial FEA package ANSYS (ANSYS, Inc., Canonsburg, PA). We set up the model based on the experimental conditions reported by Huang et al. 16 (inner radius = 3.2 mm, thickness = 200 μm, and initial SMC population = 2.625e5). To reduce the computational time, we simulated a 1.6 mm segment of the graft. Huang et al. used a polyglycolic acid (PGA) mesh as the scaffold. The PGA meshes were wrapped around a distensible silicone tube and a pulsatile pressure of 270 mmHg/−30 mmHg was applied to the inner surface of the tube. This loading regimen led to a circumferential strain of 1.5%–2% on the surface of the tube. In this study, we did not include the silicon tube in the FEA simulations and instead applied the reported circumferential strain to the luminal surface of the tube. The PGA mesh was also excluded from the model as reviewing prior work 26 showed it did not contribute to the mechanics and is biocompatible, nontoxic, and FDA approved for human implantation. 27 We investigated the effect of various loading modes (uniaxial, biaxial, or equibiaxial) and combinations of growth factors, present in the serum, on the growth and remodeling of TEVGs, with specific focus on formation of collagen fibers and their orientation. All the figures were generated in MATLAB (MathWorks, MA).
Agent-Based Model
The ABM was developed in the REPAST Simphony environment (lattice based) and includes two superclasses of agents: patches and cells. The lattice size (patch dimension) was set to 100 × 100 × 400 μm (X, Y, and Z). The cell agents interact with a virtual representation of the spatially dependent soluble factors and the physical environment. In this study, as our focus was on SMC-populated scaffolds, the only cell type present in the model were SMCs. Structurally significant extracellular matrix (ECM) proteins were collagen fibers and gelatin; elastin was excluded due to the limited quantifiable information on production of elastin by SMCs. In this model, gelatin is the product of collagen degradation and it can influence the growth and remodeling by modulating the mass balance and affecting the mechanics (gelatin's stiffness28–30 is lower than collagen and higher than the cells, please refer to Table 2 to compare the material constants). Diffusion of the growth factors, cytokines, and matrix metalloproteinase (MMP) was handled by numerically solving the transient partial differential equations using a forward in time-centered in space algorithm in each ABM time step. The ABM ran the MATLAB Java engine in the background to perform these calculations. Each time step is a “tick” and represents 6 h of time.
Rule development
Rules, which are in the form of mathematical equations or logical expressions, are the backbone of the ABM, as they define how the agents respond to various stimuli and interact with each other. Rules were chosen to mimic the bioreactor conditions of the TEVG developed by Huang et al. 16 Table 1 includes a list of rules included in this model.
Table of Rules in the Agent-Based Modeling
SMC, smooth muscle cell; PDGF, platelet-derived growth factor; TGF-β, transforming growth factor-β; MMP, matrix metalloproteinase.
Production of growth factors, cytokines, and MMPs
Relative to our prior work, 25 we updated the rule that described collagen production by SMCs to account for the nonlinear nature of its dependence on TGF-β. The TGF-β production rule was adapted to a strain-based version. The MMP-1 production rule was also updated to be a function of VEGF concentration. Of note, with the exception of de novo SMCs, which produce copious amount of PDGF-BB, vascular SMC production of PDGF-BB is negligible.31,32
Proliferation of SMCs
We defined the baseline proliferation rate as the rate in which the SMCs proliferate in the absence of any external stimuli (growth factor, cytokine, mechanical loads, or serum) and calculated this value based on the experiments performed by Chapman et al. 33 Compared to prior models,25,34 we have updated the SMC proliferation rules to account for differences between various PDGF isoforms (PDGF-AA, PDGF-AB, and PDGF-BB). See Table 1, rules 2–6. Contact inhibition was modeled based on the experiments performed by Solodushko. 35 Specifically, once a patch is full, the cells are contact inhibited, and the proliferation slows down—Table 1, rule 6.
SMC orientation
SMC orientation, which generally matches the orientation of stress fibers,36,37 plays a pivotal role in vascular tissue mechanics through (a) maintaining active vascular tone and (b) affecting orientation of newly deposited collagen. 38 According to the phenomenon, known as stretch avoidance response, 39 SMCs and other cell types align perpendicular to the direction of uniaxial cyclic mechanical stretch.40–43 The extent of alignment is dependent on the frequency,41,44 amplitude,37,41 and duration of the stretch.45,46 It is important to note that the impact of topographic cues was not considered in this model, and the results may differ for vascular grafts that contain these cues.
In this study, SMC orientation was determined based on the directions of principal strains, by calculating the weighted average of the eigenvectors, using the inverse of eigenvalues as the weights. The eigenvalues and eigenvectors were calculated from the strain tensor received from the FEA for each patch in the grid space.
Collagen fiber orientation
Cyclic mechanical stretch induced the production of collagen by SMCs.47–49 The new collagen fibers were deposited parallel to the SMC long axis. 38 We assumed that collagen fibers retain their orientation during loading. In each time step and patch, the resultant orientation of the collagen fibers was determined by calculating the weighted average of fiber orientations deposited during previous time steps. The newly deposited collagen, in each time step, was used as the weight in the weighted average. In each patch, there were two families of fibers (Fig. 1).
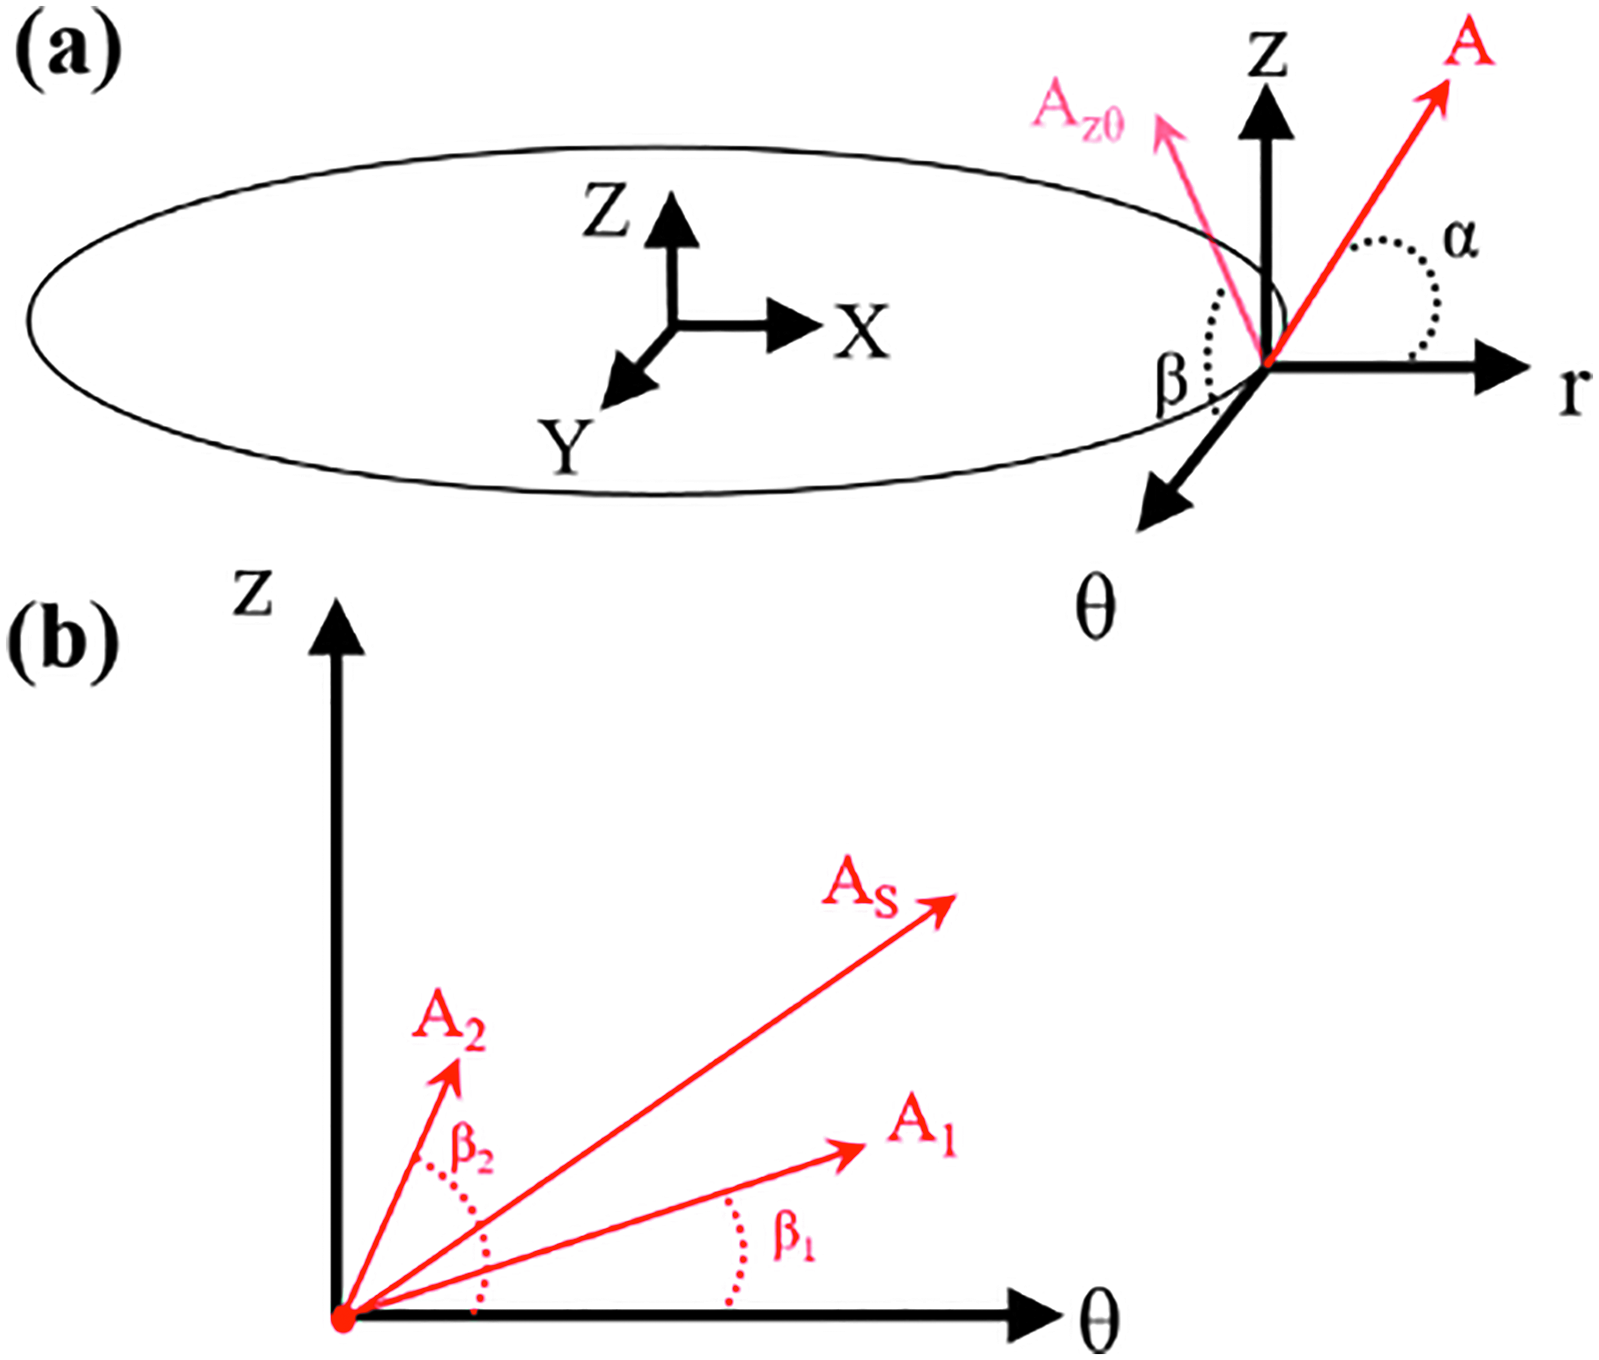
Schematic illustrating fiber angle definitions.
Finite Element Analysis
The interaction module, within the ABM, managed running the FEA simulations and transferring the data back and forth between the ABM and FEA. In each interaction, the FE models were created in batch mode, using an ANSYS Parametric Design Language script that built the FE model based on the point cloud (describing the geometry), point-wise mass fractions of contents (collagen, gelatin, and the cells), and fiber orientations available from the ABM's most recent tick. More details are provided in prior work. 25
We used a mass fraction-based version of the anisotropic hyperelastic strain energy density (SED) function, originally proposed by Holzapfel et al., 64 and assumed the arterial tissue to be incompressible. Noteworthy, this SED function does not account for the active mechanical properties of SMCs. Equations (2.1–3) depict the SED functions (i.e., W, wi, and wc) implemented in the FEA simulations, where, φi and ψc are mass fractions of the isotropic (cells and gelatin) and anisotropic contents (the two collagen fiber families), respectively. Ci is the initial shear modulus of the isotropic content i (which can be cells, elastin, or gelatin), κ1 and κ2 are constants, A and B are unit vectors that describe directions of collagen fiber families, and I1 is the first invariant of the right Cauchy-Green tensor, C.
We adapted the ANSYS AHYPER material model (Equations 2.4–7), which allows for modeling soft fiber-reinforced biological tissues, to mimic the two-fiber model suggested by Holzapfel et al. 64 The AHYPER model describes the SED as the summation of volumetric (Wv) and isochoric (Wd) SEDs, where C is the right Cauchy Green tensor, ai and bj are material constants of the isotropic part of the SED, c1 and c2 are the material constants for the first fiber, e1 and e2 are the material constants for the second fiber, A and B are the unit vectors for each fiber direction, I1 is the first invariant, and I2 is the second invariant.
The material constants were obtained from experiments performed by Seyedsalehi et al. 65 for collagen fibers, and Norris and McGraw 29 and Qiu et al. 66 for gelatin and SMCs, respectively (Table 2). Each patch, within the ABM, was associated with a unique set of material properties in the FEA, and we did not use a material table or clustering algorithm to combine similar materials. The boundary conditions were chosen to mimic the loading scenarios reported by Huang et al. 16
Material Constants for Collagen, Gelatin, and Smooth Muscle Cells in the Holzapfel SED Function
SED, strain energy density.
Model Setup
We constructed the model to match the geometry, initial values, and boundary conditions of the TEVG developed by Huang et al. 16 and investigated the effect of various (a) loading modes (uniaxial, biaxial, or equibiaxial), (b) boundary conditions, (c) stretch magnitudes, and (d) growth factor concentrations on the matrix content, SMC alignment, and collagen fiber orientation of the TEVG during a 12-week period. The graft was fixed at one axial end and, based on the loading scenario, was stretched (1.04 or 1.08), fixed, or free to move at the other end. A circumferential stretch (1.02, 1.04, or 1.08) was applied to the lumen. TGF-β (1.26 ng/mL) and PDGF-AA (1 ng/mL) were added to the model to represent culture media, on the abluminal side of the graft, as these growth factor concentrations are approximately equivalent to their concentrations in 10% serum. We then compared the trends in the predicted collagen content, fiber alignment, and SMC density with the values reported by Huang et al. 16 at 12 weeks.
Results
Role of loading mode
Below, we show the role the loading mode has on the composition, collagen fiber angles, and synthesis of soluble factors within the vascular graft. We set up the AB-FEA model based on initial conditions reported by Huang et al. 16 The vascular grafts were simulated under static (fixed axial ends), uniaxial (fixed axial ends, circumferential stretch = 1.02), biaxial (axial stretch = 1.08 and circumferential stretch = 1.02), and equibiaxial conditions for 12 weeks. The first three loading modes were based on conditions reported by Huang et al. 16 Equibiaxial loading was not reported on by Huang et al.
Loading mode and ECM composition
Biaxial loading (axial stretch = 1.08 and circumferential stretch = 1.02) had the highest impact on collagen content. At week 12, the collagen content was 6.49e3 ng (197.81 ng/mm3) under static, 7.51e3 ng (230.16 ng/mm3) under uniaxial, and 9.92e3 ng (301.55 ng/mm3) under biaxial conditions. Experimentally, under the same conditions, Huang et al. 16 also observed collagen content was highest under biaxial loading (static: 54% ± 7%, uniaxial: 48% ± 5%, and biaxial: 67% ± 3% of dry weights), although collagen was not significantly different between any loading condition. At week 12, SMC density was similar under static, uniaxial, and biaxial conditions (4514 Cells/patch, 4518 Cells/patch, and 4526 Cells/patch, respectively). Experimentally, at 12 weeks, Huang et al. also found SMC density was not significantly different between loading conditions (i.e., 970 ± 135 nuclei/mm2 for the static, 895 ± 35 nuclei/mm2 for the uniaxial, and 1256 ± 43 nuclei/mm2 for the biaxial case). For direct validation of the theoretical results, we cannot perform a one-to-one comparison of the measured values since Huang et al. 16 reported collagen content as percentage of dry weight and the SMC density in units of nuclei/mm2 (and not nuclei/mm3). Regardless, the AB-FEA model captured similar results to the experimental TEVG.
Loading mode and collagen fiber orientation
We categorized the fibers based on their radial positions. For each radial position, we plotted the histogram of the fiber angles [α: the angle between the Z-θ plane and radial direction, and β: the angle between Z and θ axes (Fig. 1)]. Figures 2 to 5 depict the orientations of collagen fibers at the start of the simulation and after 12 weeks of uniaxial, biaxial, and equibiaxial mechanical stimulation. Figures 6 and 7 depict the distributions of maximum principal stress and strain for the biaxial loading case.
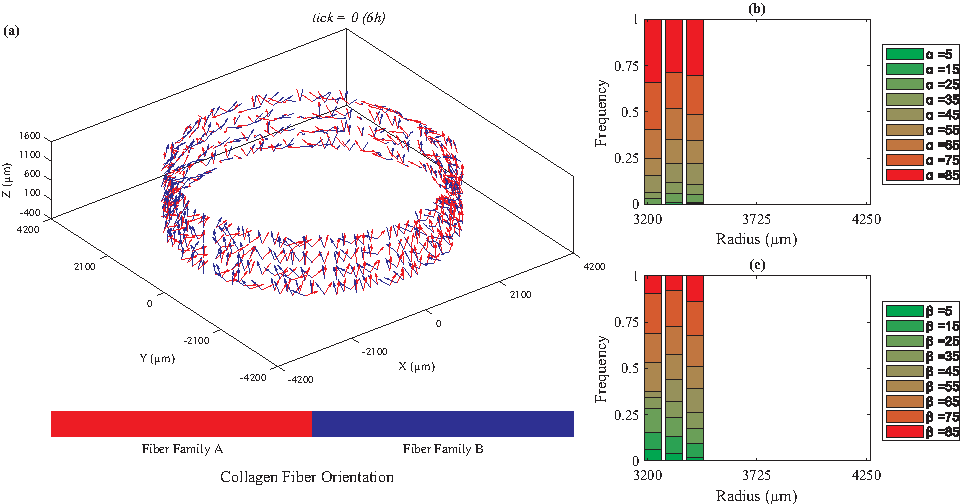
Initial collagen fiber orientations illustrating random assignment before loading.
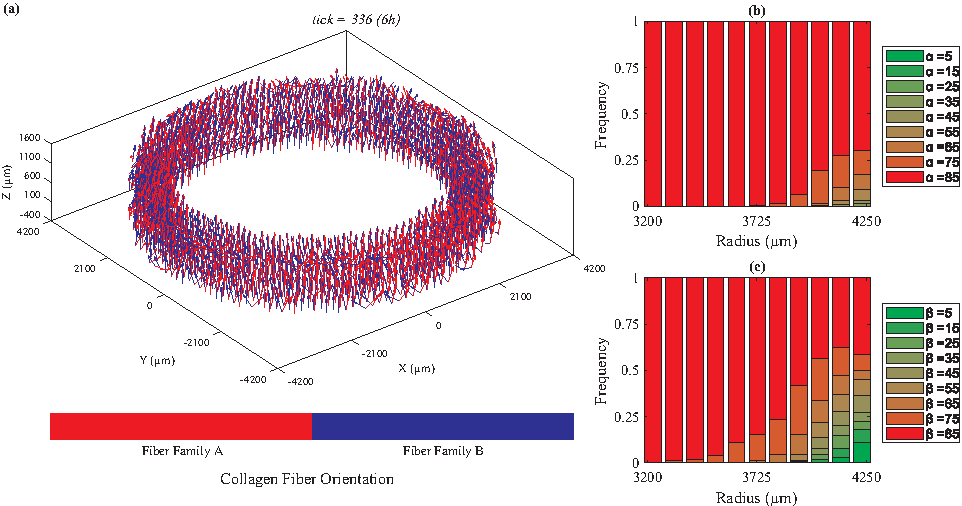
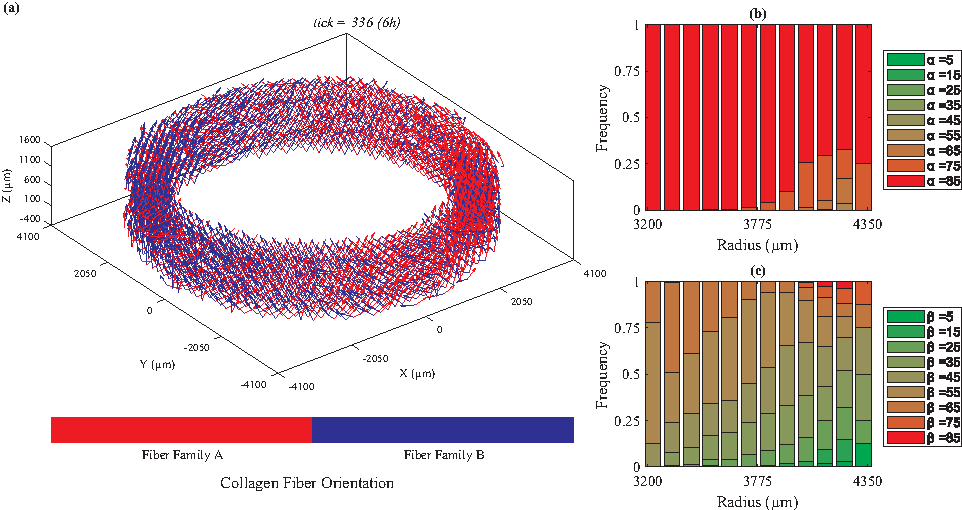
Under uniaxial loading (λθ=1.02, axially fixed), collagen fiber orientations are mainly perpendicular to the direction of stretch (β = ∼85°).
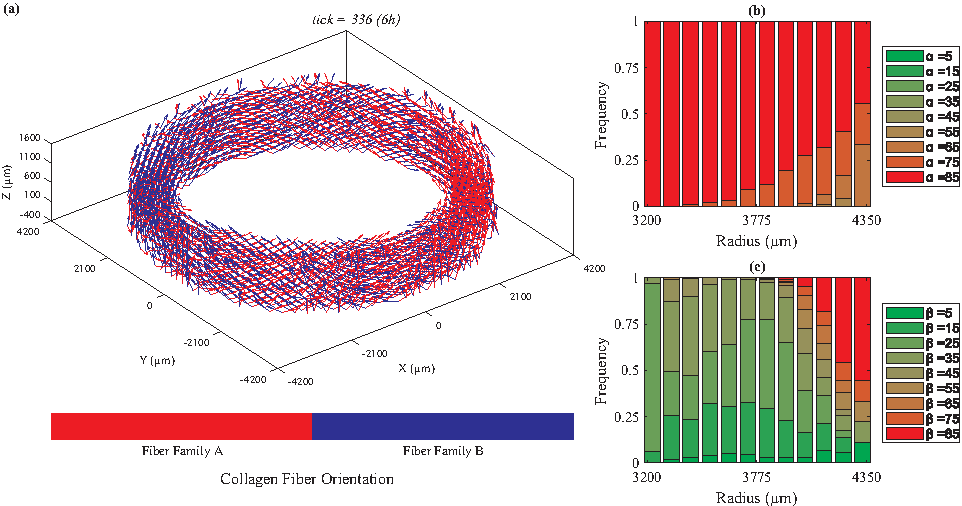
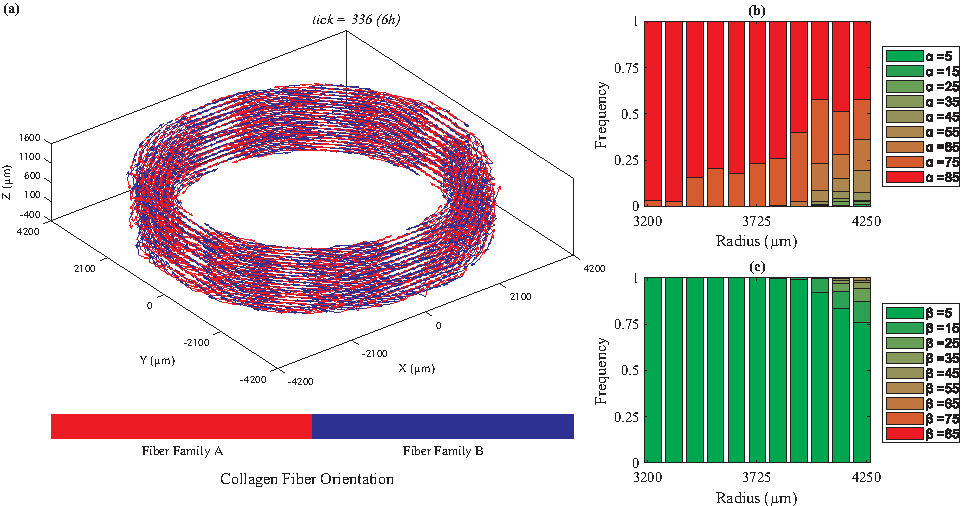
Under biaxial loading (λZ=1.08, λθ=1.02), collagen fiber orientations vary from circumferential (β = ∼20°) to axial as we move from the lumen to the outer boundary of the TEVG.
Equibiaxial loading (λZ=1.04, λθ=1.04) reversed the

Average maximum principal stress reaches the steady state (maximum) after 4 weeks of biaxial loading (λZ=1.08 and λθ=1.02).
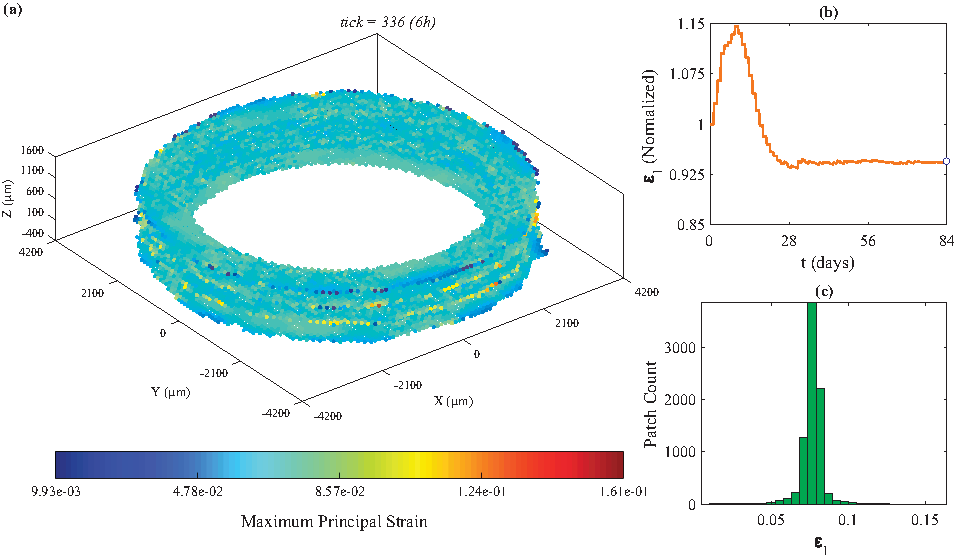
Average maximum principal strain approaches steady state (minimum) after 4 weeks of biaxial loading (λZ=1.08 and λθ=1.02).
In the absence of mechanical stimuli, whether it was at the start of the simulations or under static conditions, collagen fibers were randomly aligned (Fig. 2). Under uniaxial circumferential loading (Fig. 3), the majority of the collagen fibers aligned perpendicular to the direction of strain (β = ∼85°, Fig. 3c) and avoided the radial direction (α = ∼85°, Fig. 3b). A fiber's unit vector does not have any component in the radial direction when α = 90°; therefore, the fibers with α values close to 90° demonstrate a helical structure, which is consistent with vessels observed in vivo. In contrast, under biaxial loading, collagen fiber orientation varied from circumferential (β = 25°, Fig. 4c) in the lumen to mostly axial in the outer layers. These predictions are similar to what is observed in vivo67,68 and the orientations measured by Weidenhamer and Tranquillo 69 Moreover, qualitative results from all simulated cases (static, uniaxial, and biaxial) agree with the general trend observed experimentally by Huang et al. 16 Specifically, Huang et al. 16 also observed at 12 weeks under static loading conditions random orientation of collagen fibers throughout the artery wall; under uniaxial conditions, collagen fibers axially oriented in the inner layers and circumferentially aligned in the outer, and under biaxial conditions, the reverse, circumferentially aligned in the inner and axially oriented in the outer layers. Uniquely, under equibiaxial loading, the physiological trend that was observed in the biaxial case reversed. The β angle was highest in the inner layers and gradually reduced throughout the thickness. In the middle layers, three distinct fiber orientations were observed (β = 35°, 45°, and 55°) and interestingly, there was no preferred direction in the outer layer.
Role of Axial Boundary Conditions
To investigate the effect of axial displacement on collagen deposition and orientation, we compared the axially fixed and free TEVGs under uniaxial circumferential loads. The grafts were either fixed at both ends (0 displacement constraints in the Z direction) or fixed only at one axial end and simulated under 1.02 and 1.04 circumferential stretch for 12 weeks. In contrast with the axially fixed TEVGs (Fig. 3), collagen fibers aligned in the circumferential direction in the axially free TEVGs (Fig. 8). This phenomenon, which was also observed in vitro by Weidenhamer and Tranquillo, 69 can be explained by the preference of cells to avoid stretch and compaction.70,71 Moreover, when axial displacement was allowed, fiber orientation was not a function of stretch magnitude (no difference between 1.02 and 1.04 cases), which is in contrast with the axially fixed cases (Supplementary Figs. S1 and S2). There was no difference in collagen mass and SMC population between the axially fixed and free cases (Table 3, Supplementary Figs. S3 and S4).
Under circumferential loading and allowed axial displacement, collagen fibers align in the circumferential direction. TEVGs were only fixed in one axial end and stretched circumferentially (2%) for 12 simulated weeks.
Variation of Collagen Mass (mc), SMC Count (nSMC), and Thickness (t) of TEVGs Simulated Under Various Axial and Circumferential Stress Loading Scenarios at the End of Week 12 (i.e., 336 Ticks)
TEVG, tissue-engineered vascular graft.
Role of Stretch Magnitude
Increasing the stretch magnitude (circumferential, axial, or both) increased the total collagen mass, but did not affect the SMC population (Table 3). Axial stretch (λZ) was unstrained, 1, 1.04, or 1.08 and the circumferential stretch (λθ) was set to 1.02, 1.04, or 1.08. When both axial ends were fixed, increasing the circumferential stretch (λθ) increased the percentage of fibers that were aligned circumferentially in the outer layers; the majority of fibers, however, were still aligned along the axial directions (please refer to Supplementary Fig. S5). In the biaxial (and equibiaxial) loading modes, the fiber alignment did not depend on the stretch magnitude, but rather upon the ratio of axial and circumferential stretches (please refer to Fig. 5 and Supplementary Fig. S6 to compare the 1.04 and 1.08 equibiaxial loading). SMC population was not affected by the stretch magnitude.
Growth Factor Concentration
We investigated the effect of various combinations of growth factor (TGF-β and PDGF-AA) concentrations in the culture media on growth and remodeling of the biaxially loaded TEVGs. These combinations are shown in Table 4; rows 1–3 represent serum concentrations of 1%, 5%, or 10%. The grafts were simulated for 12 weeks under biaxial loading (λZ = 1.08, λθ = 1.02). Decreasing serum concentration from 10% (TGF-β = 1.26 ng/mL and PDGF-AA = 1 ng/mL, row 3) to 5% (row 2) or 1% (row 1), significantly slowed down the growth of the TEVGs. At week 12, the TEVGs with 10% serum reached a wall thickness of ∼1 mm, while the TEVG thickness for the 5% and 1% serum was 0.441 mm and 0.179 mm, respectively. Collagen fiber orientation was similar under 5% and 10% serum throughout the thickness. However, fibers were more randomly aligned in the Z-θ plane under 1% serum.
Effect of Various Combinations of Growth Factor Concentration on Collagen Mass, SMC Number, and Thickness of TEVGs Simulated Under Biaxial Loading (λZ = 1.0 and λθ = 1.02) at 12 Weeks of Simulated Time (Tick 336)
Discussion
Despite recent advances, developing a TEVG that mimics the performance of the native tissue is still a challenging task, specifically with regard to the long term mechanical performance, as no single design has yet been able to achieve—and retain—the desired mechanical strength and compliance. 2 This, in part, is due to the intrinsic complexity of the mechanobiological interactions involved in the growth and remodeling of the vascular tissue, which pose a challenge to engineering the grafts. In this study, we presented a multiscale computational modeling framework that can facilitate the development of vascular grafts and studied the effect of various loading modes (uniaxial, biaxial, and equibiaxial), boundary conditions, stretch magnitudes, and growth factor concentrations on ECM composition and orientation of collagen fibers in TEVGs.
Biaxial loading—and not equibiaxial or uniaxial—with dominant stretch in the axial direction led to physiological fiber alignment throughout the thickness of the TEVG. Holzapfel reported the fiber orientations in the intima, media, and adventitia of the abdominal aorta to be 18.8°, 37.8°, and 58.9°, respectively. 68 Our model predicted a similar trend for the biaxial loading mode (λZ = 1.08 and λθ = 1.02) and showed that under uniaxial circumferential loading, axial boundary conditions play a key role in determining the SMC orientation and therefore, collagen fiber alignment (Figs. 3, 8, and 9). This trend was in accord with the observations of Foolen et al. 72 They reported that after 3 days of uniaxial cyclic stretch, stress fibers aligned in the direction of the constraints. Weidenhamer and Tranquillo 69 also reported a similar alignment of collagen fibers in TEVGs. In that study, under uniaxial circumferential stretch, collagen fiber orientation was dependent on the axial boundary conditions. When the scaffold was fixed in the axial direction, fibers aligned in the axial direction, and in contrast, when scaffolds were allowed to compact in the axial direction, in response to increased circumferential stretch, fibers aligned in the circumferential direction. In addition, de Jonge et al. reported that cells and collagen fibers realign to the direction of uniaxial constraints. 73

Under circumferential loading and allowed axial displacement, SMCs align in the circumferential direction. TEVGs were only fixed in one axial end and stretched circumferentially (2%) for 12 simulated weeks.
Mechanical loading increased the collagen content of simulated vascular grafts in a stretch magnitude-dependent manner (Table 3); the SMC number, however, was not affected by mechanical stretch. In this study, we did not implement any ABM rule that directly affects—or describes—the proliferation rate of SMCs as a function of stretch, as there was no consensus in the literature on the inhibitory or augmenting effect of stretch on proliferation rate. While Chapman et al., 33 Sumpio and Banes, 74 and Hipper and Isenberg 75 have reported an inhibitory effect for stretch, Mills et al., 76 Wilson et al., 77 and Iwasaki et al. 78 have reported the SMC proliferation rate to increase in response to cyclic stretch. Wilson et al. 77 attributed the stretch-induced SMC proliferation to increased expression—and autocrine action—of PDGF-BB by de novo SMCs; however, other researchers have reported that vascular SMCs do not produce PDGF-BB.31,32
In the 12-week simulation using biaxial loading (λZ=1.08, λθ=1.02), a decrease in the provided serum concentrations of TGF-β and PDGF-AA (10% serum to 1% or 5% serum) substantially affected the population of SMCs (59.65% decrease for 5% serum and 96.90% decrease for 1% serum), the total collagen mass (60.75% decrease for 5% serum and 95.86% decrease for 1% serum), and the average thickness (55.16% decrease for 5% serum and 81.87% decrease for 1% serum), and consequently slowed down the growth and remodeling of the graft. Increasing TGF-β concentration (from 1.26 ng/mL to 12.6, 25.2, or 50.4 ng/mL) alone, while PDGF-AA concentration was kept constant at 1 ng/mL, either did not affect (TGF-β = 12.6 ng/mL) or slightly increased (TGF-β = 25.2 and 50.4 ng/mL) the total collagen mass. The population of SMCs slightly decreased (TGF-β = 12.6 and 25.2 ng/mL) and then increased (TGF-β = 50.4 ng/mL). Interestingly, the collagen mass per cell was highest at the lowest concentration of TGF-β (Table 4, row 1). In this case, the average thickness of the graft, at tick 336, was 179.54 μm. Further investigation showed that the maximum principal strain, which stimulates the production of TGF-β by SMCs, drops after the graft thickness reaches ∼200 μm (Fig. 6b, day 28); therefore, SMCs that were located beyond that thickness had access to less TGF-β and produced less collagen. This observation suggests that it might be necessary to, gradually, increase the stretch magnitude, as the thickness of the graft increases (implementing a time-dependent loading profile) to achieve the desired mechanical properties.
In conclusion, growth and remodeling of SMC-populated TEVGs without topographic cues under various loading conditions were presented using our coupled AB-FEA modeling framework. Through investigation of the evolution of collagen fiber orientations, collagen content, and SMC count during 12 weeks of culture under various loading scenarios, it is evident that biaxial (axially dominant) loading is necessary to achieve the physiological distribution of fiber orientations observed in vivo.
Footnotes
Acknowledgments
We would like to acknowledge the generous funding sources as well as the lab and University for their support.
Disclosure Statement
No competing financial interests exist.
Funding Information
Research reported in this publication was supported by the National Heart, Lung, and Blood Institute of the National Institutes of Health under Award Number R01HL136776. The content is solely the responsibility of the authors and does not necessarily represent the official views of the National Institutes of Health. The authors also received funding from the National Institutes of Health R01HL136776), American Heart Association (AHA), Scientist Development Grant (17SDG33400239), and Predoctoral Fellowship (17PRE33660840). The content is solely the responsibility of the authors and does not necessarily represent the official views of the grant agencies.
References
Supplementary Material
Please find the following supplemental material available below.
For Open Access articles published under a Creative Commons License, all supplemental material carries the same license as the article it is associated with.
For non-Open Access articles published, all supplemental material carries a non-exclusive license, and permission requests for re-use of supplemental material or any part of supplemental material shall be sent directly to the copyright owner as specified in the copyright notice associated with the article.