
Abstract
Dental pulp stem cells (DPSCs) are increasingly being recognized as a viable cell source for regenerative medicine. However, significant heterogeneity in their ex vivo expansion capabilities is well established, which influences their regenerative and therapeutic potentials. As highly proliferative/multipotent DPSCs are minority subpopulations within dental pulp, the development of noninvasive strategies, capable of successfully discriminating between DPSC subpopulations with contrasting proliferative and differentiation capabilities in situ, would be immensely beneficial for the selective screening/isolation of superior quality DPSCs for in vitro assessment and therapy development. Consequently, this study assessed the effectiveness of single-cell Raman spectroscopy (SCRM), in distinguishing between DPSC subpopulations with contrasting proliferative and differentiation capabilities isolated from dental pulp tissues. Individual DPSC subpopulations were isolated from human third molars and identified as high or low proliferative and multipotent or unipotent, following in vitro expansion and senescence confirmation. High proliferative/multipotent DPSCs, such as A3 (18 population doublings [PDs] and 60PDs), and low proliferative/unipotent DPSCs, including A1 and B1 (8PDs and 7PDs, respectively), were analyzed using an iHR550 Raman spectrometer, equipped with a CCD camera and Eclipse Ti-U inverted microscope. Single-cell spectra were acquired for 20 cells in each subpopulation (10 spectra per nuclear and 10 spectra per cytoplasmic/membrane region in each cell analyzed), over 500–2100 cm−1. Spectra and peak assignments were obtained, followed by principal component analysis (PCA) and multivariate statistical analysis. Although DPSC spectra contained typical Raman peaks for nucleic acids, proteins, and lipids, the spectral intensities of high proliferative/multipotent DPSCs, A3 (18PDs), were higher than A3 (60PDs), A1 (8PDs), and B1 (7PDs), reflecting significantly elevated DNA (729 cm−1) and protein (1111, 1167, 1245, and 1680 cm−1) contents overall. PCA and multivariate analysis revealed significant variations in scatter plots and Raman signatures, with distinct fingerprints for high proliferative/multipotent DPSCs, A3 at 18PDs and 60PDs; versus the similar overlapping profiles for low proliferative/unipotent DPSCs, A1 (8PDs) and B1 (7PDs). This study confirms that SCRM successfully discriminates between DPSC subpopulations with contrasting proliferative and differentiation capabilities, advocating its further assessment as a viable technique for the selective noninvasive screening, identification, and isolation of high proliferative/multipotent DPSCs from dental pulp tissues for regenerative medicine applications.
Impact Statement
This study is the first to investigate and confirm the effectiveness of single-cell Raman spectroscopy (SCRM), in its ability to discriminate between dental pulp stem cells (DPSCs) with contrasting proliferative and differentiation capabilities. The findings show that SCRM can rapidly and noninvasively distinguish and identify DPSC subpopulations in vitro with superior proliferative and multipotency properties, versus lesser quality DPSCs, thereby overcoming the significant heterogeneity issues surrounding DPSC ex vivo expansion and differentiation capabilities. Such findings support further SCRM assessment for the selective screening/isolation of superior quality DPSCs from whole dental pulp tissues, for more effective in vitro evaluation and therapy development.
Introduction
Tissue repair and regeneration in patients with chronic diseases are a major clinical challenge, especially with ever-increasing aging populations worldwide. Adult mesenchymal stem cells (MSCs) are vital to tissue engineering for the development of cell-based therapies.
Dental pulp stem cells (DPSCs) are increasingly recognized as a viable stem cell source for regenerative medicine purposes, due to their self-renewal, clonogenicity, and multipotent differentiation properties.1–4 However, similar to bone marrow-derived MSCs, DPSCs possess significant heterogeneity, with individual clones demonstrating differences in proliferation and lineage differentiation capabilities. Indeed, despite heterogeneous DPSC population expansion achieving >120 population doublings (PDs) in vitro, only 20% of purified DPSCs are capable of proliferating >20PDs. Of these, only two-thirds generated ectopic dentine in vivo, implying that subset DPSC populations differ in their regenerative potentials.5,6
DPSCs are also proposed to exist within distinct niches within dental pulp tissues (subodontoblastic layer, pulpal vasculature, and central pulp), 7 which increases the complex nature of the origins and regenerative characteristics of individual DPSC subpopulations further. Such considerations are pivotal to the exploitation of DPSCs, as a significant limitation of MSC-based therapies is that extensive in vitro expansion eventually leads to proliferative decline and senescence, accompanied by impaired cellular regenerative properties.8–10
Despite significant differences in the ex vivo expansion capabilities of individual DPSCs being recognized, only recently has work begun to address the impact of such variations in proliferative capabilities before senescence, on the multipotency of different DPSC subpopulations. 11 Although high proliferative DPSCs achieved >80PDs, low proliferating DPSCs only completed <40PDs before senescence, correlating with DPSCs with high proliferative capacities possessing longer telomeres (>18 kb) than less proliferative populations (5–13 kb). Low proliferative DPSC senescence was also associated with early loss of stem cell marker characteristics and impaired osteogenic and chondrogenic differentiation, in favor of adipogenesis. In contrast, high proliferative DPSCs retained multipotent differentiation capabilities, only demonstrating impaired differentiation following prolonged in vitro expansion (>60PDs). 11
It has been proposed that high proliferative/multipotent DPSCs are minority subpopulations within dental pulp tissues.7,11 Therefore, to fully exploit these desirable DPSCs for regenerative purposes, it is imperative that strategies are developed, which permit the optimization of population selection through the selective screening and isolation of superior quality DPSCs from dental pulp tissues for in vitro expansion, assessment, and prudent cell banking, thereby aiding the translational development of more effective DPSC-based therapies for clinical evaluation and application.12–14
However, conventional ex vivo cellular expansion and stem cell/senescence characterization techniques used to identify superior DPSCs are often expensive, labor-intensive and time-consuming, while cellular expansion can also detrimentally alter stem cell characteristics leading to reduced regenerative properties.11,15 Such issues may be confounded by the requirement for invasive fixation, staining, or cell permeabilization techniques, which damage cellular components during MSC characterization.15–18 Furthermore, these procedures prevent the reuse of evaluated cells, while many of the techniques utilized have resolution limitations and thus cannot be performed at single-cell levels. Consequently, there is a need to develop more nondestructive approaches to cell imaging, analysis, and identification in situ, to provide highly sensitive real-time imaging and chemical information during cell characterization, ultimately leading to the more effective use of MSCs for regenerative therapies.
Raman spectroscopy is increasingly becoming a powerful analytical method in biomedical research, particularly due to its label-free and noninvasive characteristics. Raman spectroscopy is a laser-based scattering technique that permits the analysis of cellular chemical composition (DNA, RNA, lipids, and proteins), molecular markers, and the biological functions of individual cells within a spectral region of 600–2000 cm−1, through the use of principal component analysis (PCA) and multivariate statistical analysis.19,20 Consequently, Raman spectra obtained for individual cells provide unique biochemical fingerprints of cellular status and functions, including metabolism, phenotype, and apoptosis/senescence, and abilities to distinguish between different cell types.
Raman spectroscopy is now widely used in regenerative medicine for the characterization of multipotency/pluripotency and the differentiation status of MSCs from numerous sources, including dental pulp.16–18,21–23 However, this proof-of-concept study is the first to apply single-cell Raman spectroscopy (SCRM) to DPSC subpopulations to evaluate its abilities in providing real-time evidence capable of discriminating between DPSCs with contrasting proliferative and differentiation capabilities ex vivo. Successful validation will subsequently form the basis for the further assessment of SCRM for the identification and isolation of high proliferative/multipotent DPSCs from intact dental pulp tissues in situ, for regenerative medicine purposes.
Materials and Methods
DPSC isolation and characterization of proliferation/differentiation capabilities
DPSCs were isolated from third molar teeth collected from patients (all female, age 18–30 years), with informed patient consent and ethical approval, as previously described. 11 Single-cell suspensions of dental pulp tissues were obtained, with DPSCs preferentially selected and isolated from cell suspensions by differential fibronectin adhesion assay.11,24 Isolated cells were confirmed as DPSCs through cell surface marker expression (positive for MSC markers, CD73, CD90, and CD105; negative for hematopoietic stem cell marker, CD45).
DPSCs subsequently underwent extended culture expansion and characterization as being high or low proliferative and multi- or unipotent. Proliferation analysis was based on the PDs reached by each DPSC subpopulation before senescence (at <0.5PDs/week); and the detection of other senescence-related markers, including reduced telomere lengths, positive senescence-associated β-galactosidase staining; and increased p53, p21waf1, and p16INK4a expression. 11 Differentiation analyses were based on the abilities of each DPSC subpopulation to undergo osteogenic, chondrogenic, and adipogenic differentiation, via detection of established differentiation markers as previously described. 11 Individual DPSC subpopulations were subsequently confirmed as being high proliferative/multipotent DPSCs (such as A3, capable of >80PDs) or low proliferative/unipotent DPSCs (such as A1 and B1, capable of <40PDs). 11
Raman spectroscopy instrumentation
The Raman microscopy system used in this study is shown in Figure 1. The instrument was based on an Eclipse Ti-U inverted microscope, with a 20 × (NA = 0.75) dry objective (Nikon, Kingston upon Thames, UK). The laser source was a diode pumped solid-state laser, operating at 532 nm and maximum power of 50 mW (Lasever, Ningbo, China). The laser beam passed through a Semrock clean-up filter (Laser 2000, Huntington, UK) to remove optical noise. To fulfill the back-aperture (diameter, 4.37 mm) of the 20 × objective, the laser beam size (1/e2) of 2 mm was expanded 3 × . At this size, a 1:3 beam expander composed of two visible achromatic lenses of focal lengths, f = +75 mm and f = −25 mm, were used with a scan lens of f = 100 mm (all Thorlabs, Ely, UK).

Schematic diagram of the Raman microscopy setup used in this study.
The laser beam was reflected from a Semrock dichroic beam splitter (Laser 2000) and focused onto each sample by the objective lens. Raman scattered light was collected by the objective lens and transmitted via the same dichroic beam splitter. Scattered light passed through a Steinheil triplet achromatic lens (1:1 magnification, f = 50 mm; Edmund Optics, York, UK), followed by a 6 mm confocal slit (Thorlabs) and another triplet achromatic lens. A biconvex lens (f = 25 mm; Thorlabs) was placed in front of the confocal slit to image samples onto the grating of the spectrometer. Before entering the spectrometer, Raman scattered light passed through a Semrock long pass filter (Laser 2000) to reject Rayleigh scatter.
The spectrometer used was an iHR550 Jobin Yvon imaging spectrophotometer (Horiba, Kyoto, Japan), equipped with a 600 grooves/mm grating (spectral resolution, 4 cm−1) and a Newton 940 spectroscopy CCD camera (Andor Technology, Belfast, UK). The spectrometer was calibrated before each experiment, using a clear neon lamp (RS Components, Corby, UK), which allowed Raman spectra pixel conversion to wavenumbers. Neon spectra were taken at central wavelength positions of 600 nm. Neon spectra in pixels were compared with published neon spectra in wavelength format; and pixel-wavelength experimental data plotted using linear regression. Detector sensitivity was determined to be ∼98%.
Sample preparation and SCRM analysis
The high proliferative/multipotent DPSC subpopulation, A3, at early (18PDs) and late (60PDs) stages of its proliferative lifespan and low proliferative/unipotent DPSCs, A1 and B1 (8PDs and 7PDs, respectively), were cultured in T-75 flasks until 80% confluence and harvested using StemPro®Accutase® (ThermoFisher Scientific, Paisley, UK). Cells were retrieved, washed (2 × ) in phosphate-buffered saline, and fixed in 96% alcohol, at 2.5 × 10⁵ cells/mL. Sample chambers were made using 80-μm-deep vinyl spacers between quartz slides and coverslips (1 mm and 200 μm thickness, respectively; UQG, Cambridge, UK).
DPSC suspensions (5 × 10³ cells, 20 μL) were pipetted directly onto the quartz surfaces, and DPSCs were allowed to sediment onto the inverted coverslips for ∼30 min, before analysis. SCRM spectra were acquired from 20 fixed cells from each DPSC subpopulation, along with the background spectra. The laser power on each sample during signal acquisition was ∼36 mW; and each spectrum was collected in the range from 500 to 2100 cm−1 (grating 150 grooves/mm) with an integration time of 60 s. At the beginning of each Raman session, the dark current of the Andor CCD camera was also quantified. Ten spectra were measured for the nuclear and 10 for the cytoplasmic/membrane regions of each cell analyzed, to obtain average spectra representative of each DPSC subpopulation analyzed.
SCRM data analysis
Raw data were converted into Raman spectra using Origin V7 software (OriginLab, Northampton, MA). Mean Raman and background spectra derived from the 20 individual cells were collected and dark currents subtracted. Average backgrounds were subtracted from each mean Raman spectrum for fluorescence suppression. 25 All spectra were normalized to peak areas at 1450 cm−1 (related to C-H deformation vibrations in nucleic acids, proteins, carbohydrates, and lipids), to enable direct data comparisons. 26
Data were detected as relative intensities (arbitrary units, a.u.), with the main Raman spectra peaks for each DPSC subpopulation assigned through comparisons with previously described reference peaks.16,27,28 Raman spectra were further analyzed using PCA and multivariate statistical analysis, with principal component (PC) scores reflecting the most significant variations in DPSC Raman spectra. PCA was performed using built-in R function, prcomp.
Statistical analysis
The peak intensities of selected bands for the high proliferative/multipotent and low proliferative/unipotent DPSCs were expressed as mean ± standard deviation of the mean. Statistical analysis was performed using Prism software (GraphPad software, San Diego, CA), with statistical significance between selected Raman peaks confirmed by unpaired Student's t tests. Significance was considered at p < 0.05.
Results
Discrimination between DPSCs with contrasting proliferative and differentiation capabilities
Distinct DPSC subpopulations were previously isolated and characterized as high proliferative/multipotent (A3) and low proliferative/unipotent (A1 and B1). 11 DPSCs were subsequently analyzed to confirm whether SCRM could distinguish between such subpopulations with contrasting proliferative and differentiation capabilities in vitro, based on the respective Raman spectra and molecular fingerprints obtained.
Mean Raman spectra obtained over 600–1800 cm−1, for particular high proliferative/multipotent and low proliferative/unipotent DPSC subpopulations at specific PDs, are shown in Figure 2. The dominant peaks and corresponding assignments identified within these Raman spectra are presented in Table 1. Spectra for the high proliferative/multipotent DPSC subpopulation, A3, at early (18PDs) and late (60PDs) stages of the proliferative lifespans and low proliferative/unipotent DPSCs, A1 and B1 (8PDs and 7PDs, respectively), were identified to contain typical Raman peaks for biomolecules, including DNA and proteins, in addition to the expected detection of C-H deformation vibrations in nucleic acids, proteins, carbohydrates, and lipids at 1450 cm−1; consistent with reports with various other cell types.15,16,27,28
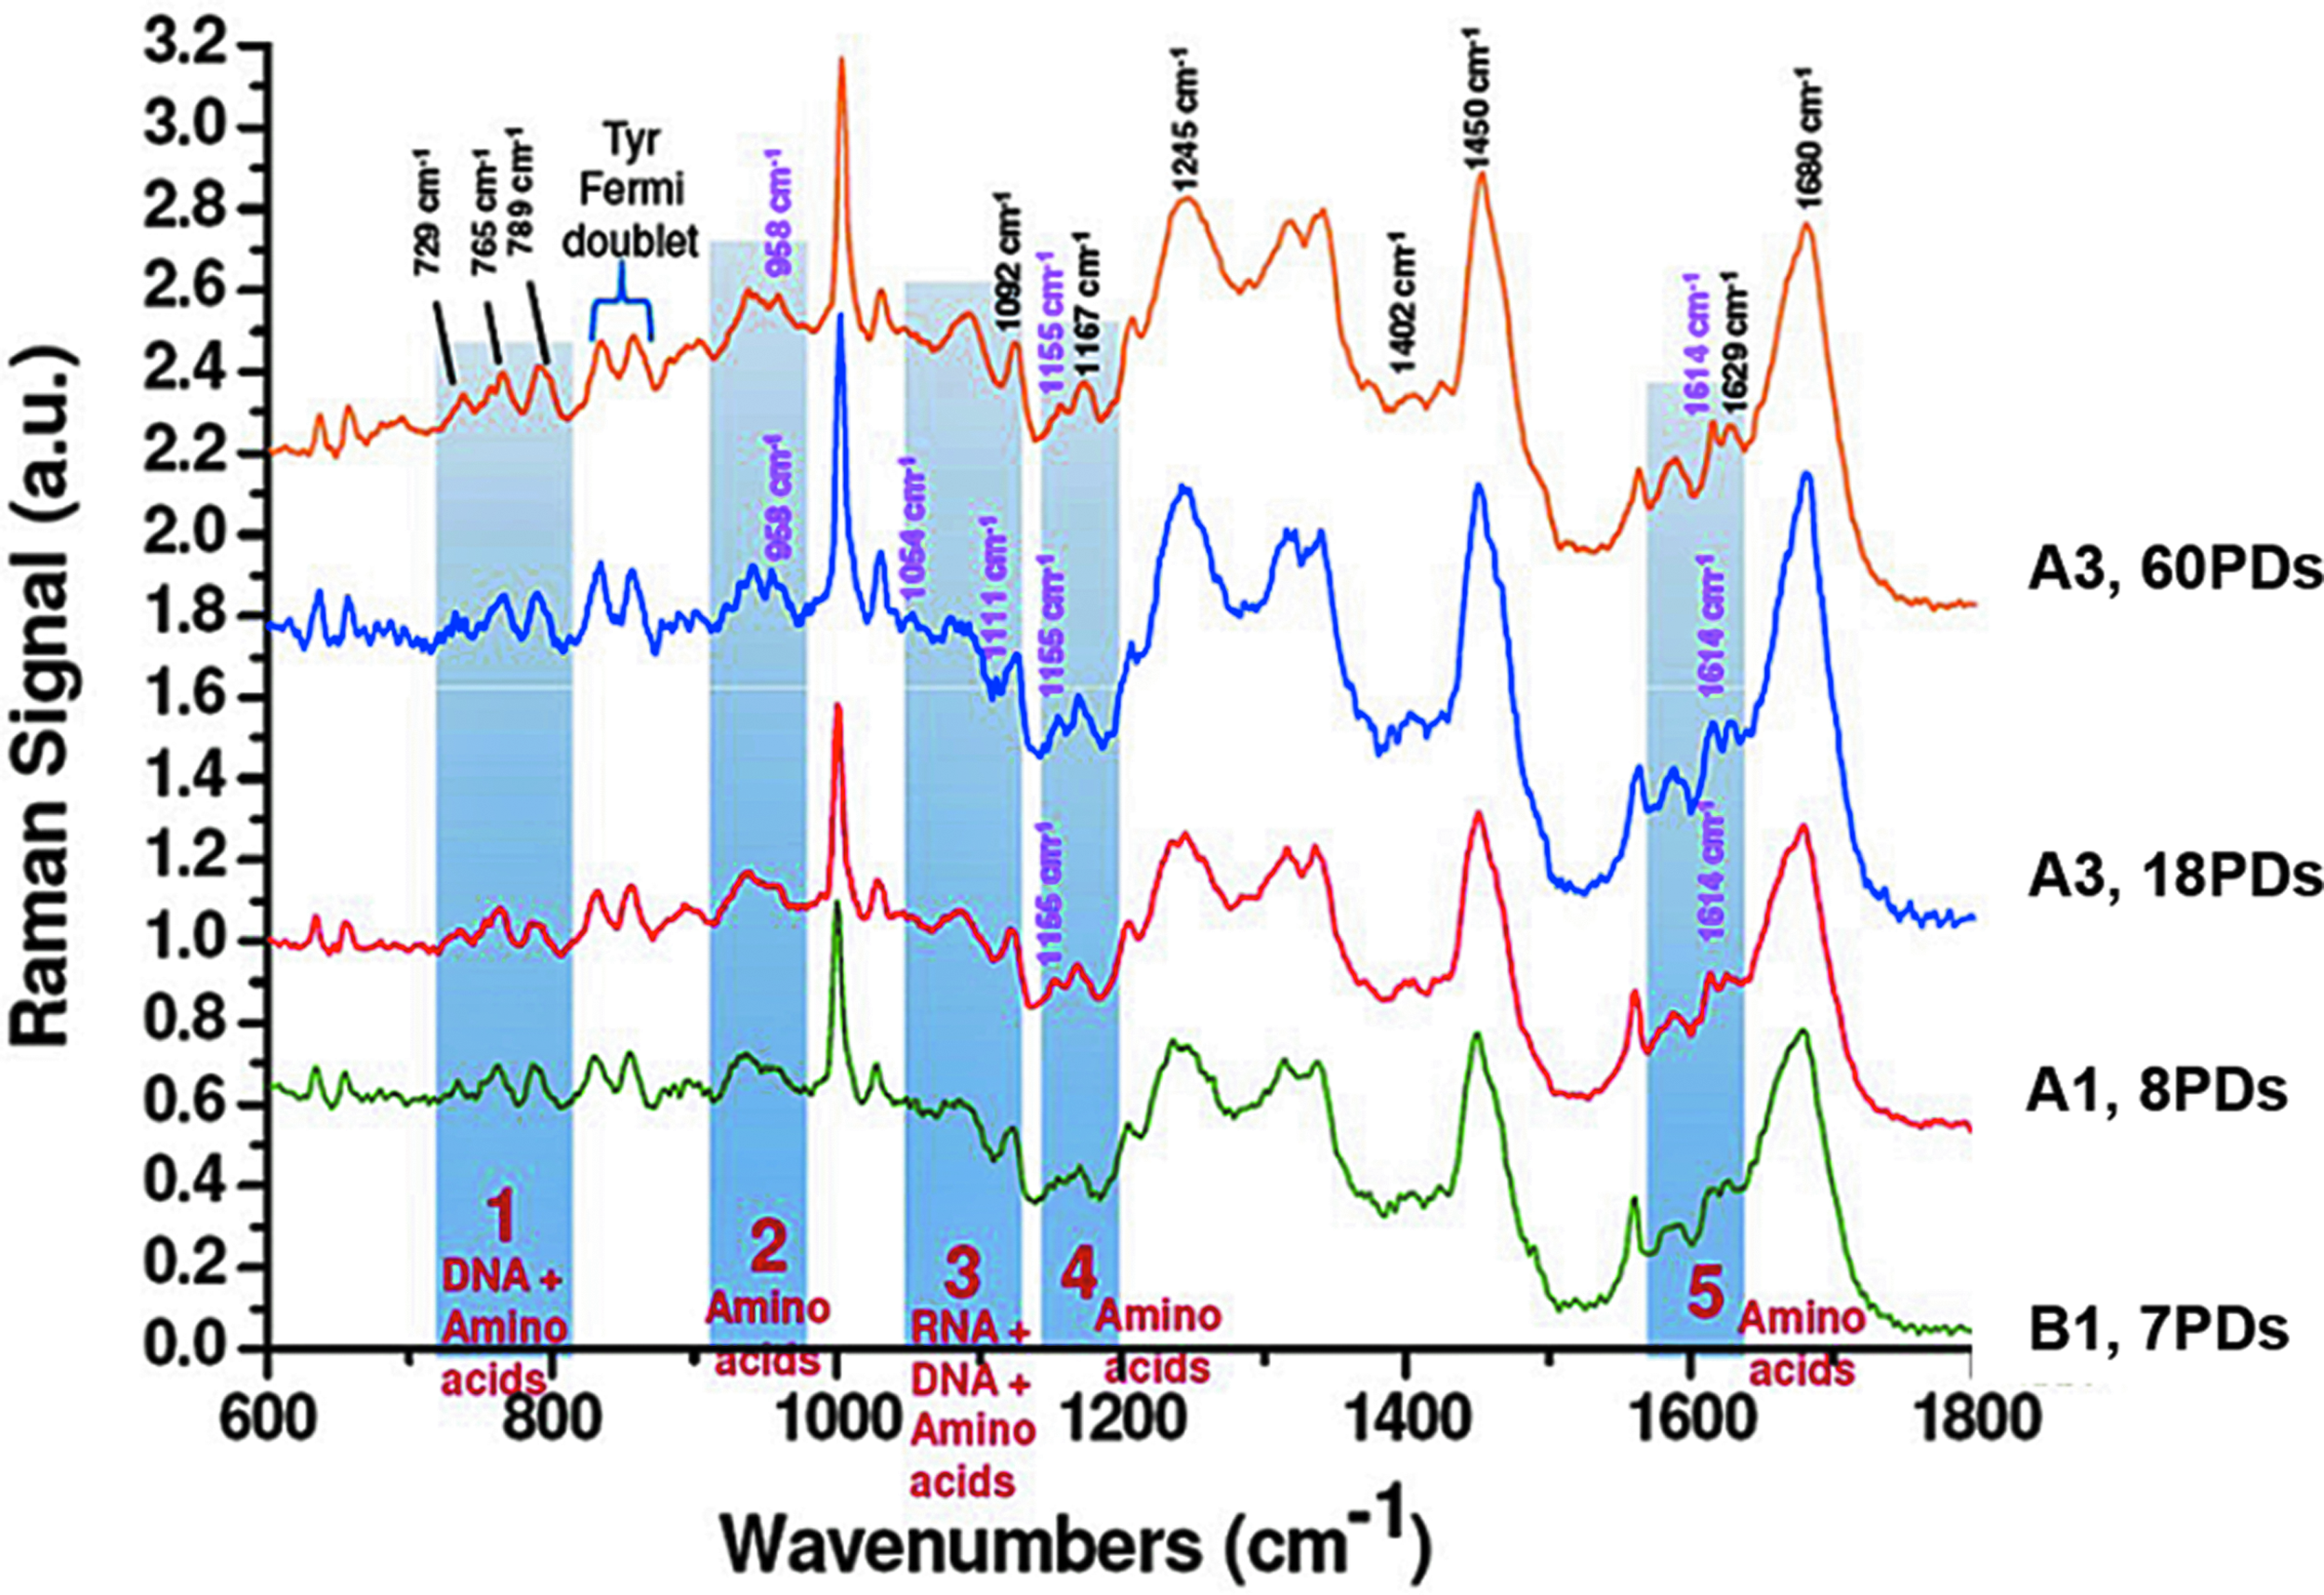
Comparison of mean Raman spectral fingerprints for high proliferative/multipotent DPSC subpopulation, A3 at 18PDs and 60PDs, and low proliferative/unipotent DPSC subpopulations, A1 and B1 (8PDs and 7PDs, respectively). Mean spectra were determined from n = 20 individual cells per DPSC subpopulation and displayed in the fingerprint range of 600–1800 cm−1. Spectra were normalized to peak areas at 1450 cm−1. Data were detected as relative intensities (a.u.). The most prominent spectral bands are highlighted (in blue) and the corresponding wavenumbers assigned. Regions 1–5 denote the largest peaks detected. All spectra contained typical Raman peaks for DNA (729, 765, 789, and 1092 cm−1), proteins (834, 858, 1167, 1245, 1402, 1629, and 1680 cm−1), and biomolecular C-H deformation vibrations (1450 cm−1). The spectral intensity of A3 at 18PDs was much higher than A3 (60PDs), A1 (8PDs), and B1 (7PDs), reflecting elevated DNA and protein contents overall. Certain peaks were particularly identifiable in high proliferative/multipotent subpopulation, A3, at 18PDs (see Table 1 for further details). a.u., arbitrary units; DPSC, dental pulp stem cell; PDs, population doublings.
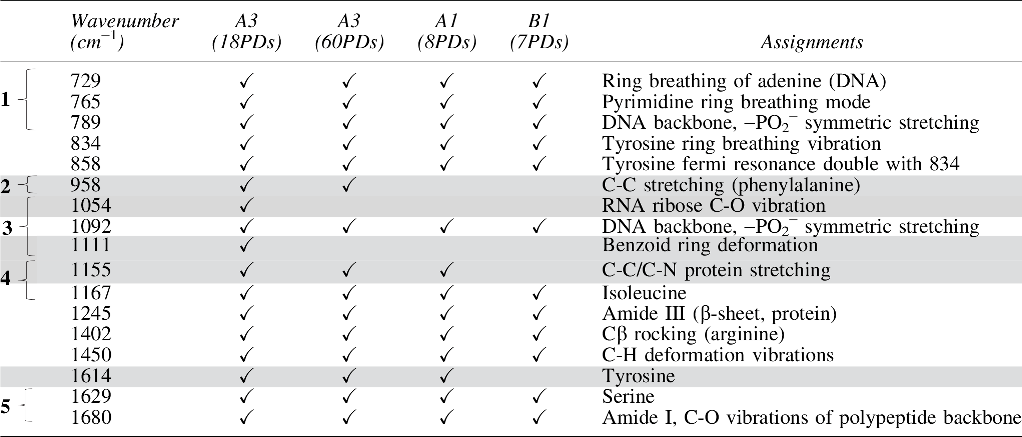
Identified in mean Raman spectra for high proliferative/multipotent DPSC subpopulation, A3 at 18PDs and 60PDs, and low proliferative/unipotent DPSC subpopulations, A1 and B1, (8PDs and 7PDs, respectively).
Regions 1–5 (in bold) denote the largest detectable peaks. Shaded areas indicate peaks demonstrating the largest differences between DPSC subpopulations.
DPSC, dental pulp stem cell; PDs, population doublings.
Specifically, Raman bands associated with DNA bases at 729 cm−1 (ring breathing of adenine) and 765 cm−1 (pyrimidine ring breathing mode), and the nucleic acid backbone at 789 and 1092 cm−1 (β-conformation DNA and PO2− phosphodiester stretching vibrations) were identified. Similarly, Raman protein bands were detected at 834, 858, 1167, 1245, 1402, 1629, and 1680 cm−1, accounting for tyrosine, isoleucine, amide III, Cβ rocking (arginine), serine, and amide I regions, respectively. Regions 1–5 denote the largest peaks detected (Fig. 2 and Table 1, bracketed regions).
However, spectral differences were particularly evident when comparing the high proliferative/multipotent DPSC subpopulation, A3 at 18PDs versus A3 at 60PDs, and the low proliferative/unipotent subpopulations, A1 (8PDs) and B1 (7PDs). Indeed, the spectral intensities of A3 (18PDs) were much higher than A3 (60PDs), A1 (8PDs), and B1 (7PDs), reflecting elevated DNA and protein contents overall. Furthermore, peaks for RNA ribose C-O vibration (1054 cm−1) were only identifiable for the high proliferative/multipotent subpopulation, A3 (18PDs, Fig. 2 and shaded region, Table 1).
Other notable variations identified included the increased detection of benzoid ring deformation (1111 cm−1) with high proliferative/multipotent subpopulation A3 (18PDs) only; and phenylalanine peaks (958 cm−1) with high proliferative/multipotent subpopulation, A3, at both 18PDs and 60PDs only. Subpopulation differences in other amino acid and protein levels were also detected, with the absence of peaks relating to C-C/C-N protein stretching (1155 cm−1) and tyrosine (1614 cm−1), with low proliferative/unipotent subpopulation, B1 (7PDs, Fig. 2 and shaded regions, Table 1).
Raman peak intensity differences related to cell proliferation and growth
To further illustrate spectral differences between DPSC subpopulations, the peak intensity differences in selected DNA and protein bands associated with cellular proliferation/growth were assessed between high proliferative/multipotent subpopulation A3 at 18PDs and 60PDs, compared with low proliferative/unipotent subpopulations A1 (8PDs) and B1 (7PDs, in bold, Table 2).
Percentage Intensity Decreases in Selected DNA and Protein Bands (in Bold)
Detected in Raman spectra of high proliferative/multipotent DPSC subpopulation, A3 (60PDs), and low proliferative/unipotent DPSC subpopulations, A1 and B1 (8PDs and 7PDs, respectively), compared with high proliferative/multipotent DPSC subpopulation, A3 (18PDs)
In line with its more proliferative nature, DPSC subpopulation, A3 (18PDs), exhibited higher DNA (729, 786, and 1092 cm−1) and protein (1167, 1245, 1629, and 1680 cm−1) peak intensities, particularly versus both the low proliferative/unipotent subpopulations, A1 (8PDs) and B1 (7PDs, Table 2). Such peak intensity differences were most prominent for reductions in DNA (729, 789, and 1092 cm−1) and C-H deformation vibrations (1450 cm−1) in the low proliferative/unipotent subpopulations, with peak intensity reductions even being of greater magnitude than those for high proliferative/multipotent subpopulation, A3 (60PDs). In contrast, high proliferative/multipotent subpopulation, A3 (60PDs), exhibited more subtle differences in peak intensities versus the early PD counterparts (Table 2).
However, A3 (60PDs) and low proliferative/unipotent subpopulations, A1 (8PDs) and B1 (7PDs), all exhibited major decreases in protein-related peak intensities at 1167 cm−1 (isoleucine), 1245 cm−1 (amide III region), 1402 cm−1 (Cβ rocking, arginine), 1629 cm−1 (serine), and 1680 cm−1 (amide I region), compared with high proliferative/multipotent A3 (18PDs, Table 2).
Peak intensity differences between high proliferative A3 (18PDs) and low proliferative A1 (8PDs) and B1 (7PDs) were confirmed to be statistically significant for DNA (729 cm−1, both p < 0.001) and protein (1167, 1245, and 1680 cm−1, p < 0.001–p < 0.05) peaks (Fig. 3). However, no significant differences were shown between A3 (18PDs) and both low proliferative/unipotent subpopulations, A1 (8PDs) and B1 (7PDs), for DNA peaks at 786 and 1092 cm−1; and protein peaks at 1629 cm−1 (all p > 0.05).

Mean peak intensities for selected DNA (729, 789, and 1092 cm−1) and protein (1167, 1245, 1629, and 1680 cm−1) bands commonly associated with cellular proliferation/growth, detected in Raman spectra of high proliferative/multipotent DPSC subpopulation, A3 (18PDs), and low proliferative/unipotent DPSC subpopulations, A1 and B1 (8PDs and 7PDs, respectively). Peak intensity data were presented as a.u. Statistically significant increases in peak intensities were shown for DNA (729 cm−1, p < 0.001) and protein (1167, 1245, and 1680 cm−1, p < 0.001–p < 0.05) peaks in high proliferative/multipotent DPSC subpopulation, A3 (18PDs). No other significant differences were shown (p > 0.05). Peak intensity values were determined from n = 20 individual cells per DPSC subpopulation, with data expressed as mean ± SD (*p < 0.05, **p < 0.01, and ***p < 0.001). SD, standard deviation.
PCA discrimination between DPSCs with contrasting proliferative and differentiation capabilities
Further analysis of high proliferative/multipotent and low proliferative/unipotent DPSC Raman spectra using PCA and multivariate statistical analysis revealed spectral discrimination between DPSC subpopulations. This was particularly evident with the loading plots for principal components, PC3 and PC4, which provided the largest variance (PC3 = 98%, PC4 = 97%) between DPSC subpopulation spectra (Fig. 4).

Principal component analysis (PCA) loading plots for
Two-dimensional scatter plots obtained using PC3 and PC4 scores for high proliferative/multipotent DPSC subpopulation, A3, at 18PDs and 60PDs and low proliferative/unipotent DPSCs, A1 and B1 (8PDs and 7PDs, respectively), are shown in Figure 5. The scatter plots demonstrated clear spatial separation between the profiles obtained for each DPSC subpopulation, with three clearly distinct clusters evident. Furthermore, the compact nature of individual clusters indicated high levels of homogeneity within each data set.
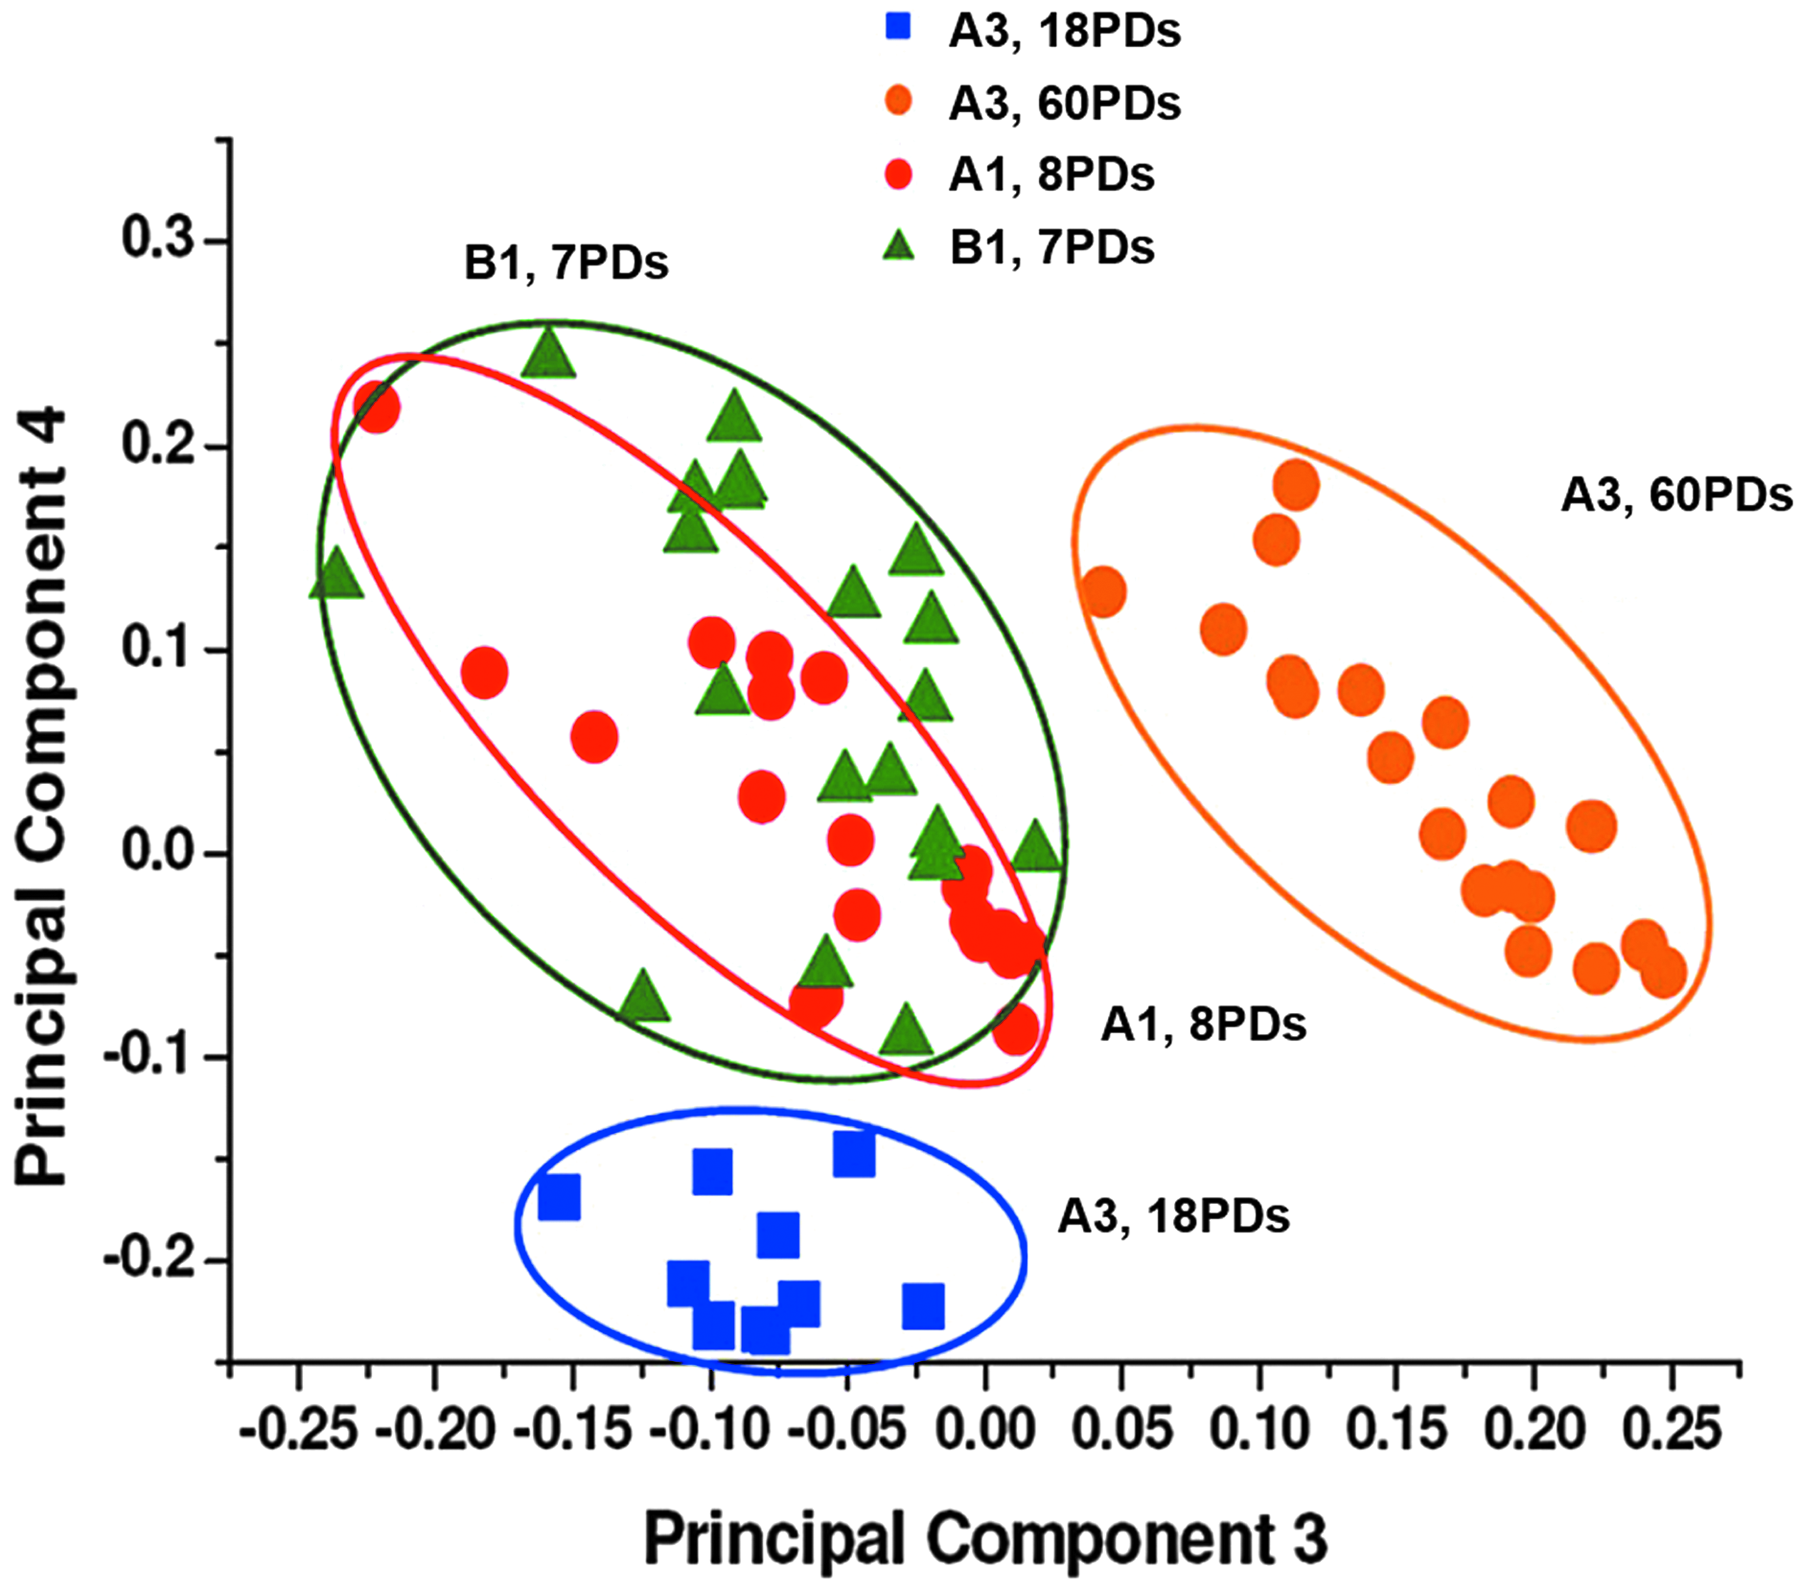
PCA 2D scatter plots obtained using PC3 and PC4 scores for individual Raman spectra for high proliferative/multipotent DPSC subpopulation, A3, at 18PDs and 60PDs and low proliferative/unipotent DPSC subpopulations, A1 and B1 (8PDs and 7PDs, respectively). Scatter plot demonstrated widespread differences between DPSC subpopulation profiles, with three distinct Raman clusters evident for high proliferative/multipotent DPSC, A3 at 18PDs (in blue) A3 at 60PDs (in orange), and low proliferative/unipotent DPSCs, A1 and B1 at 8PDs and 7PDs (in red and green, respectively). Low proliferative/unipotent DPSC clusters exhibited almost complete overlap, indicative of high signature similarity. Profiles for the high proliferative/multipotent DPSC, A3 (18PDs and 60PDs), were distinctly dissimilar to each other and to those for A1 (8PDs) and B1 (7PDs), indicative of large Raman signature differences overall. Spectra were determined from n = 20 individual cells per DPSC subpopulation. 2D, two dimensional.
These clusters were particularly representative of high proliferative/multipotent DPSC, A3 (18PDs in blue and 60PDs in orange) and the low proliferative/unipotent DPSCs, A1 and B1 (8PDs and 7PDs in red and green, respectively). The clusters for both low proliferative/unipotent DPSCs, A1 (8PDs) and B1 (7PDs), showed an almost complete overlap indicative of high Raman signature similarity.
In contrast, profiles for the high proliferative/multipotent DPSC, A3 (at 18PDs and 60PDs), were distinctly dissimilar to those for A1 (8PDs) and B1 (7PDs), as these exhibited well-separated signatures with no A1 or B1 cluster overlap. Furthermore, despite being derived from the same DPSC subpopulation, both A3 profiles did not exhibit any overlap when compared at early (18PDs) and late (60PDs) stages in their proliferative lifespans, indicative of large variations in DPSC subpopulation signatures overall.
Discussion
The present study describes a novel investigation, confirming the abilities of SCRM to noninvasively discriminate between DPSC subpopulations with contrasting proliferative and differentiation capabilities. The results obtained also provide unique insight into the biochemical differences that exist between nonsenescent and senescent DPSC subpopulations.
Previous reports have demonstrated that only 20% of purified DPSCs undergo >20PDs, compared with heterogeneous DPSC populations (>120PDs), highlighting the presence of DPSC subpopulations in dental pulp tissues with contrasting proliferative and differentiation capabilities.5–7 Consistent with such findings, recent studies have reported key differences between DPSC subpopulations in the relative susceptibilities to replicative (telomere-dependent) senescence, correlating with contrasting differentiation capabilities within each population. 11
While highly proliferative DPSCs, A3, reached >80PDs before undergoing senescence, low proliferative DPSCs, A1 and B1, only achieved <40PDs. Unlike low proliferative DPSCs, highly proliferative DPSCs retained stem cell marker expression and multipotent differentiation capabilities, which were only impaired at much later PDs (>60PDs). Therefore, it has been proposed that such high proliferative DPSCs are responsible for the extensive expansion potential of heterogeneous populations (>120PDs) in vitro,5,6 as less proliferative, unipotent DPSCs would be selectively lost from the mixed populations during extended subculture.11,24
From the findings reported, it is evident that such phenotypic differences in DPSC subpopulation proliferative and regenerative capabilities can be rapidly and sensitively distinguished using SCRM, given the contrasting Raman fingerprints obtained for high proliferative/multipotent and low proliferative/unipotent DPSCs as a consequence of distinct differences in the biochemical (DNA, RNA, protein, and lipid) compositions of these cells overall. Such conclusions also reiterate the significant variations in the biological status and reparative properties of these DPSC subpopulations. 11
Although Raman spectroscopy has been used extensively in MSC research, studies have primarily focused on its application to distinguish MSC populations from nonsomatic cells, and the assessment of differentiation status in MSCs from various sources.16–18,21–23 However, concurrent with its successful utilization in the present study to discriminate between high proliferative/multipotent and low proliferative/unipotent DPSCs, Raman spectroscopy has recently been shown to distinguish between proliferative/nonproliferative, senescent/nonsenescent, young/aged, and viable/nonviable cells, within other MSC and fibroblast populations.15,29–33
The increased spectral intensities obtained for high proliferative/multipotent DPSC subpopulation, A3 (18PDs), compared with more senescent A3 (60PDs) and with low proliferative/unipotent DPSCs, A1 and B1 (8PDs and 7PDs, respectively), are consistent with recent studies reporting alterations in the biomolecular compositions of senescent fibroblast populations, versus nonsenescent counterparts, relating to band intensities and/or band positions.31,32 Specifically, such studies have associated reductions in DNA (788, 1580 cm−1) and protein (1658 cm−1) peaks, in addition to elevated lipid (1732, 2850, and 2930 cm−1) peak contents during cellular senescence, with protein and lipid modifications predominating overall.31,32
Amide I peak intensities have been demonstrated to be particularly sensitive to conformational changes during senescence, while distinct amide III region changes having also been reported.31,32 Changes in the ratio of 1157 cm−1 (C-C/C-N protein stretching) and 1174 cm−1 (C-H bending vibrations in phenylalanine and tyrosine) due to reduced 1157 cm−1 peak intensities have further been proposed as characteristic signatures of umbilical cord-derived MSC senescence. 15 However, despite senescence-induced shifts in lipid conformation (2850 cm−1) having been assigned to the CH2 symmetric stretch of lipids, 31 no such changes were evident herein as SCRM spectra were recorded over 600–1800 cm−1.
From the assignments and peak intensities identified, it was apparent that such differences reflected elevations in DNA (729, 786, 1092, and 1450 cm−1) and protein (1167, 1245, 1402, 1450, 1629, and 1680 cm−1) contents in nonsenescent, high proliferative/multipotent DPSC, A3 (18PDs). Such peak intensity increases were particularly significant for A3 (18PDs), at 729 cm−1 (ring breathing of adenine), 1111 cm−1 (benzoid ring deformation), 1167 cm−1 (isoleucine), 1245 cm−1 (amide III region), and 1680 cm−1 (amide I region). In addition, subpopulation differences in other amino acid and protein contents were also detected, including increased 958 cm−1 (phenylalanine) peaks in high proliferative/multipotent subpopulation, A3, at 18–60PDs and 60PDs, respectively; in addition to reduced 1155 cm−1 (C-C/C-N protein stretching) and 1614 cm−1 (tyrosine) peaks with low proliferative/unipotent sub-population B1 (7PDs) only.
As DNA, amino acids, and proteins are fundamental biochemical constituents that facilitate cellular responses, contrasting intensities in these peaks are consistent with the proliferative and differentiation capabilities of high and low DPSC subpopulations overall.11,15,31–34 Therefore, as Raman signature changes during senescence are proposed to be principally caused by biomolecular modifications to proteins and lipids, rather than changes in molecular abundance, 31 the present findings are partly counterintuitive to such findings, considering the considerable reductions in biomolecular abundance evident herein. 15 However, the particular predominance of amino acid/protein peak intensity changes between high/multipotent and low proliferative/unipotent DPSCs concurs with previous reports.15,31,32
Senescence-induced biomolecular modifications are strongly linked with oxidative stress, due to elevated reactive oxygen species (ROS) production by senescent cells causing accumulative damage to cellular components.8,35,36 Although DNA is a strong candidate for oxidative modification, proteins and lipids are also highly susceptible to oxidative stress-induced damage.37–39 Indeed, protein oxidation by ROS is mediated via amino acid modification, leading to increased crosslinking, aggregation, and cleavage, which subsequently influence protein structure and function.40,41
ROS modification of amino acids results in the formation of numerous oxidized by-products, although many aromatic (phenylalanine and tyrosine) and nonaromatic (proline, histidine, lysine, arginine, and serine) amino acids are known to be highly susceptible to ROS modification.40,41 Thus, it is conceivable that reductions in phenylalanine (958 cm−1), benzoid ring deformation (1111 cm−1), arginine (1402 cm−1), tyrosine (1614 cm−1), and serine (1629 cm−1) peaks in low proliferative/unipotent DPSCs (A1, 8PDs; B1, 7PDs) are consequences of increased oxidative modification to these amino acids in low proliferative (senescent) subpopulations, leading to subsequent reductions in protein band detection (1155, 1245, and 1680 cm−1).
Consequently, the spectral differences identified overall may be attributed to alterations in the quantities of certain biomolecular species between high proliferative/multipotent and low proliferative/unipotent DPSC subpopulations, in addition to conformational changes in protein, DNA, and lipid structures due to oxidative stress.15,31,32
PCA was further capable of discriminating between high proliferative/multipotent DPSCs (A3, 18PDs) and the similarly overlapping clusters of low proliferative/unipotent DPSCs, A1 (8PDs) and B1 (7PDs), coinciding with the proliferative and differentiation heterogeneity of DPSC subpopulations previously described. 11 In particular, PC3 and PC4 components showed significant cluster separation between highly proliferative DPSC, A3, at early (18PDs) and late (60PDs) stages in proliferative lifespans. As previous studies have also identified significant spatial separation between the scatter plots of nonsenescent and senescent cell populations,31,32 obvious differences between the clusters for high (A3, 18PDs) and low proliferative/unipotent DPSCs, A1 (8PDs) and B1 (7PDs) were shown, despite A1 and B1 being derived from different patient donors.
As with the apparent DNA and protein peak intensity differences identified between the same DPSC subpopulations, A3, at 18PDs and 60PDs, similar nonoverlapping cluster differences were also observed. However, the A3 (60PDs) cluster remained well separated from the clusters for low proliferative/unipotent DPSCs, A1 (8PDs) and B1 (7PDs), with no overlap evident. Such variations in the A3 (60PDs) signatures to those of A3 (18PDs) and A1 (8PDs)/B1 (7PDs) may be interpreted as the detection of increased A3 transition from proliferation (18PDs) toward senescence (60PDs), although the A3 (60PDs) signatures were yet to reach the equivalent senescence status displayed by A1 (8PDs) and B1 (7PDs).
Indeed, despite good cluster separation between young and senescent cells, previous studies have further shown cluster overlap during senescence transition at intermediate PDs, indicating nonlinear signature/peak intensity changes and individual cell heterogeneity within a population during senescence transition.15,31,32 However, we can only speculate on the underlying reasons for such differences in the cluster profiles and proliferative/differentiation responses between DPSC subpopulations at present, as intrinsic factors, such as those associated with patient donor characteristics, and/or the developmental origins and stem cell niche sources of these DPSC subpopulations within pulpal tissues warrant additional consideration.5–7,11
Nonetheless, this study shows that SCRM can successfully and reliably discriminate between high proliferative/multipotent and low proliferative/unipotent DPSCs, with clear differences in biochemical signatures between these distinct DPSC subpopulations. Therefore, concomitant with their established heterogeneous proliferative and regenerative properties,5,6,11 such contrasting SCRM profiles reflect the high proliferative/multipotent nature of certain DPSCs, evident by their increased DNA/protein contents and the prevalence of particular DNA and protein signature peaks, compared with low proliferative/unipotent DPSCs.
As these signature differences may reflect similarly contrasting proliferative and differentiation characteristics between DPSC subpopulations in vivo, this study advocates further SCRM assessment as a viable tool for the selective screening and isolation of desirable high proliferative/multipotent DPSCs from dental pulp tissues for regenerative medicine applications.
Footnotes
Acknowledgment
This work was supported by PhD studentship funding, awarded to Dr. Amr Alraies by the Albawani Company, Saudi Arabia.
Disclosure Statement
No competing financial interests exist.