
Abstract
The objective of this study is to design a cancer invasion model based on an interaction between cancer cells and cancer-associated fibroblasts (CAF) aggregates. The strength of this study is to incorporate gelatin hydrogel microspheres (GM) containing pifithrin-α (PFT) of a p53 inhibitor (GM-PFT) with the CAF aggregates. Incorporation of GM-PFT allowed CAF aggregates to enhance the alpha-smooth muscle actin expression level at a high concentration of PFT. When the cancer cells were cocultured with the CAF aggregates incorporating GM-PFT, the invasion rate of cancer cells was significantly high compared with CAF aggregates or CAF aggregates incorporating GM with or without the same dose of free PFT as well as two-dimension cultured CAF with or without the same dose of PFT. In addition, an inhibitor of matrix metalloproteinase decreased the cancer invasion rate for the CAF aggregates incorporating GM-PFT. It is concluded that the interaction between cancer cells and CAF aggregates incorporating GM-PFT of biological activation needs to realize the invasion of cancer cells even in vitro.
Impact Statement
The strength of this study is to combine with a three-dimensional cell culture system and a drug delivery system technology for a cancer invasion model. The combination enabled cancer-associated fibroblasts to enhance the biological functions. This cancer invasion model is a promising tool to mimic the tumor microenvironment for anticancer drug screening.
Introduction
Tumor tissues are composed of cancer cells and many stromal cells, such as cancer-associated fibroblasts (CAF), vascular endothelial cells, smooth muscle cells, or immune cells. Among the stromal cells, CAF are the major components.1,2 CAF of large spindle-shaped cells are perpetually activated and do not undergo apoptosis. 3
In addition, recently, the crosstalk between cancer cells and CAF has been investigated to clearly demonstrate that the interaction plays a key role in the cancer events of the progression,4–6 the invasion,7–9 and the metastasis.10–12 For the cancer invasion, matrix metalloproteinase (MMP), which is secreted by cancer cells or CAF, plays a key role in the remodeling of extracellular matrix. MMP can selectively degrade collagen type IV and laminin, which are important components of the basement membrane. Therefore, a high level of MMP production by the interaction promotes the invasiveness of cancer cells because of the degradation of the basement membrane (Fig. 1).13–16
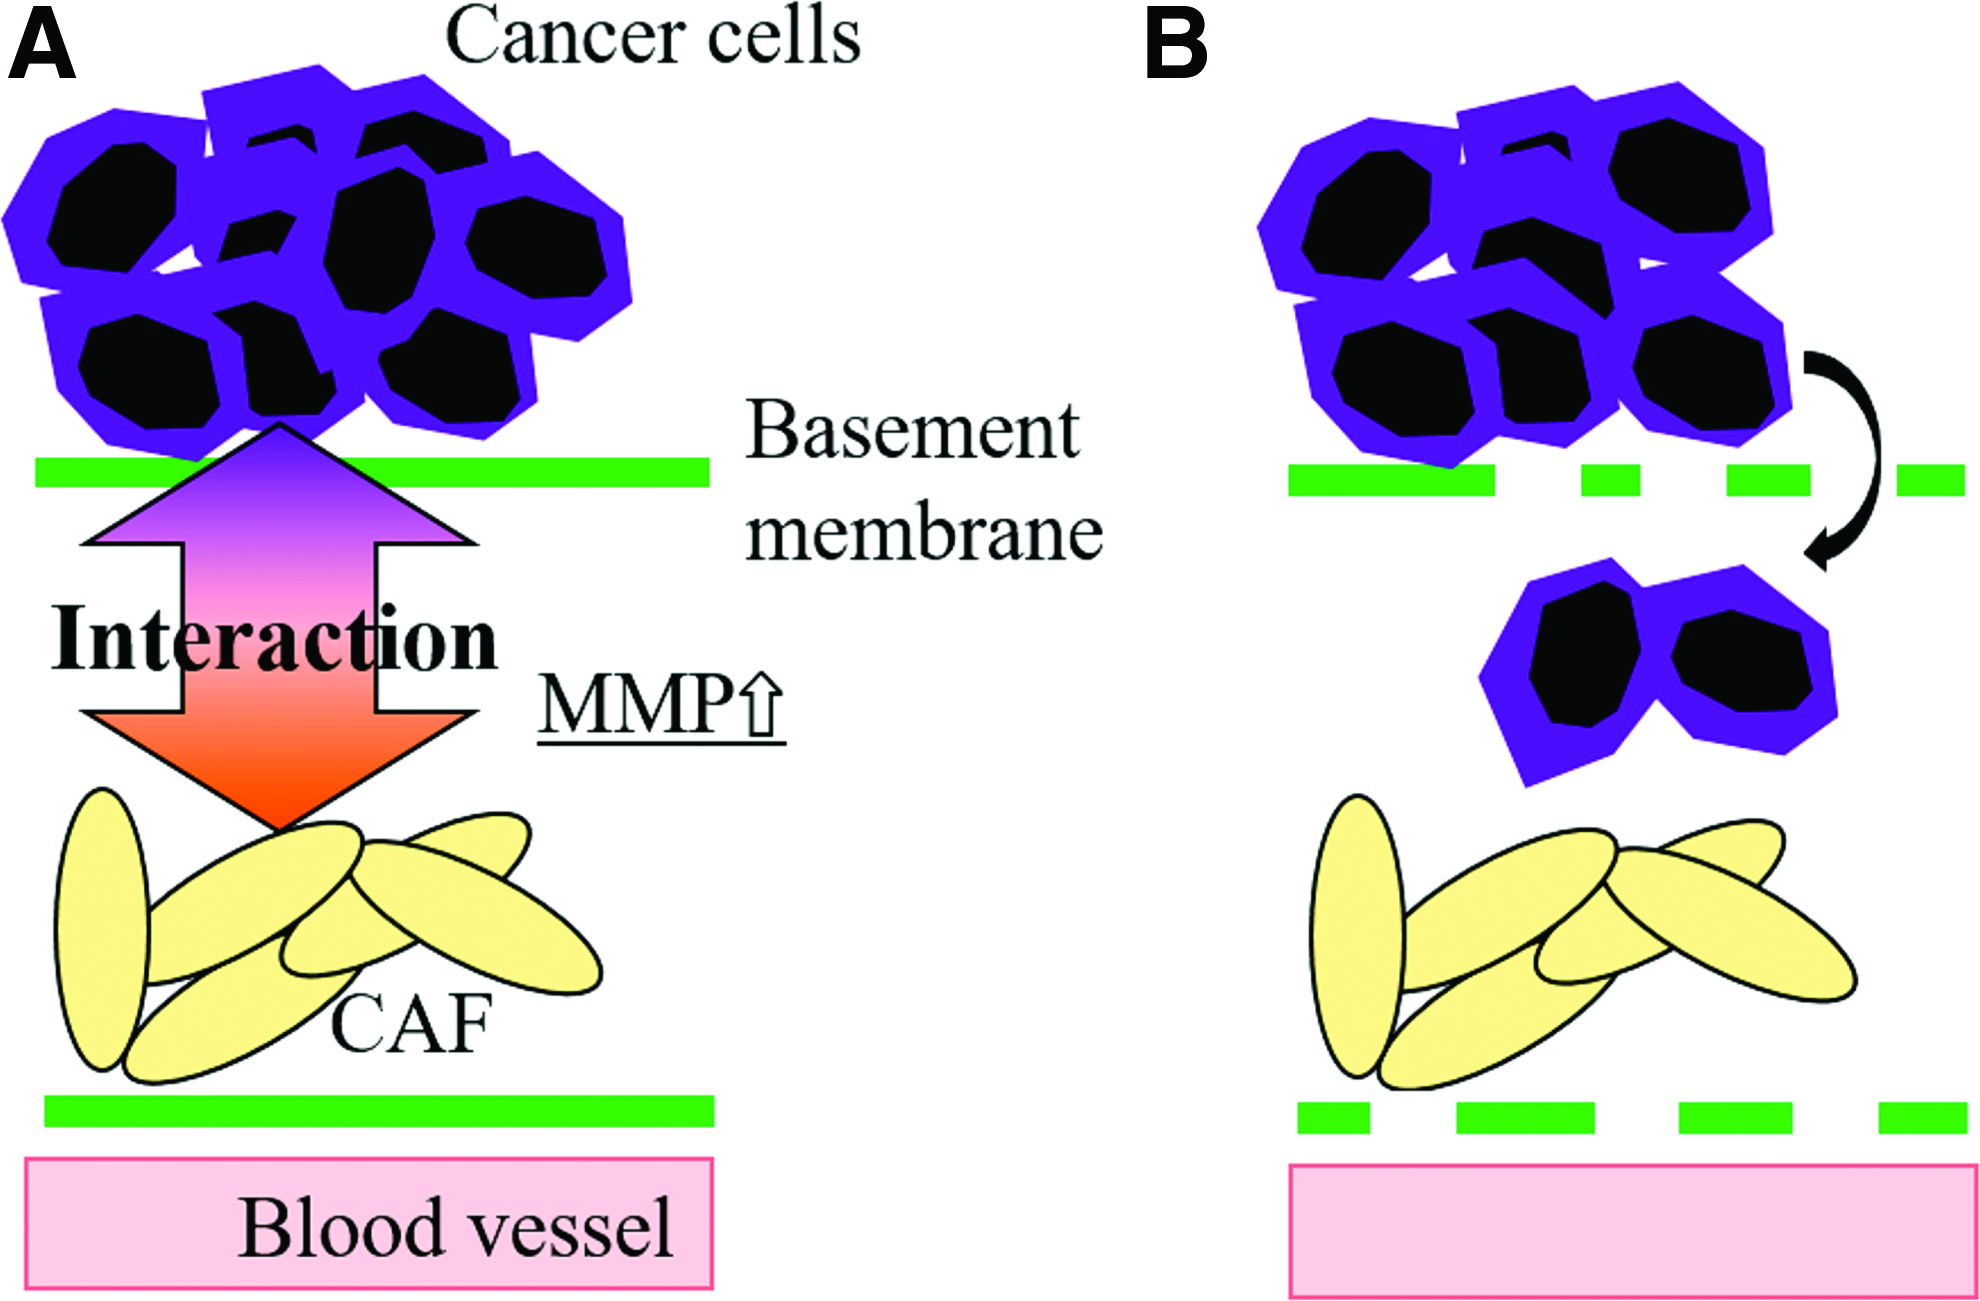
Characterization of cancer invasion by the interaction between cancer cells and CAF in vivo.
Recently, it is well recognized that drugs to target CAF or the interaction between cancer cells and CAF would be effective in cancer treatment.1,2,17,18 Based on the reasons, CAF are important cells to study the cancer characteristics while a coculture of cancer cells and CAF is necessary to simulate the in vivo environment of tumor tissues in vitro.
Cell culture of three-dimension (3D) is an important method to mimic the body environment. 19 In the body tissue, most cells tend to form aggregates, and the aggregation permitted cells to enhance their biological functions, such as proliferation, cell–cell interaction, and metabolic activity.20–25
However, cells present in the center of cell aggregates rapidly die because of poor oxygen and nutrients supplies.26,27 To tackle this problem, we have incorporated gelatin hydrogel microspheres (GM) into cell aggregates to demonstrate the cell viability of a long-time period. 28 Furthermore, the GM incorporation allowed cells to supply oxygen and nutrients while GM could release growth factor or drugs to improve the cell survival and functions.29–36 In other words, GM are widely used in the field of drug delivery system (DDS), which is well known as the technology and methodology to enhance drug effects or reduce the side effects. The GM are promising in regenerative medicine or drug discovery based on the DDS technology.37–41
Recently, 3D aggregates of cancer cells and CAF have been reported to mimic real cancer tissues.42–44 Some researches report the deposition of biomolecular onto the matrices for the improvement of cell distribution, function, signaling, or interventions based on the tumor-stromal interaction.44–46 The 3D engineered model will be useful for anticancer drug screening. However, few researches have been reported on the combined 3D model and DDS for the drugs to activate cancer cells or CAF. It is important to enhance the biological functions of CAF by the controlled drug release to closely mimic the event of tumor sites because CAF are always activated in the tumor sites.
In this study, 3D CAF aggregates incorporating GM capable of drug release were prepared. The alpha-smooth muscle actin (α-SMA) expression level (the most widely used marker for CAF) was measured for the CAF activation level.1,47,48 As the drug pifithrin-α (PFT), which is an inhibitor to suppress the gene function of p53, was used because it has been reported that the inactivate or mutate p53 gene can lead to the activation of CAF, although the mechanism is not completely clear in biology.49–51 In addition, to investigate the effect of the interaction between cancer cells and CAF on the cancer invasion in vitro, the invasion assay was performed. Furthermore, the inhibitor of MMP (marimastat) was used to evaluate the effect of MMP secretion on the cancer invasion level.
Materials and Methods
Preparation of GM
GM were prepared by the chemical crosslinking of gelatin in a water-in-oil emulsion state according to the method previously reported. 32 In brief, an aqueous solution (20 mL) of 10 wt% gelatin (isoelectric point 5.0, weight-averaged molecular weight = 100,000; Nitta Gelatin, Inc., Osaka, Japan) was preheated at 40°C, followed by stirring at 300 rpm for 10 min to prepare the water-in-oil emulsion. The emulsion temperature was decreased at 4°C for the natural gelation of gelatin solution to obtain noncrosslinked hydrogel microspheres. The resulting GM were washed three times with cold acetone in combination with centrifugation (5000 rpm, 4°C, 5 min) to completely exclude the residual oil. Then, GM were fractionated by size using sieves with apertures of 32 and 53 μm (Iida Seisakusho Ltd., Osaka, Japan) and air dried at 4°C. Then, noncrosslinked and dried GM (200 mg) were treated in a vacuum oven at 140°C to allow to dehydrothermally crosslink for 72 h. The picture of GM in the swollen state was taken with a microscope (BZ-X710; KEYENCE Ltd., Osaka, Japan). The size of 100 microspheres for each sample was measured using the computer program ImageJ (NIH, Inc., Bethesda) to calculate the average diameters.
Preparation of GM-PFT
PFT (FUJIFILM Wako Pure Chemical Co. Ltd., Osaka, Japan), was dissolved in double distilled water (DDW) to give a concentration of 20, 100, and 500 μg/mL. The PFT solution (20 μL) was dropped into 2 mg of freeze-dried GM, followed by leaving at 37°C overnight for the impregnation of PFT into the GM to prepare GM containing PFT (GM-PFT). The PFT solution was completely absorbed into the GM through the impregnation process because the solution volume was much less than theoretically required for the equilibrated swelling of GM.
Drug release profile from GM
GM-PFT (2 mg) were incubated in phosphate-buffered saline (PBS). At each time point, the buffer was removed and replaced with fresh PBS. After 24 h, PBS was replaced with collagenase. PFT concentration released from GM was measured using high-performance liquid chromatography (SIL-20A prominence, SPD-20A prominence, LC-20AD prominence, CTO-10ASvp, DGU-20A3 prominence, Shimadzu) at 208 nm with ODS column (STR ODS-M, size: 4.6 × 150 mm; Shinwa Chemical Industries Ltd., Kyoto, Japan). The mobile phase consisted of DDW and acetonitrile with a volume ratio of 2:8.
Degradation of GM-PFT
In addition, for the drug release profile, 2 mg of GM-PFT were incubated in PBS. At each time point, the buffer was removed and replaced with fresh PBS. After 24 h, PBS was replaced with collagenase. The degradation of GM-PFT was measured using Micro BCA™ Protein Assay Kit (Thermo, Inc., Waltham).
Cell culture experiments
WA-hT cells of human small cell lung carcinoma cell line (RIKEN, Japan) and WA-mFib cells of the small cell lung CAF cell line in minimum essential medium (Sigma-Aldrich Co. LLC., St. Louis) were supplemented with 10 v% fetal calf serum (FCS; Thermo, Inc.), penicillin (50 U/mL), and streptomycin (50 U/mL) (standard medium) and cultured at 37°C in a 95% air—5% carbon dioxide atmosphere.
Preparation of various types of CAF aggregates
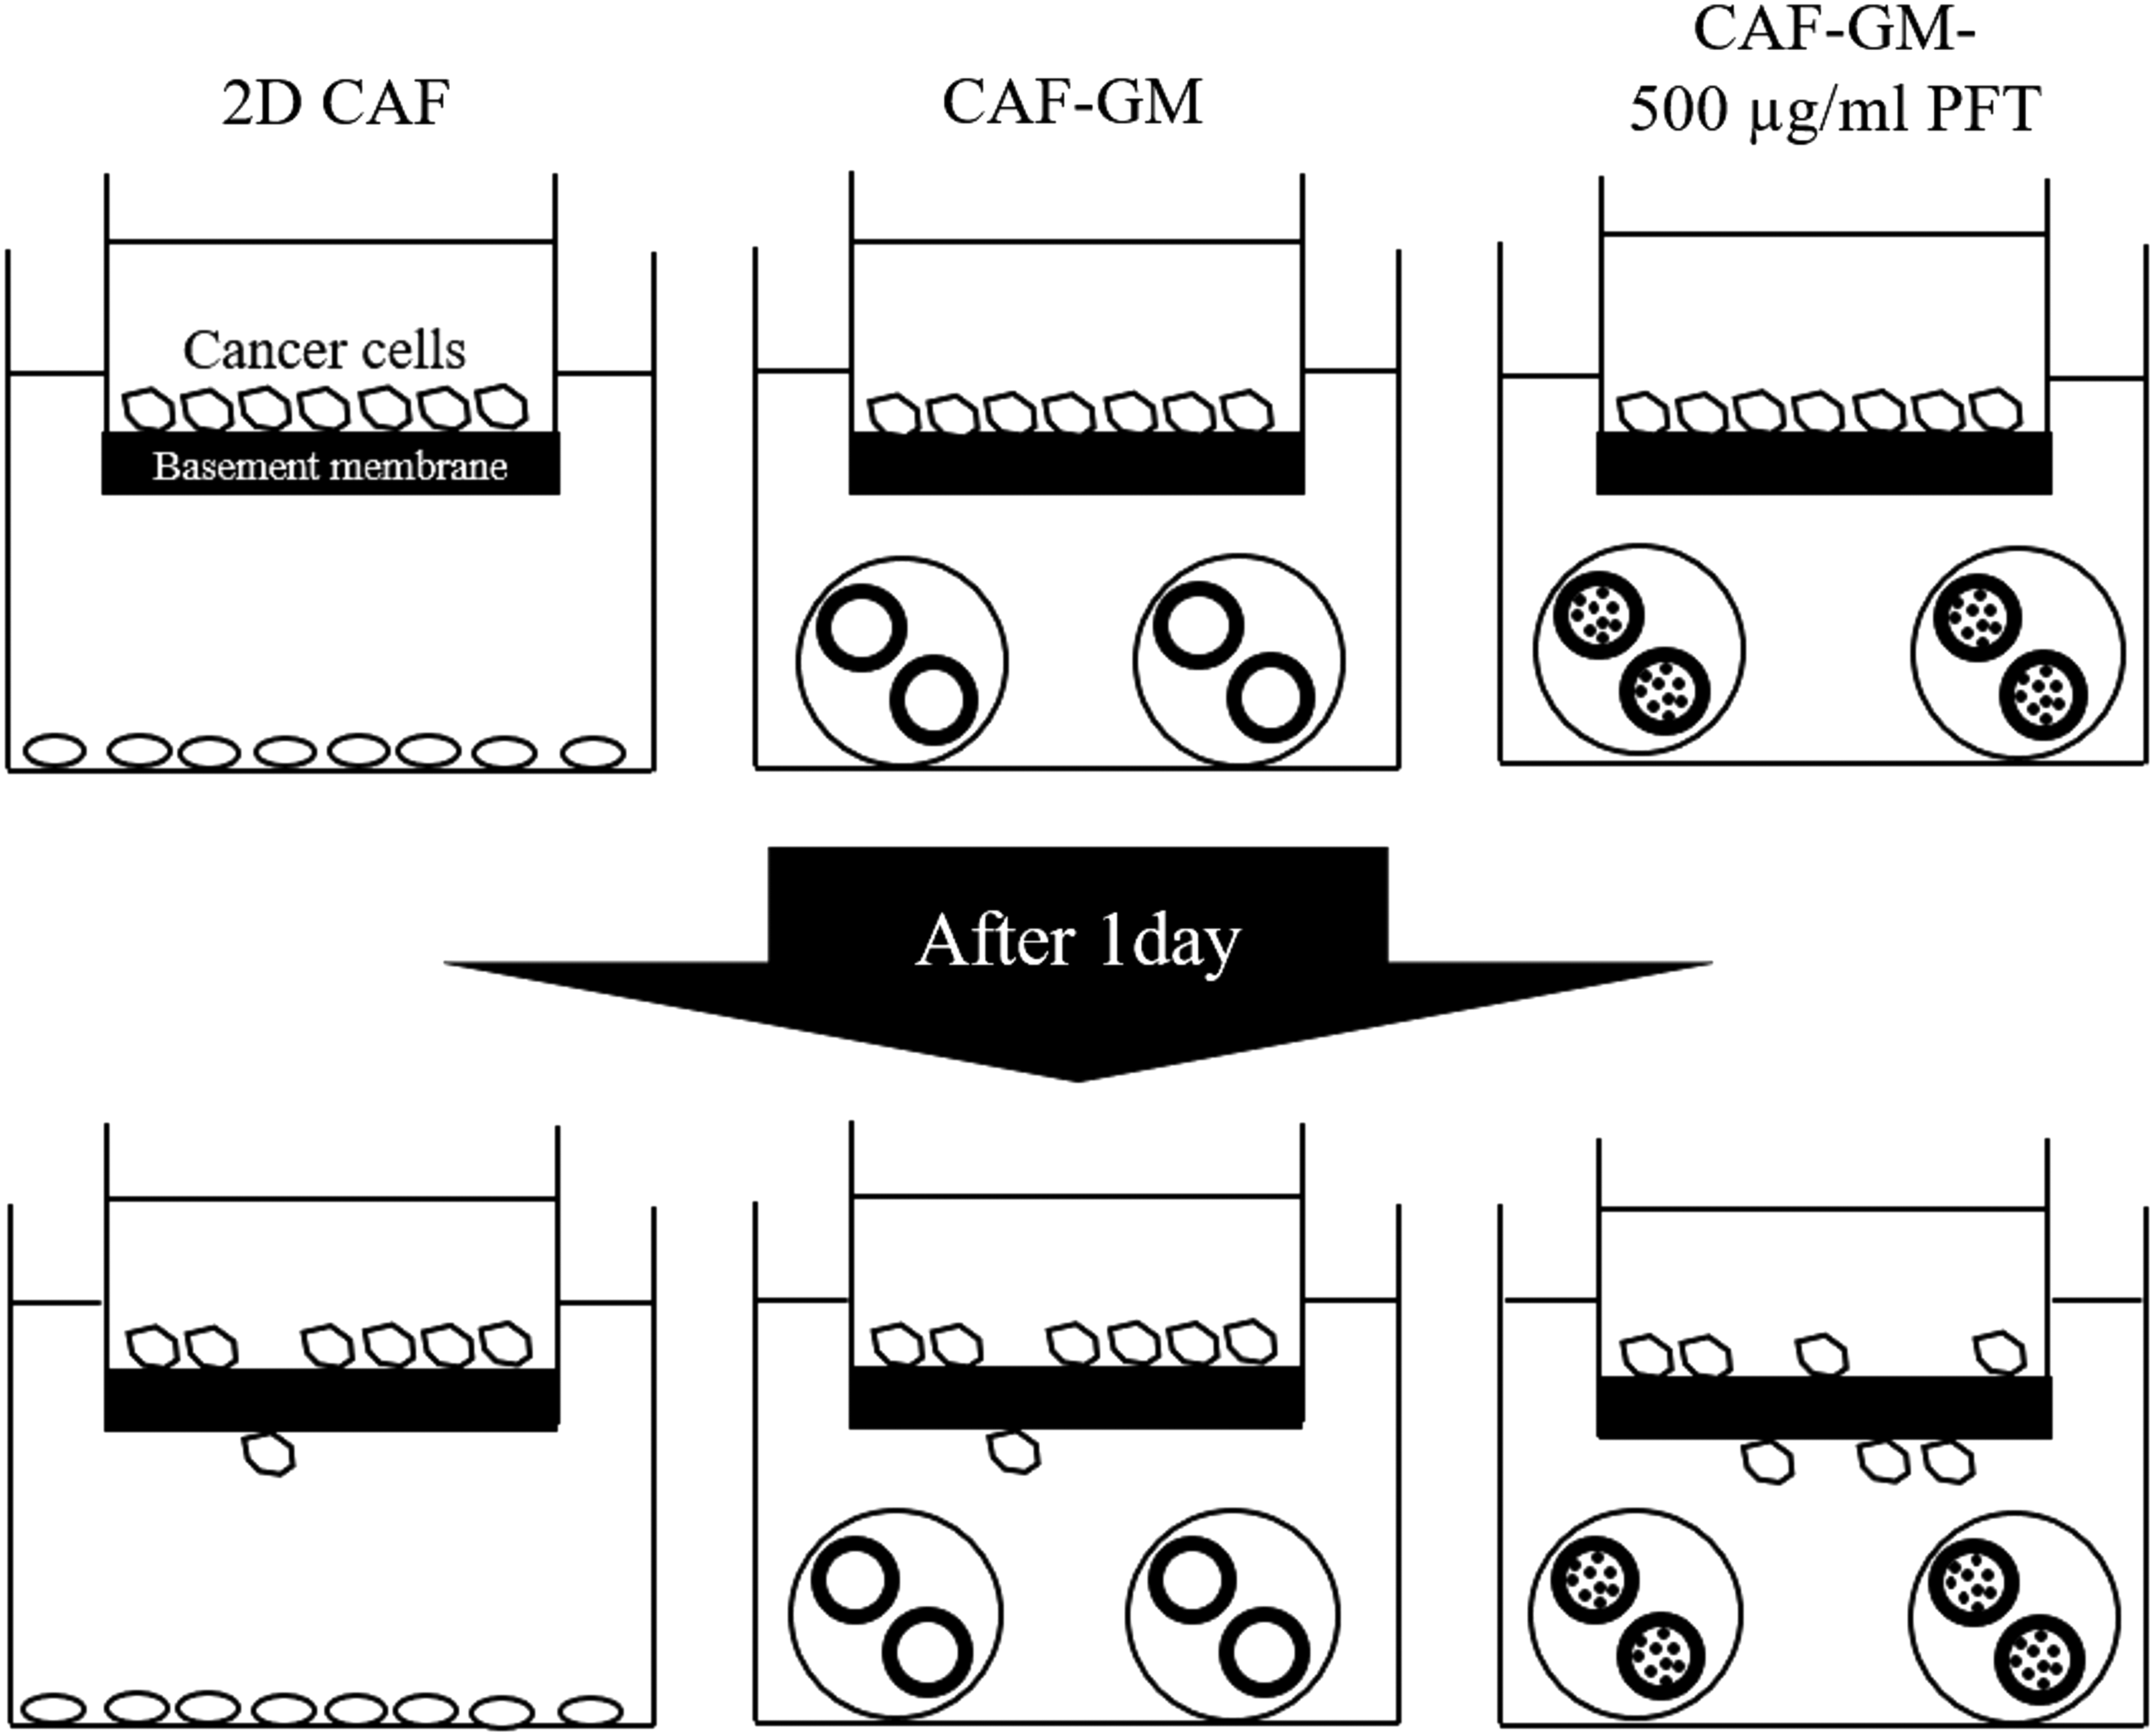
A poly (vinyl alcohol) (PVA) sample (the degree of polymerization = 1800 and the saponification = 88 mole%) kindly supplied from Unichika (Tokyo, Japan) was dissolved in PBS (pH 7.4, 1 wt%). The PVA solution was added to each well of round-bottomed (U-bottomed) 96-well culture plate (200 μL/well) and incubated at 37°C for 15 min. Then, the solution was removed by aspiration and the wells washed twice with PBS (200 μL/well). GM, GM-PFT, and CAF were separately suspended in the standard medium. After the suspensions of GM or GM-PFT (2 × 10³ microspheres/mL, 100 μL) and CAF suspensions (2.0 × 10⁴ cells/mL, 100 μL) were mixed, the mixture was added to the wells coated. After 7 days (CAF aggregates were formed), CAF aggregates were cultured by an orbital shaker (Bellco, Inc., CA) at 30 rpm to enhance the biological functions until over the time periods of 15 days, 52 and then the medium was changed on the 1st day and every 3 days until the end of experiments. In terms of addition of free PFT (fPFT) (10% amounts of PFT) into solution form every day, culture was performed until 10 days. Because after 10 days, the total amount of PFT added to CAF aggregates would be the theoretically same as that of PFT release group. The pictures of the various types of CAF aggregates were taken with a microscope (CKX41; Olympus Ltd., Tokyo, Japan). The size of various types of CAF aggregates was measured by using the computer program ImageJ (NIH, Inc.) to calculate the average diameter. Figure 2 shows the illustration of experimental samples applied in the U-bottomed well.

Preparation of CAF aggregates (3D CAF), CAF aggregates incorporating GM (CAF-GM), CAF aggregates incorporating GM-PFT (CAF-GM-PFT), and CAF aggregates incorporating GM in the presence of free PFT (500 μg/mL) addition (CAF-GM+fPFT). 3D, three-dimension; GM, gelatin hydrogel microspheres; PFT, pifithrin-α.
Cell number
To evaluate the cell number in CAF aggregates without (3D CAF) or with GM (CAF-GM) and GM-PFT containing various concentrations of PFT (CAF-GM-various concentrations of PFT) 5, 10, and 15 days after incubation, each sample was taken into a microtube. After centrifuge, the culture medium was carefully removed and the samples were washed with 200 μL of PBS. After removing PBS, 200 μL of collagenase was added and samples were incubated at 37°C for 30 min to degrade GM or GM-PFT. Then, 50 μL of trypsin was added and samples were incubated at 37°C for 30 min and pipetted every 5 min to facilitate the dissociation of the aggregates. The enzyme action was stopped by the addition of 50 μL of culture medium. The total cell number was measured using Countess (Thermo, Inc.).
α-SMA expression level
To evaluate the effect of PFT release on the CAF functions, α-SMA expression level for the two-dimension (2D) CAF, 2D CAF+fPFT, and various types of CAF aggregates were measured by using enzyme-linked immunosorbent assay (ELISA).
Invasion assay
To evaluate the crosstalk between various types of CAF and cancer cells, cancer invasion assay was performed by using Cytoselect 96-well invasion assay (Cell Biolabs, Inc., San Diego). In brief, 150 μL of CAF suspension (8.0 × 10⁵ cells/well in medium containing FCS) or various types of CAF aggregates (the same cell number of CAF suspension) were added (150 μL) into the tubes. The tubes were centrifuged and the supernatant was removed. Then, 800 μg/mL of marimastat or standard medium was added (150 μL) to the tubes, and the suspensions were plated to the well of the feeder tray. After the membrane chamber was placed into the feeder tray, cancer cell suspension (2.0 × 10⁵ cells/well in FCS free medium) was added (100 μL) to the membrane chamber. The samples were incubated for 24 h. After completely dislodging the cancer cells from the underside of the membrane, Lysis Buffer dye solution was added. Then, the fluorescent intensity was measured in a fluorescence spectrometer (F-2000; HITACHI Ltd., Tokyo, Japan) at excitation and emission wavelengths of 480 and 520 nm, respectively. Invasion rate was measured by using the following equation;
Furthermore, the culture medium was collected, and then the secretion level of MMP-2 was measured by ELISA.
Statistical analysis
All the data were statistically analyzed and are expressed as the mean ± the standard error of the mean. The data were analyzed by Student t-test to determine the statistically significant difference, while the significance was accepted at p < 0.05. Experiments for each sample were performed three times independently unless otherwise mentioned.
Results
Observation of GM
Figure 3 shows the microscopic pictures of GM. The GM were spherical and had a smooth surface. The size of GM in the swollen condition ranged 51.25 ± 7.28 μm.
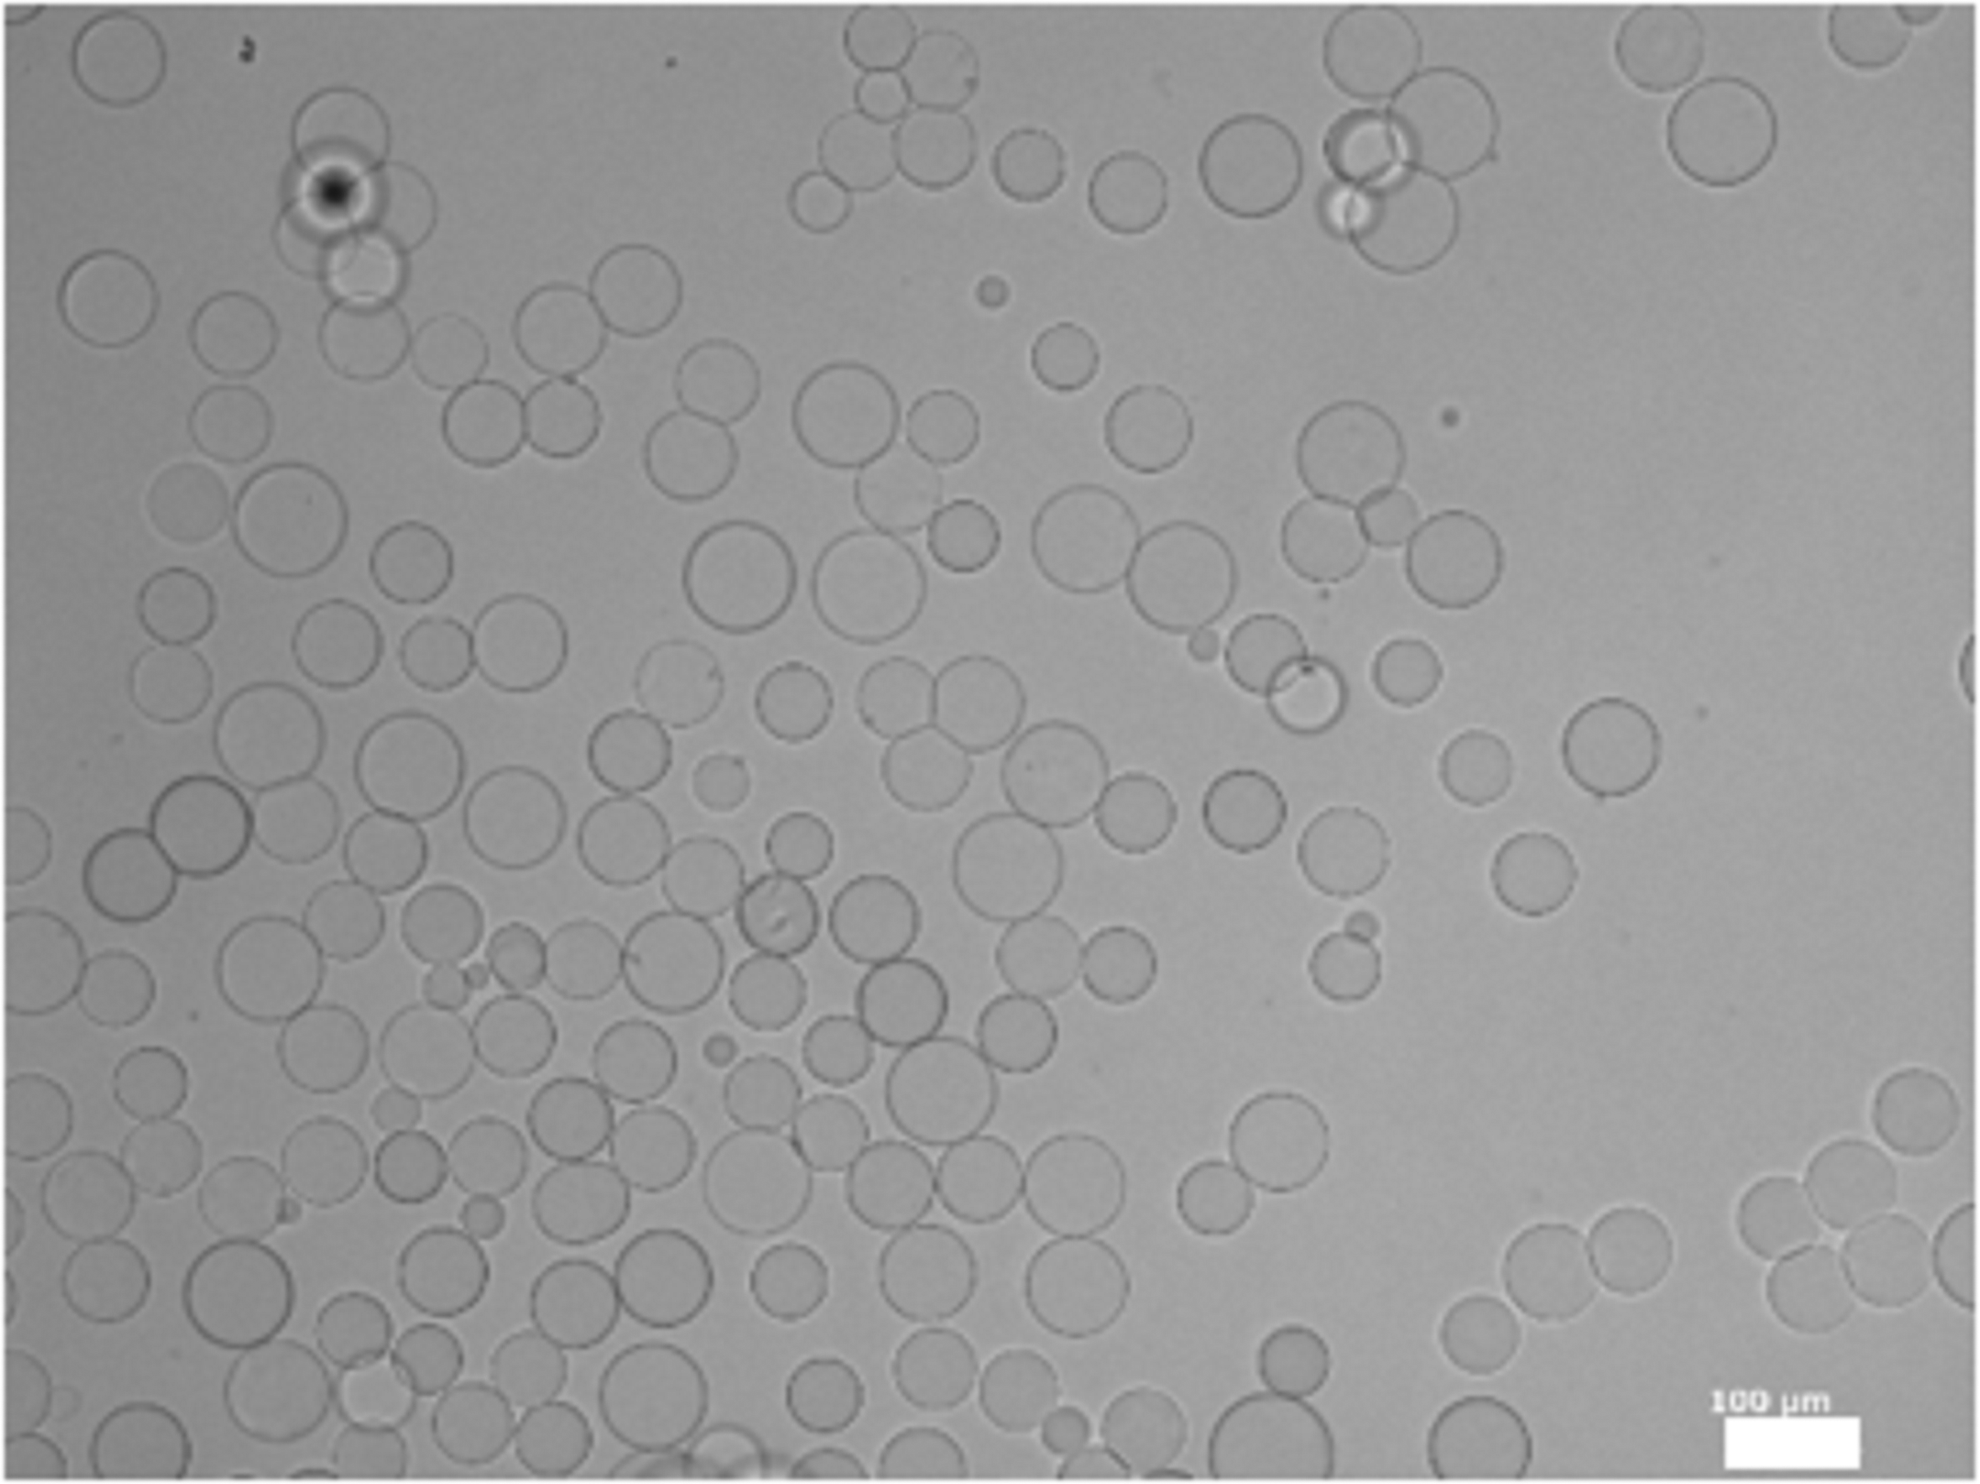
A light microspheres photograph of GM dispersed in water. Scale bar; 100 μm.
Drug release characterization of GM-PFT
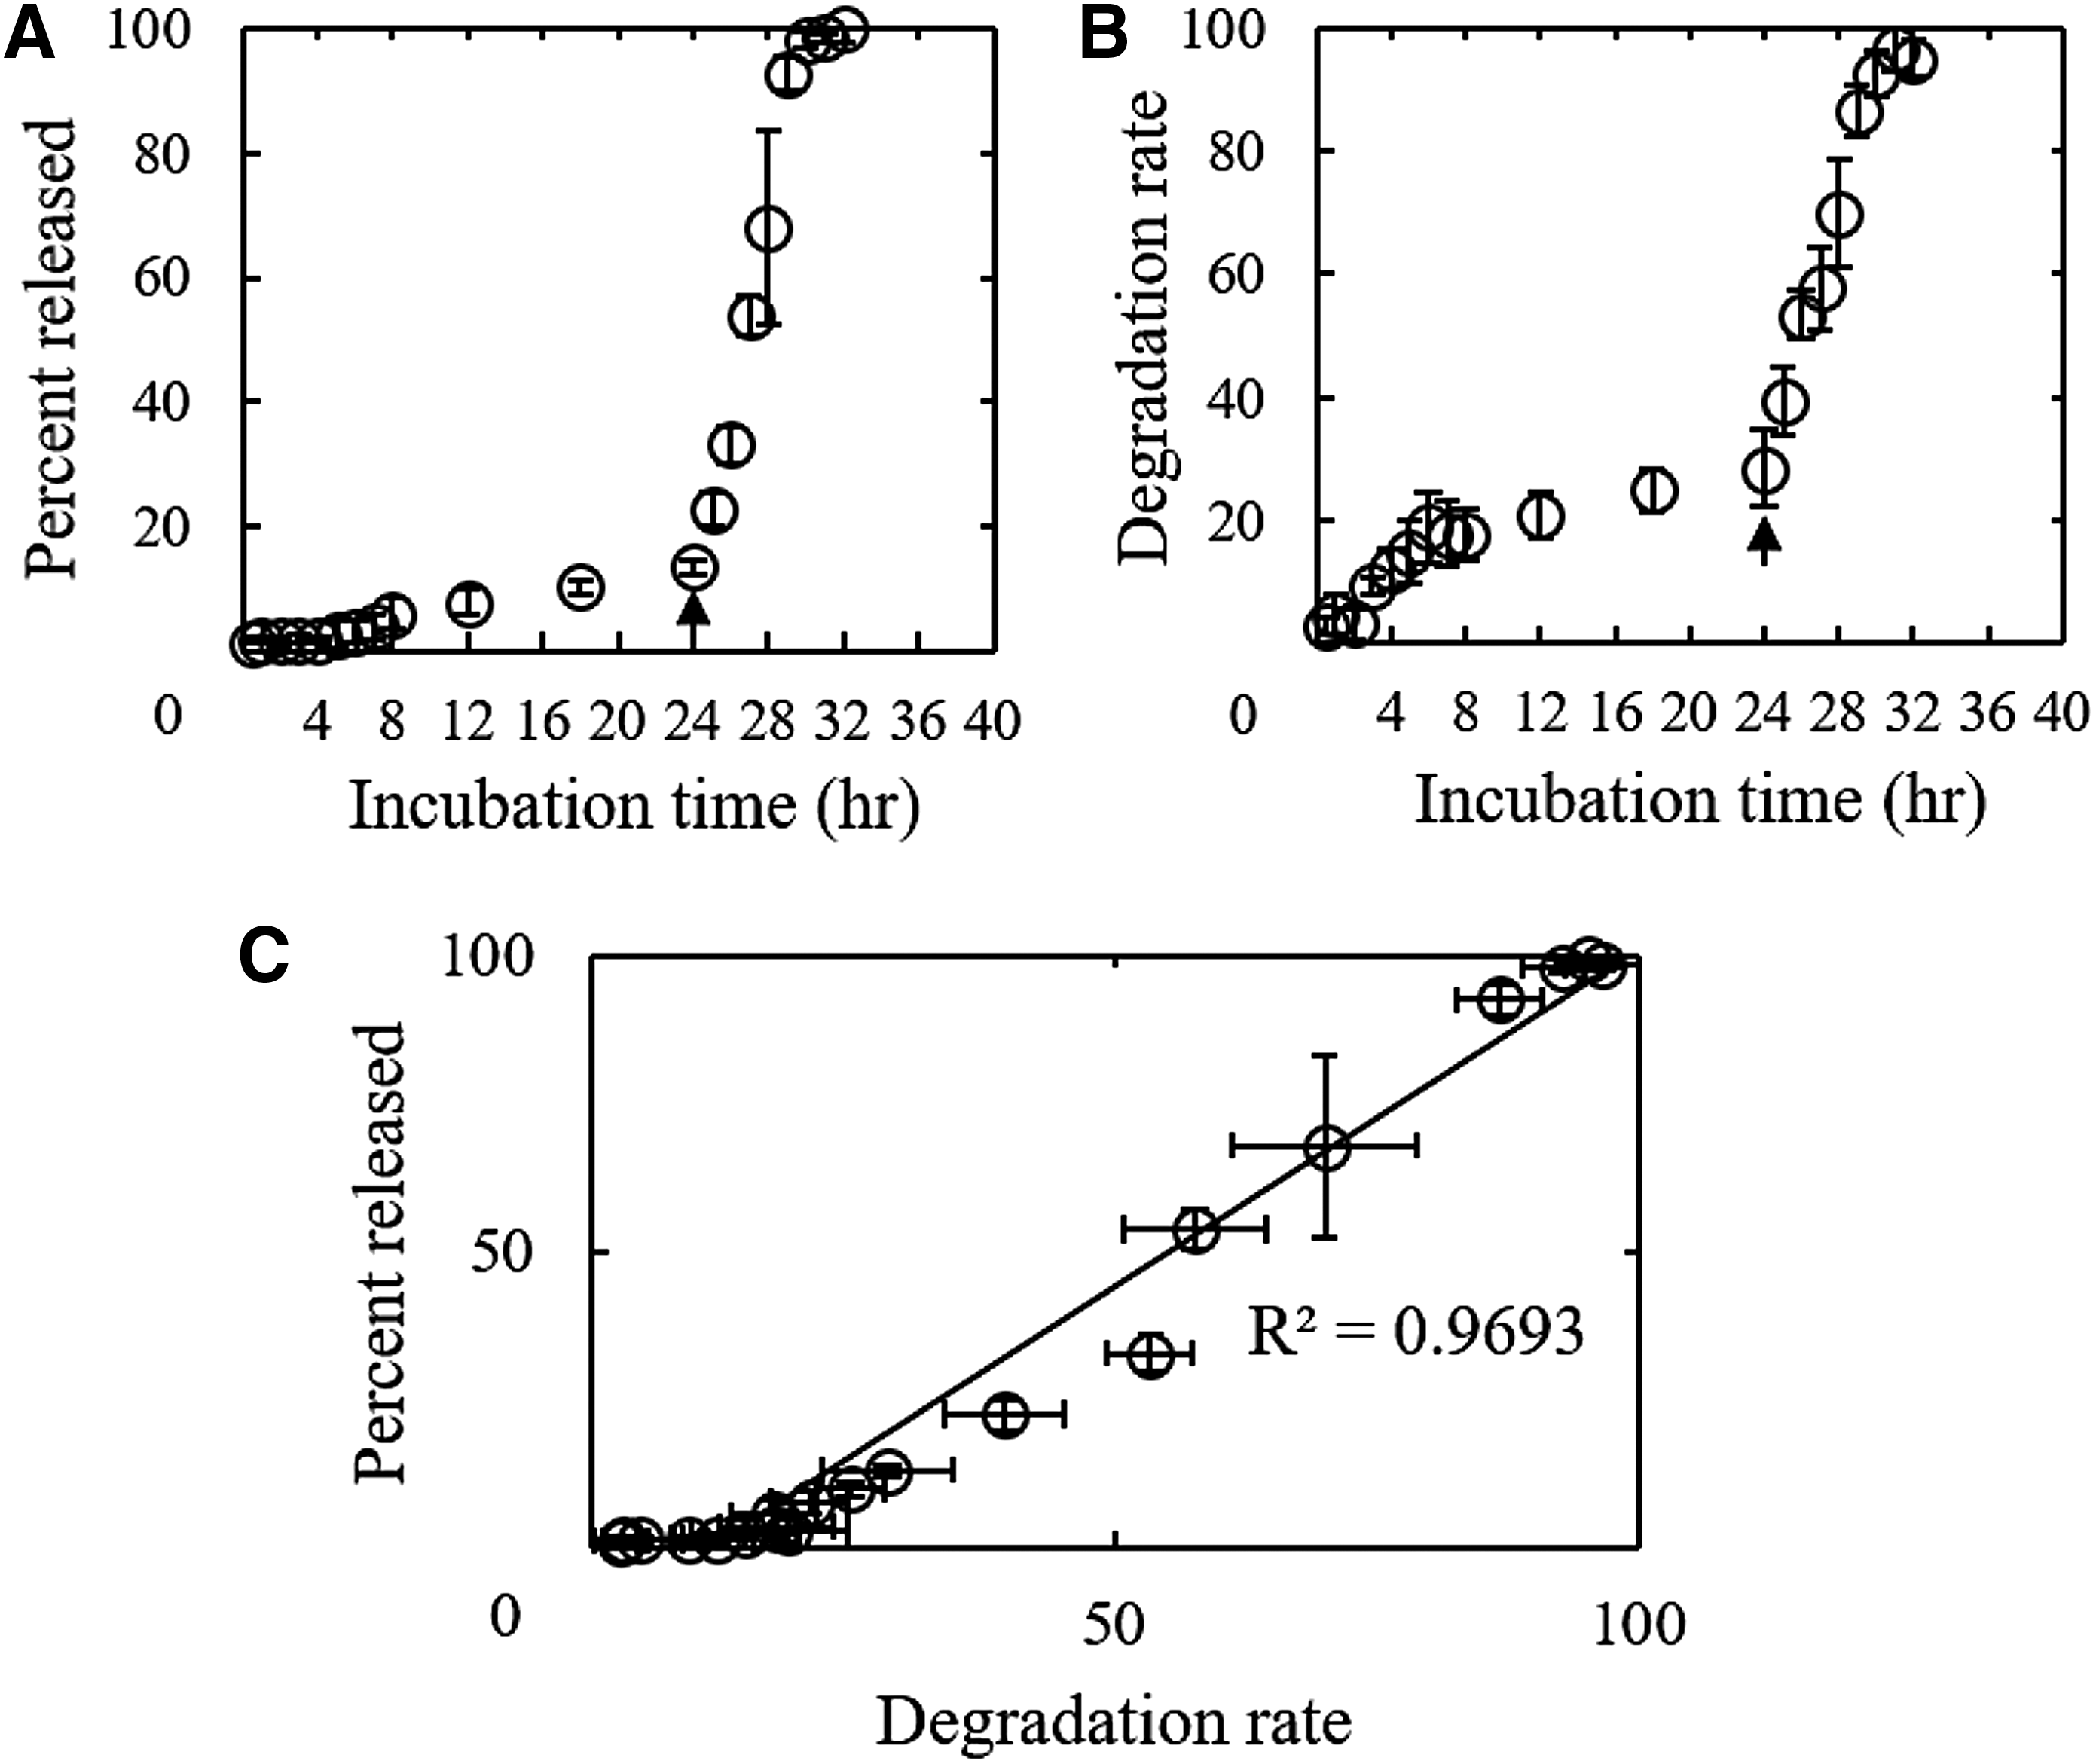
Figure 4A shows the PFT release profile from GM-PFT. When GM-PFT was incubated into PBS, a slow release of PFT was observed. By the addition of collagenase, PFT was rapidly released. Figure 4B shows the degradation profile of GM-PFT. The profile was similar to that of PFT release. There was a correlation between the two time profiles. The coefficient of determination was about 0.96 (Fig. 4C).
Observation of various types of CAF aggregates
Figure 5 shows the light microscopic pictures of 3D CAF, CAF-GM, and CAF aggregates incorporating GM-PFT containing 500 μg/mL PFT (CAF-GM-500 μg/mL PFT) 5, 10, and 15 days after incubation, or that of 3D CAF and CAF-GM with fPFT addition 5 and 10 days after incubation. The size of 3D CAF or CAF-GM did not change, irrespective of fPFT addition (Fig. 5). The tendency was similar in terms of the PFT concentration (Supplementary Figs. S1 and S2). However, the size of CAF-GM and CAF-GM-PFT 15 days after incubation was small compared with that after 10 days (Fig. 5 and Supplementary Fig. S2A).
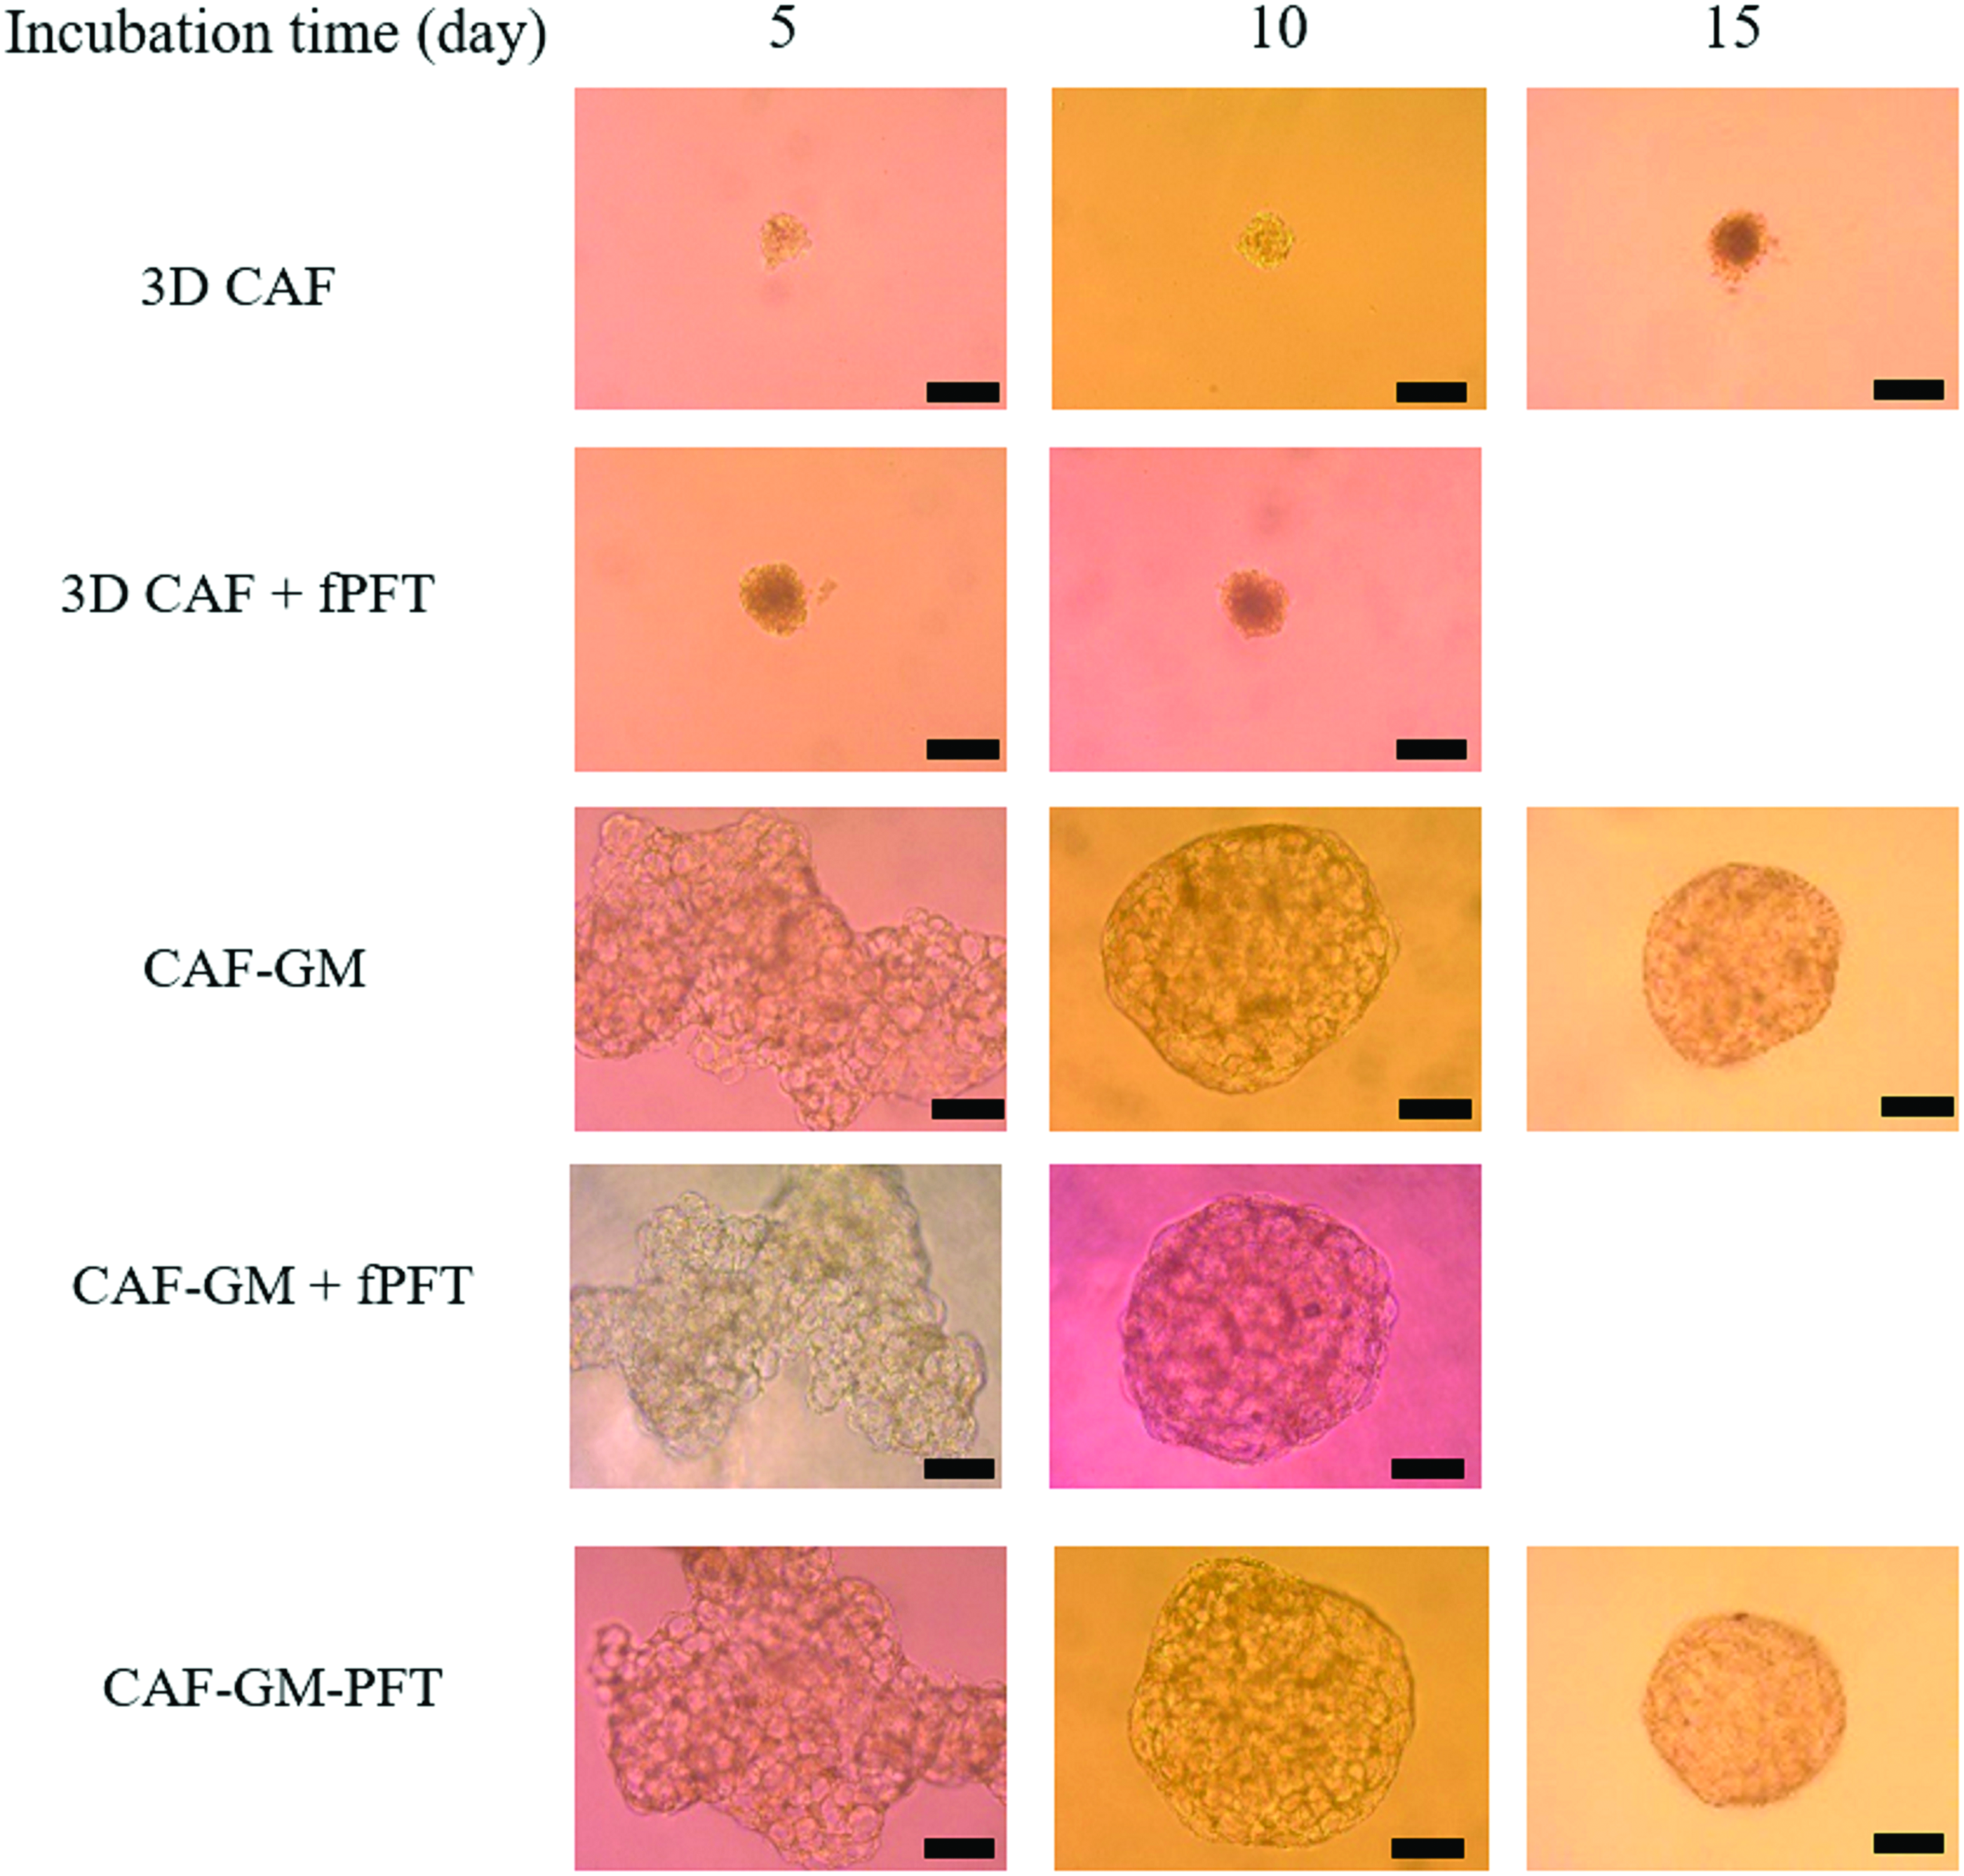
Light microscope photographs of 3D CAF, CAF-GM, and CAF-GM-500 μg/mL PFT 5, 10, and 15 days after incubation. Light microscope photographs of 3D CAF+fPFT and CAF-GM+fPFT 5 and 10 days after incubation. Scale bar; 200 μm. Color images are available online.
Cell proliferation of various types of CAF aggregates
Figure 6 shows the cell number in various types of CAF aggregates. The cell number in 3D CAF was significantly lower than that in GM incorporation group. The cell number in 3D CAF 5 days after incubation was not significantly different from that 10 or 15 days later. In terms of GM or GM-various concentrations of PFT incorporation, the cell number 10 days after incubation was larger than that 5 days later. However, there was no difference in the cell number between 10 and 15 days after incubation. In addition, the cell number did not depend on the PFT concentration or fPFT addition.

Cell number in 3D CAF () or CAF-GM ( ) and CAF-GM-PFT containing 20 μg/mL (
 ), 100 μg/mL (
 ), and 500 μg/mL (
 ) PFT 5, 10, and 15 days after incubation. Cell number in 3D CAF+fPFT (
 ) and CAF-GM+fPFT (
 ) 5 and 10 days after incubation. *p < 0.05; significantly different against the cell number for the same condition of CAF 5 days before. †p < 0.05; significantly different against the cell number for 3D CAF at the corresponding time. ‡p < 0.05; significantly different against the cell number for 3D CAF+fPFT at the corresponding time.
Measurement of α-SMA expression level
To evaluate the effect of PFT on the activation of CAF aggregates, the α-SMA expression level was measured. Figure 7 shows that α-SMA expression level for 2D CAF, 3D CAF CAF-GM, and CAF-GM-various concentrations of PFT 5, 10, and 15 days after incubation. In terms of fPFT addition, we evaluated the α-SMA expression level until 10 days. The α-SMA expression level among all types of CAF aggregates was not significantly different 5 days after incubation. In addition, at each incubation time, the α-SMA expression level for CAF-GM, CAF-GM-20, and 100 μg/mL PFT did not change. However, the α-SMA expression level for CAF-GM-500 μg/mL PFT 10 and 15 days after incubation was high compared to that for the other types of CAF aggregates. In addition, the α-SMA expression level for 3D CAF was much lower than that GM or GM-PFT incorporation groups 10 and 15 days after incubation. The α-SMA expression level for CAF-GM-500 μg/mL PFT 10 days after incubation was high compared that for CAF-GM+fPFT (500 μg/mL). The tendency was observed only for CAF-GM-500 μg/mL PFT. In addition, the α-SMA expression level for 3D CAF was much higher than that for 2D CAF, irrespective of fPFT addition.
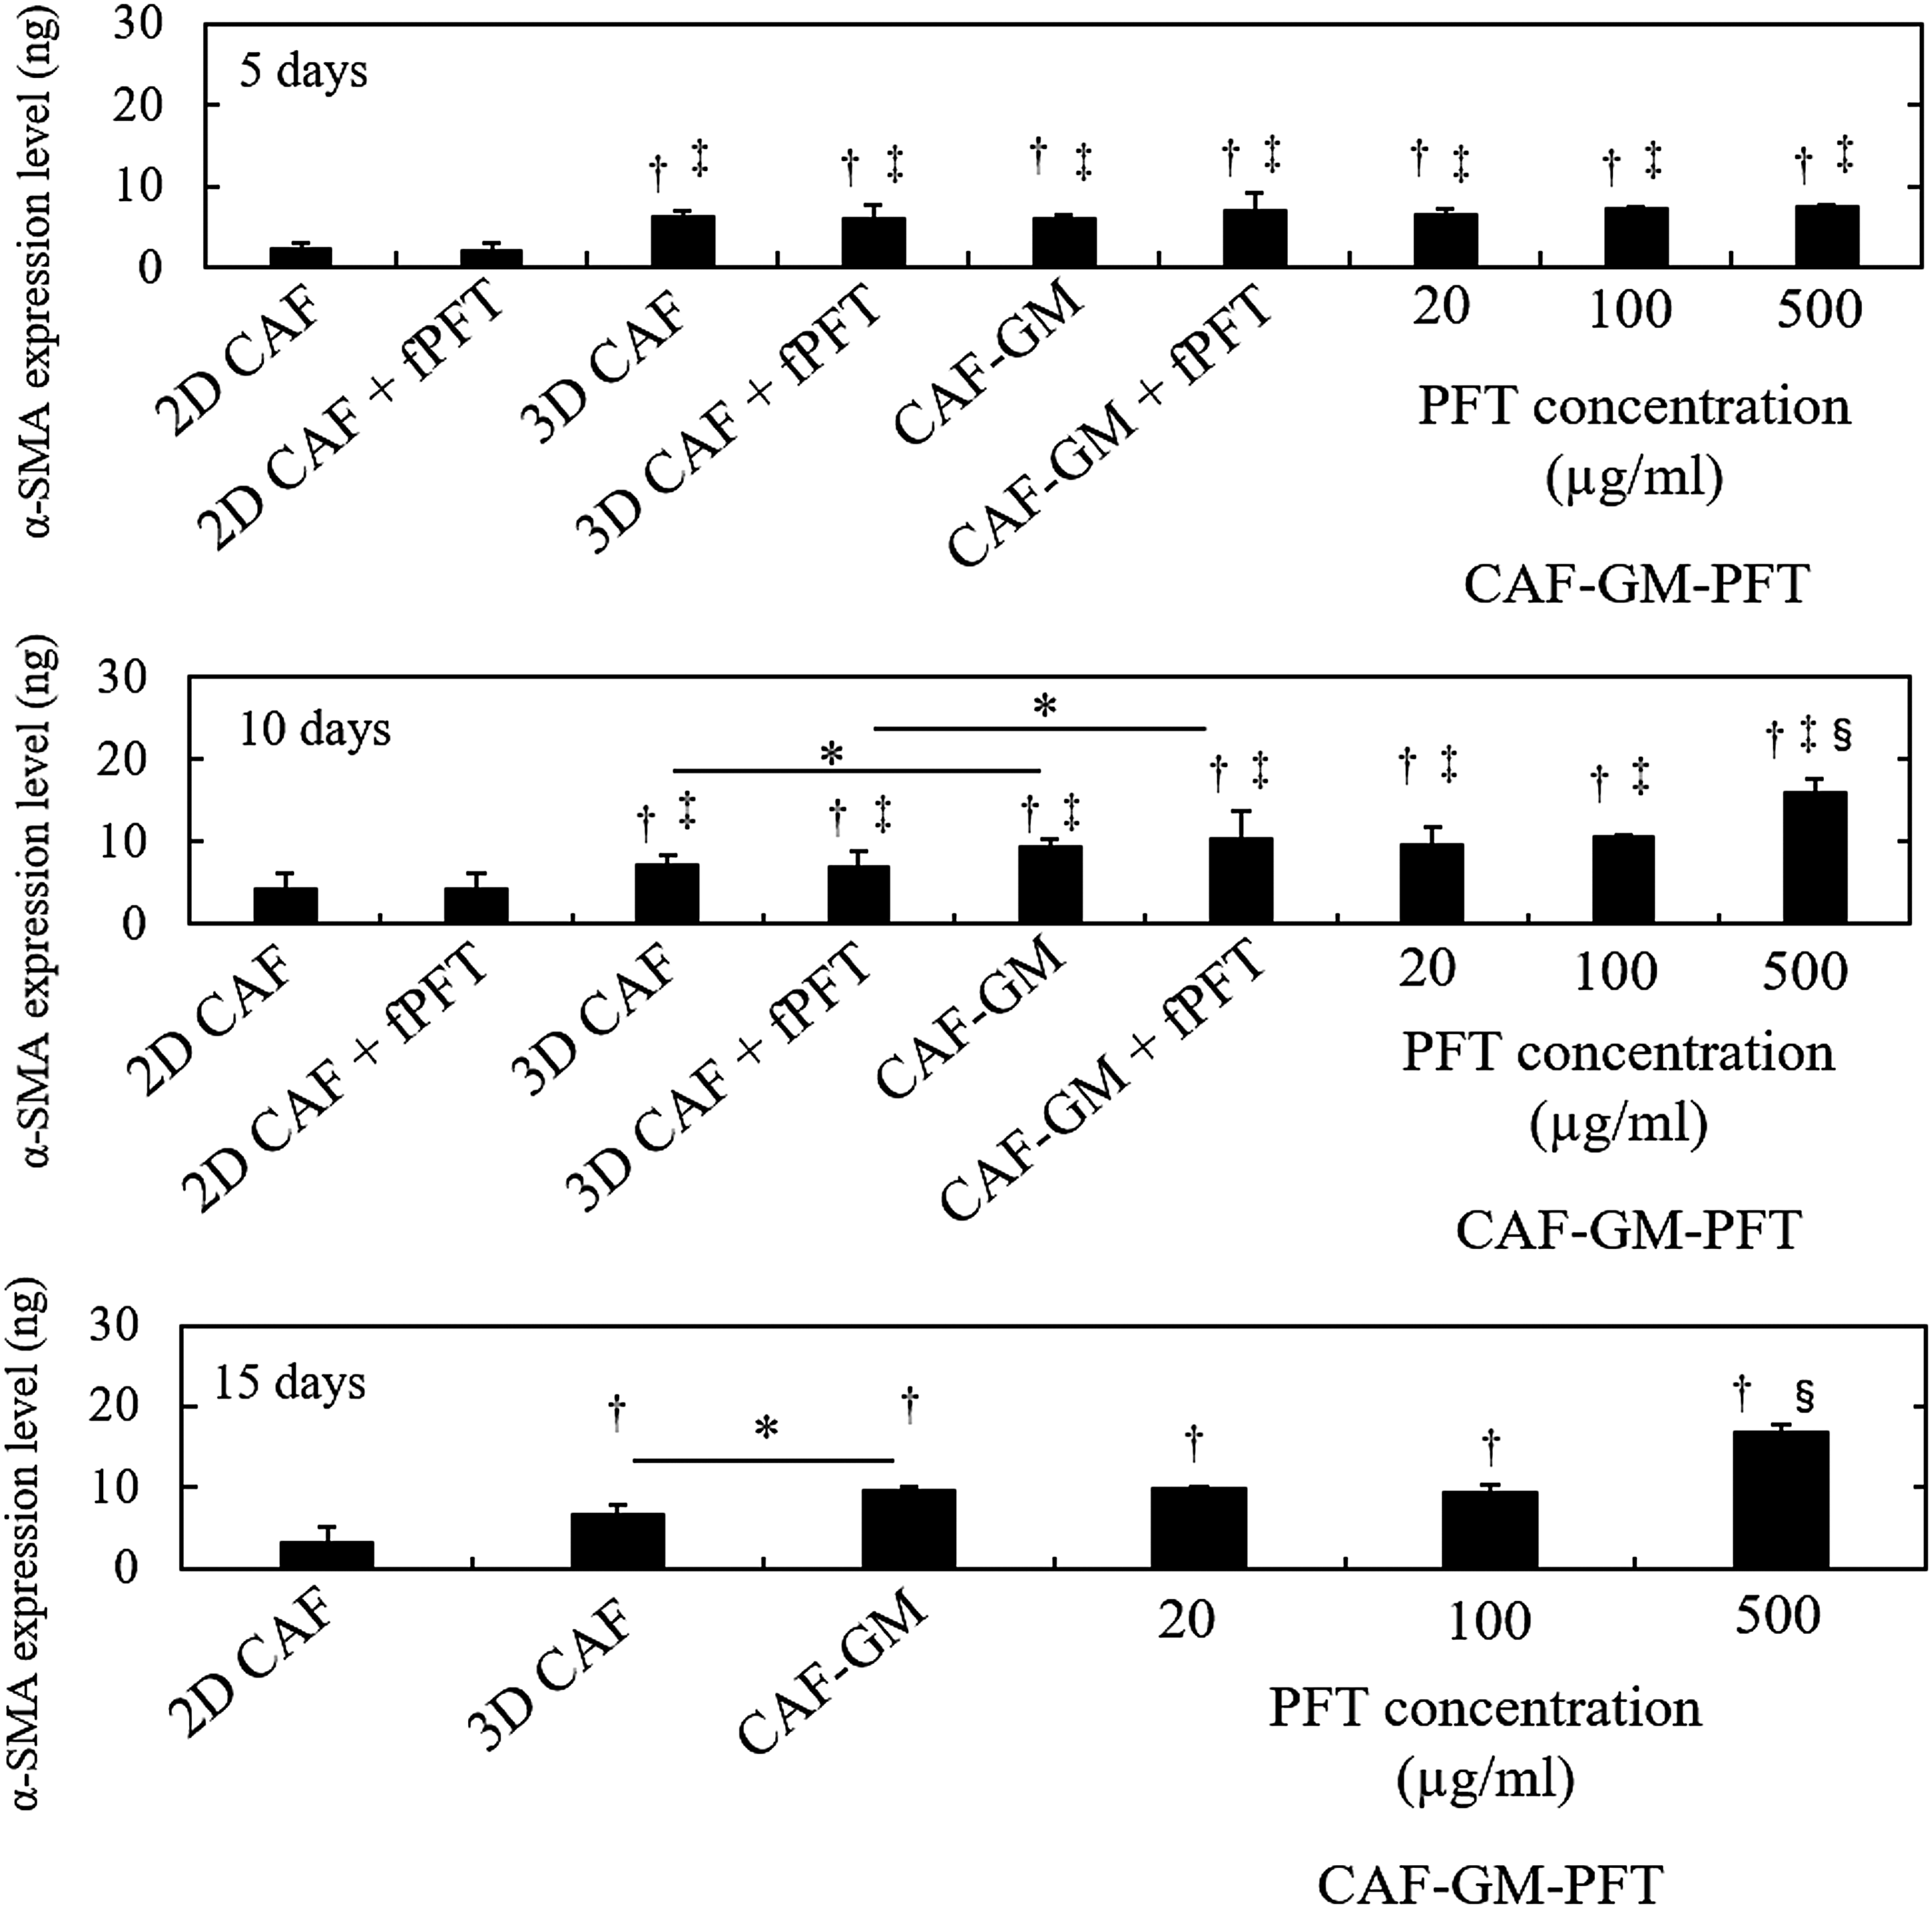
α-SMA expression level for 2D CAF, 3D CAF, CAF-GM, and CAF-GM-PFT containing 20, 100, and 500 μg/mL PFT 5, 10, and 15 days after incubation. α-SMA expression level for 2D CAF+fPFT, 3D CAF+fPFT, and CAF-GM+fPFT 5 and 10 days after incubation. *p < 0.05; significantly different between the two groups. †p < 0.05; significantly different against α-SMA expression level for 2D CAF at the corresponding time. ‡p < 0.05; significantly different against α-SMA expression level for 2D CAF+fPFT at the corresponding time. §p < 0.05; significantly different against α-SMA expression level for other groups at the corresponding time. α-SMA, alpha-smooth muscle actin; 2D, two-dimension.
Measurement of cancer invasion rate and secretion level of MMP-2
Figure 8 shows the invasion rate of cancer cells by coculture with various types of CAF. The invasion rate of cancer cells by coculture with CAF-GM-500 μg/mL PFT was high compared to that of other groups. The addition of marimastat (800 μg/mL: IC50 for cancer cells) reduced the invasion rate of cancer cells only when cocultured with CAF-GM-500 μg/mL PFT. As shown in Figure 9, the secretion level of MMP-2 from the CAF-GM-500 μg/mL PFT and cancer cells was much higher than other groups. Only when coculture with the CAF-GM-500 μg/mL PFT, the secretion level of MMP-2 was significantly higher than other groups and was reduced by the marimastat.
Invasion rate of cancer cells without CAF or by coculture with 2D CAF, 2D CAF+fPFT, 3D CAF, 3D CAF+fPFT, CAF-GM, CAF-GM+fPFT, and CAF-GM-PFT containing 20, 100, and 500 μg/mL PFT. Control () and MMP inhibitor addition culture (). *p < 0.05; significantly different between the two groups. †p < 0.05; significantly different against invasion rate for other control groups.
Secretion level of MMP-2 without CAF or by coculture with 2D CAF, 2D CAF+fPFT, 3D CAF, 3D CAF+fPFT, CAF-GM, CAF-GM+fPFT, and CAF-GM-PFT containing 20, 100, and 500 μg/mL PFT. Control () and MMP inhibitor addition culture (). *p < 0.05; significantly different between the two groups. †p < 0.05; significantly different against secretion level of MMP-2 for other control groups.
Discussion
The purpose of this study is to mimic the real tumor microenvironment and cancer invasion behavior in vitro. In vivo, it has been reported that p53 inhibition factors were secreted from cancer cells and the stromal cells such as CAF or the factors were released from the vessel, leading to the sustained CAF activation. The mechanism may not completely be understood in biology.1,49–51 On the contrary, it is difficult to control the real body environment or situation in vitro at present. Therefore, we introduced the GM that are capable of p53 inhibitor slow release. GM with diameters of 32–53 μm were used in this study (Fig. 3). This is because the size range of GM is demonstrated to be suitable to form cell aggregates. 53 In addition, the previous study demonstrates that the dehydrothermal crosslinking for 72 h allowed GM to incorporate into cell aggregates although the crosslinking extent of GM increased with an increase in the crosslinking time. 53 We have also characterized to optimize the cell aggregates incorporating GM in terms of cell activities to conclude that the cells/GM mixing ratio of 10:1 was appropriate to form cell aggregates incorporating GM. 52 This study also indicates that the adenosine triphosphate (ATP) activity of CAF aggregates increased with an increase in the number of GM incorporated (Supplementary Fig. S3).
It is apparent from the time profile of drug release and GM degradation (Fig. 4) that the drug is released from GM-PFT not by the drug diffusion but by the association with the degradation of GM. This mechanism of matrix-degradation-based drug release characterization is advantageous in terms of the drug release regulation.32,54,55 The PFT release profile did not change, irrespective of the PFT concentration (Supplementary Fig. S4). It is possible that the number of gelatin molecules is large enough to associate with PFT molecules. From the results of PFT release profile (Fig. 4A), about 10% of PFT was released for 1 day. Based on this, 10% of the total amounts of PFT was added in the solution form every day as a control group. The size of CAF-GM-PFT did not change, irrespective of the PFT concentration, upon comparing the same time (Fig. 5 and Supplementary Fig. S1). However, the size of CAF-GM or CAF-GM-PFT 15 days after incubation was small compared with that after 10 days (Fig. 5 and Supplementary Fig. S2B). This can be explained in terms of GM degradation. Our previous study demonstrates that a decrease in the size of cell aggregates incorporating GM leads to reduce the biological functions of cell aggregates. 52 Based on this, in this study, CAF aggregates were cultured at longest for 15 days.
The incorporation of GM or GM-PFT affected the increase in the cell number in CAF aggregates (Fig. 6). The cell number in CAF-GM was larger than that in the GM-Free group. It is likely that the GM presence gave cells in the aggregates a good condition of enhanced oxygen or nutrients permeability and concentration, resulting in an enhanced the cell number in CAF aggregates. However, the cell number in CAF-GM-PFT did not depend on the PFT concentration. These results are supported by the pictures in Figure 5 and Supplementary Fig. S2A. The findings indicate that the PFT release did not affect the cell proliferation of CAF aggregates. During the initial 10 days, the cell number in CAF-GM or CAF-GM-PFT increased, but not after 10 days. Considering the degradation of GM or GM-PFT in the aggregates for 10 days, it is conceivable that the GM lost results in the deteriorated condition of oxygen and nutrient in aggregates, leading to reduced or stopped cell growth. This can be controlled by changing the time period of GM degradation. To evaluate the effect of PFT on the activation of CAF aggregates, first, the α-SMA expression level for CAF-GM or CAF-GM-various concentrations of PFT (20, 100, and 500 μg/mL) was measured (Fig. 7). To identify CAF, α-SMA which is known as a specific marker for myofibroblasts, is a widely used marker as a measure of CAF activation.1,47,48 The activation level of CAF is very important because the activation of CAF enabled CAF to enhance the interaction with cancer cells, which contributes to cancer progression, invasion, and metastasis, through the secretion of various growth factors, cytokines, and chemokines.1,56 The α-SMA expression level of various types for CAF aggregates 5 days after incubation was not significantly different. However, 10 and 15 days after incubation, the α-SMA expression level for CAF aggregates was significantly low compared with that of CAF-GM. As demonstrated by the previous study, GM facilitate to supply oxygen and nutrients to cells, which lead to an increased survival of cells and the consequent biological activation. 53 The α-SMA expression level for CAF-GM-500 μg/mL PFT was significantly high compared with that of the other CAF aggregates. This indicates that 500 μg/mL PFT was suitable to enhance the functions of CAF aggregates. Next, we considered the effect of PFT release to CAF aggregates on the CAF functions. The α-SMA expression level for CAF-GM-500 μg/mL PFT was significantly different from that for CAF-GM+fPFT 10 days after incubation. The biological activation of PFT for CAF functions more effectively than the only addition of fPFT into the medium from outside of CAF-GM. The effect of addition of fPFT into the medium on the activation of 2D CAF or 3D CAF was not observed. In addition, the α-SMA expression level for 2D CAF was significantly lower than that of 3D CAF 5, 10, and 15 days after incubation. This may be explained in terms of cellular interaction. We can say with certainty that the better interaction of 3D cell–cell contact allows cells to enhance their function. It has been reported that the cell functions were determined by not a cell but a unit of the cells.23–25,57 The 3D cell culture technology is essential to enhance the cell functions.
Figure 8 shows that the invasion rate of cancer cells by coculture with various types of CAF. The invasion assay is usually performed by using a transwell via the basement membrane. For example, to evaluate the cancer invasion ability or the effect of the gene or the regents on the cancer invasion, the cell invasion assay kit was utilized.58–61 In tumor sites, although cancer cells usually attached to the basement membrane as an alternative of epithelial cells, cancer cells started to penetrate through the basement membrane when cancer cells gained the invasiveness.1,2,62 Therefore, the culture condition in this study (cancer cells on the basement membrane, CAF under the basement membrane) would mimic the inner state of cancer cells in cancer sites. The mixing ratio of cancer cells and CAF of 1:4 was used. This is because it has reported that the numbers of CAF are about second, three, or four times as much as that of cancer cells, although the ratio depends on the cancer type. 44 The invasion rate of cancer cells only by coculture with CAF-GM-500 μg/mL PFT was significantly higher than that with other groups. From the results, it is possible that the CAF-GM-500 μg/mL PFT simulates the cancer microenvironment better than other groups. Interestingly, when cancer cells were cultured without CAF, the invasion rate was not significantly different from that with them. It is well known that invasion tends to occur with CAF existence because of the interaction between cancer cells and CAF in vivo. 1 It is conceivable that the activation of CAF as much as possible is needed to occur the interaction between them in vitro. To further evaluate the interaction between cancer cells and CAF, the addition assay of marimastat, an inhibitor of MMP, was performed (Fig. 8, closed bar). As a result, the cancer invasion rate was significantly inhibited only by coculture with CAF-GM-500 μg/mL PFT. In addition, the level of MMP-2 secreted from the CAF-GM-500 μg/mL PFT was significantly higher than that of other groups (Fig. 9). Moreover, the inhibition effect of marimastat on the MMP-2 secretion was seen only for the CAF-GM-500 μg/mL PFT group (Fig. 9). However, the MMP-9 secretion was not observed for all of the groups (data not shown). Among the MMPs, it has been reported that MMP-2 and 9 selectively degrade type IV collagen and laminin, which mainly are composed in the basement membrane, and contribute to the cancer invasion. The expression of larger amounts of MMP-2 and 9 is demonstrated in several cancers. Taken together, the two types of MMPs were focused. MMP-9 is also activated by MMP-3 and MMP-13. 1 MMP-3 and 13 were not evaluated because MMP-9 is not secreted higher. In addition, the MMP inhibition did not affect the CAF function (Supplementary Fig. S5). Taken together, it is likely that the efficient interaction between cancer cells and CAF with a high activity allowed cancer cells to achieve their invasion behavior even in vitro via the MMP-2 system (Fig. 10). This study is the first report to create an invasion model in vitro by taking advantage of a combined 3D culture system and the DDS technology.
Result illustration of cancer invasion model based on a combination of 3D cell culture and drug delivery system technology. The cancer invasion rate was low in the conventional model (with 2D CAF or CAF-GM) because the cancer local environment is different from that of in vivo tumor microenvironment, leading to the lower MMP secretion. The present cancer invasion model would be an effective tool to evaluate the ability of cancer invasion in vitro because this invasion model enables cancer cells to give a microenvironment similar to in vivo.
Footnotes
References
Supplementary Material
Please find the following supplemental material available below.
For Open Access articles published under a Creative Commons License, all supplemental material carries the same license as the article it is associated with.
For non-Open Access articles published, all supplemental material carries a non-exclusive license, and permission requests for re-use of supplemental material or any part of supplemental material shall be sent directly to the copyright owner as specified in the copyright notice associated with the article.