
Abstract
Advancements in type 1 diabetes mellitus treatments have vastly improved in recent years. The move toward a bioartificial pancreas and other fully implantable systems could help restore patient's glycemic control. However, the long-term success of implantable medical devices is often hindered by the foreign body response. Fibrous encapsulation “walls off” the implant to the surrounding tissue, impairing its functionality. In this study we aim to examine how streptozotocin-induced diabetes affects fibrous capsule formation and composition surrounding implantable drug delivery devices following subcutaneous implantation in a rodent model. After 2 weeks of implantation, the fibrous capsule surrounding the devices were examined by means of Raman spectroscopy, micro-computed tomography (μCT), and histological analysis. Results revealed no change in mean fibrotic capsule thickness between diabetic and healthy animals as measured by μCT. Macrophage numbers (CCR7 and CD163 positive) remained similar across all groups. True component analysis also showed no quantitative difference in the alpha-smooth muscle actin and extracellular matrix proteins. Although principal component analysis revealed significant secondary structural difference in collagen I in the diabetic group, no evidence indicates an influence on fibrous capsule composition surrounding the device. This study confirms that diabetes did not have an effect on the fibrous capsule thickness or composition surrounding our implantable drug delivery device.
Impact Statement
Understanding the impact diabetes has on the foreign body response (FBR) to our implanted material is essential for developing an effective drug delivery device. We used several approaches (Raman spectroscopy and micro-computed tomography imaging) to demonstrate a well-rounded understanding of the diabetic impact on the FBR to our devices, which is imperative for its clinical translation.
Introduction
Type 1
Several factors can affect wound healing, such as aging, chronic inflammation, therapeutic interventions, and systemic diseases.9–11 The biological alterations that occur in the diabetic population, such as chronic hyperglycemia, impaired signaling, and circulatory dysfunction, are well documented.12–15 Implantable medical devices induce chronic inflammation at the site of implantation. 9 Wound healing is a normal biological process involving several highly integrated stages.10,16 Within minutes, nonspecific protein adsorption to the biomaterial surface initiates a cascade of events. Initially, macrophage recruitment and subsequent polarization to either M1 (proinflammatory) or M2 (anti-inflammatory) phenotypes plays a pivotal role in the host's response.5,17,18
The prolonged presence of the biomaterial leads to frustrated macrophages merging to form foreign body giant cells (FBGCs). Both macrophages and FBGCs release cytokines that encourage fibroblasts to deposit collagen around the foreign material, essentially “walling off” the implant from surrounding tissue (Fig. 1A).17,19 This avascular, collagen-rich layer of tissue prevents the delivery of drugs and molecule diffusion over time, eventually leading to device failure.
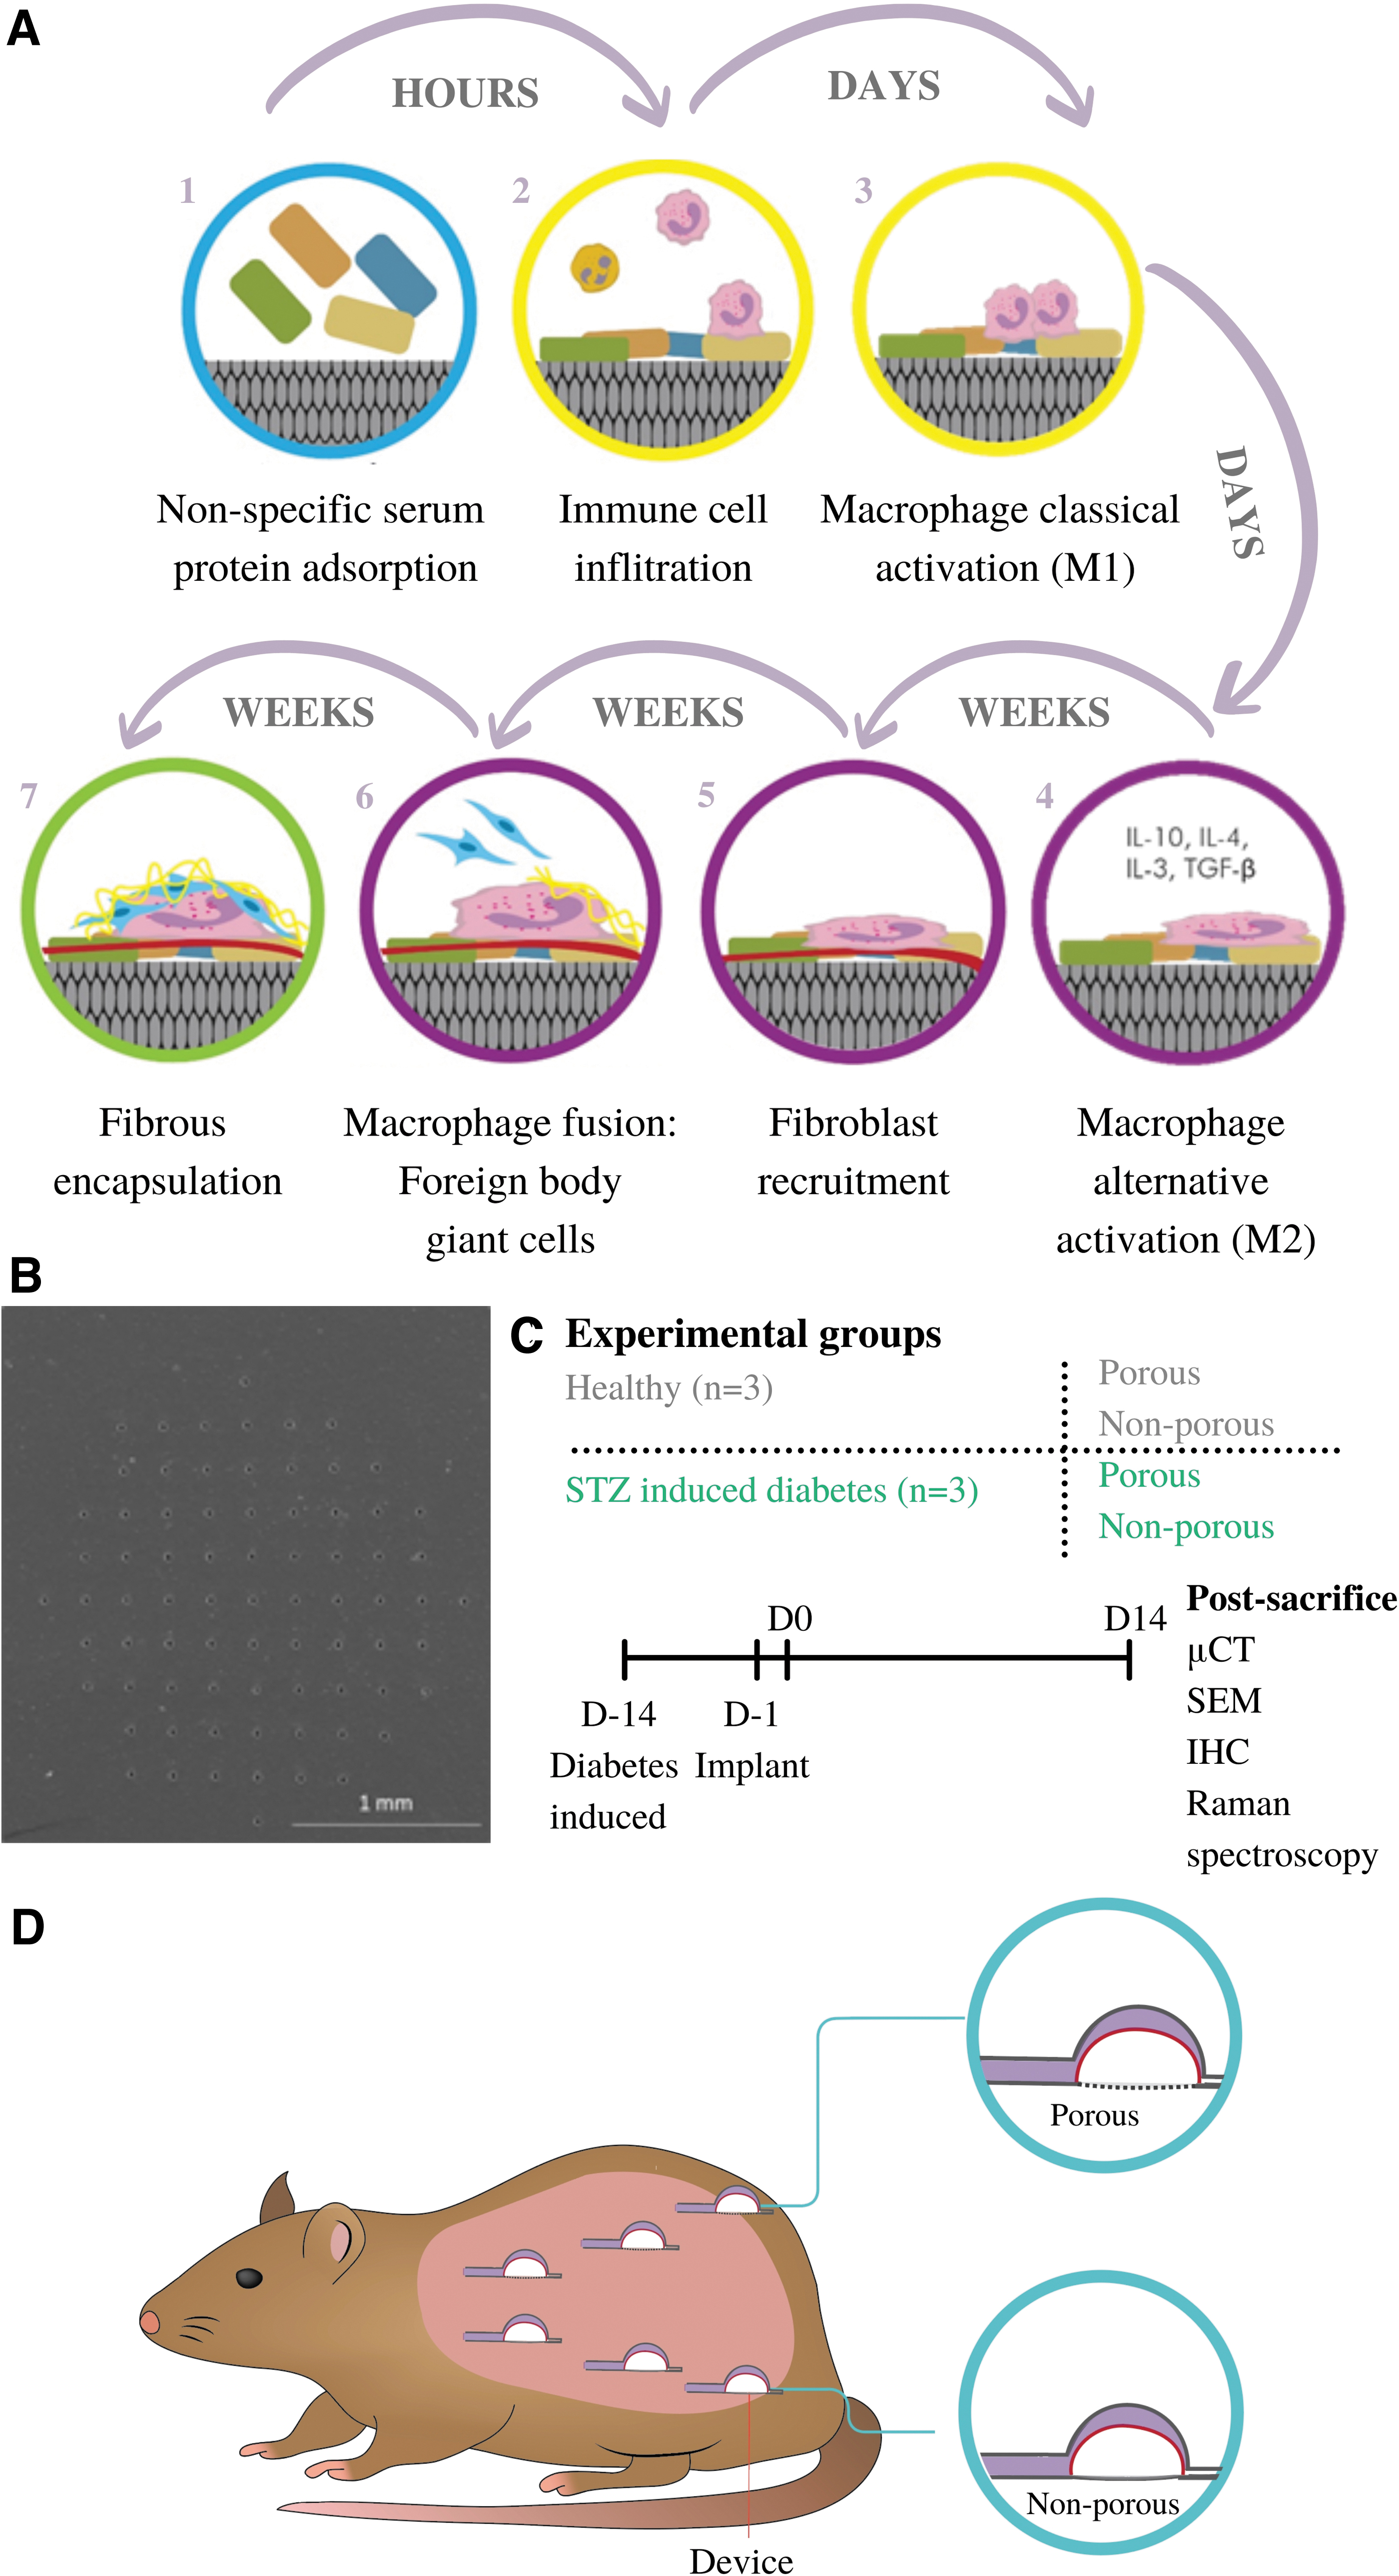
Fibrous encapsulation and study design.
In addition, the diabetic environment has been shown to alter the FBR to polyether–polyurethane implants located intraperitoneally. Increases in profibrogenic cytokine (TGF-β1) and inflammatory markers (TNF-α and MCP-1) resulted in alterations in collagen maturity in the diabetic group compared with the control. 9 Other studies revealed that after 10 days, subcutaneous implants in a diabetic model significantly increased TNF-α, MCP-1, and MPO activity but reduced levels of NAG, TGF-β1, and collagen expression. 20 The increase of TNF-α might be related to fibroblast apoptosis, resulting in a decrease in capsule formation.20–22 It is also reported that the molecular pathogenesis of diabetes is not comparable with healthy groups. 23 The wound healing process in diabetic patients is deficient in chemokines expression, macrophage function, and collagen deposition, affecting the progress of wound closure.10,24,25
However, until now, most studies mainly focused on the wound healing process of diabetes, which cannot equally contribute to the understanding of FBR caused by implants in the diabetic population. Manipulating the host tissue through chemical, mechanical, or surface modifications can encourage better integration with reduced fibrosis.5,17,19,26 Previously, our laboratory has developed a soft robotic drug delivery device, called the dynamic soft reservoir (DSR), which was shown to reduce the mean fibrotic capsule thickness in nonporous devices. An actuation profile was used every 12 h for 14 days in a rodent model. The reduction in mean fibrotic capsule thickness highlighted the potential of this technology to fine-tune the biological host response. 7 Understanding the diabetic response to biomedical implants is essential for improving device longevity.
This study looks at porous versus nonporous DSR devices to determine capsular development surrounding nonactuated devices in healthy and streptozotocin-(STZ) induced diabetic animals. We use micro-computed tomography (μCT) and Raman spectroscopy (RS) to examine the FBR to implantable drug delivery devices in the diabetic subcutaneous environment. 27 RS is a marker-independent method and was implemented here to examine the FBR by analyzing the extracellular matrix (ECM) proteins in the capsule. This label-free technique has the potential to monitor the pathological characterization for the future diagnosis with no invasive surgery procedure and any histological staining.28,29
Here, we aim to examine the host's response to our subcutaneous implantable DSR devices by utilization of traditional histological analysis, μCT imaging, and RS with multivariate tools to gain a well-rounded understanding of the diabetic impact on FBR.
Methods Section
Device manufacture
DSR devices were fabricated and sterilized using gamma radiation. The DSR device consists of two separate reservoirs, a therapeutic and actuating reservoir. 0.075 and 0.3 mm thick thermoplastic polyurethane (TPU) sheets (HTM-8001-M and HTM-1001 polyether TPU film; American Polyfilm, Inc.) were formed into hemispherical shapes (Yescom dental vacuum former). Both reservoirs are 3.9 mm in height and 3.5 mm in diameter, with the 0.3 mm TPU reservoir placed inside the 0.075 mm TPU reservoir. Two separate 3F TPU catheter tubing were added to the relevant channels and bonded using heat shrink tubing. The size and shape of the DSR can be easily altered by modifying the three-dimensional (3D) printed molds. The base of the therapeutic reservoir contains a porous membrane. A TRUMF Trumicro 5050 picosecond laser cutting technique with UV 353 nm wavelength was used to generate pores 10 μm in diameter. Pore size, pattern, and density can be varied depending on the specific clinical need (Fig. 1B).
Surgical procedure and implantation
Rodent studies were approved by the Italian Minister of Health (Authorization No. 66/2017-PR) and performed by Abiel Srl (Italy). Six, 12-week-old, female RccHan Wistar (ENVIGO) 150/200 g rats were used during this study. Two weeks before DSR implantation, diabetes was induced using 65 mg/kg STZ intravenously in three animals (Fig. 1C). STZ-induced type 1 diabetes in rodent models has been an established and accepted practice for the study of disease pathology and its associated complications including would healing since the 1960s.23,30–32 Rats were anesthetized by isofluorane and hair was removed in the area of implantation on the dorsum. Six incisions, three on the left and right of the midline were made in each rat. Three porous and nonporous DSR devices were implanted subcutaneously following enlargement of the surgical incision by blunt dissection (Fig. 1D). Devices were secured to underlying muscle using a suture. The incision was closed with braided sutures. On day 14, devices were explanted en bloc with surrounding tissue. Tissue blocks were fixed in 4% paraformaldehyde overnight at 4°C and stored in 1 × phosphate-buffered solution (PBS).
Micro-computed tomography
One porous and nonporous device per animal were selected for μCT analysis. Fixed samples were transferred into 2.5% phosphomolybdic acid (PMA) (673400; Hopkin & Williams) in 70% ethanol to enable visualization of collagen dense tissues. 33 Rat skin was scored before emulsion in the PMA solution to ensure sufficient uptake of the contrast agent (7 days). High-resolution scanning was performed on a Scanco Medical μCT 100 and subsequent dicom files were analyzed using Mimics research 18.0.525 software (Materialise). Thresholding of the fibrous capsule was performed by creating a green mask over the entire sample. Once the entire length of the device was mapped, a second yellow mask was created (background mask). A Boolean operation was performed to create a cyan mask (green minus yellow), to remove any background from the mask. The mask was calculated in 3D and a 2.4–2.6 mm circle was cropped from the center of the fibrous capsule. An .STL file of this cropped disk was exported for analysis on 3-Matic software 10 × (Materialise). The fix wizard, a smoothing factor (0.8), autoremesh, wall thickness analysis, and segmentation was performed, as previously described. 7 The wall thickness analysis function creates a color map of the 3D reconstructed capsule between 0 and 200 μm (green, thin; red, thick). This information is exported as raw thickness measurements, which are subsequently presented as average values.
Scanning electron microscopy
Post-μCT imaging, samples were bisected longitudinally to create a cross-section of the device and surrounding tissue and further dehydrated through a series of graded alcohols (90% and 100%). Following dehydration, samples were critical point dried (EMITECH K850) to remove all liquid from the sample. Samples were mounted onto aluminum stubs using carbon adhesive tabs and gold sputter coated (Emscope SC500). Specimens were imaged using a Hitachi S-2600N Scanning Electron Microscope using a secondary electron detector (Vacuum 15 kV, electron Beam 50). Scanning electron microscope images were stitched together pseudo-colored using Mountains 8 software.
Histological analysis
Tissue processing
One porous and nonporous device per animal was selected at random. Samples were cut in half and processed for histological analysis. Tissues were orientated, embedded (Leica wax embedder) and sectioned (7 μm thick) onto positively charged slides. Slides were deparaffinized in xylene and brought to buffer through a series of graded alcohols.
Analysis of macrophage content
Sodium citrate antigen retrieval was performed for 30 min at 60°C (10 mM trisodium citrate, 0.05% Tween-20). Primary antibody CD68 (1:50; MCA341R; BioRad) was double stained with either CCR7 (1:100; ab32527; Abcam) or CD163 (1:250; ab32527; Abcam) and incubated for 60 min at 37°C. Secondary antibodies were then applied (Alexa Fluor 594 goat anti-mouse immunoglobulin G, 1:200; Alexa Fluor 488 goat anti-rabbit IgG, 1:200) and incubated for 60 min at 37°C. Nuclei were stained using Hoechst (1:1000). Slides were mounted using fluormount mounting media and stored at 4°C. Slides were imaged using a spinning disk confocal microscope (CSU22; Yokagawa) combined with Andor iQ 2.3 software. Analysis was performed as previously described by Coulter et al. 34
Polarized light microscopy
The collagen content of the samples was analysis using picrosirus red staining. After rehydration the samples were stained in 0.1% fast green (pH 7, Fast Green FCF; Sigma-Aldrich) (30 min) followed by 0.1% Sirus red in picric acid (picrosirius red stain) (60 min) as previously established. 33 Samples were dehydrated, cleared in xylene, and mounted using DPX mounting medium. Images were captured using an Olympus BX4 polarized light microscope (Mason Technology Ltd., Dublin, Ireland) at 20 × magnification. The polarizing lenses were positioned on the light path before the sample and the second polarizer (analyzer) after the sample. Images were taken at 0° and 90° to maximum polarization. The two captured images were merged in ImageJ (Fiji version 2.0.0) software. Mature and immature collagen was calculated by color thresholding by excluding the dark background, as previously described. 34 Dominant direction was determined using the Orientation J plugin on ImageJ. 35
Immunofluorescence staining
Antigen retrieval was performed with pH 9 Tris-EDTA buffer (containing 10 mM Tris-base, 1 mM EDTA, and 0.05% Tween-20) followed by pH 6 citrate buffer (10 mM citric acid and 0.05% Tween-20). To minimize the unspecific binding of secondary antibodies, 2% goat serum block solution was used. Sections were incubated with one of the following primary antibodies: Rabbit polyclonal anti-collagen I (Col I; 1:500; Cedarlane, Burlington, CA), rabbit IgG1 polyclonal anti-Col III (1:75; Acris, Herford, Germany) and mouse IgG2a monoclonal anti-alpha-smooth muscle actin (α-SMA) (1:500; Sigma-Aldrich, St. Louis, MO) overnight at 4°C. Secondary antibodies were added: AlexaFluor 488-conjugated goat anti-rabbit (1:250; Thermo Fisher Scientific Life Technologies) was applied to the anti-Col I and III antibodies and AlexaFluor 594-conjugated goat anti-mouse (1:250; Thermo Fisher Scientific Life Technologies) for the anti-α-SMA antibody. The 3D immunofluorescence (IF) images were acquired using a confocal laser scanning microscope (LSM 880; Carl Zeiss Microscopy GmbH, Germany). Z stack imaging was used and followed by image processing (Imaris x64 9.5.1; Bitplane, CT). The excitation wavelengths of the lasers were 594, 488, and 405 nm, corresponding to α-SMA, Col I and III and DAPI, respectively. To test nonspecific binding of the antibodies, negative controls consisting of the same tissue samples were stained with only secondary antibodies. The histogram scale was adjusted to be invisible for the unspecific fluorescent signal based on the control tissue staining. The same histogram scale was applied to every staining section, defining the specificity of the positive signals of the IF staining. Moreover, RS was utilized to scan the IF staining sections. The Raman signals showed great correlation with the IF signals of α-SMA, Col I and III staining and the acquired spectra were consistent with previous literatures.36,37 Quantitative analysis of the IF images was performed based on the volume of each component and normalized by the whole tissue volume.
Raman spectroscopy
RS was performed with a Raman microscope (WITec alpha 300 R; WITec GmbH, Ulm, Germany) equipped with a charge-coupled device camera (WITec GmbH) to analyze the deparaffinized sections. The Control Five 5.2 software (WITec GmbH) was utilized to manage every scanning operation. A green laser (532 nm) with a power of 50 mW was used. Every section was maintained hydrated in PBS and imaged with a 63 × objective (W Plan-Apochromat 63 × /1.0 M27; Carl Zeiss GmbH, Jena, Germany). The samples were measured as follows: (1) to obtain the ECM reference spectra, IF-stained sections were imaged using a green fluorescence filter to localize positively stained areas as regions of interest for Raman image acquisition. The spectral information colocalizing with the pixel of positive fluorescence staining was extracted to generate the reference spectra. (2) Raman imaging of unstained sections was performed for each group on defined areas within the fibrotic capsules, localized in the brightfield mode. An acquisition time of 0.05 s per spectrum and a pixel resolution of 1 × 1 μm were applied to generate the spectral maps.
Spectral analysis
The Project Five 5.2 software (WITec GmbH) was used for analysis. Spectra were cropped to the wavenumber range from 200 to 3000 cm−1. Artifacts originating from cosmic rays were removed. Subsequently, the graph background was subtracted and the area for every spectrum was normalized to 1. True component analysis (TCA) was then exerted to generate intensity distribution images that assess the localization of the previously defined reference components. For quantitative analysis, intensity distribution images for Col I, Col III, and α-SMA were extracted and analyzed in ImageJ.
For qualitative analysis of the molecular composition of the collagen fibers, principal component analysis (PCA) has been used to differentiate subtle molecular shifts, as described previously. 38 Col I spectra (400–1800 cm−1) were extracted to undergo PCA calculation (The Unscrambler X; CAMO Software AS, Oslo, Norway). Interpretation of PCA results has been described previously.39,40 Average score values and loadings were compared between implant materials and disease states.
Statistics
Statistics were performed using Prism 8 (GraphPad, La Jolla, CA) software. Results were presented as mean values ± standard deviation. Unpaired t-tests with parametric and nonparametric tests were conducted for the comparison between two groups. One-way parametric analysis of variance tests were used to compare the four groups in this study. Significant difference was only accepted when p < 0.05.
Experiment
Fibrous capsule thickness analysis
Visualization of soft tissue structures was permitted by passive uptake of a contrast agent. Three-dimensional reconstruction of high-resolution scans allowed for thresholding of the fibrous capsule (Fig. 2A). As previously described by Dolan et al., 7 the region of interest was determined to be the tissue adjacent to the porous membrane beneath the “dome” of the DSR device; capsular measurements were only taken within this region. No significant change in mean fibrotic capsule thickness was seen across the groups (Fig. 2B). STZ-induced diabetes did not have an effect on the capsule thickness compared with the control (p = 0.2350). Subsequently, for additional qualitative analysis, the samples were bisected in half, processed and imaged using a scanning electron microscope (Fig. 2A). A clear visual representative was apparent, which strengthened our μCT findings that no change in fibrotic capsule thickness was seen. Histological sectioning for Masson's trichrome imaging resulted in slight destruction of the fibrous capsular area of interest. Clear representative fibrous capsule quantitative areas were not present across all groups (Fig. 2A).

Quantitative μCT analysis revealed no change in mean fibrotic capsule thickness analysis when comparing healthy with diabetes-induced animals.
Macrophage content analysis
To examine the macrophage response to the porous and nonporous DSR devices, the tissue sections were stained with a pan-macrophage marker (CD68), used in conjunction with a CCR7 or CD163 antibody and imaged at the region of interest (Fig. 3A). CCR7 and CD163-positive macrophages point toward M1 and M2 phenotypes, respectively.41–43 As shown (Fig. 3B), the ratio of M1 (CCR7) and M2 (CD163) to CD68 was a similar in the diabetic state when compared with the healthy control. This suggests the ratio of macrophages was not affected by the diabetes disease state or the porosity of the devices.
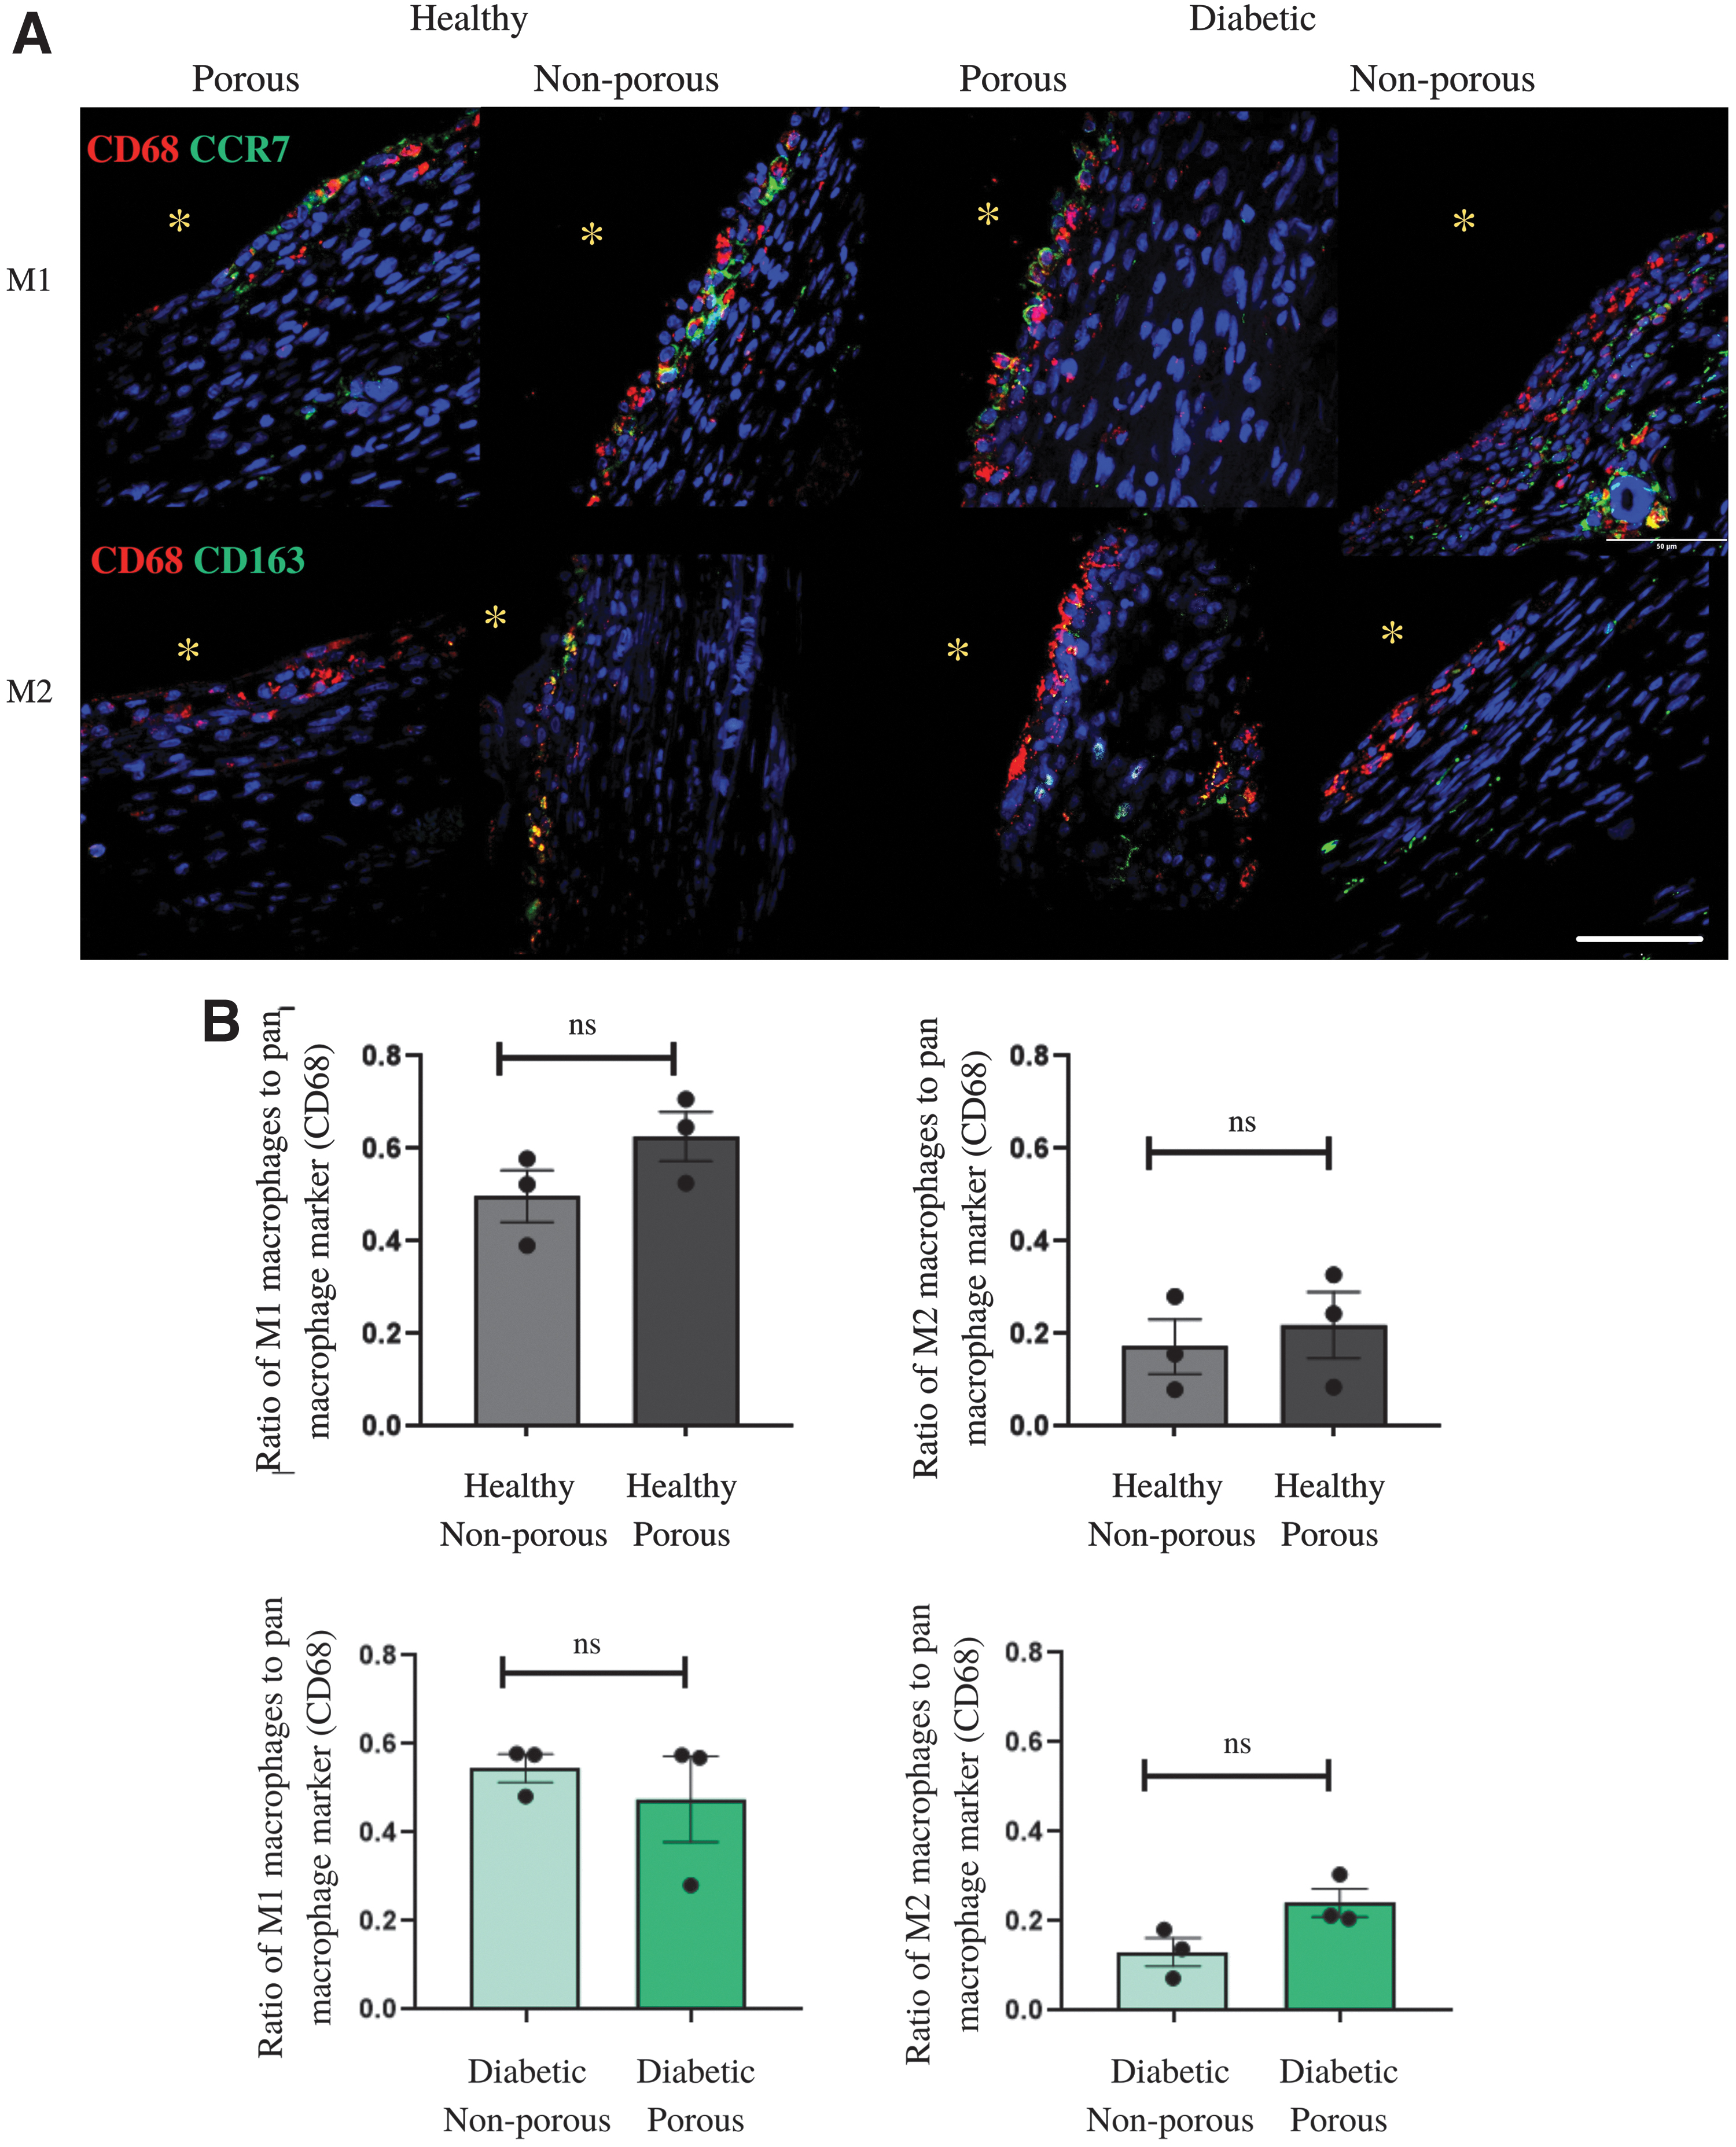
Pan-M1- and M2- macrophage immunofluorescence staining showed no changes across groups, regardless of porosity or diabetes.
Collagen content analysis
To examine the collagen fibers composition of the fibrous capsule in both diabetic and healthy animals, samples were stained with picrosirius red and imaged using polarized light microscopy (Fig. 4A). The overall coherency of the tissue was determined (Fig. 4B). No significant difference was seen in porous and nonporous samples in healthy and diabetes-induced animals (p = 0.5827, p = 0.5998). Diabetes did not affect the coherency of the capsule suggesting no compositional change in the capsule (p = 0.3997). Mature and immature fibers (Fig. 4C, D respectively) could be identified using color segmentation (red/orange = mature; green/yellow = immature collagen).44,45 There was no significant difference seen between porous and nonporous samples in healthy and diabetes-induced animals (red/orange: healthy p = 0.4152, diabetic p = 0.1649; green/yellow: healthy p = 0.4086, diabetic p = 0.2333). Diabetes did not have an effect on the collagen maturity within the capsule (red/orange p = 0.7190; green/yellow p = 0.8918). The addition of pores into the DSR device, similarly, did not affect the collagen content within the capsule (Fig. 4B).
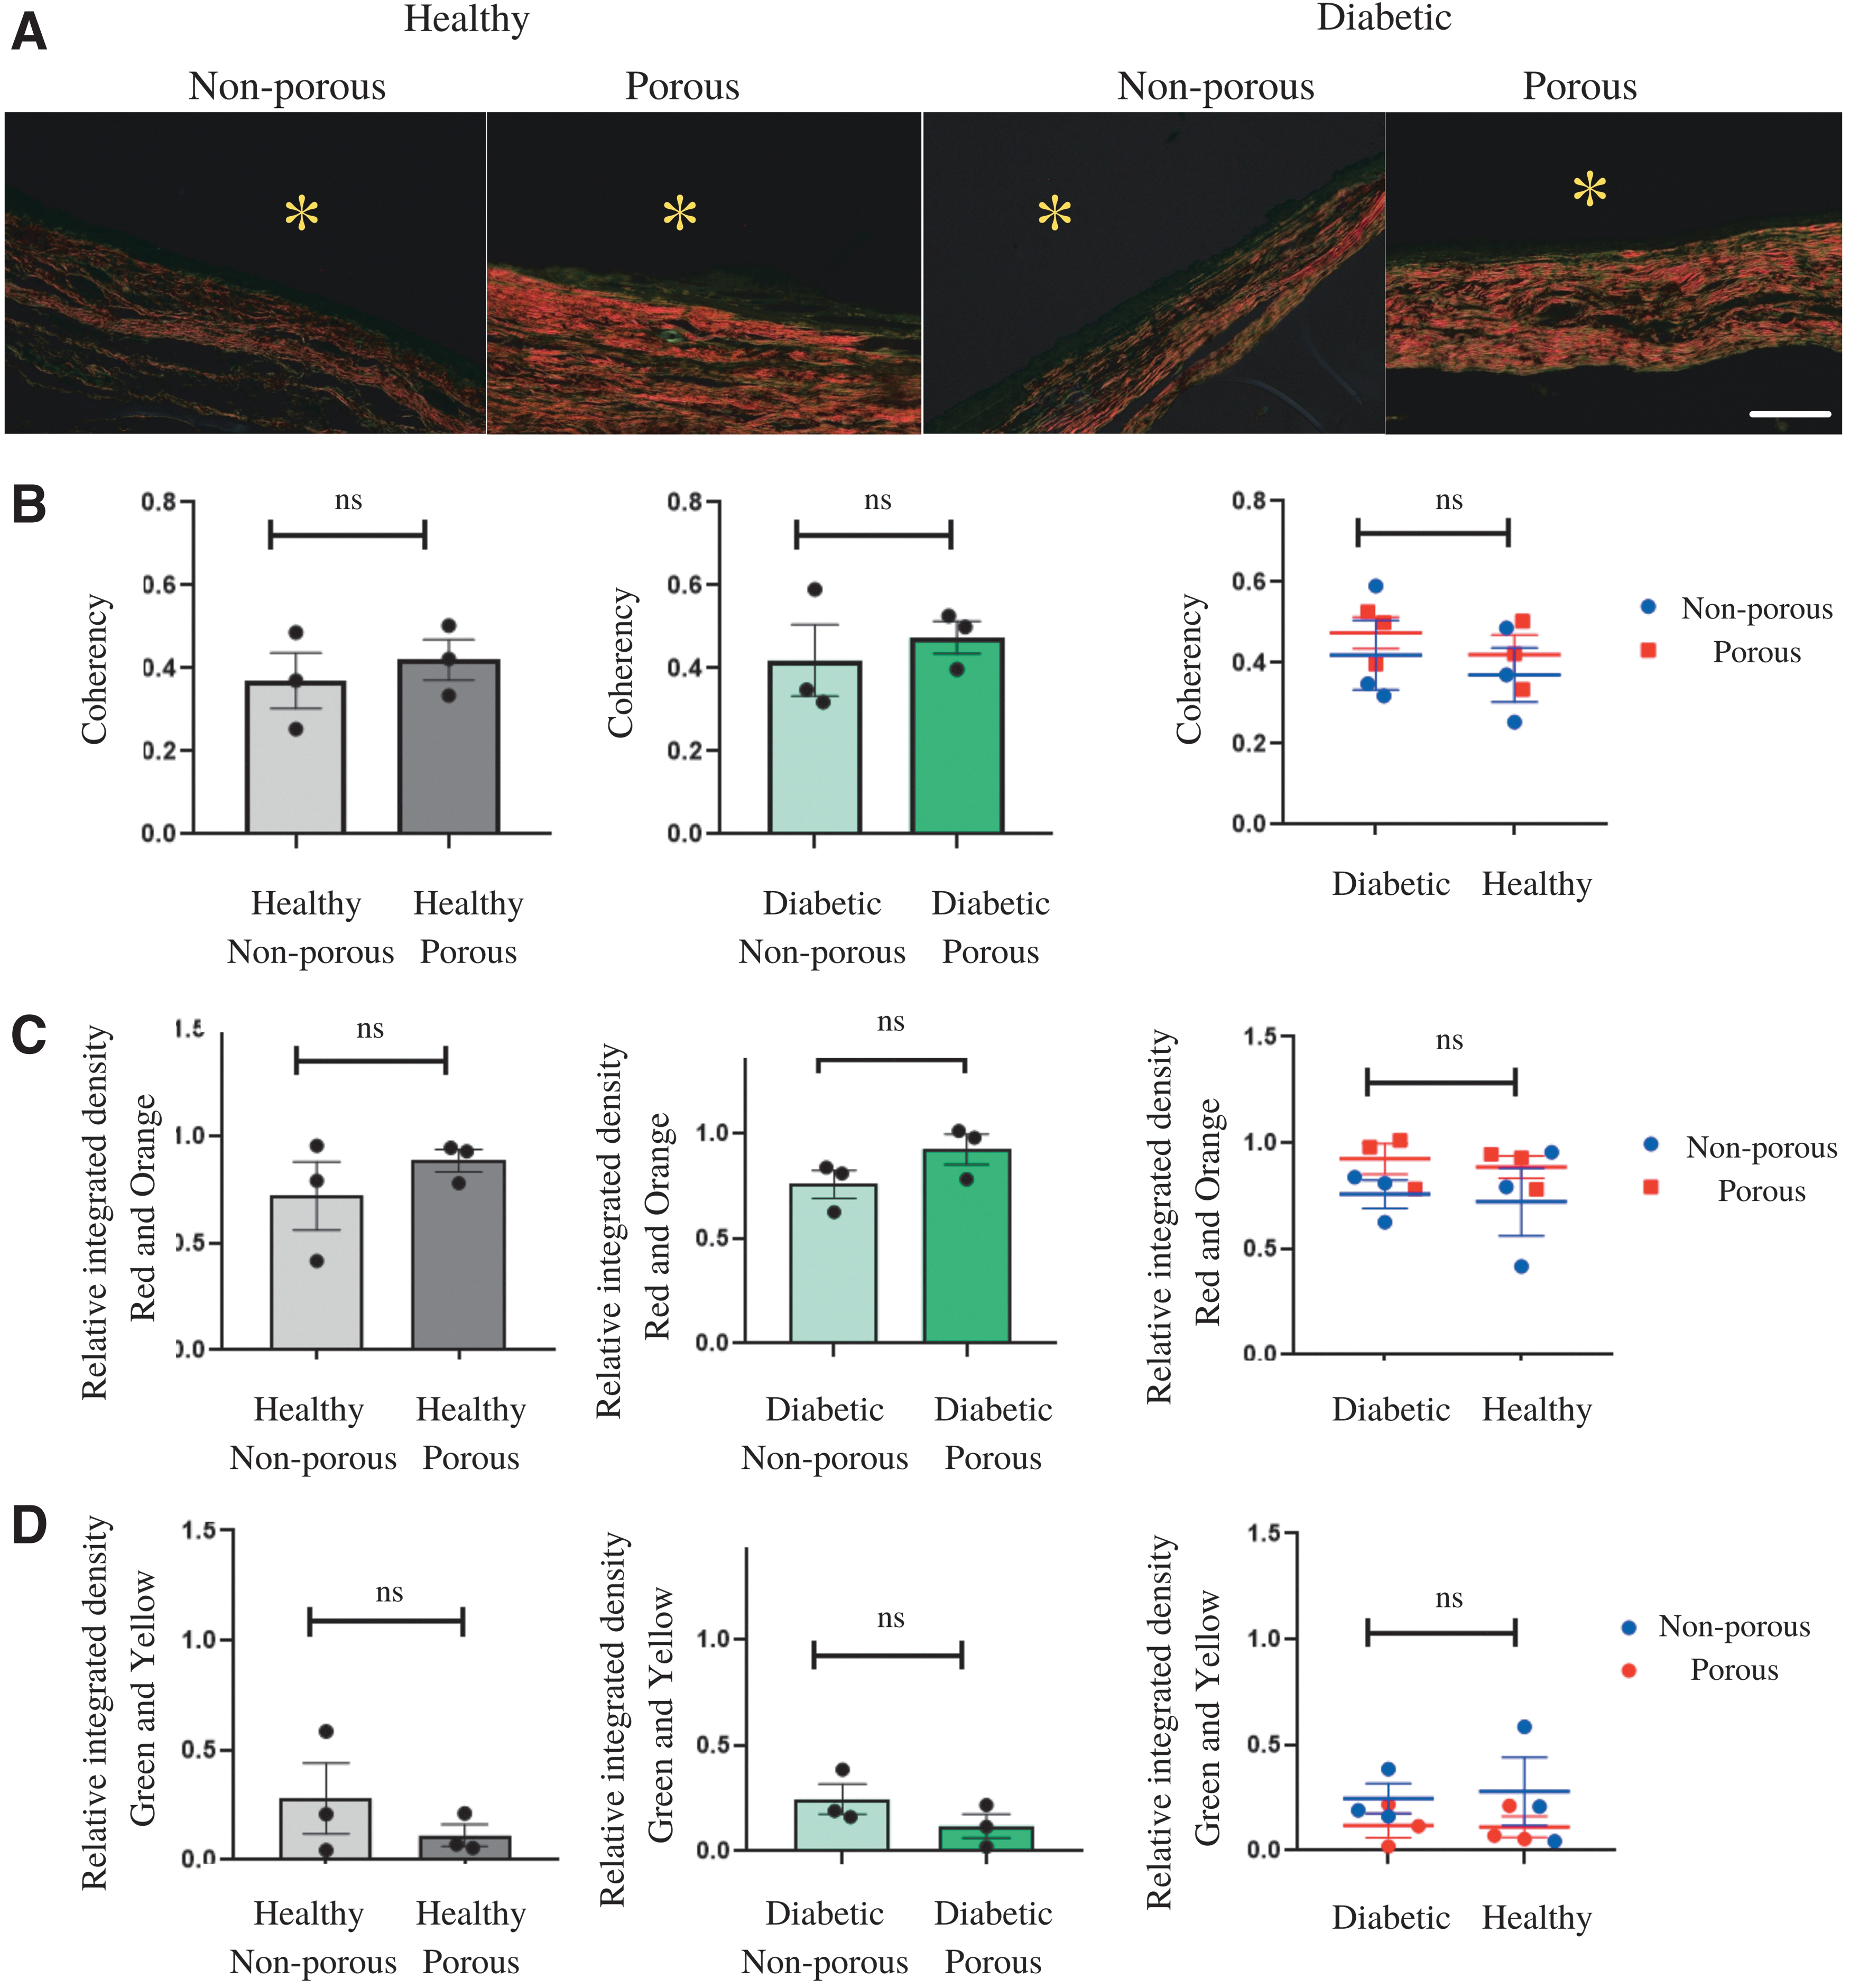
The overall coherency and collagen maturity was not affected by the diabetic state or porosity.
3D IF imaging of the fibrous tissue
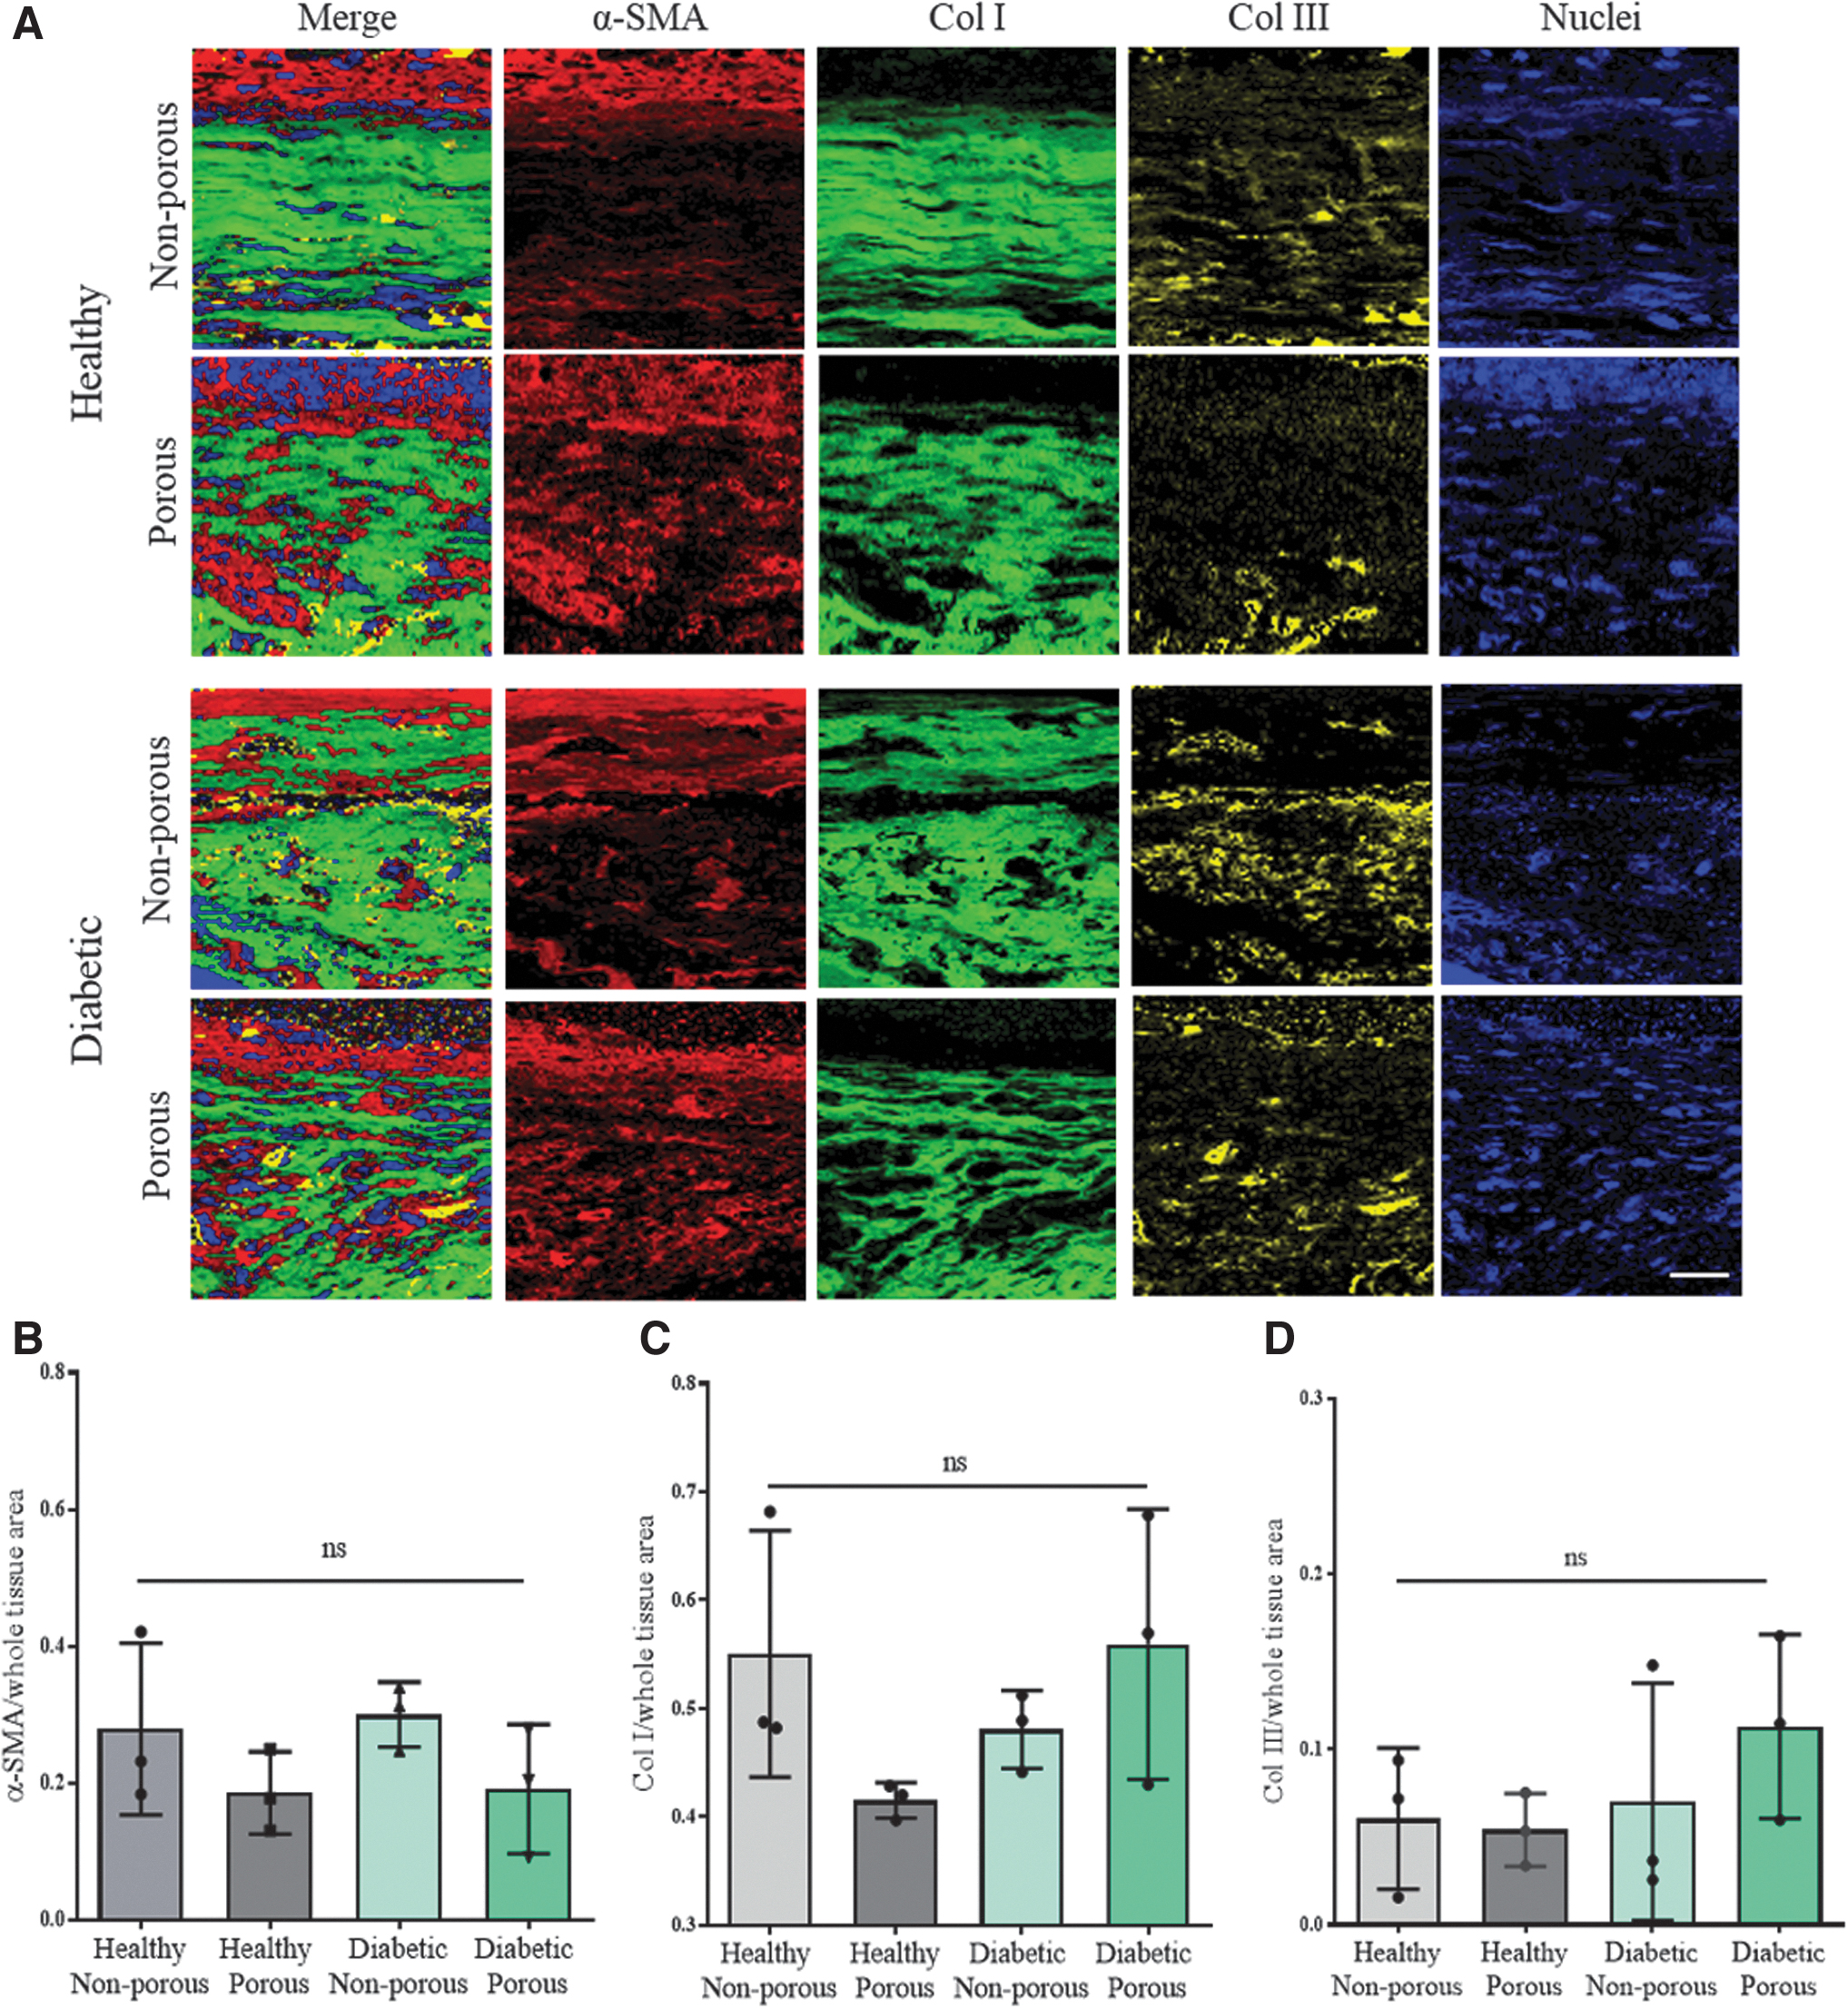
To investigate the extent of the fibrous capsule formation, the tissue sections with the porous and nonporous devices in healthy and diabetic sections were stained with Col I, Col III, and α-SMA (Fig. 5A), to examine ECM deposition and the presence of myofibroblasts, which play a vital role in ECM remodeling and fibrosis.46–48 Three-dimensional IF imaging was applied on the three biomarkers followed by image processing of the samples (Fig. 5B–D). The expression levels of α-SMA (p = 0.6965), Col I (p = 0.7335), and Col III (p = 0.8927) showed no significant differences between porous and nonporous samples and the diabetic state.

Three-dimensional immunofluorescence imaging demonstrated the structure of the fibrotic tissue and no expression level differences in the ECM components.
Raman imaging of the fibrotic capsule
ECM Raman reference spectra of α-SMA, Col I, and Col III were generated and validated on IF-stained sections and located in the tissue section by Raman imaging and TCA. The resulting color-coded intensity heat maps recapitulate the distribution patterns and expression levels of the α-SMA (red), Col I (green), and Col III (yellow) for each tissue (Fig. 6A). The morphology of the components shows no structural difference in porous and nonporous groups as well as diabetic and healthy groups. Image quantification demonstrated no significant changes in expression levels of α-SMA (p = 0.3216), Col I (p = 0.2230), and Col III (p = 0.4819) in the fibrotic capsule, which is consistent with the IF data (Fig. 6B–D).
Raman imaging and quantification showed no difference in the fibrotic capsules in diabetic and healthy animals and membrane porosity variations.
Principal component analysis
Single spectra were extracted from the Col I-positive heatmap regions and further analyzed by PCA with regard to assess submolecular spectral variations. The PC-3 versus PC-1 scores plot demonstrates a cluster formation between collagen structures signatures of healthy and diabetic rats (Fig. 7A). The data of the healthy group significantly shift to the positive PC-3 range compared with the diabetic group (Fig. 7B). Positive peaks in the loadings plot correspond to dominating spectral features found in data with positive PC-3 score values, whereas negative bands provide insight on spectral signatures of the data clustering in the negative score range (Fig. 7B, C). The corresponding PC-3 loadings plot explains the underlying molecular information indicated by peak shifts in the specific wavenumbers (Fig. 7D). The spectral differences were identified at several peak positions. Biological assignments of Raman spectrum are given (Supplementary Table S1). The peak amplitude levels that are relatively higher in the diabetic group than in the healthy group include the 1684 and 1277 cm−1 bands (Supplementary Fig. S1A, B), representing amide I and amide III, respectively. 49 Furthermore, peak positions at 1404, 1322, and 1004 cm−1 correspond to CH deformation, CH3CH2 twisting of collagen and phenylalanine. 50 Those findings correspond to conformational differences in Col I. The healthy groups showed an increase in these specific peaks compared with the diabetic groups. Of interest, increased peaks in the wavenumber ranging between 820 and 980 cm−1 might indicate the presence of advanced glycation end-products (AGEs), which were previously shown in diabetic or aging populations. 51 The features identified by RS discriminate the Col I composition between diabetic and healthy groups; however, within both groups no further differences were identified based on membrane porosity variations.
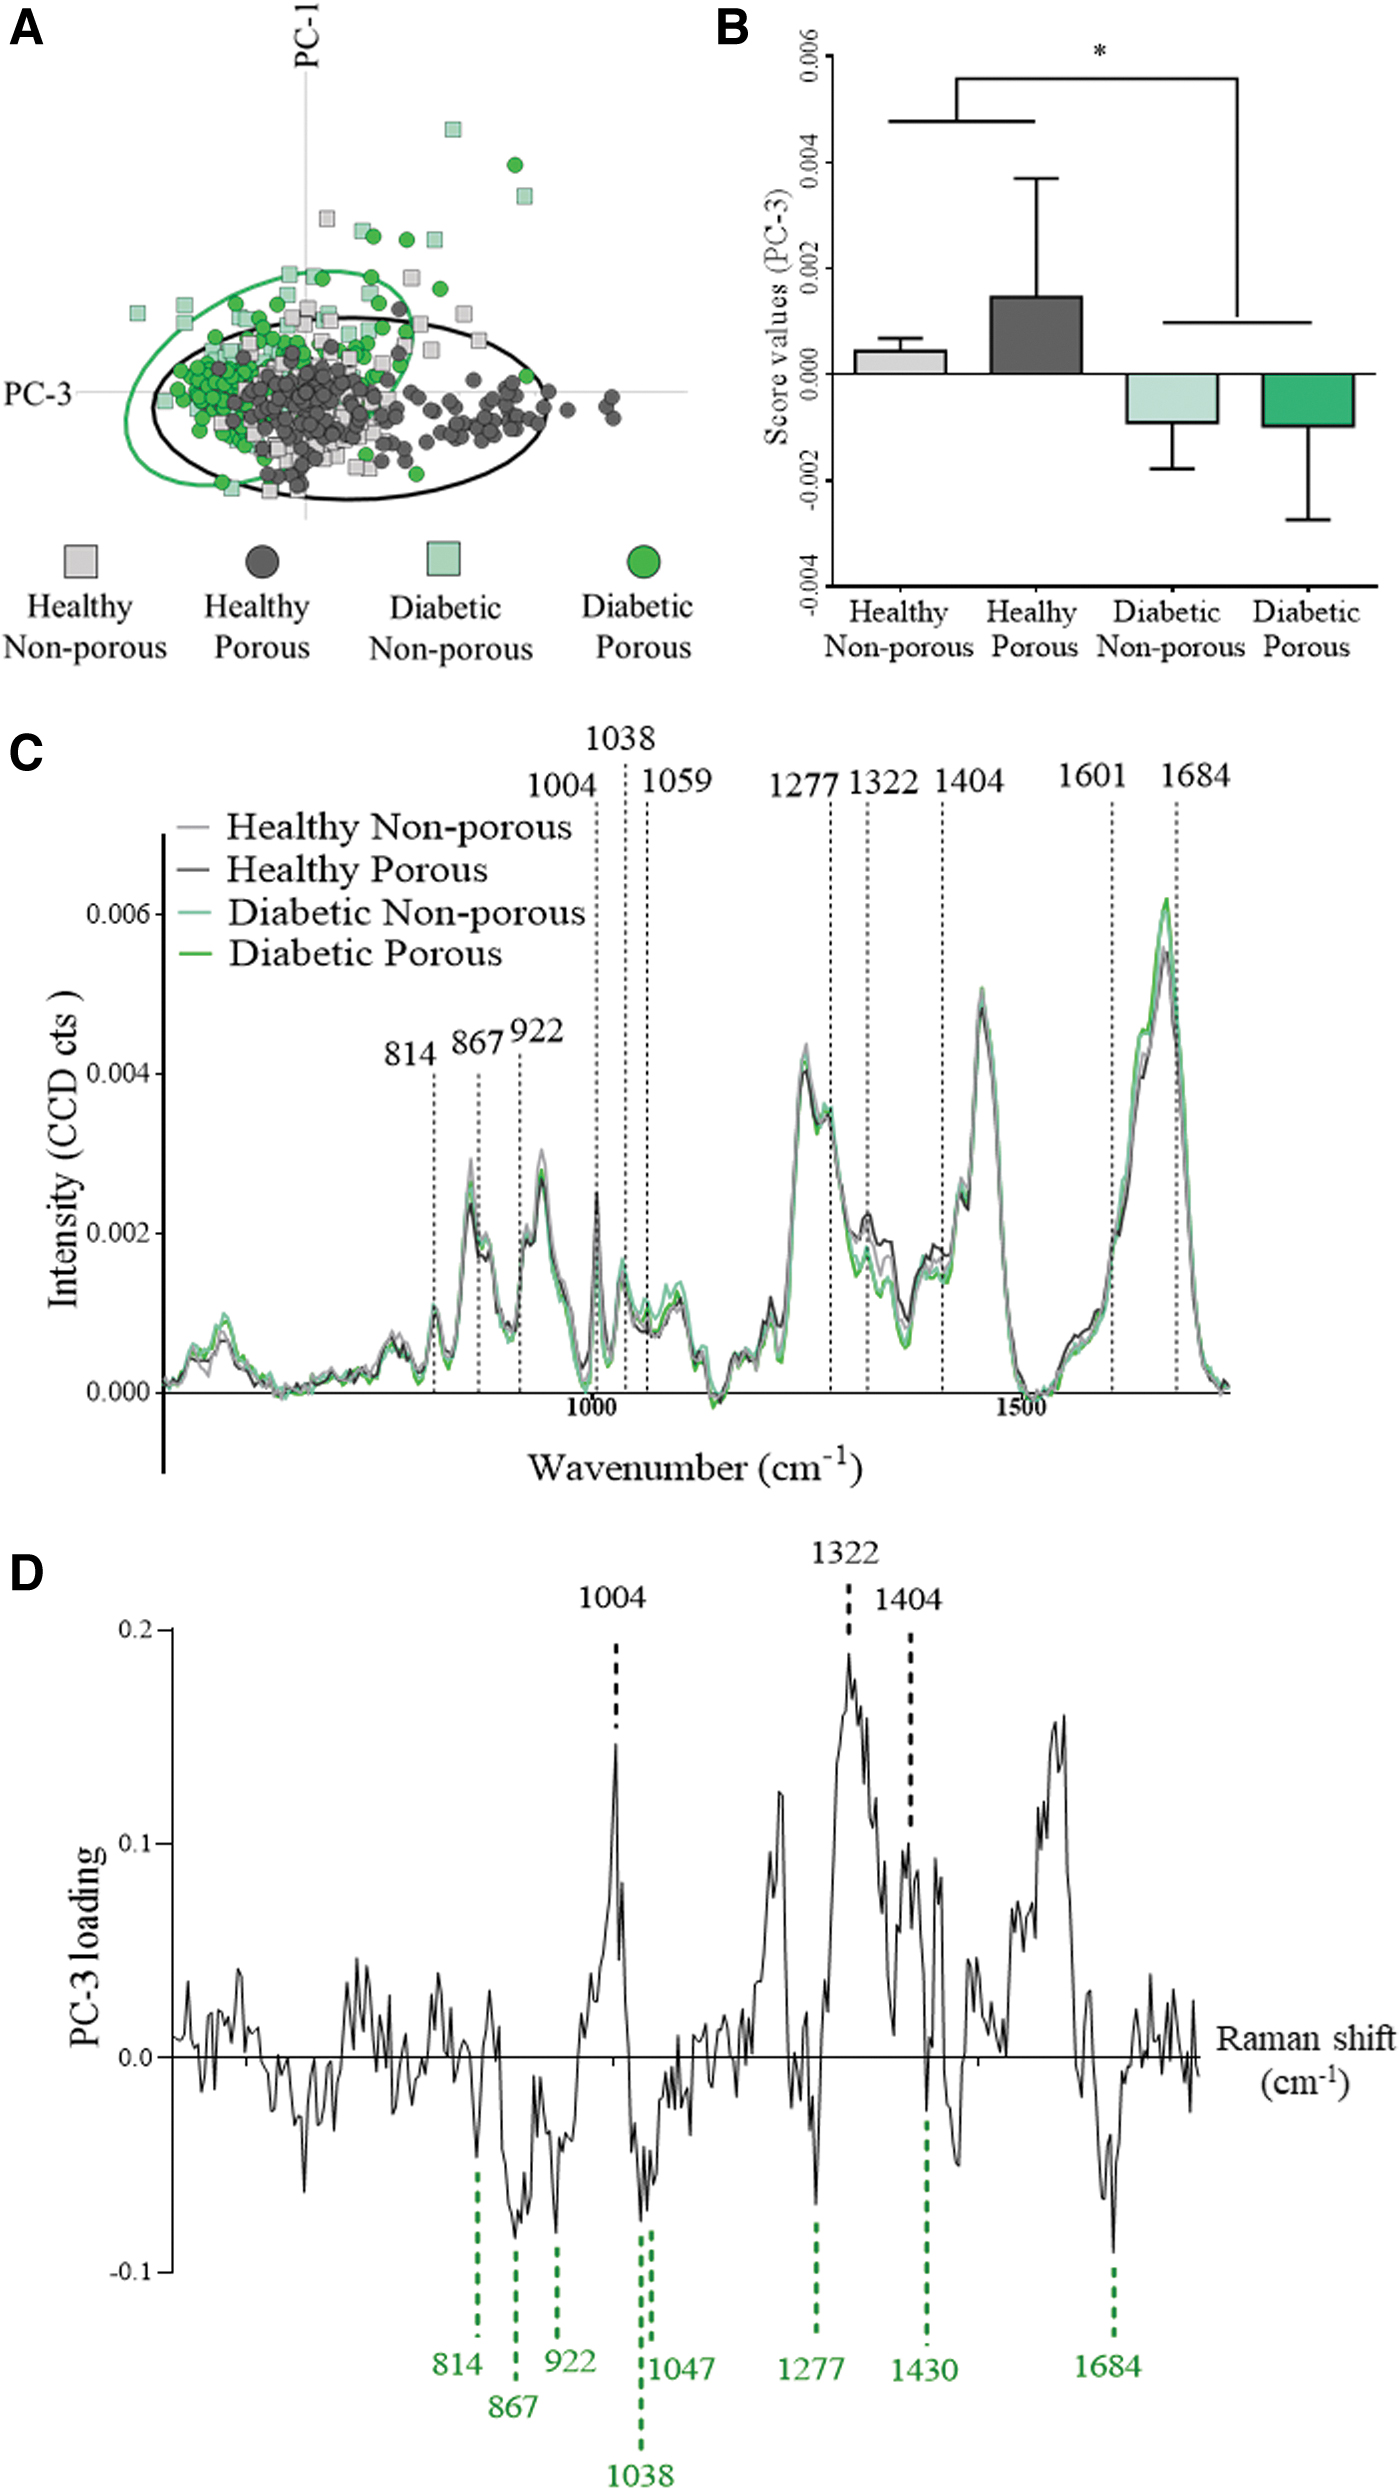
Multivariate data analysis of fibrotic capsule Col I spectra discriminates molecular features between healthy and diabetic rats.
Discussion
The presence of any foreign material in the body will elicit an immune response of varying degree depending on implantation site and properties of the material itself. 52 Understanding this response and employing suitable techniques to overcome the associated response is paramount to the success of any implantable device.
We assess our soft robotic drug delivery device in a diabetic rodent model. Previous studies have shown the potential of this device for sustained, repeated dosing 41 and reduction of fibrous capsule thickness using the drug delivery method itself, in healthy animals. 7 Mimicking the devices environment in preclinical studies is essential for its clinical translation. It has been documented for decades that the diabetic population suffer from immune system dysfunction.14,53–55 Prior studies revealed that diabetes reduces the FBR caused by the implant,56,57 including reduced collagen deposition, leukocyte infiltration, pathogen recognition, and cytokine production.58,59 In this study we have explored a range of biomarkers using several techniques to determine the FBR to our implantable device in a diabetic environment.
The size, shape, and roughness of implantable biomaterials play a pivotal role in the development of the FBR.60,61 Owing to the unusual shape of this device, the area of fibrotic capsule that is directly in contact with the membranous part of our device is of upmost importance. The entire DSR device is made out of a biocompatible material; however, the membranous region in the DSR device is also smooth and flat, designed as such for optimal drug delivery. We have shown fibrous capsule thickness, in this region, does not differ between healthy and diabetic animals. Understanding the capsular thickness surrounding an implantable medical device for drug delivery is critical. 9 Although μCT analysis allows nondestructive sampling of the fibrous capsule, traditional methods of histological sectioning and imaging (Fig. 2A) results in partial destruction of the capsular area. Therefore, determining the capsule thickness from histological sampling, in this instance, would not provide a reliable estimate, highlighting the importance of whole sample imaging by μCT in analyzing fibrous capsule thickness owing to its nondestructive nature.
Macrophages have been shown to play a pivotal role in the FBR. 17 No change in the ratio of CCR7-positive macrophages was observed between healthy and diabetic samples. Similarly, CD163-positive macrophages showed no changes across the groups. This confirms the incorporation of the device into a diabetic animal does not alter the host's macrophage immune response to the implant, which is consistent with the literature.62,63 Owing to the highly tuneable nature of our membrane fabrication methods, we were successful in creating pores 10 μm in diameter. Porous implants have been shown to modulate macrophage polarization in the past 42 ; however these pores were 15 times larger than the samples in this study, which would not be suitable as an immune-protective barrier required for repeated drug delivery dosing. The addition of pores in both disease states does not negatively impact the number of macrophages.
In-depth analysis of fibrotic capsule structures demonstrated high similarities of ECM structures between every group in this study. ECM remodeling and inflammatory response are highly correlated with myofibroblasts. One feature of myofibroblasts is the expression of α-SMA in well-aligned stress fibers. 64 α-SMA involves in myofibroblast maturity, focal adhesion, and scar contraction, although its role in modulating the functionality of myofibroblasts still requires further investigation. 46 The α-SMA expression levels were similar between all groups, indicating no significant additive effects on fibrotic capsule formation directed by membrane porosity or diabetes (Fig. 6B).
Col I and III are the main components of the fibrotic capsule, which were deposited by activated myofibroblasts and fibroblasts. 65 The distribution pattern of Col III in the fibrous tissues is unorganized and randomly distributed (Fig. 5A). It has been reported to show an increased expression in wound and scar tissue compared with normal skin tissue. 66 At the early stage of fibrosis, Col III is secreted dominantly in the fibrotic process and it is relevant to the regulation of the fibrillogenesis. 67 However, for the late stage, the abundant expression of dense Col I is then identified in the fibrous tissues. In addition to quantitative analysis and localization of the proteins, PCA was able to identify a significant separation between healthy and diabetic groups, indicating differences in Col I conformation referring to diabetes but only marginally to the porosity of the selected biomaterials (Fig. 7B). Differences in molecular composition could be assigned to the groups according to correlating peak positions (Fig. 7D). The observed conformational differences might be indicative for the presence of AGEs, which contributes to nonenzymatic glycation on proteins in various conditions such as aging and hyperglycemic environment. 51
High blood glucose levels in the body might result in glycation of plasma proteins and collagen, causing changes in their secondary structures. 68 AGEs can induce irreversible cross-linkage between collagen fibers, which might be its physical properties and functionality. 69 Altering peak positions in our study include 1684 cm−1 (amide I), 1404 cm−1 (CH deformation), 1322 cm−1 (CH3/CH2 twisting, collagen), 1306 cm−1 (CH3/CH2 twisting or bending mode of collagen), 1277 cm−1 (amide III), and 1004 cm−1 (Phenylalanine), which are highly related to secondary structure of proteins. Furthermore, peak positions ∼814, 867, 914, 1038, 1047, 1277, and 1430 cm−1, corresponding to specific AGEs such as pentosidine and glucosepane, were recognized in the collagen fibers signature of the diabetic group.70,71
Recently, RS was utilized to identify the characteristics of AGEs in an in vitro study, 72 showing the variability of the particular wavenumbers of AGEs at 1650–1690 cm−1 (amide I band), 1225 cm−1 (lipids), 1010 cm−1 (Tryptophan ring breathing), and 800–1000 cm−1 (proline/hydroxyproline). 50 These previous studies support our findings of the significant difference in the PCA.
An interesting question arises based on this phenomenon: Does the AGE-induced structural alteration of Col I affect the FBR caused by the subcutaneous implantation of the DSR device? High expression level of AGEs is commonly observed in diabetic patients. Beside the cross-linked AGEs integrated with proteins such as collagens or hemoglobin, there are also free AGEs in the blood, which are suspected to interrupt molecular function at cellular level by binding to the receptors for AGE (RAGEs).73,74 RAGEs activation induce the secretion of immunoregulatory cytokines and oxidative stress that are highly related to NF-κB signaling and NADPH oxidase and mitochondrial pathway.51,75 Based on our results, there is no significant difference in the thickness of the fibrotic capsule, collagen coherency, as well as the ECM and macrophages composition in the different disease states. Furthermore, no studies have directly shown the cross-linkage of AGEs with Col I and those signaling receptors would affect the physical properties of the fibrotic capsule caused by the implants.
In this study, we used several approaches to demonstrate a well-rounded understanding of the diabetic impact on the FBR to our devices, which is comparable with other studies. 7 Moreover, the potential of RS to provide additional insights on the molecular difference across groups has also been highlighted. A main limitation of this study is the single time-point taken at day 14. Although numerous studies report 14 days as being a suitable time point for monitoring the FBR to implanted material,60,61,76 it is important to determine the immunological engagement over longer time periods. Future studies will investigate the responses to longer term implantations to determine if a change in overall response is present. However, we have shown no change in macrophage content, collagen organization, and maturity and ECM expressions within 14 days. These findings allow us to conclude that diabetes did not influence the FBR to our implantable device.
Footnotes
Acknowledgments
The authors acknowledge the support of the Centre of Microscopy and Imaging, NUI Galway, Senior Technical Officers Mark Canney, Dave Connolly and Emma McDermott.
Disclosure Statement
No competing financial interests exist.
Funding Information
K.S.-L., G.P.D., and C.L. acknowledge funding from the DELIVER project which has received funding from the European Union's Horizon 2020 framework programme under grant agreement ID 812865. G.P.D. and R.E.L. acknowledge funding from the DRIVE project, which received funding from the European Union's Horizon 2020 framework programme under grant agreement ID 645991. R.B. and G.P.D. acknowledge funding from Science Foundation Ireland's (SFI) AMBER centre through their PhD program with grant number SFI/12/RC/2278. R.B. would like to acknowledge funding from the College of Medicine, Nursing and Health Sciences (CMNHS), NUI Galway under a co-funded PhD program with grant number RSF1591. K.S.-L. and C.L. would like to acknowledge funding from the Deutsche Forschungsgemeinschaft, under grant number INST 2388/64-1, Germany's Excellence Strategy, under grant number EXC 2180-390900677, the Ministry of Science, Research, and the Arts of Baden-Wuerttemberg, under grant number 33-729.55-3/214 and SI-BW 01222-91, and the State Ministry of Baden-Wuerttemberg for Economic Affairs, Labour and Housing Construction.
References
Supplementary Material
Please find the following supplemental material available below.
For Open Access articles published under a Creative Commons License, all supplemental material carries the same license as the article it is associated with.
For non-Open Access articles published, all supplemental material carries a non-exclusive license, and permission requests for re-use of supplemental material or any part of supplemental material shall be sent directly to the copyright owner as specified in the copyright notice associated with the article.