
Abstract
Drugs are often removed from clinical trials or market progression owing to their unforeseen effects on cardiac action potential and calcium handling. Induced pluripotent stem cell-derived cardiomyocytes and tissues fabricated from these cells are promising as screening tools for early identification of these potential cardiac liabilities. In this study, we describe an automated, open-source MATLAB-based analysis software for calculating cardiac action potentials and calcium transients from fluorescent reporters. We first identified the most robust manner in which to automatically identify the initiation point for action potentials and calcium transients in a user-independent manner, and used this approach to quantify the duration and morphology of these signals. We then demonstrate the software by assessing changes to action potentials and calcium transients in our micro-heart muscles after exposure to hydroxychloroquine, an antimalarial drug with known cardiac liability. Consistent with clinical observations, our system predicted mild action potential prolongation. However, we also observed marked calcium transient suppression, highlighting the advantage of testing multiple physiologic readouts in cardiomyocytes rather than relying on heterologous overexpression of single channels such as the human ether-a-go-go-related gene channel. This open-source software can serve as a useful, high-throughput tool for analyzing cardiomyocyte physiology from fluorescence imaging.
Impact statement
This article describes an open-source code that will allow researchers to assess changes in cardiac action potentials and calcium transients from fluorescent reporters in a fully automated manner. Automated analysis will allow researchers to increase the throughput of their experiments and grant greater insight into cardiac electrophysiology. Here, the usefulness of these pipelines is demonstrated through analysis of the effects of hydroxychloroquine.
Introduction
Drug-induced proarrhythmia is one of the most common reasons for drugs to fail in late-stage clinical trials or be pulled from the market. 1 As such, developing in vitro tools for identifying cardiotoxic effects of new drugs can remove those that will introduce pathophysiology from the pipeline.2,3 Owing to its key role in repolarization, and the frequency with which it is involved in arrhythmia as a side effect, the potassium channel encoded by the human ether-a-go-go-related gene (hERG) is the most frequent target investigated in screening new drugs for potential pro-arrhythmia. This is traditionally carried out in vitro by overexpressing the gene in human embryonic kidney or Chinese hamster ovary cells,4,5 which lack the full complement of ion channels present in human cardiomyocytes. Previous studies have sought to remedy this with induced pluripotent stem cell-derived cardiomyocytes (iPSC-CM), but these are often performed with patch clamp or microelectrode array analysis 2 that limit the throughput of testing to single cells or embryoid bodies at a time.
Here, we propose the use of fluorescent video microscopy in conjunction with an automated analysis system for increased throughput of action potential and calcium testing on our previously described micro-heart muscles (μHM).6,7 The system was validated against manual calculation methods. The open-source code can be used to increase throughput of future studies and identify cardiotoxic drugs for removal.
To demonstrate the utility of these pipelines in assessing drug-induced changes in voltage and calcium handling that would be unlikely to be captured in artificial hERG overexpression systems, we applied our analysis pipeline to μHM treated with hydroxychloroquine (HCQ), an antimalarial drug that drew interest as a potential therapeutic for the symptoms of severe acute respiratory syndrome coronavirus 2 before vaccines against the virus were available.8–11 HCQ is known to cause QT interval prolongation,12–16 potentially through the fast delayed rectifier potassium channel IKr (produced by the protein encoded by the hERG gene). 10 However, other studies have identified multichannel effects, including blocking of Ca2+ channels,9,16 meaning our μHM tissue and video analysis systems could be used to predict the broad channel alterations in HCQ-induced cardiac electrophysiology.
Methods
Induced pluripotent stem cell-derived cardiomyocytes
Studies were conducted using wild-type C (WTC)-induced pluripotent stem cells (iPSC) derived from a healthy 30-year-old man with a normal electrocardiogram and no known family history of heart disease (Coriell Repository GM25256). WTC cells were previously modified to harbor a GCaMP6f knocked into the first exon of the AAVS1 “safe harbor” locus, where expression is driven by CAG, a strong synthetic promoter. GCaMP6f, a genetically encoded calcium indicator, allows for noninvasive, chronic tracking of calcium transients in resultant cardiomyocytes derived from these WTC iPSCs. 17 The cells were then differentiated into cardiomyocytes and subsequently purified as previously described by modulating the Wnt signaling pathway with small molecules.7,18
In brief, iPSCs were passaged at least three times in Essential 8 pluripotency medium (Thermo Fisher Scientific) on a layer of Matrigel (Corning Inc., Corning, NY) basement membrane and kept at under 80% confluency. Then, iPSCs were passaged once again to a seeding density of 37,500 cells/cm2. Three days later, differentiation was induced. This timepoint was denoted as “differentiation day 0.” On day 0, media was changed to RPMI-1640 (Gibco) containing 2% B27 supplement without insulin and 150 μg/mL
By day 15, wells with beating cells were incubated with 0.25% Trypsin EDTA (Thermo Fisher Scientific) for 5–10 min at 37°C before gently triturating to detach and singularize the cells. They were then collected in knockout Dulbecco's modified Eagle medium (Gibco) with 20% fetal bovine serum (Gibco)—embryoid body 20 medium (EB20)—with 150 μg/mL
μHM formation
The μHM were made in the shape of dogbones by following previously described protocols.6,7 In brief, dogbone-shaped through-holes were made within 1 mm thick polydimethylsulfoxane membranes. The dogbone shape consists of 1 × 1 mm knobs on either end connected by a 1 × 0.5 mm shaft. These stencils were adsorbed to the surface of a plasma-treated tissue culture plate by evaporating away methanol. The stencils were then sterilized by soaking in the wells with 70% sterile ethanol. The plates were allowed to soak overnight before removing the ethanol and storing with sterile Dulbecco's phosphate buffered saline in the wells until ready to use, no longer than 1 week.
The day before tissue preparation, stencils were seeded with a solution of 20 μg/mL fibronectin and allowed to sit overnight. On the day of tissue preparation, at least 2 days after the previous replate to allow for recovery and by day 25, purified cardiomyocytes were detached again with 0.25% trypsin. The cells were neutralized in EB20 with 150 μg/mL
Video capture
The night before imaging, tissues were incubated at 37°C in RPMI-c with 150 μg/mL
For paced tissues, we achieved 1 Hz field pacing with the Myo-Pacer EP instrument (IonOptics, Westwood, MA). Two electrodes were placed in the well containing the tissue to allow the desired voltage to course through the tissues. We used 30 V, 20 ms bipolar pulse trains and began video capture once the tissues had caught the pacing as evidenced by increased beating of the tissues. Similarly, action potential voltage was recorded first with the help of BeRST-1 dye in the paced tissue, then calcium transient immediately after with the help of GCaMP6f signal.
Data analysis
After obtaining the high-frame rate videos, analysis was completed with custom open-source MATLAB software. First, the mean fluorescence intensity over the entire tissue was obtained at each timeframe (Fig. 1A). Next, the one-dimensional waveform was placed through a 3-point median filter (Fig. 1B) that smoothens the noisy data without significantly affecting shape or peaks. The data were then corrected for background, which is typically dominated by photobleaching. Within the background-corrected waveforms (Fig. 1C), individual waveform cycles were identified by first thresholding all local maxima >60% of the maximum amplitude and all local minima <40% of the maximum amplitude (Fig. 1D). The local maxima and minima were found using the findpeaks function from the MATLAB Signal Processing Toolbox. The maxima and minima were sorted into a single array. Further processing on the extrema removed all but the largest adjacent maxima and the smallest adjacent minima.

Methodology of data processing.
This resulted in the maxima as the peaks of the waveforms and the minima as the lowest points between waveforms (Fig. 1E). Figure 1H provides a zoom on a peak with all the local maxima identified by the software—clearly all are not the true peak of the waveform. Figure 1I provides the same peak after the local maxima are removed, such that the only maxima that remains is the true peak. We note that we could have achieved a similar result by using a more rigorous threshold for determining the peak amplitude required for action potential waveform peak detection.
However, this would prevent the algorithm from detecting beat-to-beat abnormalities in voltage and/or calcium amplitude, as would occur in alternans or with early after depolarizations—in such cases it would only detect the waveforms with higher amplitude. Finally, to remove partial waveforms, if the first and/or last extrema was a maxima, it was removed such that the first and last extrema were minima. Each waveform was then cropped at the nearest minima before and after the waveform peak (Fig. 1F, G). The cropped waveforms were then individually analyzed to gather the desired data.
Because of our ultimate goal of automated, unbiased analysis of tissue electrophysiology, we examined several methods previously described in the literature17,20–23 for automatically identifying the initiation point of action potentials and calcium transients: maximum first derivative, maximum second derivative, or 15%, 20%, or 25% of the maximum amplitude. For action potential, we also identified upstroke duration (UPD), the time from the start of the action potential to action potential peak as well as action potential duration (APD) to 70%, 50%, or 10% of the maximum amplitude (APD30, APD50, and APD90; Fig. 2A). Similarly, the calcium transient analysis software measures the change in GCaMP6f, to report maximum calcium amplitude; calcium rise time, the time from the start of calcium intake to maximum calcium signal; and calcium decay 30, 50, and 75 (τ30, τ50, and τ75), the times from the maximum calcium signal to 70%, 50%, and 25%, respectively, of that maximum.
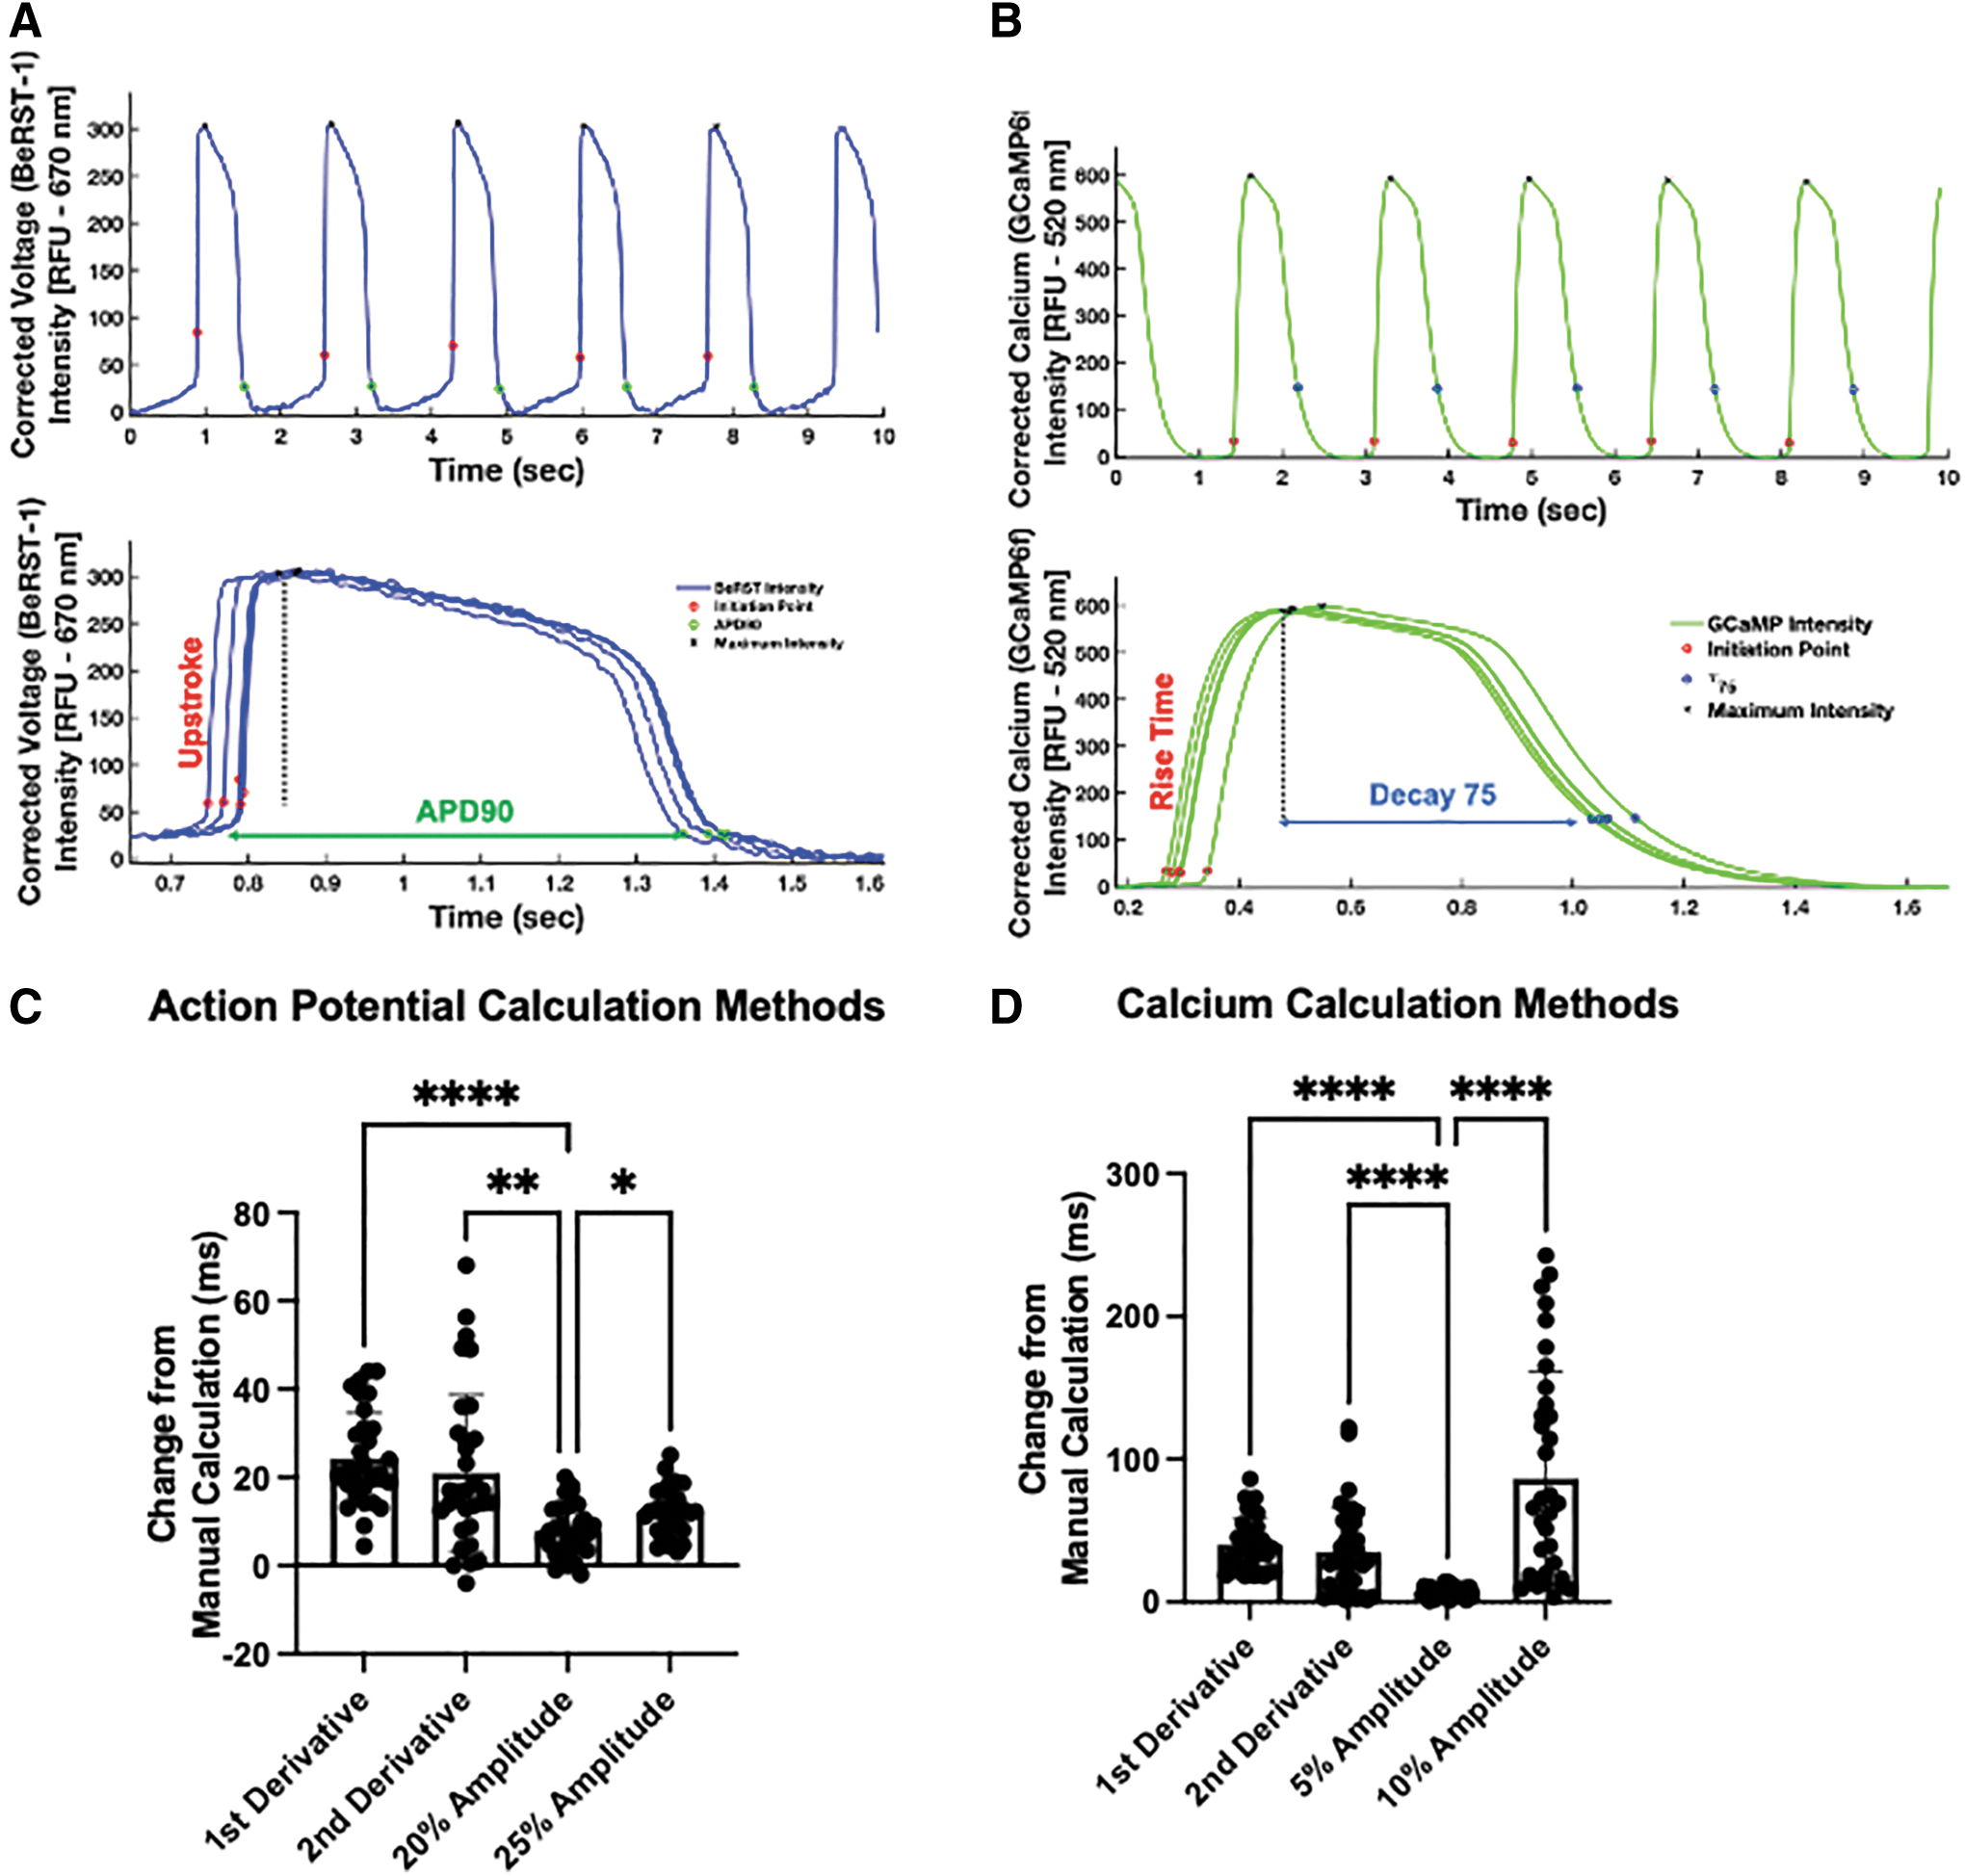
Automated calculation of cardiac electrophysiology.
Finally, we identified total calcium flux, an integration of the signal from upstroke initiation to τ75 (Fig. 2B). Each of these durations can provide insight into the ion channels affected and where interventions should be made. Then, to account for variations in beat rate, we compared different beat rate correction methods to ensure that effects of drug administration would not be hidden. These methods include Fridericia, Sagie/Framingham, Bazett, and an iPSC-specific correction, 24 as given in Table 1. Our analysis of these different correction methods (Fig. 4D) showed little overall difference and no difference in whether HCQ administration affected UPD or APD. Thus, we proceeded with Fridericia correction for the rest of these studies.

Effects on spontaneous cardiac electrophysiology become more pronounced from longer HCQ exposure. Representative overlays of spontaneous action potentials after acute
Beat Rate Correction Methods
iPSC, induced pluripotent stem cell.
The data for all the analyzed traces were then automatically compiled and exported into a single Excel sheet. The resulting open-source MATLAB codes for waveform analysis and data handling are available for download at
Drug testing
HCQ sulfate (Sigma) was dissolved in sterile, deionized water to a concentration of 300 μM, 1000 × the targeted final concentration. This was then diluted to a 10 × solution in RPMI-c with 150 μg/mL AA, 4 μg/mL vitamin B12, and 3.2 μg/mL penicillin for a final concentration of 3 μM HCQ sulfate. After measuring baseline, a 10% media change was carried out: 50 μL of media was removed and replaced with either the 10 × HCQ media for HCQ or normal RPMI-c media for vehicle conditions such that final concentration of HCQ in media was 0.3 μM. Tissues were then allowed to incubate at 37°C for an hour before taking acute measurements. Chronic measurements were started at a minimum of 20 h later, but no more than 24 h.
Statistics
GraphPad Prism 9.1.1 was used for statistical analysis. Outliers from data set were removed using the built-in Robust regression and Outlier removal (ROUT) function provided with outlier removal coefficient Q set to 1%. After outlier removal, a minimum of 11 videos, each from a different tissue, were included for analysis for each condition. For comparisons between two groups, we used an unpaired t-test to determine significance. For comparisons between more than two groups, we used one-way analysis of variance tests with subsequent multiple comparisons of data sets. A value of p < 0.05 was considered significant.
Results
Automation of video analysis
After formation of μHM, the tissues were allowed to compact for at least 5 days before beginning drug testing. At this time point, the tissues were still found to spontaneously contract. Before testing, 1 μM BeRST-1 dye was added and allowed to permeate the tissues for at least 1 h and up to overnight to allow for voltage imaging of the tissues. Videos were then captured and processed with a custom-made, MATLAB-based software capable of identifying individual waveforms, upstroke initiation points, signal peaks, and decays for both action potential and calcium transients, as given in Figure 2A and B, respectively. The initiation of action potential and calcium waveforms have been calculated by others by obtaining the maximum rate of change of fluorescence (first derivative), maximum change in concavity of fluorescence (second derivative) or a chosen percentage of the maximum fluorescence above the baseline in each waveform (amplitude).20,21
We measured both the accuracy and precision of different methods of automatically identifying the upstroke initiation in voltage and calcium analysis by comparing points identified as initiation points against those that were manually chosen by visual assessment of the point in each waveform that appeared to be the start of rapid depolarization (action potentials) or rapid rise of the transient (calcium). We analyzed representative waveforms from each of the 35 videos for 35 points of comparison across each of the identification methods.
We found that amplitude-based methods were more robust than derivative-based methods in terms of automated identification of action potential or calcium transient initiation. These methods had an overall lower change in terms of the time identified by the algorithm versus the time identified manually, and lower standard deviation of each data set, as given in Figure 2C and D, respectively. We found 20% and 5% to be the percentages with the least amount of difference from the manual calculations for action potential and calcium handling, respectively, and used these methods for subsequent studies on HCQ-treated μHM.
Effects of HCQ on spontaneously beating μHM
After tissue formation and labeling with BeRST-1, tissues were accordingly exposed to either HCQ or vehicle for 1 h (acute) or 24 h (chronic) before measurements were taken. Analysis completed with our custom software showed that the spontaneous beat rate of the tissues did not significantly change when exposed to HCQ, neither acutely (Fig. 3A) nor chronically (Fig. 3B), compared with vehicle. In addition, beat rate decreases slightly from acute administration of HCQ as compared with baseline, but is not significantly affected by chronic HCQ administration (data not shown). We attribute the acute change as owing to a full media change for the tissue, as previous work has shown that the DMSO vehicle should not affect beat rate. 25 An example of μHM is given in Figure 3C under brightfield imaging. Stills from representative videos (Supplementary Videos S1 and S2) show fluorescence in the Cy5 channel in response to voltage changes (Fig. 3D) and in the green fluorescent protein channel in response to changes in cytoplasmic Ca2+ concentration (Fig. 3E).

Hydroxychloroquine exposure does not alter μHM spontaneous beat rate. Spontaneous beat rate of these tissues did not change significantly after acute
HCQ increases μHM APD
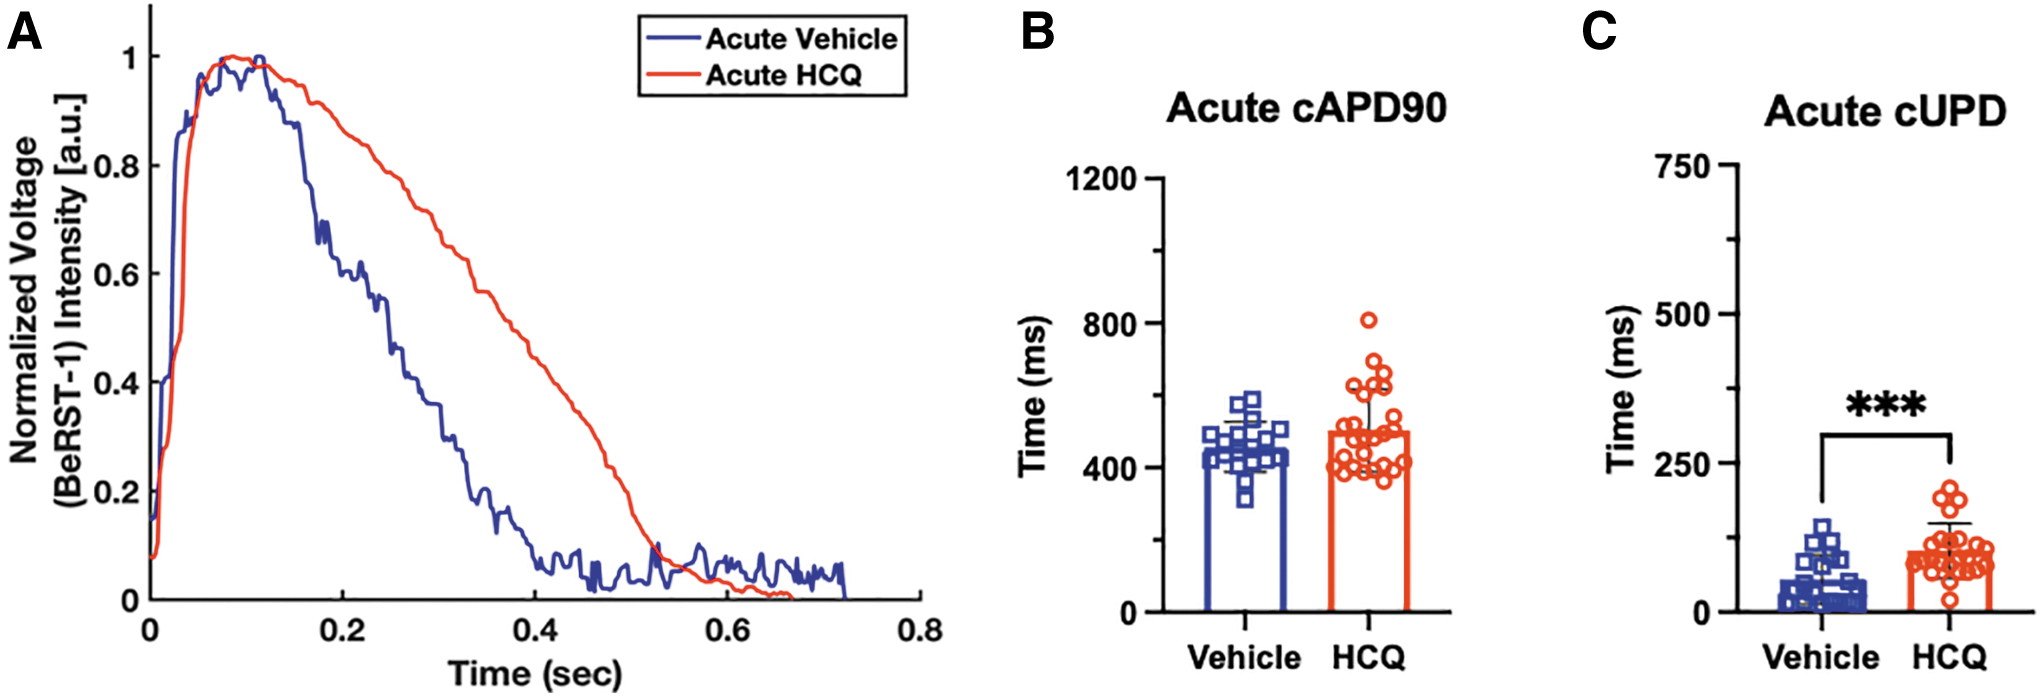
We analyzed a set of action potential parameters, namely UPD and APD, as proxies for the clinically relevant QR and QT intervals, respectively. 22 Without pacing (Fig. 4A), μHMs exposed acutely to HCQ exhibited no significant increase in beat rate-corrected APD90 (cAPD90) compared with vehicle (Fig. 4B). Alternatively, the beat rate-corrected upstroke duration (cUPD) for HCQ-treated tissues is significantly longer than that of untreated tissues after 1 h of treatment (Fig. 4C). Of importance, a significant difference in UPD was observed without frame rate correction, and all beat rate correction methods except the Sagie/Framingham approach yielded very similar results for cUPD (Fig 4D). This is likely because the spontaneous beat rate for these cells is close to 1Hz (Fig. 3A), such that the magnitude of the correction for the RR interval, the time between two successive R waves of a QRS complex, is very small. The Sagie/Framingham approach, which involves a subtraction step (Table 1) is likely only to be useful for APD correction given how short the UPD is.
Because almost all correction methods yielded similar data, we used the Fredericia correction method for the rest of spontaneous beating studies. Likewise, because of potential inconsistencies introduced by beat rate correction, we also performed studies on HCQ exposure using field pacing to provide absolute control over beat rate. Under 1Hz pacing, representative traces are given in Figure 5A, similar trends are mostly seen, tissues exposed acutely to HCQ trended toward longer cAPD90s than control tissues (Fig. 5B) and also showed increases in cUPD (Fig. 5C).
Effects on paced cardiac electrophysiology are different from spontaneous electrophysiology. Representative overlays of paced action potentials after acute HCQ exposure
Calcium effects of HCQ treatment
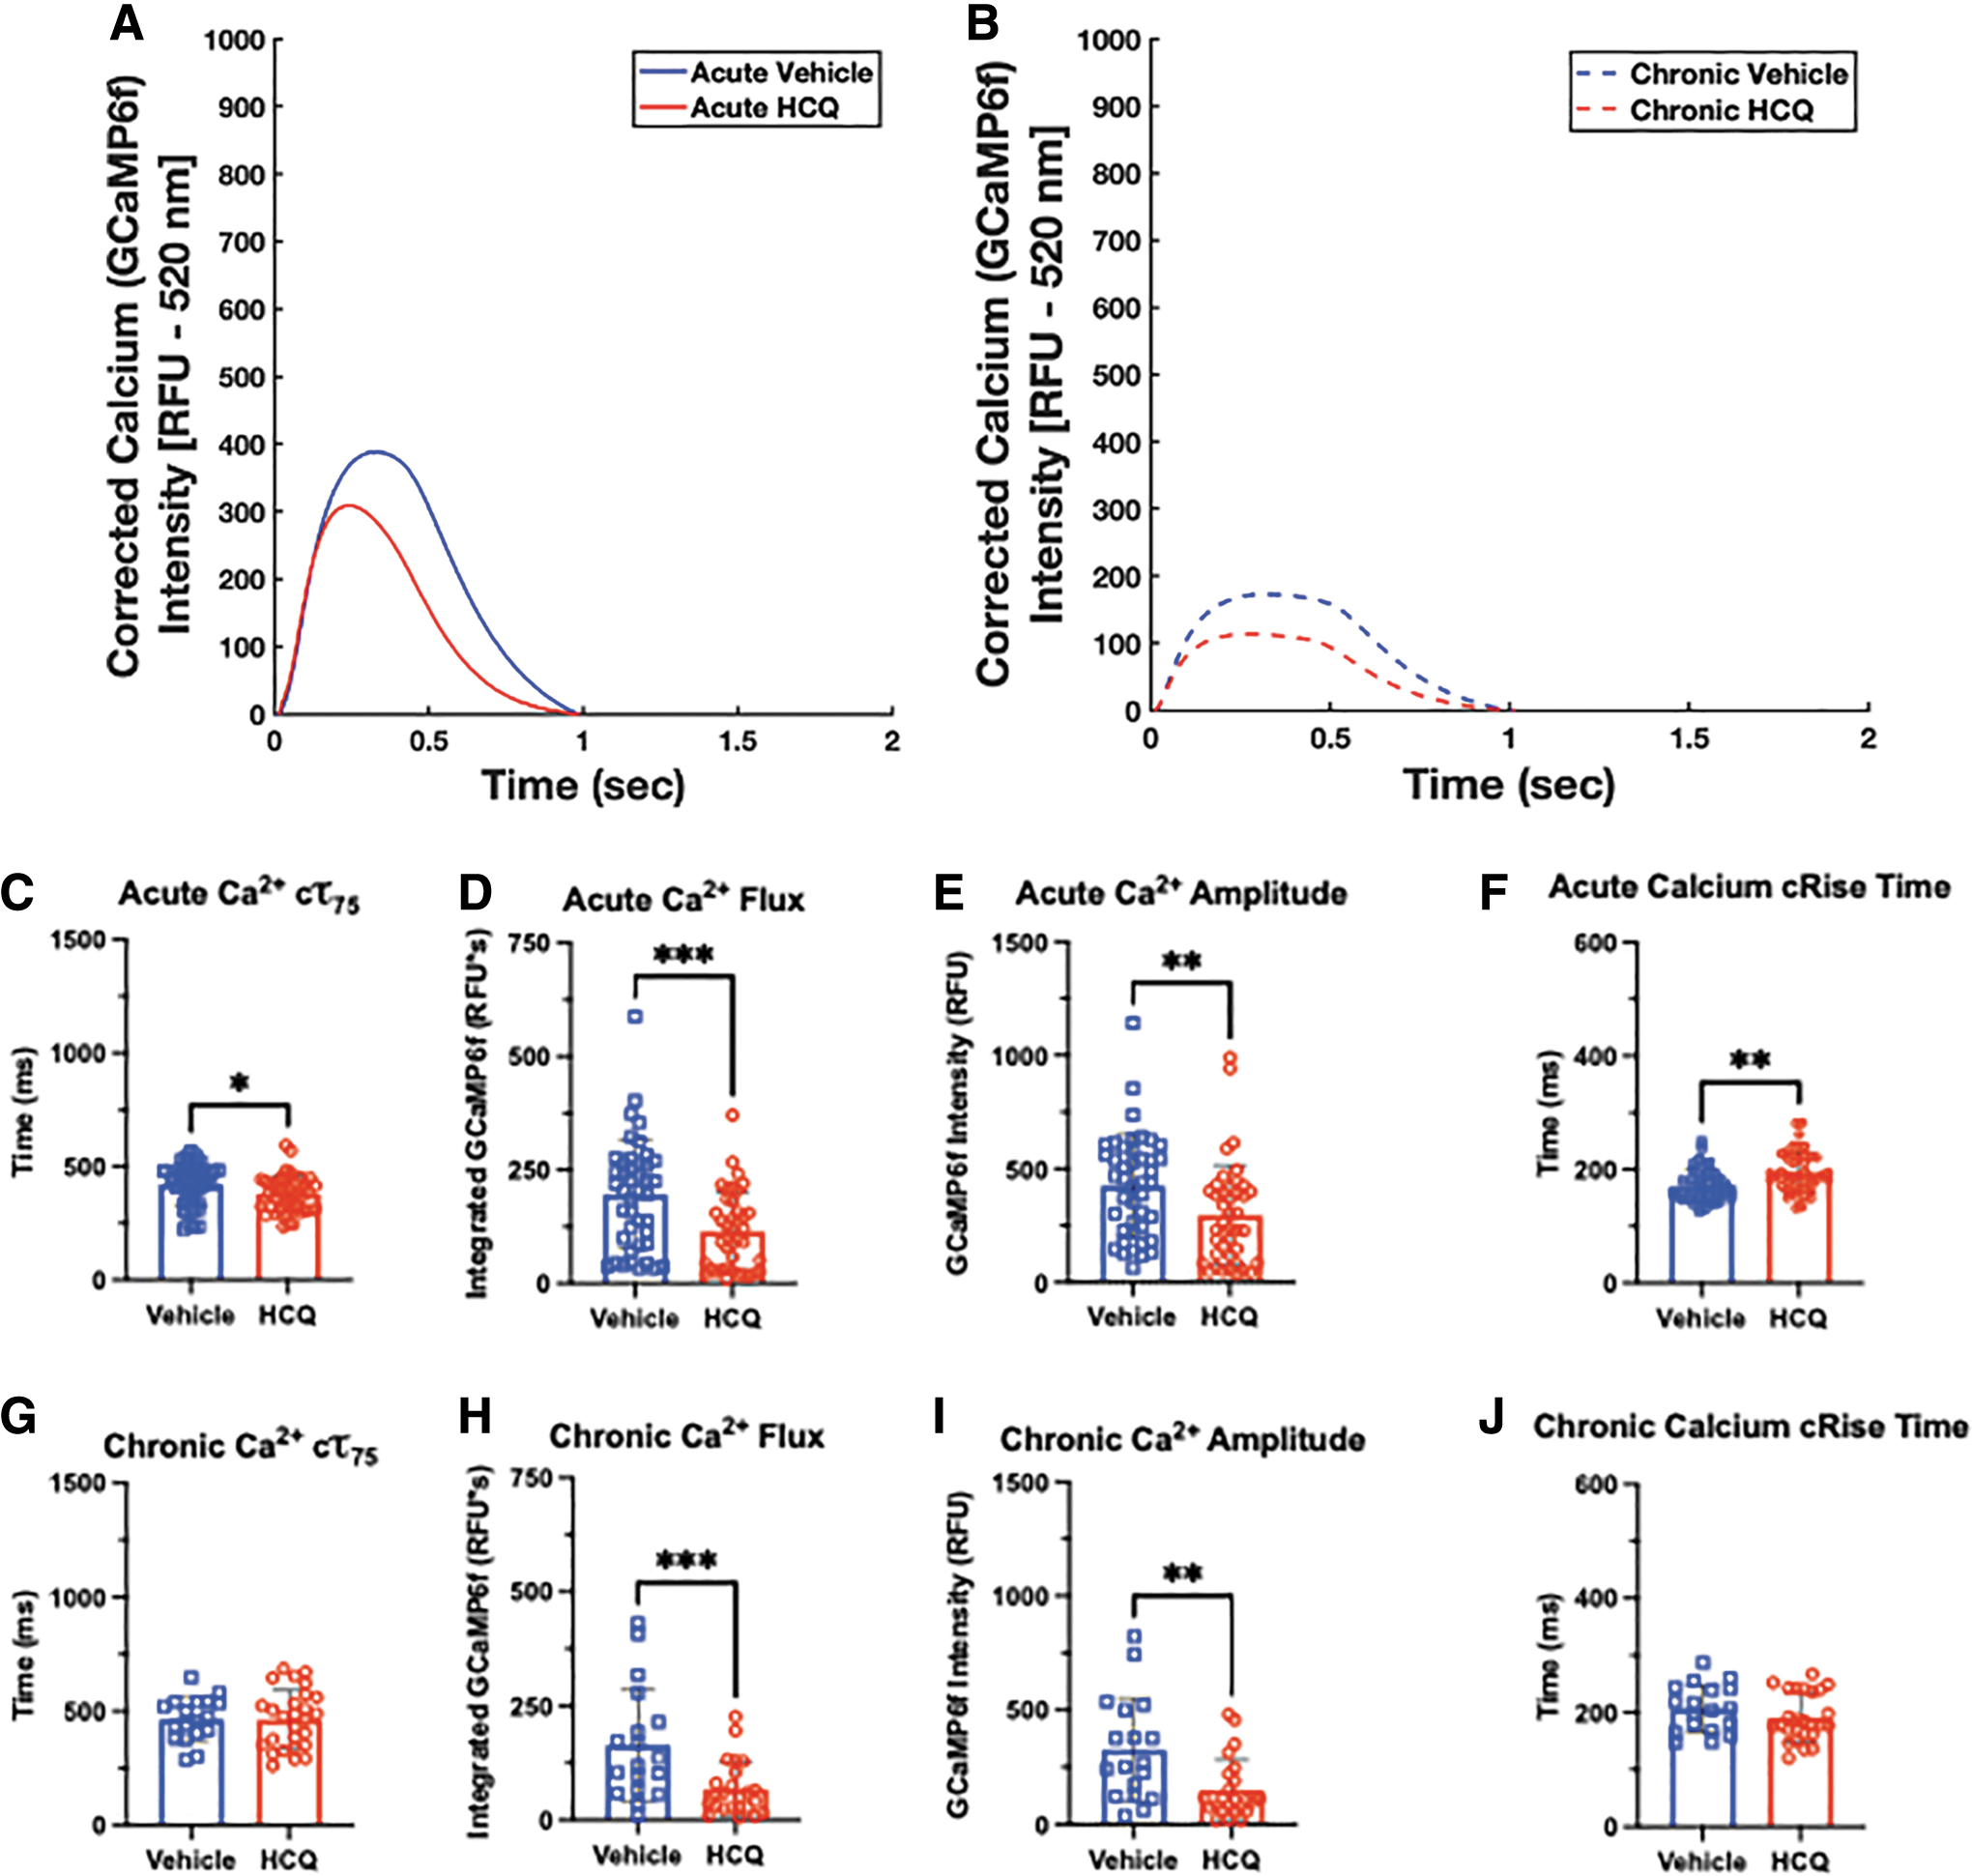
With our imaging system, sequential fluorescent videos can be captured, so we can assess the effect of drug treatment on both overall action potential and Ca2+ handling. A significant advantage of the genetic calcium indicator is that it does not require repeat labeling for longer term studies, which allowed us to assess effects of both acute and chronic exposure to the μHM (Fig. 6A and B).

Genetically encoded calcium reporter signal allows for insight into changes in calcium handling in response to HCQ. Representative overlays of spontaneous calcium handling curves after acute
After acute HCQ treatment, spontaneously beating tissues showed no difference in decay times compared with the control (Fig. 6C), but when this is increased to chronic treatment, a nonsignificant trend toward longer decay in the HCQ conditions develops (Fig. 6G). Of interest, HCQ led to a significant decrease in total calcium influx in the acute HCQ condition compared with the vehicle (Fig. 6D). However, this significance was lost in tissues subjected to chronic HCQ, although they did exhibit a similar trend (Fig. 6H). Similarly, the Ca2+ amplitude also trends toward a lower value in the HCQ-treated tissues at both timepoints (Fig. 6E and I). When comparing the calcium rise time, μHMs treated with HCQ displayed slightly longer rise times at both timepoints under spontaneous beating (Fig. 6F and J). When the tissues were paced at 1 Hz, similar trends were observed as in the spontaneous condition, but with significance achieved in many of the conditions (Fig. 7).
Physiologic beat rate under pacing reveals differences in calcium handling. Representative overlays of paced calcium handling curves after acute
Discussion
We have leveraged our previously described μHM tissue system6,7 and improved analysis pipeline to investigate the effects of HCQ on cardiac electrophysiology. We found methods that used 20% and 5% of the maximum amplitudes to identify the initiation point of action potential and calcium transient waveforms were most robust. These amplitude-based methods, that have been used in other systems,17,20,23,26,27 led to the smallest differences between automated and manual identification of peak onset. In addition, these methods had less variability in the difference between manually identified and automatically identified action potential and calcium transient onset. Finally, the percentages used in the amplitude-based methods were chosen to be high enough to avoid the leak current phase while being as close as possible to the very beginning of the rise of the action potential or calcium transient.
These factors, taken together, have led us to use these amplitude-based methods going forward for automated action potential and calcium transient analysis. As part of this analysis, we compared beat rate correction methods and found little difference in the methods we used and all showed significant difference in UPD between vehicle and HCQ tissues.
We then used the known pro-arrhythmic agent HCQ to validate the system and were able to investigate different ions owing to their role at different points in the cardiac action potential cycle and our dual imaging system. Other studies have shown more significant prolongation, but many used higher, nonphysiologic concentrations of HCQ to achieve this.28,29 Although we did not see a significant prolongation of APD in acute HCQ exposure, there was a significant prolongation in the upstroke, pointing to a potential effect of the drug on NaV1.5, the sodium channel largely responsible for rapid depolarization of cardiomyocytes. 30 Although iPSC-CMs have been shown to be electrophysiologically immature,27,31 they have still been shown to express NaV1.5, so we believe this is a viable mechanism for upstroke prolongation.23,32–34
Alternatively and/or concurrently with NaV1.5 block, this drug may directly block
Acutely, this showed very few effects under spontaneous beating, with only a significant decrease in calcium influx in tissues given HCQ. The tissues given HCQ trended toward decreased calcium decay and amplitude and an increased calcium rise time. Under 1 Hz pacing though, these effects were amplified and achieved significance. This suggests a blockage of the calcium channels from HCQ, which has been seen previously in guinea pig SAN cells similarly treated with HCQ. 10 Diminished calcium transients may lead to decreased contractility in cardiac tissues treated with HCQ. 35
Although our results described do not exactly match those seen clinically, clinical effects of HCQ were not seen until the patients had been on HCQ for days16,36 and emphasize the need for an unbiased analysis pipeline to validate the clinical observations and elucidate the underlying mechanisms. This system and approach can be used as an early screen for drug candidates to get a global view of the cardiac-specific ion channels that may be affected. Then, if the drug is still a viable candidate after this initial screen, methods that provide more mechanistic detail, including ex vivo analyses of adult human and animal cardiomyocytes 37 and in vivo animal studies, can be applied.
iPSC-derived cardiac microtissues do have several limitations. First and foremost, these cells are immature and do not have the same electrophysiology as their adult counterparts owing to differential expression of ion channels and comparatively impaired calcium handling.27,31,33 Furthermore, differentiation processes produce a heterogeneous group of cardiomyocyte subtypes, which may hide drug effects that are more potent on particular subtypes. 33 Nevertheless, when compared with heterologous expression-based approaches like the hERG assay, iPSC-CMs present ion channels in a more appropriate cellular context, and culturing these cells in physiologically relevant tissues may shift them further toward a state where drugs can be tested in a predictive manner. 6
Finally, we acknowledge that QT interval is dependent on both APD and cardiac conduction. In future studies, we plan to incorporate conduction measurements into our software pipeline. The analysis method described previously increases the throughput of performing this testing in iPSC-CM-derived tissues while reducing potential user bias in selection of the initiation point of action potentials and calcium transients.
Conclusion
We leveraged our in vitro tissue system and streamlined our video processing pipeline to investigate the effects of HCQ on cardiac action potentials and calcium transients. We automated the analysis process by validating each method against manual identification of action potential or calcium transient initiation and chose the methods that were most consistently similar. The improved software will allow us to increase the throughput of pharmacological testing, while the tissues showing APD prolongation that is comparable to that of the clinically seen QT prolongation shows that they are a feasible first step for drug analysis in the future. Finally, as we utilized an open-source MATLAB software, these will be available for use for high-throughput analysis of electrophysiologic changes.
Footnotes
Authors' Contributions
K.O., D.Schuftan, J.R.S., and N.H. designed the studies and conceived of the idea to compare manually selected initiation times to different approaches for automated selection. D.Simmons, K.O., and J.G. performed iPSC differentiation, μHM tissue formation, and drug testing. D.B., J.D.M., and P.W.K. identified the appropriate HCQ dosing and provided guidance on data interpretation. D.Schuftan, D.Simmons, and N.H. wrote MATLAB algorithms used in this article. E.M. provided BeRST-1 dye for voltage imaging of the μHM. J.R.S. and N.H. provided facilities, supervised, and funded the studies. K.O., D.Schuftan, N.H., and J.R.S. wrote the article.
Disclosure Statement
The authors declare that they have no conflict of interest.
Funding Information
This work was supported by the Department of Biomedical Engineering at Washington University in St. Louis, the American Heart Association (19CDA34730016 to N.H., predoctoral fellowship 828938 to J.G.), the National Institutes of Health (NHLBI R01HL159094-01 to N.H.; WUSTL MSTP T32: NIH T32-GM007200 to D.B., WUSTL CCR ISBTG T32: NIH T32-HL134685 to D.B., F30 HL151042 to P.W.K.). J.R.S. acknowledges support from the National Institutes of Health (R01HL148803). J.D.M. acknowledges support from the National Institutes of Health (K08 HL153794-01A1).
References
Supplementary Material
Please find the following supplemental material available below.
For Open Access articles published under a Creative Commons License, all supplemental material carries the same license as the article it is associated with.
For non-Open Access articles published, all supplemental material carries a non-exclusive license, and permission requests for re-use of supplemental material or any part of supplemental material shall be sent directly to the copyright owner as specified in the copyright notice associated with the article.