
Abstract
Owing to its superior mechanical and biological properties, titanium metal is widely used in dental implants, orthopedic devices, and bone regenerative materials. Advances in 3D printing technology have led to more and more metal-based scaffolds being used in orthopedic applications. Microcomputed tomography (μCT) is commonly applied to evaluate the newly formed bone tissues and scaffold integration in animal studies. However, the presence of metal artifacts dramatically hinders the accuracy of μCT analysis of new bone formation. To acquire reliable and accurate μCT results that reflect new bone formation in vivo, it is crucial to lessen the impact of metal artifacts. Herein, an optimized procedure for calibrating μCT parameters using histological data was developed. In this study, the porous titanium scaffolds were fabricated by powder bed fusion based on computer-aided design. These scaffolds were implanted in femur defects created in New Zealand rabbits. After 8 weeks, tissue samples were collected to assess new bone formation using μCT analysis. Resin-embedded tissue sections were then used for further histological analysis. A series of deartifact two-dimensional (2D) μCT images were obtained by setting the erosion radius and the dilation radius in the μCT analysis software (CTan) separately. To get the μCT results closer to the real value, the 2D μCT images and corresponding parameters were subsequently selected by matching the histological images in the particular region. After applying the optimized parameters, more accurate 3D images and more realistic statistical data were obtained. The results demonstrate that the newly established method of adjusting μCT parameters can effectively reduce the influence of metal artifacts on data analysis to some extent. For further validation, other metal materials should be analyzed using the process established in this study.
Impact statement
Since metal artifacts affect the microcomputed tomography (μCT) imaging and quantitative analysis of new bone around metal implants, it is crucial to reduce its influence. Herein, a newly established parameter adjustment method can effectively reduce the influence of metal artifacts on data analysis to a certain extent by combining μCT analysis data with histological evaluation, making the results more accurate and effective. For further validation, other metal materials should be analyzed using the process established in this study.
Introduction
Titanium metal is frequently used in dental implants, orthopedic devices, and bone regenerative materials due to its superior mechanical and biological properties.1–4 Recently there has been a growing interest in using 3D printing to develop metal-based bone scaffolds for dental and orthopedic applications.5,6 Three-dimensional (3D)-printed metal-based bone scaffolds are used to restore hard tissues and organ functions.7–9 During the repair and reconstruction of damaged tissue, it is critical to understand the bone integration and osteogenesis process of new tissue, as well as the characteristics, function, structure, and interaction between new tissue and implant.10–12
Several methods, including histomorphometry, ultramicroscopy, X-ray images, and X-ray microcomputed tomography (μCT), are used to examine the osteogenesis and osteointegration induced by metal-based materials after implantation.13–15 One of the most typical analytical techniques frequently applied in animal investigations is μCT, which provides a detailed 3D view and quantitative assessment of new bone formation induced by metallic materials.16,17 However, the artifacts existing after μCT reconstruction of metal specimens will affect the authenticity and accuracy of image analysis.
Owing to the high density of the metal object, the corresponding projection data after the X-ray passing through are distorted, which is represented in the image as the artifact of black-and-white fringe radiation at the metal edge.18,19 The quality and the authenticity of μCT images are dramatically reduced by the artifacts brought by metallic implants. 20 Iterative algorithms21,22 and dual-energy CT23,24 have all been used by CT engineers to increase image quality. However, metal artifacts reduction still poses a significant challenge in improving the CT image quality to reflect the actual value of bone formation induced by metal-based scaffolds.25–27
Another widely used analytical technique for bone growth analysis is histology, which presents information on tissues and materials on a two-dimensional (2D) level. Histological and μCT techniques are often used in combination to evaluate bone defect healing28–30 and the regeneration of other tissues.31,32 μCT analysis provides imaging and parametric information about the entire implant region and surrounding tissue at the macro level. Microscopic histological studies can evaluate bone tissue more precisely and accurately. Histological analysis requires a large number of sections to thoroughly examine information about the entire implant and surrounding tissue.
However, it is difficult to obtain whole tissue information from histological microscope slides due to sample loss during preparation. 33 Therefore, combining the μCT analysis data with the microscopic histological evaluation can make the experimental results more accurate and effective.
In this study, powder bed fusion (PBF) 3D printing technology was used to manufacture titanium-based scaffolds for bone tissue engineering. The scaffolds were implanted in femur defects of New Zealand rabbits for 8 weeks. After μCT scanning and image reconstruction, a series of deartifacts 2D μCT images were obtained by optimizing the erosion radius and the dilation radius using CT-Analyser (CTan) software.34,35 The 2D μCT image and corresponding parameters were chosen to match the histology images generated in the same locations of tissue samples. Using the selected parameters for μCT analysis, an analytical method was developed to improve the measurement accuracy of new bone generated by 3D-printed metal scaffolds.
Materials and Methods
Preparation of metal scaffolds
The titanium scaffolds were prepared from commercial-purity Ti Grade 2 by PBF 3D printing technology based on computer-aided design (CAD) following our previous study. 36 Herein, the original μCT 3D images of the titanium metal scaffolds are shown in Figure 1. All sides of the samples were polished with finer silicon carbide papers: 320, 600, 1200, and 4000. The top and bottom sides of the samples were polished by hand, whereas the other four sides were machine ground. After the grinding step, the samples were ultrasonically cleaned in ethanol for 20 min and then dried with compressed air. Finally, the samples were then sealed in a polyethylene bag containing silicone for 48 h to remove residual water or ethanol, each sample was accurately weighed to 0.1 mg after completely drying.
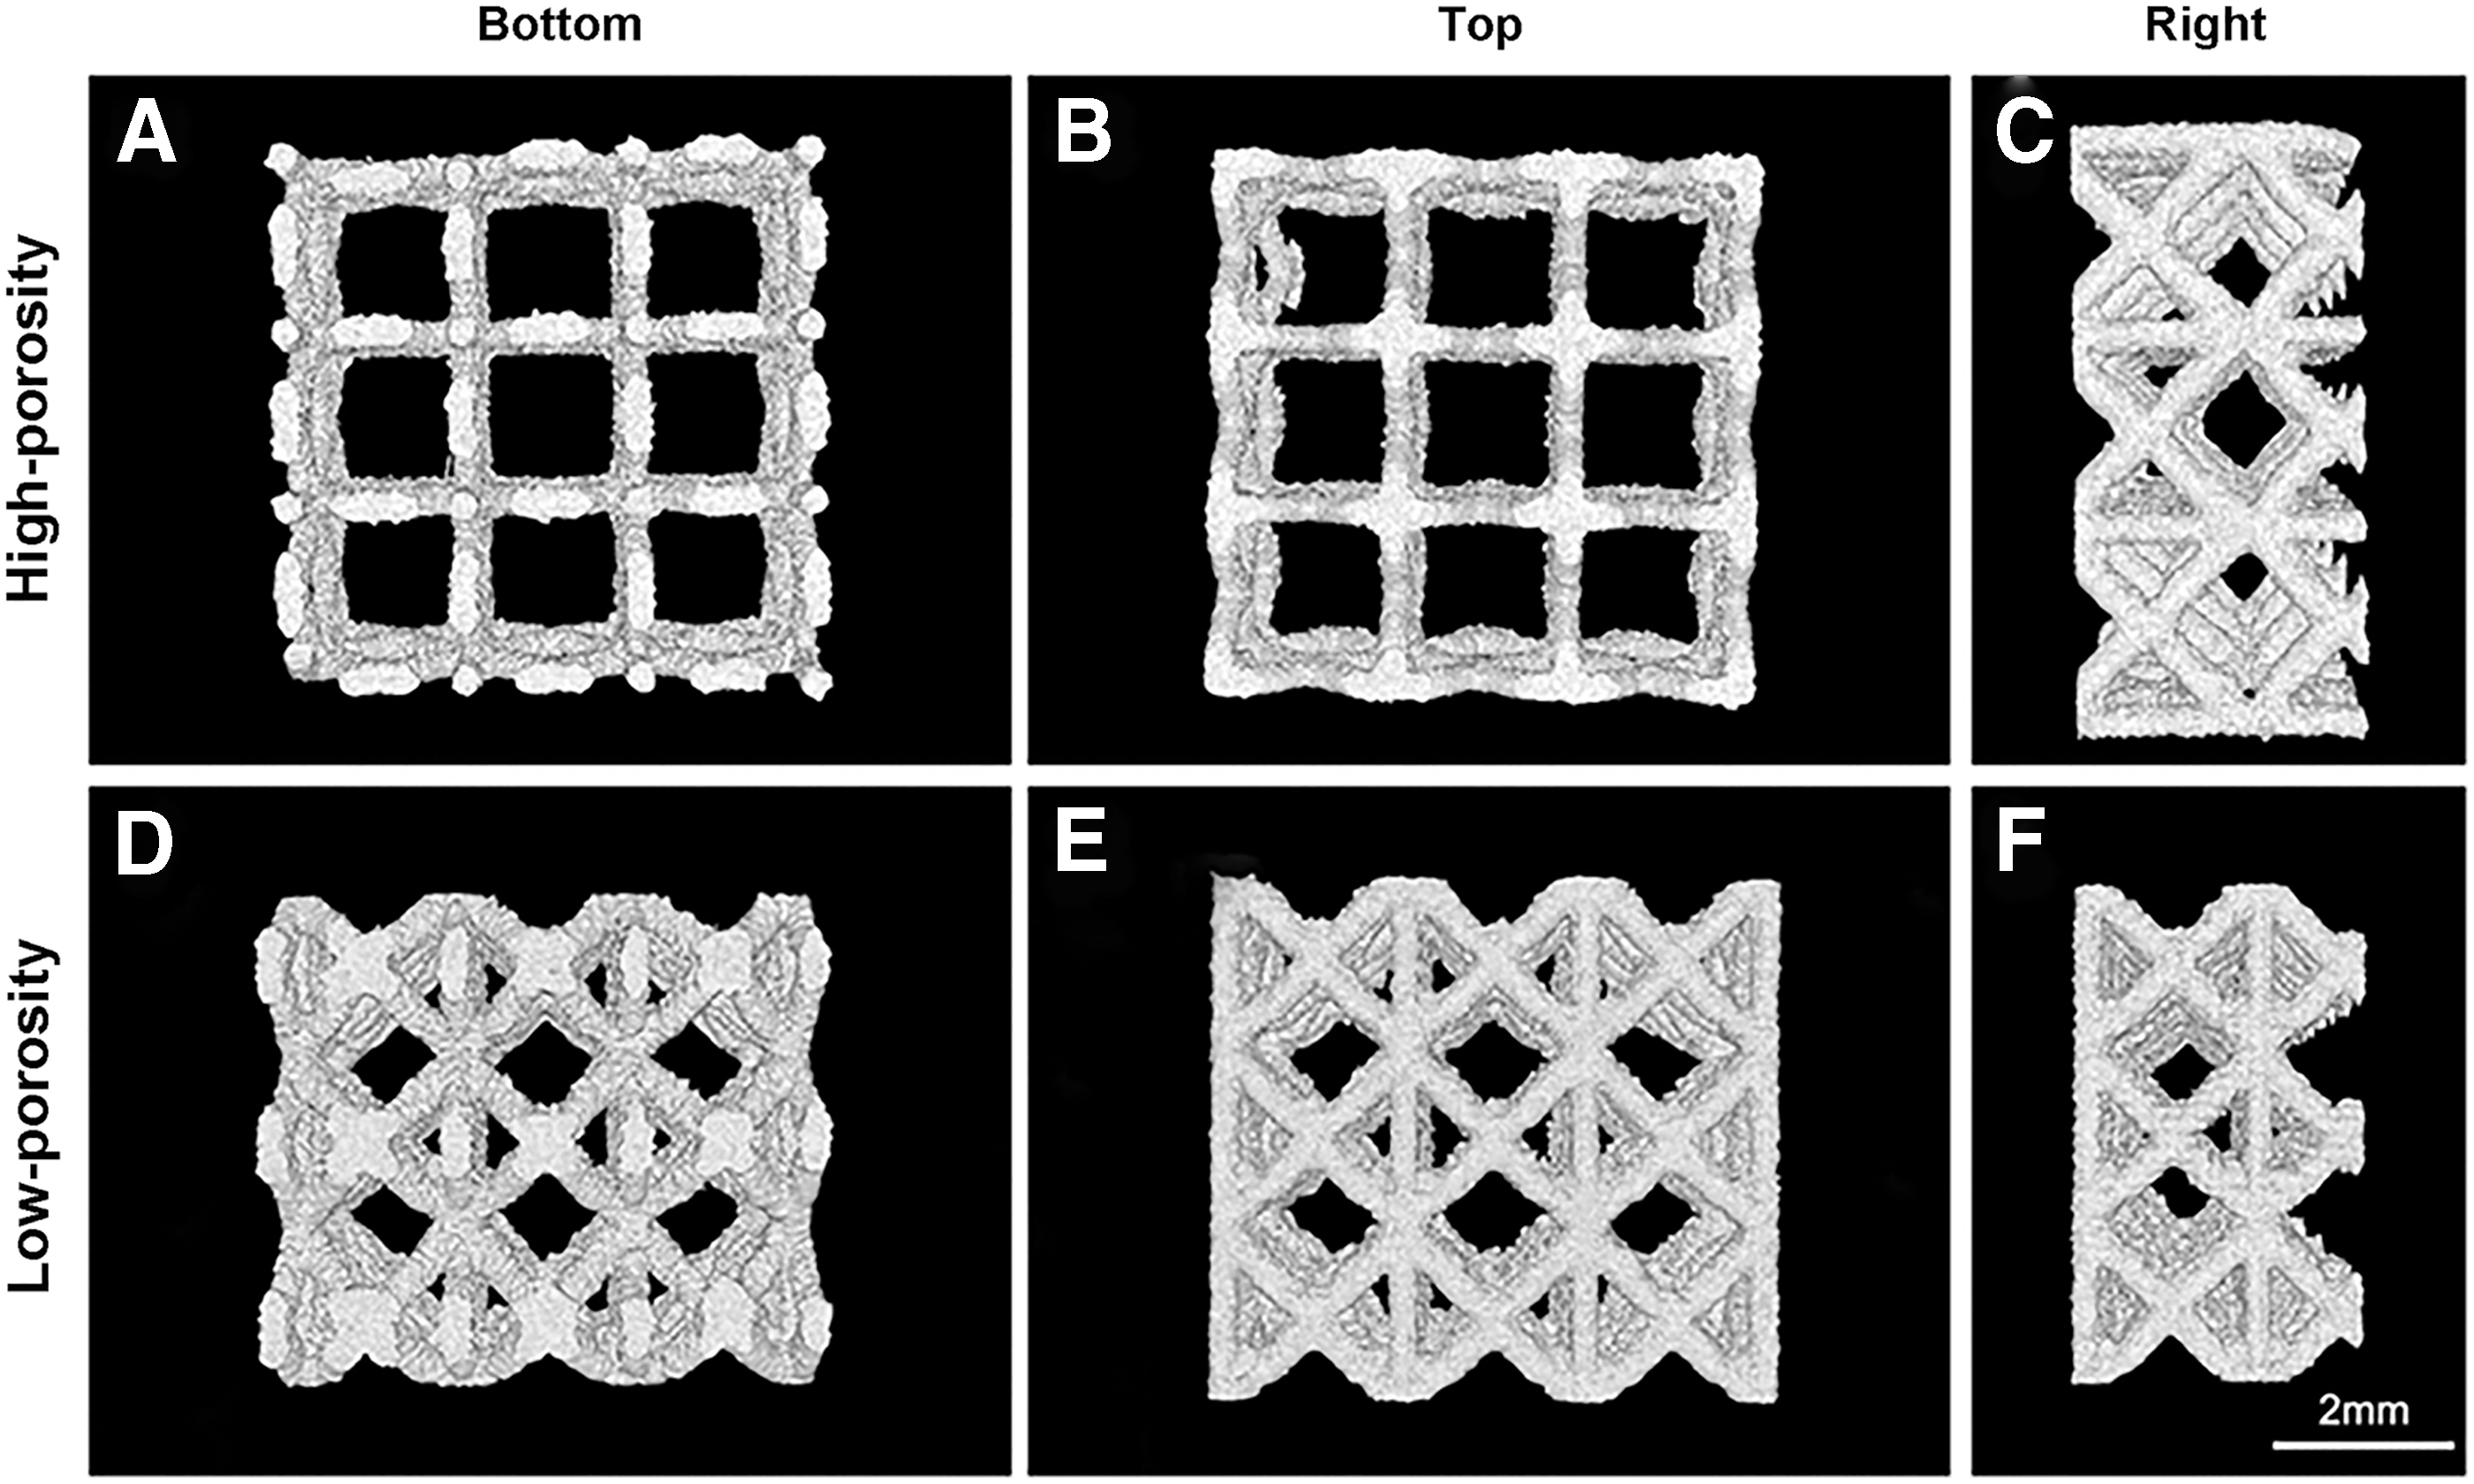
Two types of titanium metal scaffolds with distinct microstructures and porosity.
Animals and surgical protocols
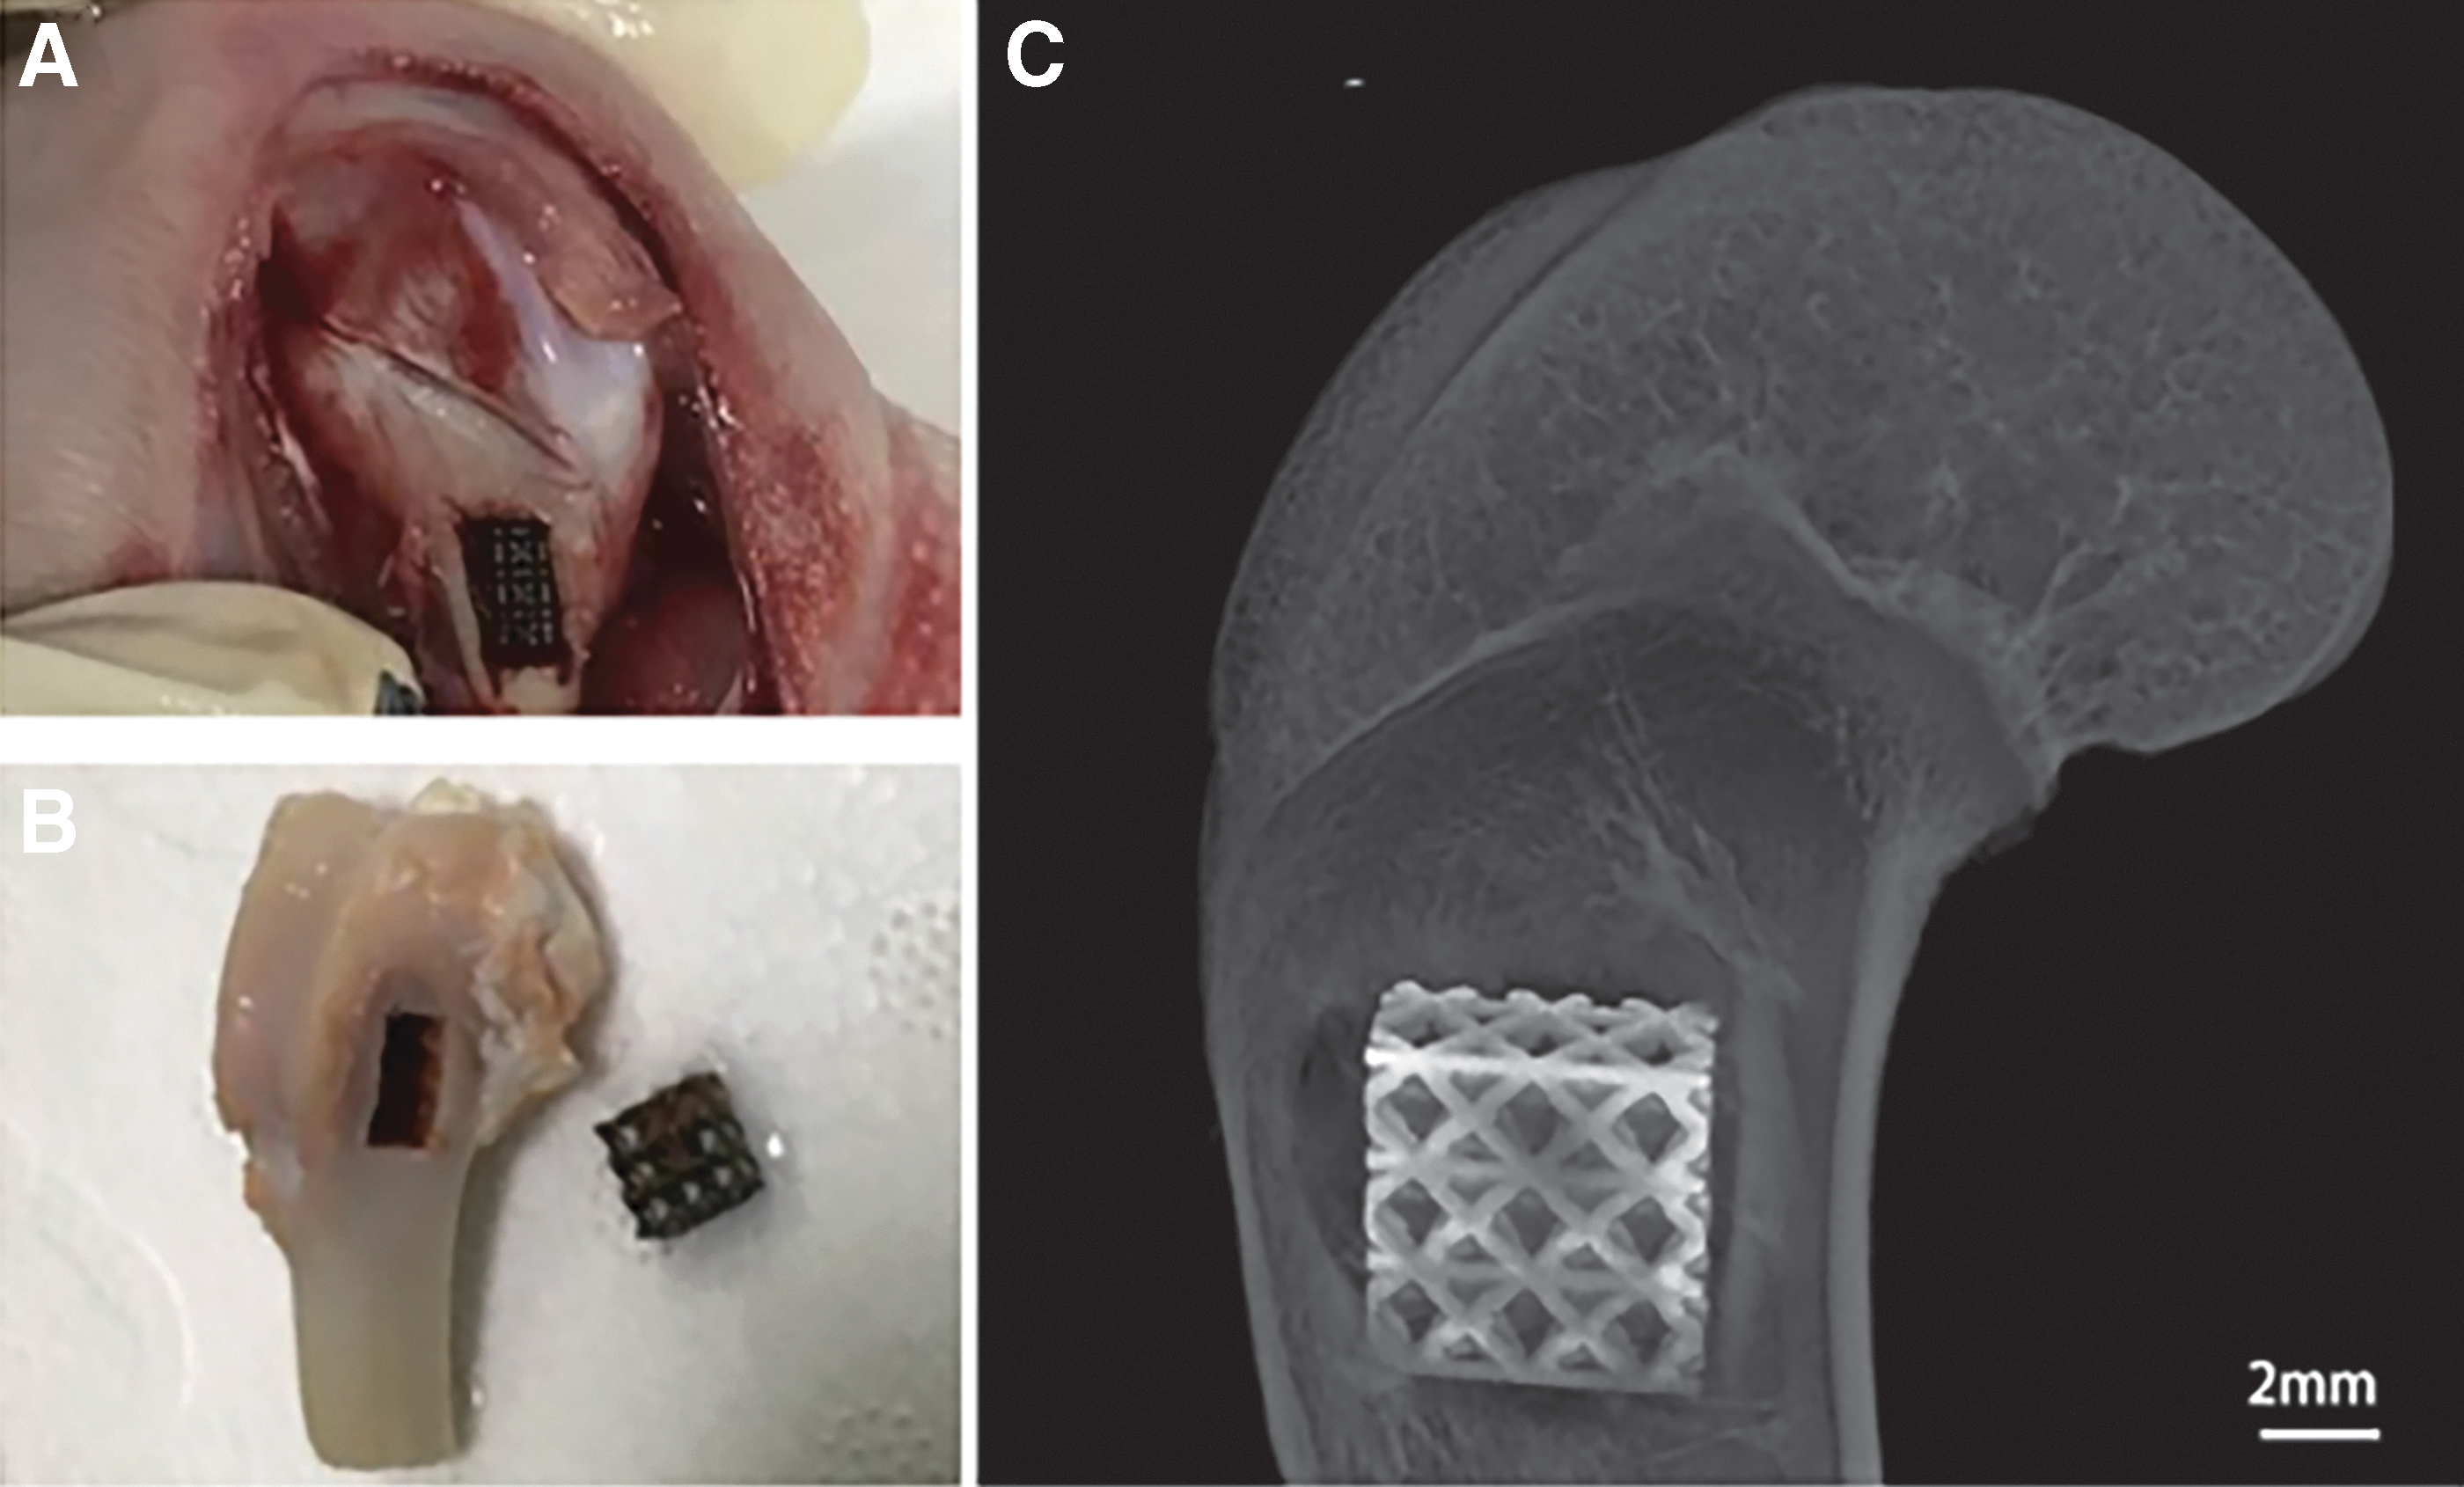
The animal experiment was approved by the Southern Medical University Ethics Committee (Approval No. L2017230). Male New Zealand rabbits weighing ∼2.5 kg were used in this study. All animals were kept in a standard light/dark cycle for 12 h at 20–25°C and allowed sufficient water and food. All surgical procedures were performed in a germ-free environment. In brief, a linear skin incision of ∼1 cm was made on both sides of the distal epiphysis of the femur to expose the femoral condyle anatomically. 37
Then, a rectangular bone defect of 6.3 × 6.3 × 3.0 mm was made perpendicular to the shaft axis, the outer cortical layer was initially shaved off using an ultrasonic bone knife along the dimensional border, and the inner cancellous bone was removed using a scooper, and the depth was measured using a periodontal probe. Finally, the defect was then rinsed with saline to remove the remaining bone fragments from the cavity. Figure 2 displays the shape and location of the defect. The defects were then carefully filled with the prefabricated pure Ti implants, which either had high porosity (85%) or low porosity (70%) (n = 6). Animals were euthanized 8 weeks after implantation, and the femur tissues were harvested and assigned for μCT scan and histological analysis.
μCT analysis
The specimens were collected and fixed in 4% formaldehyde for 48 h at room temperature. The new bone formation within the metal scaffolds was assessed using a μCT scanning system (Model 1172; Skyscan, Kontich, Belgium). Three-dimensional μCT images were created to examine the new bone growth into the metal scaffold. The specimens were scanned at 80 kV and 100 μA with a resolution of 11 μm using an aluminum (0.5 mm thick) and copper (0.5 mm thick) filter and a 90% beam hardening reduction.
The region of interest was specified as a rectangle that encircled the scaffold's entire cross section. The parameters for erosion and dilation were adjusted using CTan software (version 1.1.4.9.0) for analysis and visualization by surface rendering in 2D and 3D for morphometry and densitometry, and the images were analyzed for percent bone volume (BV/total volume [TV]), trabecular number (Tb. N), and trabecular thickness (Tb. Th) as previously described.34,38
In general, morphological techniques are used for μCT investigation of bone properties. Different gray values in the sample correlate with various sample components. The corresponding 3D shape can be obtained using the analysis software through the gray value interval. However, the existence of metal artifacts makes it difficult to distinguish the real image, which seriously affects data acquisition and analysis.39,40 In this study, the metal artifacts can be effectively minimized by performing morphological operations and despeckle operations following the procedures listed in Table 1.
The Operation Procedures Using CTan Software
BV, bone volume; ROI, region of interest; Tb. N, trabecular number; Tb. Th, trabecular thickness; TV, total volume.
Histological study
Hard tissue section preparation
After μCT scanning, samples were embedded in poly (methyl methacrylate) (PMMA). In brief, the samples were fixed in 4% formaldehyde for a period of 2 days, rinsed with running water overnight, and immersed in a gradient concentration ethanol solution (70%, 80%, 90%) until dehydration in 100% ethanol for 48 h separately, substituted with methyl methacrylate monomer 1–2 weeks twice, and then polymerized in situ under yellow light for 4 h and under blue light for 8 h to polymerize into PMMA at room temperature. The blocks were sectioned with a diamond blade using an EXAKT system (EXAKT Advanced Technologies GmbH, Germany), trimmed, and finished by micromilling or polishing to reveal the planes of interest. Finally, a series of 40-μm-thick sections were obtained. 41
Toluidine blue staining
Staining of samples was done with toluidine blue to reveal the general morphology. The procedure was as follows: (a) slide was cleaned using acetone–ethanol 1:1; (b) samples were agitated for 5 min in 30% H2O2; (c) rinsed with tap water; (d) stained for 15 min with toluidine blue; (e) rinsed with tap water; (f) slide was dried and differentiated with acetone–ethanol, wiped off briefly; (g) and samples were covered with coverslip. 42
Statistical analysis
All statistical analyses were performed with GraphPad Prism 8.0 software. All data are presented as mean ± standard deviation. Comparisons between the two groups were performed by Student's t-test, and a p-value <0.05 was considered statistically significant.
Results
Preparation of 3D titanium scaffolds
The original μCT 3D view images of the titanium metal scaffolds are shown in Figure 1, which has two different morphologies of high porosity and low porosity. According to the CAD drawing, the models have a dimension of 6.3 × 6.3 × 3.0 mm, with two distinct microstructures with high porosity (85%) and low porosity (70%), and the surface areas of these two types of specimen were 1.902 and 3.037 cm2, respectively. The regular pore structure inside the scaffold is evident from the bottom, top, and right directions. During PBF 3D printing technology, the accumulation direction is along the longitudinal axis, and the transverse axis is perpendicular to the longitudinal axis. The surface that is normal to the longitudinal axis is the longitudinal section, and the surface that is normal to the transverse axis is the transverse section.
In vivo implantation of titanium scaffolds
Photographs and μCT images of the surgical implantation site and porous titanium scaffolds are shown in Figure 2. A surgical defect was prepared at the distal end of the rabbit femur (Fig. 2A), and a porous titanium metal stent was implanted (Fig. 2B). Figure 2C shows a representative μCT image of the femur after implantation of the metal scaffold.
μCT analysis of bone regeneration
The threshold value for bone tissue was determined in the range of 20–60, by combining the X-ray absorption peak with the original specimen image; the white area in the 2D images and the yellow area in the 3D images represent bone. As shown in Figure 3, the number of metal artifacts decreased after the morphological operation procedure, with a dilation radius from 1 to 3. Three-dimensional analysis of new bone trabecular parameters after porous titanium scaffold implantation is shown in Figure 4.

Three-dimensional analysis procedures of trabecular parameters using CTan software.
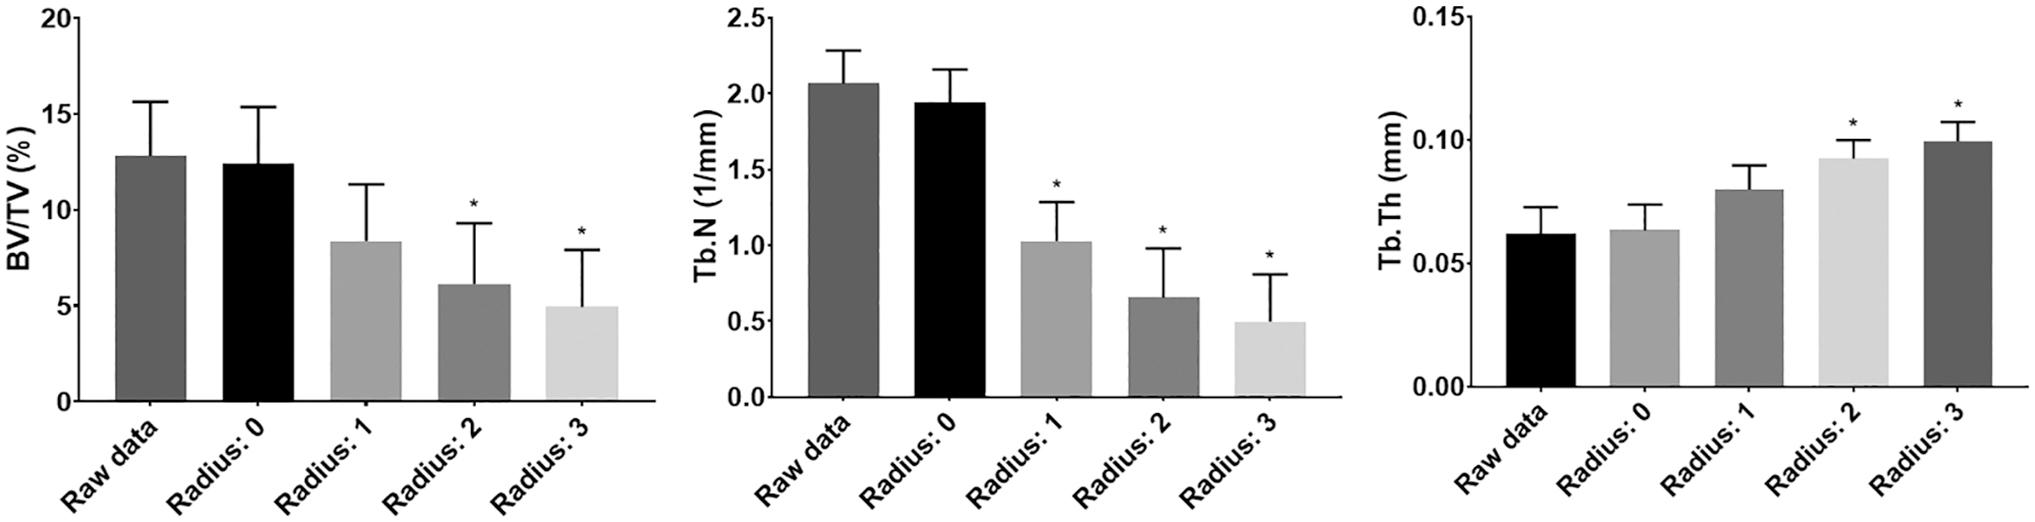
Three-dimensional analysis of trabecular parameters after titanium scaffold implantation. *p < 0.05 in comparison with the raw data group.
BV/TV and Tb. N values decrease as the radius increases, whereas Tb. Th values increase as the radius increases. As the radius value increases, the original trend of the trabecular parameters remains unchanged. The trabecular parameters corresponding to the radius values 2 and 3 differed significantly compared with the raw data group. The precise radius value cannot be established to reflect the exact value of the trabecular bone parameters due to the presence of metal artifacts.
Histological characterization of bone regeneration
Qualitative histology showed that continuous new bone formation occurred during the 8 weeks, and no adverse tissue was observed. In contrast, the healing was characterized by the remodeling of new bone in the pore profile of the implant within the cortical bone region and growth down the interior of the implant into the bone marrow region. 43 Hard tissue sectioning followed by toluidine blue staining on harvested tissue samples demonstrated that new bone (blue) was present inside the porous scaffold (black) and that this growth was constant along the cortical bone. In contrast, there was no apparent new bone in other areas (Fig. 5).
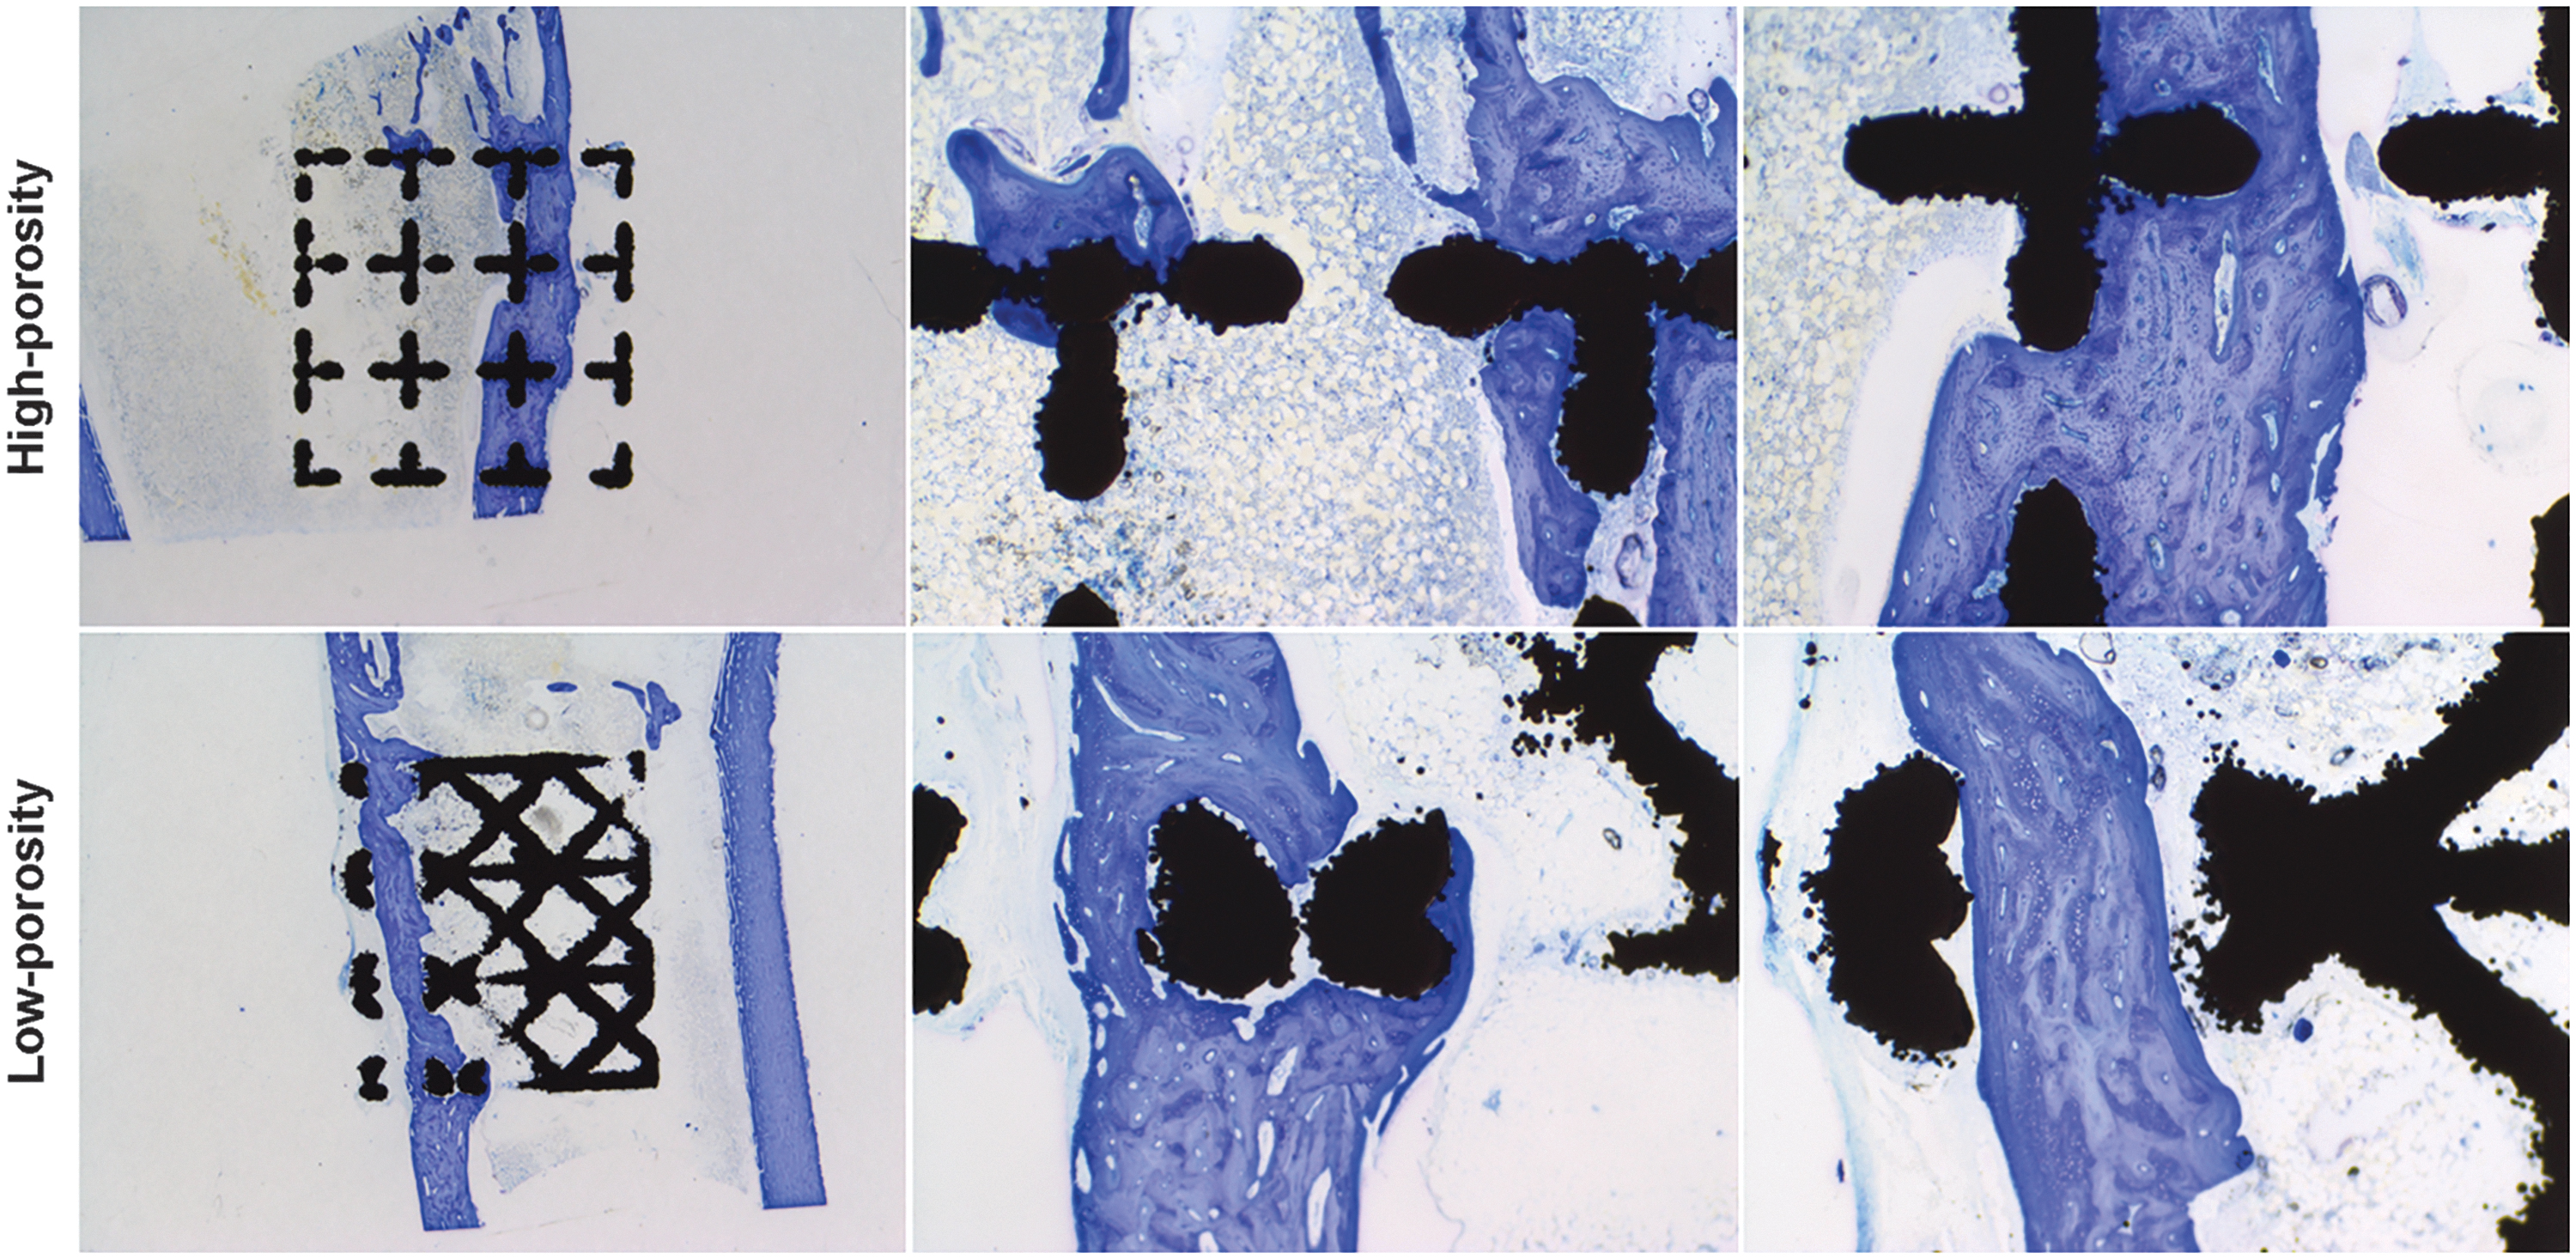
Toluidine blue staining of the rabbit femur tissues implanted with titanium scaffolds; scale bar: 2 mm.
Discussion
After the X-rays penetrate the sample, the receiver displays an image of the sample made of the attenuated X-rays, which weaken as the sample density rises. The sample rotates, generating a succession of 2D X-ray images. 44 The complete sample's series of slices can be converted into a 3D image, which can then be displayed as a whole or as virtual slices of the sample taken at various depths and angles. 45 Owing to the high density of metal objects, the radiating black-and-white fringe artifacts will appear at the metal edges in μCT images.
Currently, most metal artifact reduction approaches modify projection data by interpolating pixel values around metal traces, so it is critical to identify and determine the traces of the metallic objects in projection data.46,47 Although the interpolation procedure has a very high calculation efficiency, interpolation errors frequently result in other artifacts in the final image. Moreover, the existence of artifacts also affects the imaging and quantitative analysis of new bone tissue around the metal specimen. Herein, a calibration procedure for μCT parameters using histological data was proposed, hoping to be a new strategy to reduce metal artifacts and restore tissue parameters and imaging.
Histological staining images guide the determination of the appropriate μCT parameters
After 8 weeks of implantation, a histological staining image (Fig. 6A) of the titanium scaffolds was acquired and compared with 2D and 3D μCT images. The amount of new bone (seen as white areas in the 2D map and yellow in the 3D map) decreases as the radius rises. The metal artifacts surrounding the metal scaffolds cause a lot of white signals to be created, resulting in incorrect assessments of new BV (Fig. 6C, E). The same outcomes are depicted as yellow signals around the scaffold and even inside its pores shown in Figure 6D and F.
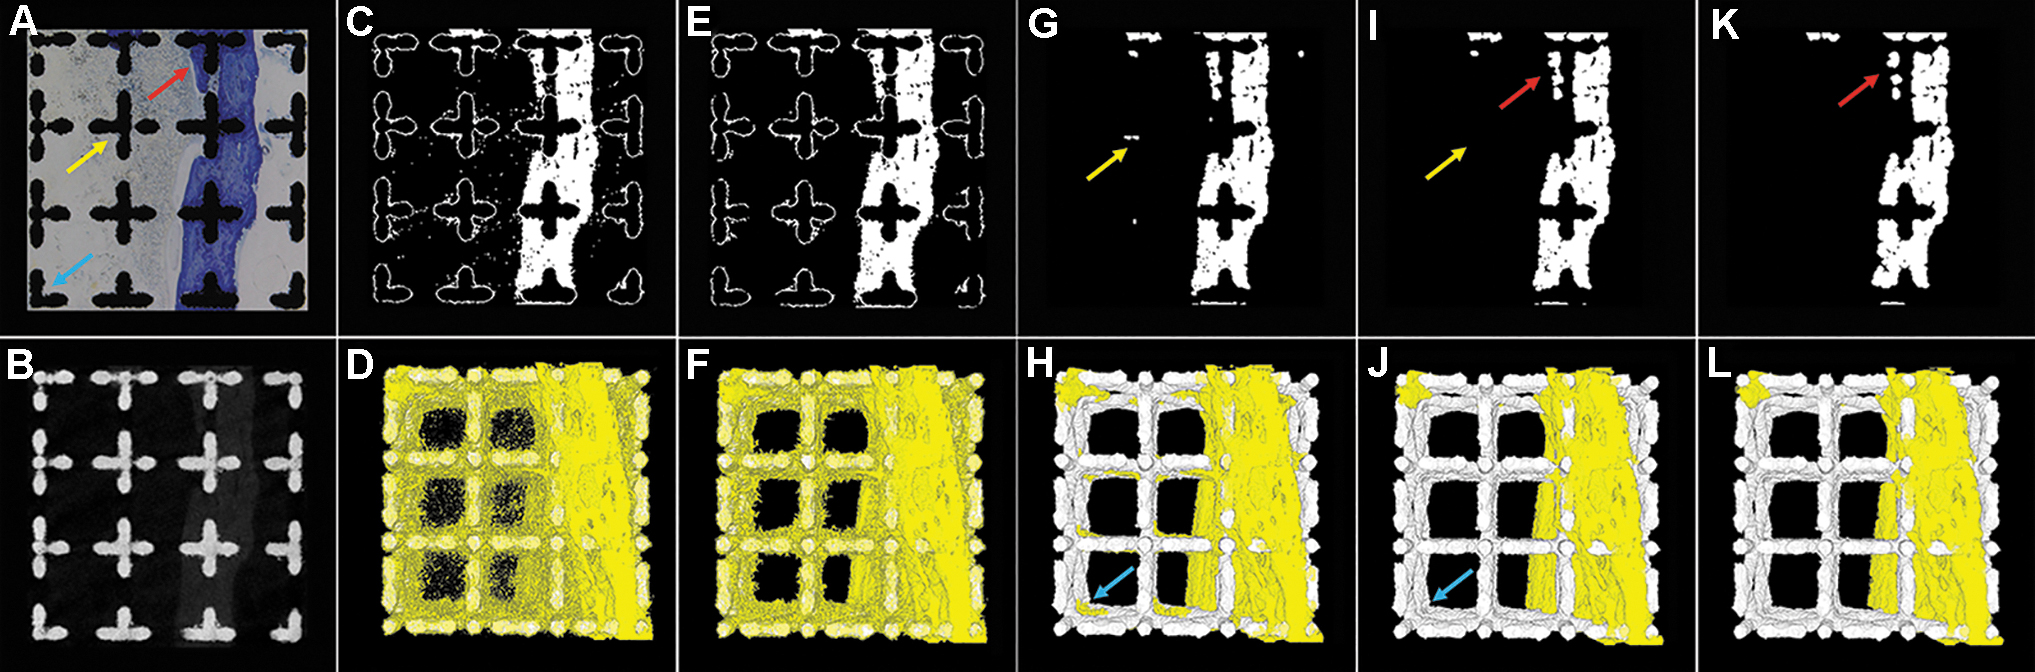
Histological staining image
As the corrosion radius increases, the scaffold's signal eventually vanishes from the μCT image. There is no signal wherein the yellow arrow is pointed as shown in Figure 6A, and the signal disappears from Figure 6G to I. A similar trend can also be observed in Figure 6H to J. In addition, the bone area is continuous in the position indicated by the red arrow shown in Figure 6A and I, whereas it is discontinuous in the same place as in Figure 6K. With the corrosion radius set to 2, it was discovered through the comparison above that Figure 6I is more similar to the histology staining image presented in Figure 6A.
No prominent newly formed bone was around the scaffold except cortical bone, according to the corresponding 3D results shown in Figure 6J. This was consistent with the expectation that new bone existed at the cortical site while there was minimal or no new bone growth elsewhere. A clearer CT image can be obtained, and the osteogenic effect of the scaffold can be more accurately reflected through the above comparison.
Proper μCT parameters determine the authenticity of quantitative analysis
Different μCT processing parameters may obtain different results. In this study, the bone tissue boundary in the original grayscale image of μCT scanning was defined through the in situ histological staining data, to reduce the influence of metal artifacts on the boundary judgment, and obtain the quantitative data and 3D images closest to the true value.
As shown in Figure 4, when the optimization radius is 2, the values of BV/TV, Tb. N, and Tb. Th are significantly different from those before optimization, which indicates that the artifacts noise removed at this time is significantly different from that before optimization radius, and this result is also consistent with the optimization radius given by the histological data. All of these indicate that the μCT quantitative data obtained by optimizing radius 2 are the closest processing method to the real value.
Conclusion
In summary, an analytical method was established in this study that employed histology data to calibrate μCT parameters to acquire correct results from μCT analysis by limiting the impact of metal artifacts. This method can achieve more explicit 3D μCT images and more accurate statistical data. The results demonstrate that this method of adjusting μCT parameters can effectively reduce metal artifacts. Future development of 3D-printed titanium implants may benefit from the procedure established in this study to evaluate metal implant-induced bone regeneration. For further validation, analysis of additional metal materials utilizing this novel method is required.
Data Availability
All data are available on reasonable request.
Footnotes
Authors' Contributions
Z.L., Q.Z., and S.Y. contributed to writing—original draft, validation, methodology, investigation, formal analysis, and data curation. Y.L. and A.A. were involved in methodology. J.R.K. carried out validation. W.Z. and B.L. carried out investigation. C.W. was involved in methodology and resources. Y.Z. and Y.X. took charge of writing—review and editing, supervision, project administration, investigation, funding acquisition, formal analysis, and conceptualization.
Disclosure Statement
No competing financial interests exist.
Funding Information
This study was supported by the National Natural Science Foundation of China (NSFC) General Project (Grant No. 31771025, 31971262), the NSFC Young Scientists Fund (Grant No. 81700969), and the National Health and Medical Research Council Project Grant (APP1087290).