
Abstract
Micropatterns (MPs) are widely used as a powerful tool to control cell morphology and phenotype. However, methods for determining the effectiveness of how well cells are controlled by the shape of MPs have been inconsistently used and studies rarely report on this topic, indicating lack of standardization. We introduce an evaluation score that quantitatively assesses the MP fabrication quality and effectiveness, which can be broadly used in conjunction with all currently available MP design types. This score uses four simple and quick steps: (i) scoring MP and (ii) background fabrication quality, (iii) defining the type(s) of MP of interest, and (iv) assigning so-called efficiency descriptors describing cell behavior. These steps are based on visual inspection and quick categorization of various aspects of MP fabrication quality and cell behavior, presented in illustrations and microscopy image examples intended to serve as a reference “atlas.” To illustrate the advantage of using this score, we determined differences in cell morphology and F-actin intensity between scored versus nonscored cells. These measurements, which could be different in other studies, were chosen because both are understood as markers of cell phenotype and function. We combined intensity-calibrated immunofluorescence microscopy and image-based single cell protein analysis. Most important, significant differences in cell morphology and cytoskeletal protein content between scored versus nonscored cells were noted: the unconditional inclusion of all experimental read-outs (i.e., all MP data regardless of MP quality and effectiveness) into the final results significantly misjudged the experimental readouts versus only including experimental read-outs of quality-controlled and effective MPs, identified by scoring. Specifically, nonscoring underestimated the F-actin intensity per cell and quantitative cellular morphometric descriptors circularity and solidity and overestimated aspect ratio. Scoring improved the precision of cellular readouts, advocating the use of a MP quality and efficiency score as a quantitative decision-supporting tool in deciding whether or not particular MPs should be used for experiments, saving time and money. This simple scoring methodology can be used for improving MP fabrication, comparing results across studies, benefiting basic science studies and potential future clinical use of MPs by introducing standardization.
Impact Statement
Cellular micropatterning is powerful in controlling morphogenesis, proliferation, migration, differentiation, stemness, cell-cell interactions, collective behavior, and likely immuno-modulation. However, lack of a standardized assessment method hinders comparability across studies and advancing micropatterns for clinical practice, e.g., micropatterned cell populations as pharmaceutical drugs. We introduce an evaluation score that uses four simple steps for visual inspection and quick categorization of micropattern quality and effectiveness, aided by illustrations and examples serving as reference “atlas.” This simple scoring methodology can be broadly used on the currently available MP types and introduces standardization, benefiting basic science studies and potential future clinical use of MPs.
Introduction
In situ, a cell resides embedded in a complex, structured microenvironment that contains the extracellular matrix (ECM) and the neighboring cells. This microenvironment plays a pivotal role in shaping the cell’s morphology and cytoskeletal organization, which in turn regulates the phenotype and many cell functions through signaling processes that originate from or converge on the cytoskeleton. 1 Therefore, controlling cell shape through engineering the geometry of the microenvironment, e.g., by micropatterning, has emerged as a powerful tool for precisely controlling cell shape and a large range of cell functions2–4 such as cell morphogenesis, polarity, cellular mechanics, proliferation, migration, differentiation, stemness, cell–cell interactions, collective cell behavior, and likely immuno-modulatory properties. 4
One of the biggest challenges in cell culture experiments is the inherent variability in cell morphology because cells cultured on a homogeneous substrates display a variety of shapes. Even cells with similar shapes usually differ in their cytoskeletal organization 5 and phenotype. To overcome this difficulty, micropatterned (MPs) substrates have been used to better control single cell shape and function. 6 The underlying principle is that a given MP restricts cell growth by using physical barriers or ECM adhesion molecules that are printed with a defined geometry, e.g., a star-like shape (Fig. 1A). The MP then “dictates” the geometry of the cell and impacts the force balance between the endogenous cytoskeletal contractility and external mechanical forces. 7 This balance between forces remodels the cytoskeleton and regulates multiple signaling processes, influencing its phenotype.1,8 Therefore, generating MP cells could be a promising therapeutic strategy for future clinical practice in the context of cells, 4 based on the causal connections between cell morphology, cytoskeleton, and phenotype-control.1,7 MP-centered approaches to harness therapeutically relevant properties of cells would also be regulatory-friendly because adhesion molecules, once licensed, could potentially be used in various geometric variations. 4 However, MP therapeutic cells have not yet been produced or clinically used. 4 Because advances in both biological and medical applications are highly dependent on standardized quality reports of interest to interdisciplinary communities, scoring the production quality and efficiency of MPs would benefit both basic science and translational efforts, as scoring would introduce so far unavailable standardization.
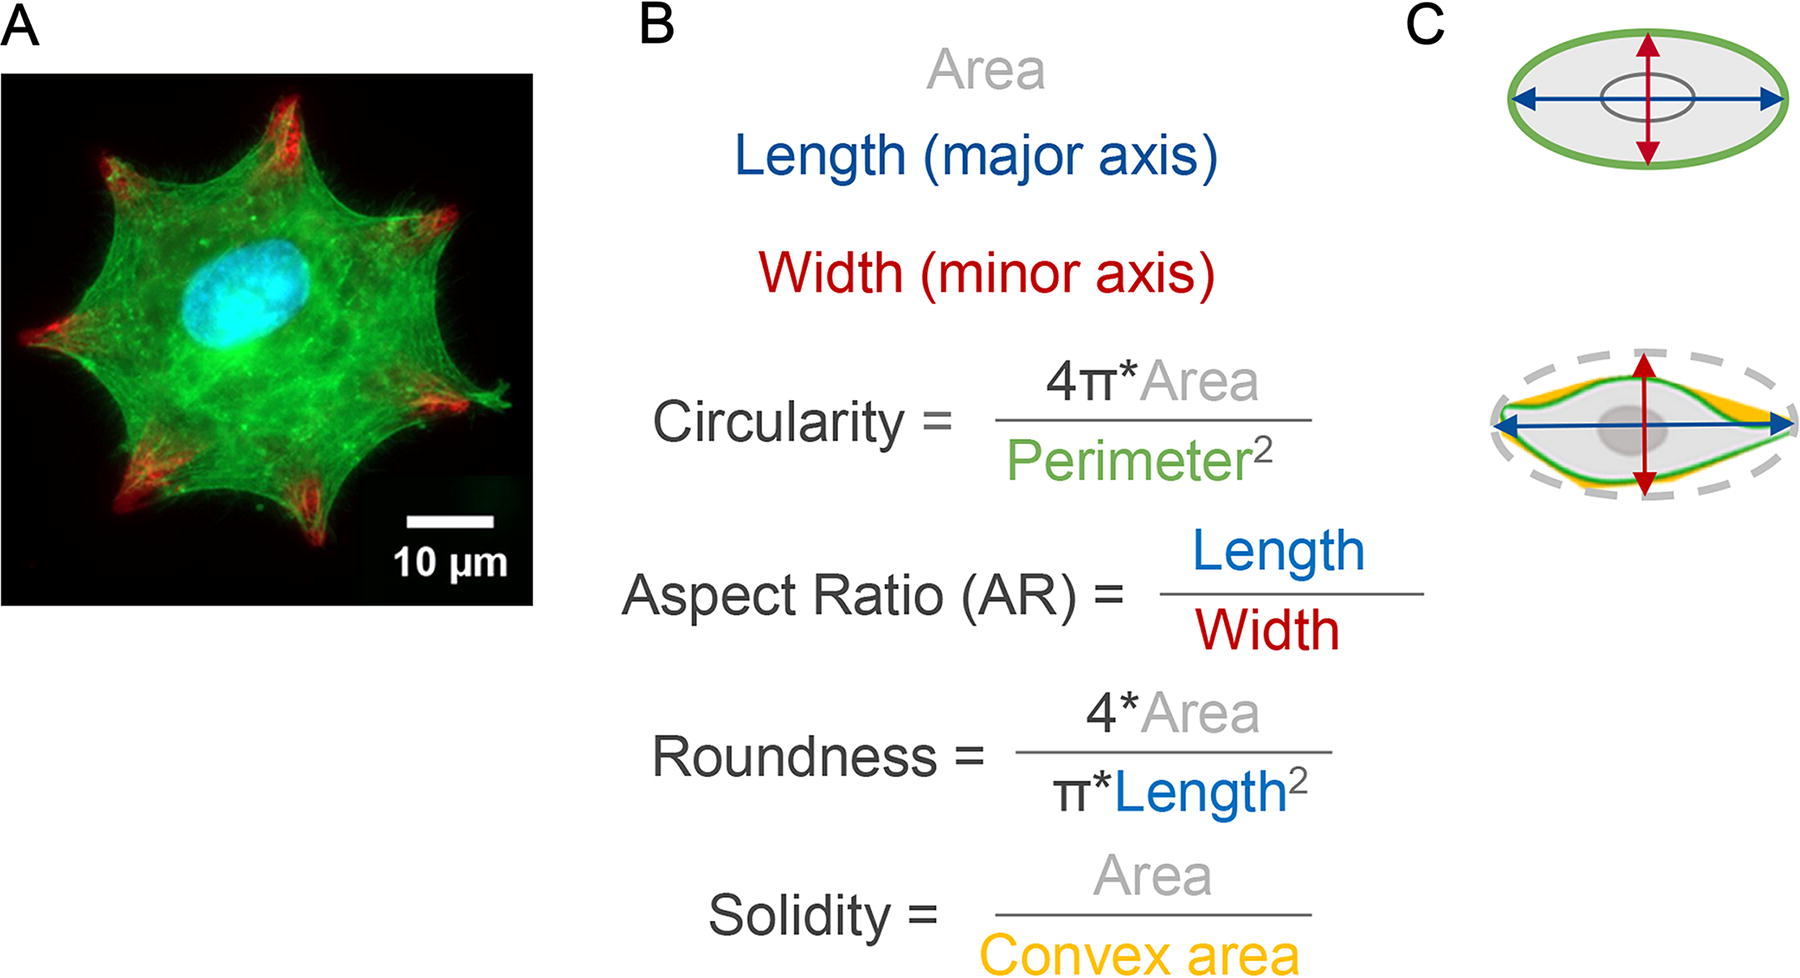
Single cell geometry controlled with a micropattern (MP) and quantified with a panel of shape descriptors.
Many factors can influence the efficiency of MP cells, e.g., the inherent differences between various MP production technologies, different cell types, MP sizes and geometries, 4 to name a few. For example, multiple MP production technologies were introduced, e.g., microcontract printing (µCP), photolithographic methods, stencil, or mold-based fabrications, among others. 4 Their effects on MP efficiency remain largely unstudied but the limited available data suggests that MP fabrication technology can indeed affect MP quality. For example, the µCP technique for producing MPs achieves approximately 36% efficiency for single-cell capture by MPs and 32% for capturing double cells. 3 In contrast, another study using the µCP technique reported a much higher efficiency of 71% when using a photoresist for MP fabrication. 9 However, the study did not report the numbers of cells that were captured by the MPs. Whereas this comparison highlights differences in efficiencies between MP fabrication methods, the type of printed MP might also affect cell capture and shape-controlling efficiencies as well. In this context, the percentage of captured cells was assessed in one study as an indicator of MP efficiency, 10 whereas a few other studies used efficiency descriptions such as MPs occupied by cells, 9 MPs loaded with cells, 11 or cells in microwells. 12 These points clearly indicate a lack of standardization.
Here, we propose an evaluation score that assesses both the fabrication quality and the effectiveness of how well MPs control cell morphology and phenotype. This easy scoring methodology is based on visual inspection and quick categorization of various aspects of MP fabrication quality and cell behavior, which we present in illustrations intended to serve as a reference “atlas.” This methodology can be applied to all currently available MP design types. To illustrate how scoring affects cell function, we demonstrated the scientific benefit and advantage of applying versus not applying the here introduced score. Most important, compared to including only the experimental read-outs of quality-controlled and effective MPs into the final results, the unconditional inclusion of all experimental read-outs into the final results significantly altered quantitative cell morphology results and underestimated quantitative cytoskeletal F-actin, markers of cell phenotype, and function. 1 Thus, the here introduced MP evaluation score can be used by investigators for improving the fabrication of MPs but also in using commercially available MPs, which would enable experimental reproducibility, allow comparisons across studies, and foster potential future clinical use of MPs through standardization.
Methods
Fabrication of MP hydrogels using µCP
For quantitative cell morphometric measurements, we performed immunofluorescent staining of cells cultured on polyacrylamide (PAA) hydrogels. Those were fabricated in a 1.0 mm Mini-PROTEAN Spacer Plate (Bio-Rad), which was polymerized by mixing acrylamide, bis-acrylamide, ammonium peroxydisulphate (APS, Carl Roth), and tetramethylethylenediamine (TEMED, Bio-Rad). The MPs were fabricated by negative µCP using a polydimethylsiloxane (PDMS, Sigma-Aldrich) stamp in which fibronectin that was isolated from human plasma (FN, Lot 3536062, Sigma-Aldrich) was printed onto the hydrogel surface providing an adhesive MP molecule for cell attachment. PDMS stamps carrying the chosen MP patterns were fabricated and activated according to.13,14 Afterward, the stamp was brought into contact with the PAA surface using a 10 g weight applied for 5 min.
Human chondrocyte isolation and culture
Human articular cartilage was obtained from osteoarthritic patients undergoing knee joint replacement surgery at the Dept. of Orthopedics and Trauma Surgery, University Medical Center Freiburg, obtained with informed patient consent and approval by the local ethics commission (#418–19). The cartilage was cut and digested with collagenase XI (1500 U/mL) to isolate chondrocytes as described.15–18 Cells were cultured in a mixture of DMEM + GlutaMAX (ThermoFisher) and Ham’s F-12 + GlutaMAX (Biochrom) containing 10% Pen/Strep and 5% Amphotericin B on PAA hydrogels.
Quantitative cell morphology and F-actin
The cells on the PAA hydrogels were prepared for immunofluorescence by fixation with 4% paraformaldehyde (PFA). Then, the cells were washed with PBS and permeabilized with 1% Triton X-100 (Carl Roth) at room temperature. The hydrogels were incubated with a rabbit polyclonal antifibronectin primary antibody (ab2413, Abcam) overnight at 4°C and, after washing, with goat antirabbit IgG (H + L) cross-adsorbed secondary antibody (Alexa Fluor 647, A-21244, Thermo Fisher Scientific) for 1 h. At this step, the cells were stained with phalloidin iFluor 488 (Abcam) and DAPI (1 μg/mL) in DPBS. Fluorescent images were recorded with the Zeiss Observer-Z1 fluorescent microscope (Zeiss) in a top-down view onto the surface with optimal exposure time. After successful segmentation of the cells from the image background with the WEKA classifier and pixel classification of nucleus, cytosol, and background, 19 neighboring cells were separated with a marker-based watershed algorithm and the morphology and phalloidin (F-actin) intensity and density were determined for segmented single cells. This was comparable to our previous studies on chondrocytes,20,21 macrophages, 22 and mesenchymal stromal cells.2,23–26 Specifically, single-cell morphology was quantified using the shape descriptors whose formulas are given in Figure 1B and which are illustrated in Figure 1C. Single cell cytoskeletal F-actin intensity (measured as raw integrated density representing the sum of actin pixel values of segmented cell) and density (calculated by F-actin intensity divided by the cell’s area) was calibrated to a fluorescence intensity standard curve to account for exposure time variations and presented as F-actin intensity and density.
Development of an MP fabrication quality and effectiveness evaluation score
In an iterative development process, we developed the here introduced MP evaluation score whose conceptual framework was based on the observation that variations in the experimental readouts were related (i) to MP fabrication quality and (ii) how well MPs “dictated” their shape onto variable amounts of adhering cells. The development process involved multiple rounds of producing MPs and evaluating the effects of MPs as well as score refinements and evaluations. Finally, this led to the here reported formal use case on scoring MP fabrication quality and effectiveness in the context of controlling morphology and cytoskeletal composition with MPs. The resulting final score is presented below.
Applying the MP fabrication quality and effectiveness evaluation score
The following text sections describe in detail the MP evaluation score methodology that consists of two subscores that assess in four steps fabrication quality and MP effectiveness. As an overview, these are the four summarized steps:
Two steps for calculating MP quality:
Score each MP’s fabrication quality (good, poor) and calculate the percentage relative to all scored MPs.
Score background purity (pure, impure) and calculate the percentage relative to all scored MP backgrounds.
Two steps for calculating MP effectiveness:
Determine the MP type (A–F) and choose the associated efficiency descriptors.
Assign to each cell the efficiency descriptor that best describes its behavior and calculate how often each efficiency descriptor was assigned relative to the total number of assessed cells.
These steps are based on visual inspection and quick categorization of various aspects of MP fabrication quality and cell behavior, which we present below in illustrations and microscopy image examples that are intended to serve as a reference “atlas.” As proof-of-principle, we then demonstrate the advantage of using this simple scoring methodology by showing how applying versus not applying the MP evaluation score methodology alters the precision of cellular read-outs, namely cell shape- and phenotype-control.
Steps 1 and 2 for calculating the MP fabrication quality subscore
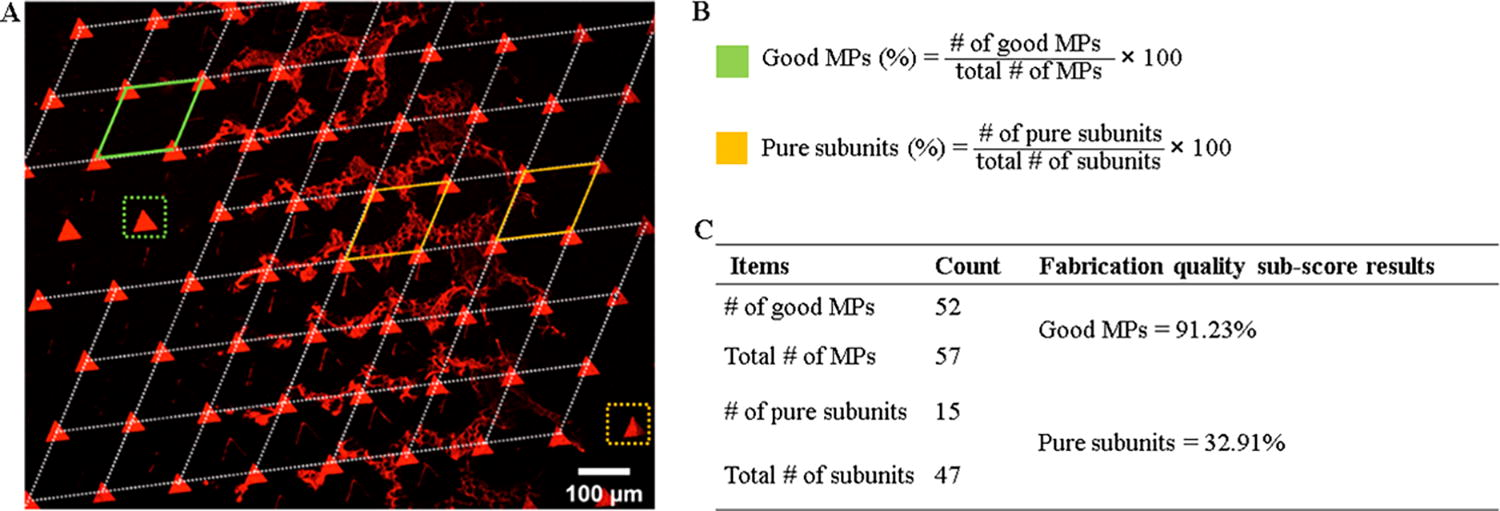
As an example of varying fabrication quality, Figure 2A presents MPs that were μCP printed onto PAA hydrogel surfaces. This example shows both good and poor-quality MPs. The dotted green lines in Figure 2A enclose an MP that was fabricated with “good” quality, meaning, the MP is precisely and accurately defined. MPs with “good” quality exhibit uniformity across the hydrogel surface, with consistent features and minimal variation in dimensions or morphology, and they maintain their integrity and structural stability during the cell culture period by resisting degradation or distortion under the experimental conditions (e.g., exposure to cell culture media). In contrast, an MP enclosed by dotted yellow lines was fabricated with “poor” quality; it is visibly damaged and/or was incompletely printed. Using these two definitions, the quality of each assessed MP is categorized as either good or poor (Step 1). This can be tallied and used for calculating the percentage of MPs with good fabrication quality relative to all scored MPs.

Examples of MPs and scoring MPs with varying MP fabrication quality and background purity.
As an example of varying background unit purity, Figure 2A presents a background unit with solid green lines, bound by four MPs, not containing any impure areas, e.g., adhesion molecule smudges, and is categorized as a “pure” subunit. The units enclosed by solid yellow lines contain printed adhesion molecule smudges and are categorized as “impure” subunits. Using these two definitions, the purity of each assessed background unit is categorized as either pure or impure (Step 2). Here, the entire surface area or smaller regions of interest can be scored. The results can be tallied and used for calculating the percentage of MPs with pure and impure background subunits relative to all scored background units, using the formulas presented in Figure 2B. Thus, the fabrication quality subscore provides a quantitative assessment of both MP and background quality; we recommend >80% as good MP quality and <80% as pure background.
Using the example of Figure 2A and the formulas given in Figure 2B, we calculated that 91.2% of all MPs were fabricated with good quality. However, only 32.9% of all background subunits were pure (Fig. 2C). Together, these numbers represent the fabrication quality subscore of the Figure 2A example, indicating low fabrication quality since <80% were pure background subunits, based on background printing smudge, despite >80% of MPs of good fabrication quality.
Steps 3 and 4 for calculating the MP effectiveness subscore
Because a range of MP geometries has been introduced in the literature, scoring how well the MPs control the shape of the adherent cells makes it necessary to account for the many available MP geometry variations that are currently available. 4 Thus (step 3), the MP type is categorized in order to then choose the associated efficiency descriptors. We defined the MP types A–F (Tables 1–6). Type A MPs consist of separate MPs that are regularly spaced and have a morphology that a single cell can fully adopt (Table 1); this MP type represents the predominant type for investigating single cells. In contrast, the B–F types of MPs use various line geometries for controlling factors such as cell–cell contacts.
Efficiency Descriptors for Type A Micropatterns
A1–A4 define four different positional relationships between cells and MPs.
Efficiency Descriptors for Type B MPs
B1–B2 define a cell has either contact to one /few/ multiple lines or no contact. The scoring of type B MPs can be simplified by measuring the acute angle (α) between the long axis of the cell and the printed MP line it has contact with.
The specific degree of this α (angle) (here 30°) may have to be adapted to accommodate the investigated cell type.
Efficiency Descriptors for Type C MPs
C1–C4 define a cell may grow on a line, protrude from a line, span multiple lines, or stay in between lines.
The long axis of a given cell forms the angle (α) with the printed MP lines. The specific degree of this angle (here 30°) may have to be adapted to accommodate the investigated cell type.
Efficiency Descriptors for Type D MPs
D1–D2 define a cell may grow on the grid and have contact(s) with one /few/ multiple grid lines or no contact.
The long axis of a given cell forms the angle (α) with the printed MP lines. The specific degree of this angle (here 30°) may have to be adapted to accommodate the investigated cell type.
Efficiency Descriptors for Type E MPs
The long axis of a given cell forms the smallest acute angle with the grids as angle “α.” The specific degree of this angle (here 30°) may have to be adapted to accommodate the investigated cell type.
Efficiency Descriptors for Type F MPs
MPs consist of individual MPs and connected lines.
The long axis of a given cell forms the angle (α) with the printed MP lines. The specific degree of this angle (here 30°) may have to be adapted to accommodate the investigated cell type.
Next (step 4), the MP efficiency is subscored by assigning the observed cell behavior to the efficiency descriptors that are appropriate for the investigated MP type using the definitions given in Tables 1–6. For example, a cell that adheres to a single type A MP, e.g., a circular MP without any interconnecting lines, and that has “perfectly” adapted to the MP morphology, is fully shape-controlled by the MP—this behavior is categorized as A2 (A for the MP type and 2 for the efficiency descriptor that describes this situation). Thus, each cell is assigned an efficiency descriptor that best describes the observed effects of the cell that is evaluated. The tallied results allow calculating how often each efficiency descriptor was assigned relative to the total number of assessed cells. For example, one would determine for type A MPs how often the descriptors A1, A2, A3, and A4 (Table 1) were assigned (in %) to the assessed cells. For type B MPs, one would determine how often the descriptors B1 and B2 (Table 2) were assigned (in %) to the assessed cells. The calculated percentages then represent the MP effectiveness subscore results. Figure 3A gives a condensed summary of how to choose the appropriate MP type and the correct efficiency descriptors. Figure 3B provides the general formula for calculating the subscore results as number of cells that were assigned to each descriptor relative to the total number of assessed cells.
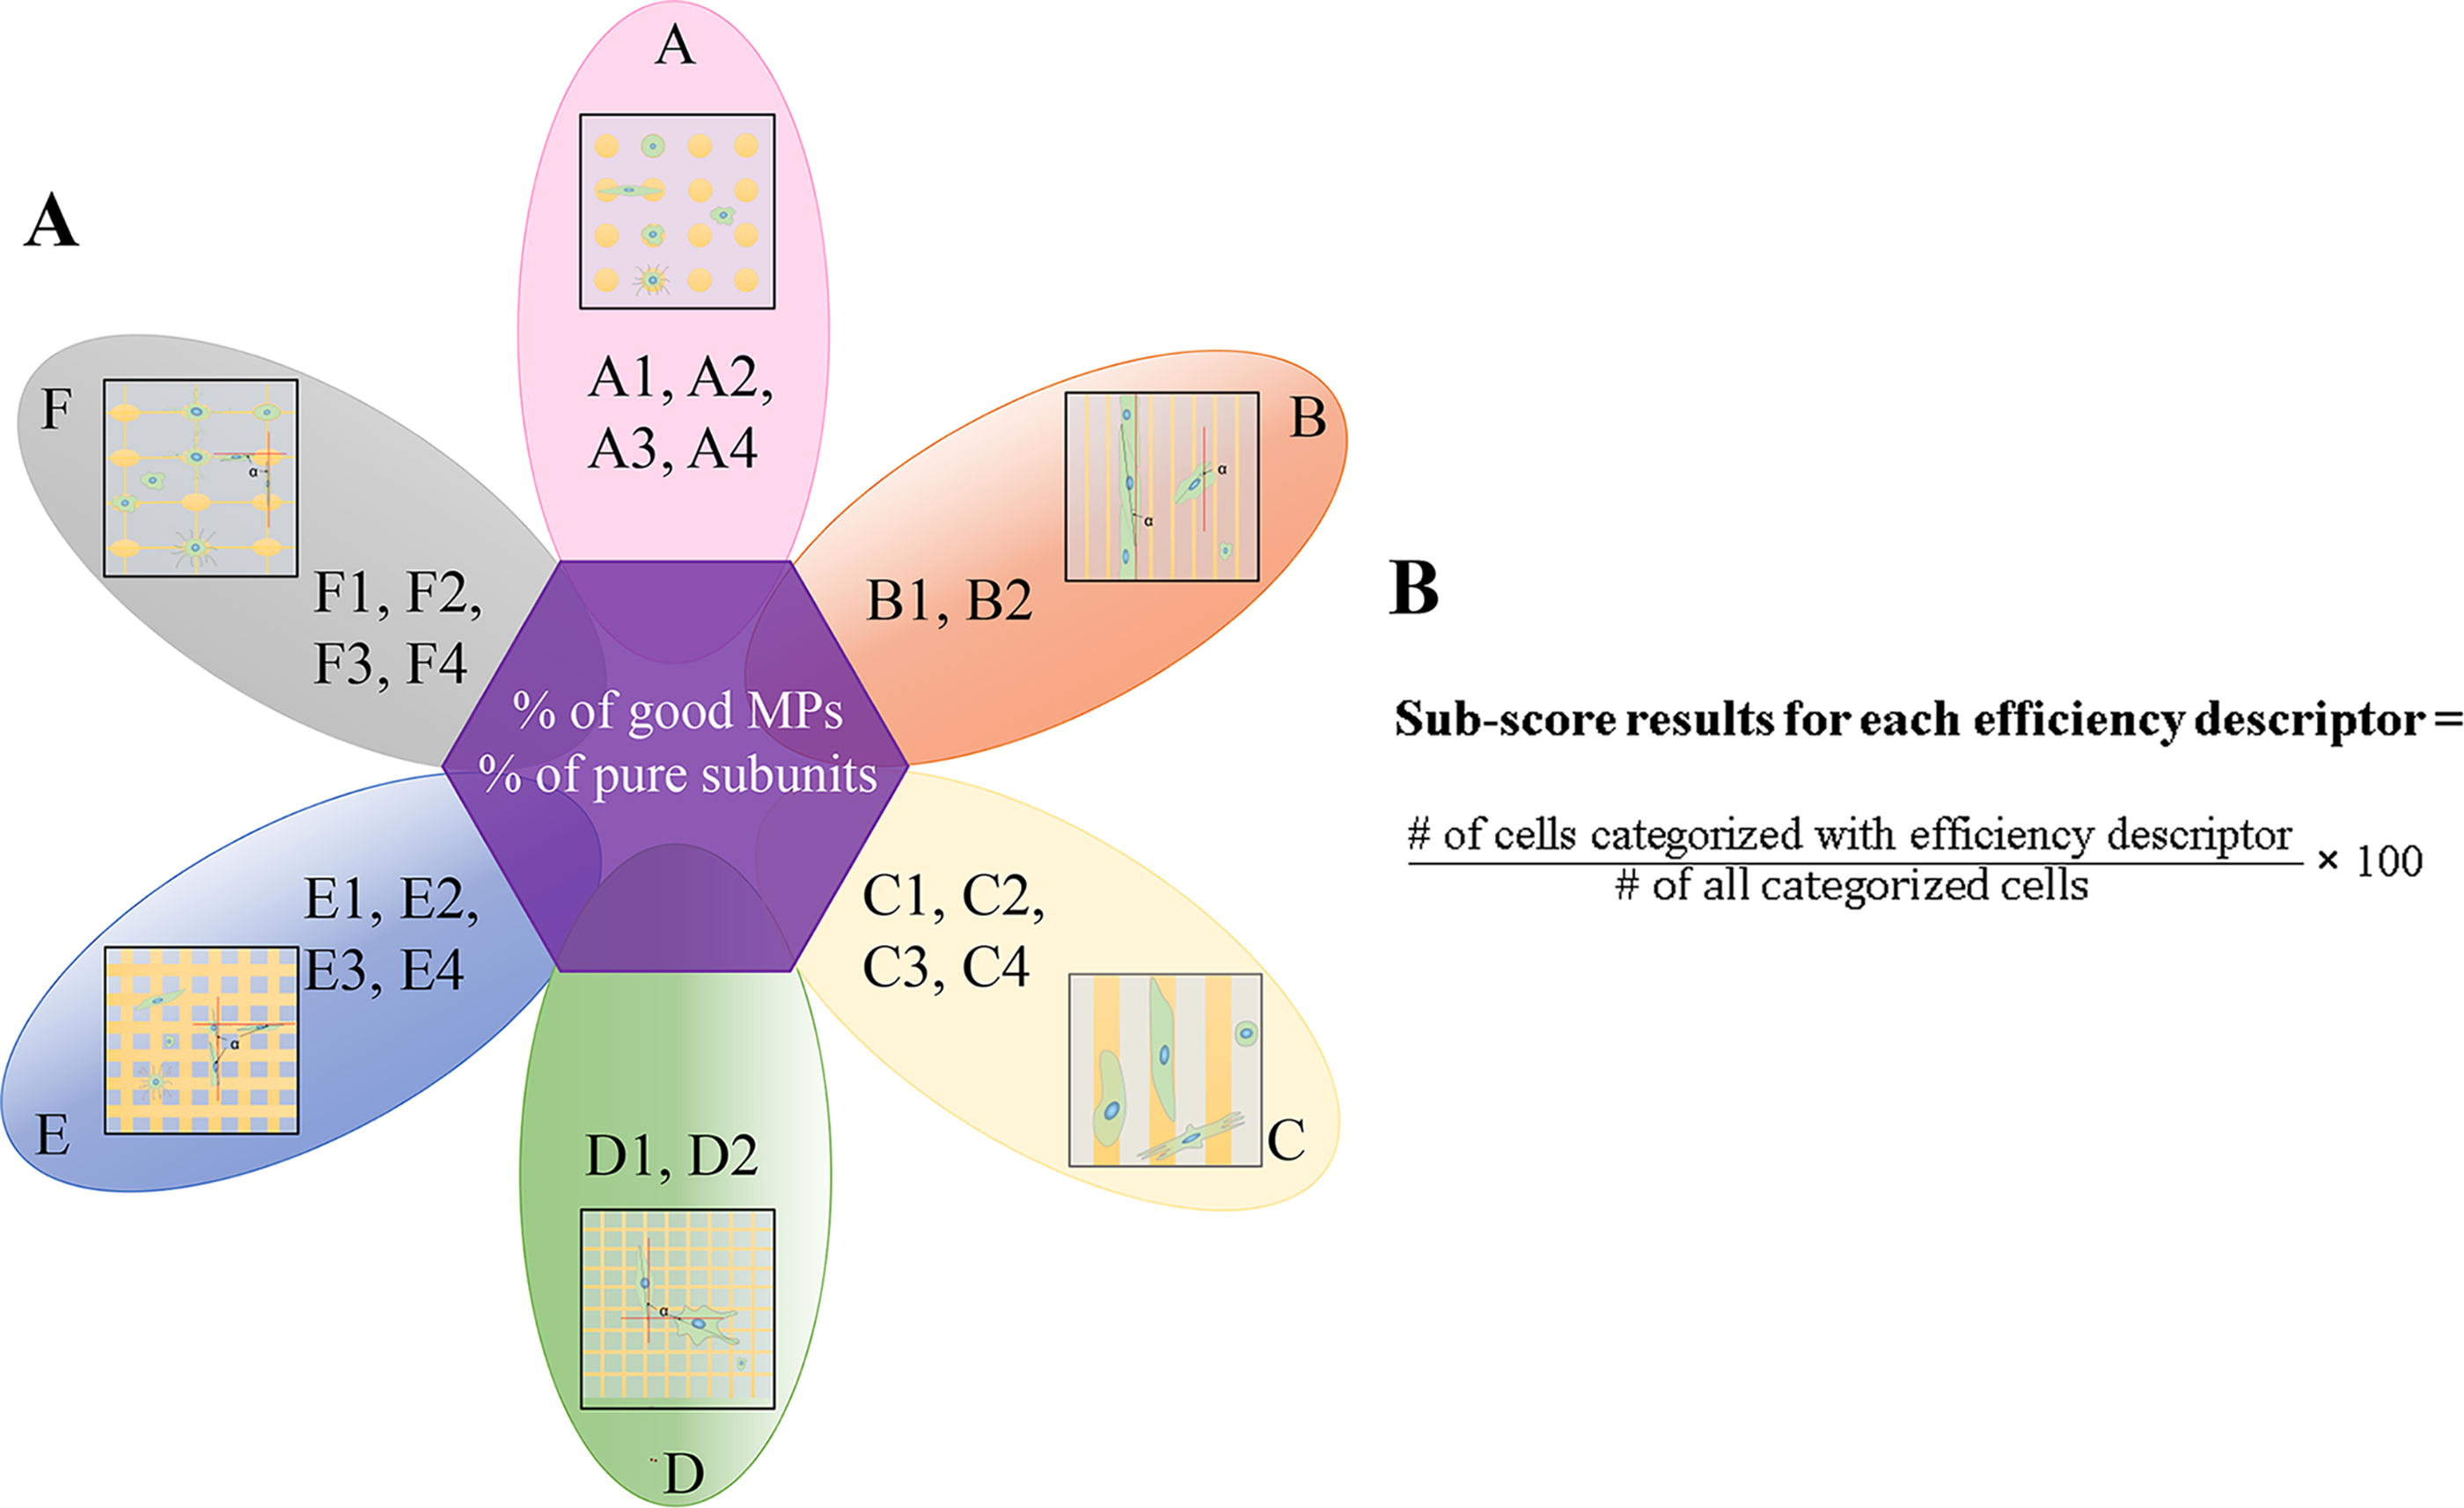
Summary of the MP types A–F, the efficiency descriptors that are suitable for each MP type, and the formula for calculating the subscore for each efficiency descriptor that can be applied to a given MP type.
To follow-up with an example, we used the circular MP type A, which is the most frequently investigated MP type in the literature. 4 Culturing human chondrocytes, the resident cell type of articular cartilage (Fig. 4), revealed that some cells adhered to the MPs without assuming a circular shape. These cells are encircled in Figure 4A by dotted blue lines. Each of those cells was categorized with the A1 efficiency descriptor, as A1 encodes a cell that adheres without assuming the MP shape. Examples of cells that were categorized with A2–4 are also given in Figure 4A. Using the formulas given in Figure 4B for calculating in percent how many cells had received each efficiency descriptor (Fig. 4C) revealed that the cells encircled by dotted blue lines (categorized with the A1 descriptor) represented 4% of all cells. In contrast, 63% of cells were categorized as A2, as those cells’ shapes were fully controlled by MPs (Fig. 4A: dotted orange line). Summarized, the MP fabrication quality subscore and the efficiency subscore results represent the MP evaluation score results.
Circular MPs used for controlling the shape of single cells (type A MP).
Statistical analysis
All data was analyzed using Microsoft Excel (2019) and SigmaPlot-14.0 (Systat). Data normality was tested with the Kolmogorov–Smirnov test. For comparing more than two groups, ANOVA on Ranks tests were performed for not normally distributed data. The Dunn’s Method was used as a pairwise post hoc test to compare groups with unequal sample sizes. Statistical differences and correlations were considered significant for p ≤ 0.05.
Experiment
Data demonstrating how MP efficiency subscoring alters the precision of cellular read-outs
Without subscoring MP efficiency or otherwise categorizing the adhering cells, all cells on a given MP surface are usually included in the final analysis results. However, as a tool to shape the cells, the efficiency of MPs to actually reach this goal is of central importance. In the following section, we present a case that statistically compares the effects of scoring versus not scoring MP efficiency and shows how this alters the final results of cellular readouts.
MP efficiency subscoring alters quantitative MP cell morphology read-outs
We cultivated human chondrocytes on type A circular MPs, measured their single cell morphology using the cell shape descriptors given in Figure 1B, and determined their cytoskeletal F-actin intensity and density. These two measurements were chosen because both can be understood as markers of cell phenotype and function. 1 We subscored each adhering cell using the efficiency descriptors for type A MPs (Table 2) and presented the results as a function of the efficiency descriptors. In parallel, we analyzed the morphology and cytoskeletal data of all cells, regardless of MP efficiency. Multiple significant differences in the morphology between scored versus not subscored cells were found. Most important, shape-controlled cells differed significantly from the results of all cells in cell width (minor axis), aspect ratio, circularity, and solidity (p < 0.05), demonstrating that using all measured and, thus, nonsubscored cell readouts as final results did not correctly represent the results of cells, which were effectively shape-controlled by MPs and selected by the A2 efficiency descriptor. Other significant differences included that the cells adhering to MPs, between MPs, and spanning MPs were significantly different in their cell length (major axis), compared to nonsubscored cells (Fig. 5, label “all”). Additionally, shape-controlled cells had a different length (major axis), compared to cells adhering to MPs and spanning MPs, indicating that cell length is scoring-sensitive (Fig. 5A). Other examples of shape descriptors such as the cell’s width, area, aspect ratio, circularity, and solidity were also measured and showed significant differences between including all cells into the results versus presenting the results for cells adhering to MPs, between MPs, and spanning MPs (Fig. 5B–F). Collectively, the results clearly revealed morphological differences between nonsubscored versus subscored cells. On a side note, Figure 5 demonstrates that some cells were situated “far away” from the MPs and their behavior was not affected by the MPs. It is meaningless to investigate the behavior of these cells in conjunction with MPs. Therefore, the unconditional inclusion of the readouts of these cells in the final data can be avoided by scoring this behavior with the efficiency descriptor A3 and excluding the A3-scored cells from the final data.
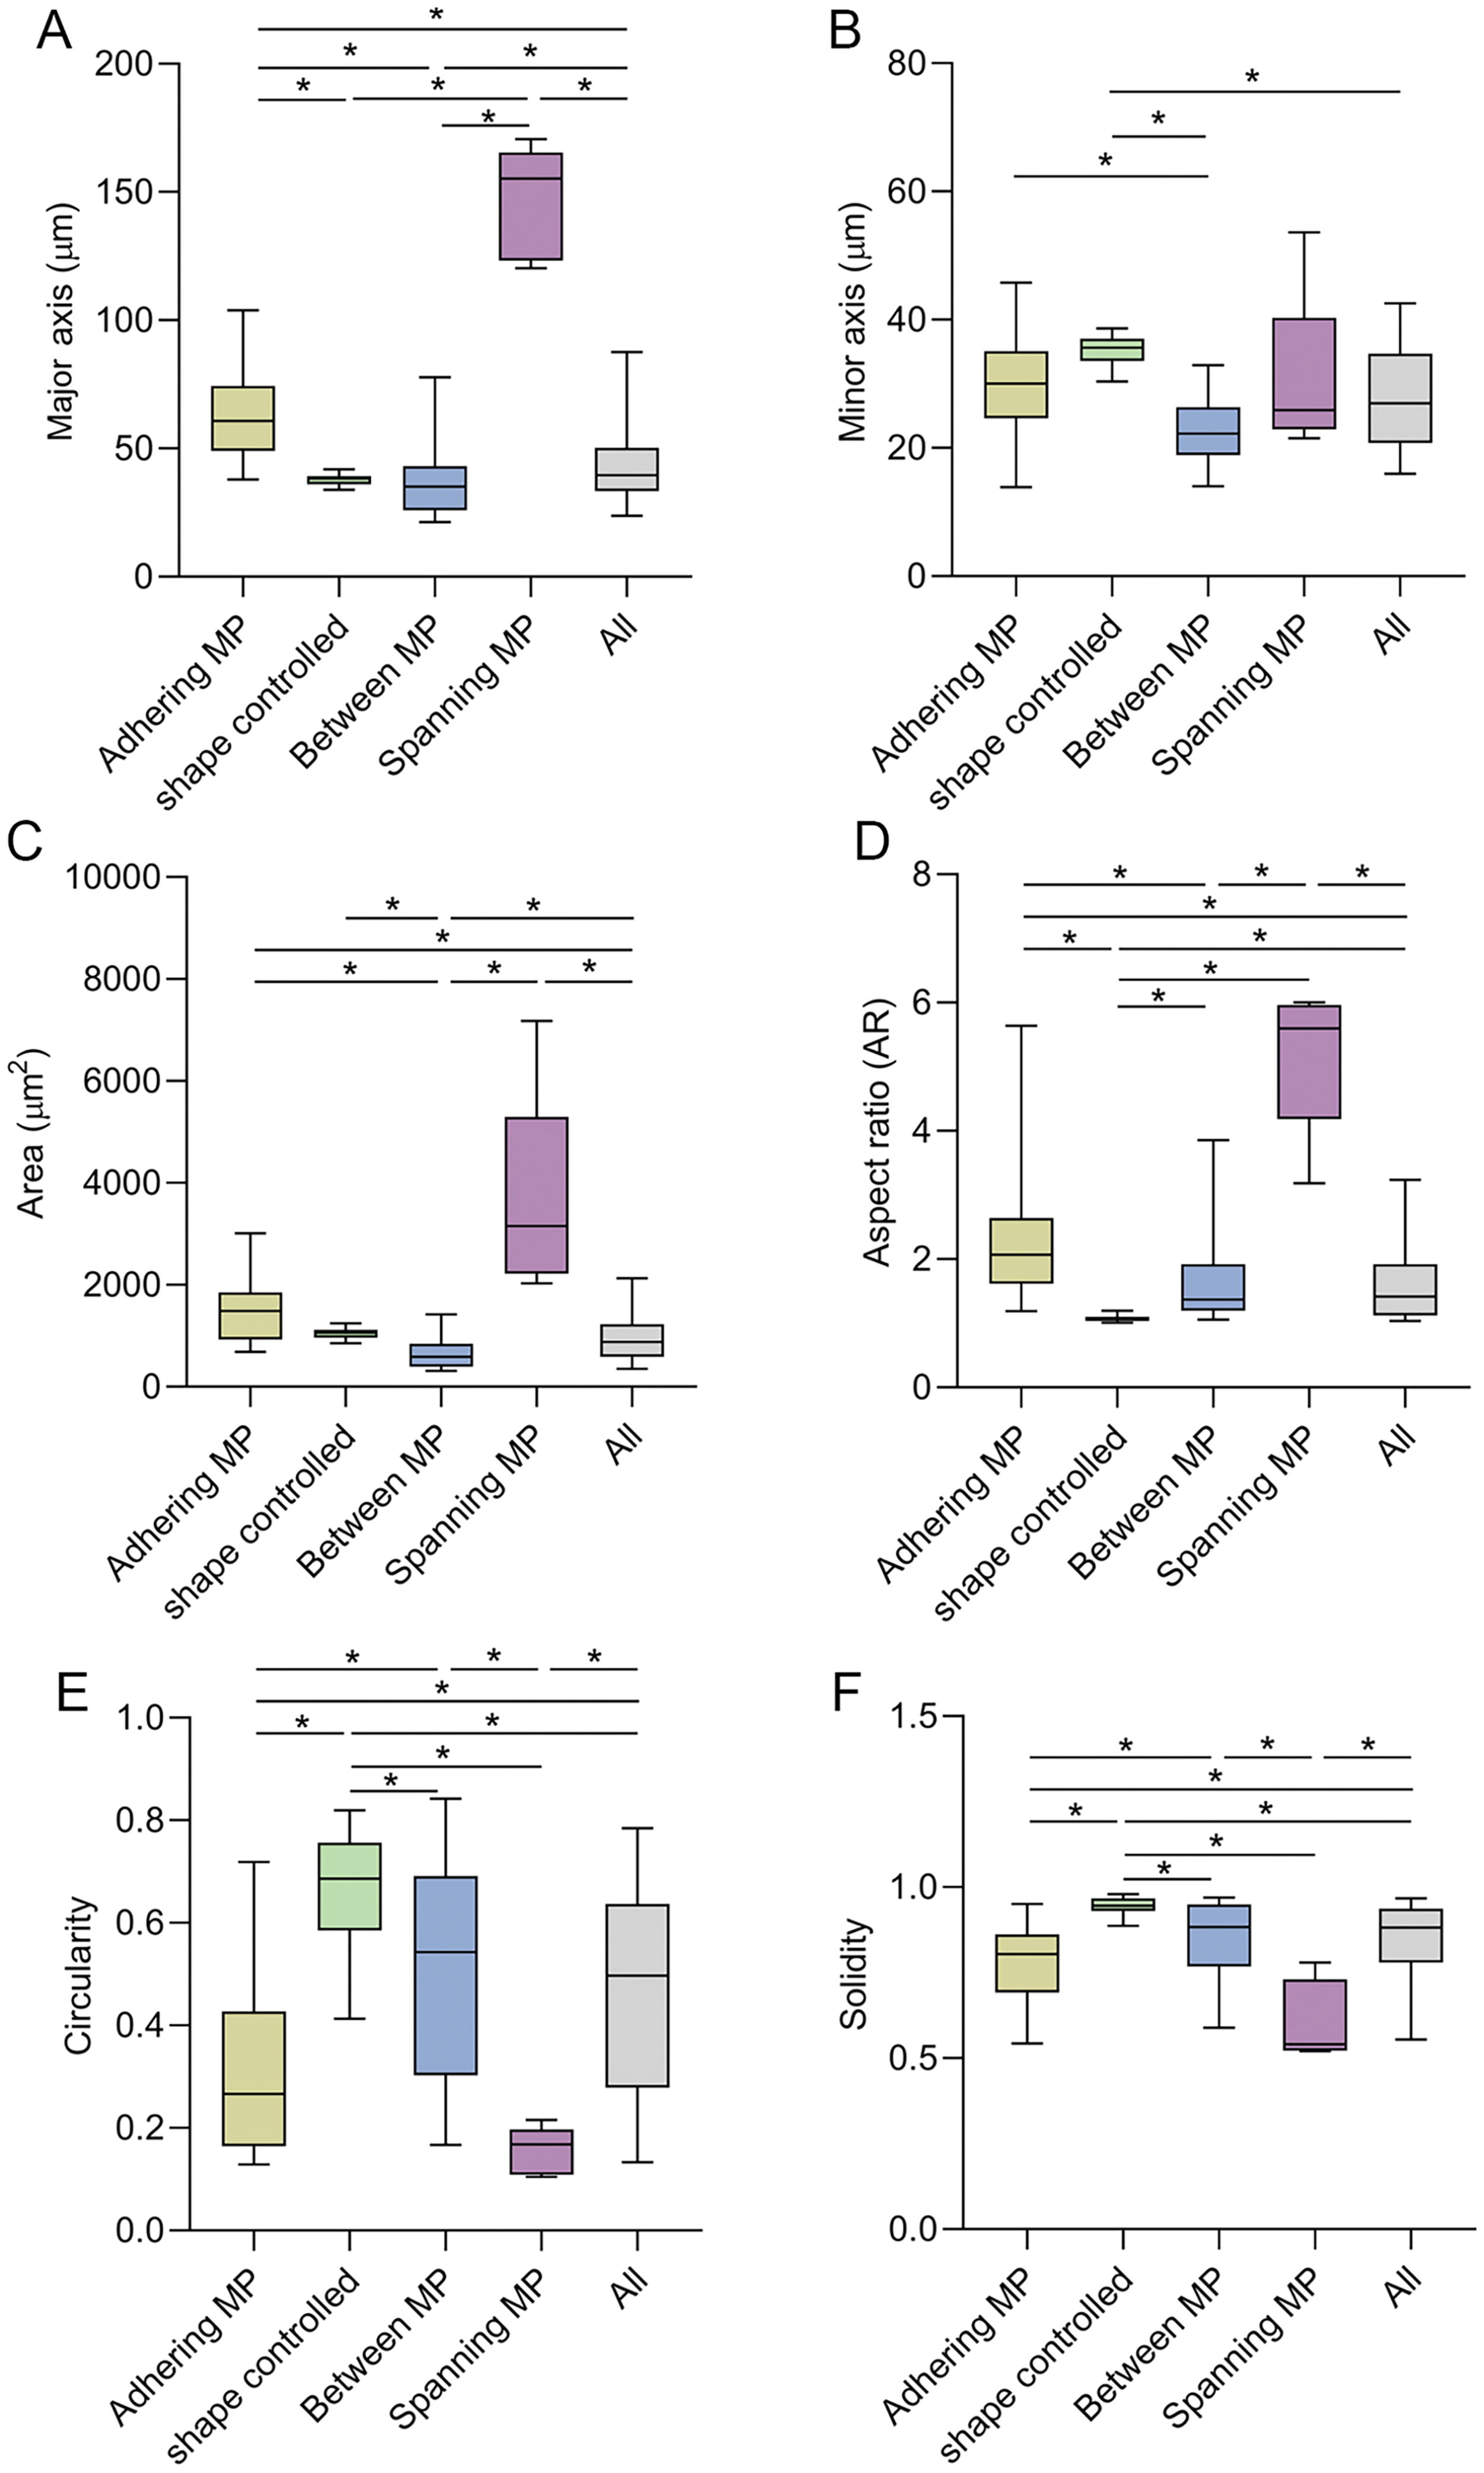
Subscoring versus not subscoring MP efficiency impacts quantitative single cell morphology measurements. Chondrocytes were cultured on circular MPs (type A MPs, since single cells adhered to single MPs) and classified into five categories: one category labeled “all” which includes all cells that were analyzed, regardless of the assigned efficiency descriptors, and one category for each efficiency descriptor for type A MPs (A1: adhering cells but no efficient shape control, A2: fully shape-controlled cells, A3: cells are situated between MPs, and A4: cells spanning across MPs; definitions and illustrations are given in Table 2). Six shape descriptors were measured for each cell:
MP efficiency subscoring alters quantitative MP single-cell cytoskeletal read-outs
To assess how efficiency subscoring affected the readout of cytoskeletal components, single cell F-actin intensity and density were measured by intensity-calibrated immunofluorescence microscopy. Each chondrocyte cultured on type A MPs was subscored with the type A MP efficiency descriptors A1–4. The results are presented as a function of the efficiency descriptors and were statistically compared (Fig. 6A). Most important, the F-actin intensity per cell was sensitive to scoring because significant differences were present between shape-controlled cells (A2 efficiency descriptor) versus all (nonsubscored) cells. In addition, by not subscoring and, hence, by including all cells F-actin content was significantly underestimated. Thus, F-actin intensity was scoring-sensitive. The F-actin density was also, in part, scoring-sensitive since significant differences were found between cells between MPs (A3 efficiency descriptor) versus all/nonsubscored cells (Fig. 6B). Collectively, these results suggest to only include the results of fully shape-controlled cells (A2 efficiency descriptor) into the final results, as those were the cells that responded morphologically and functionally to the MPs.
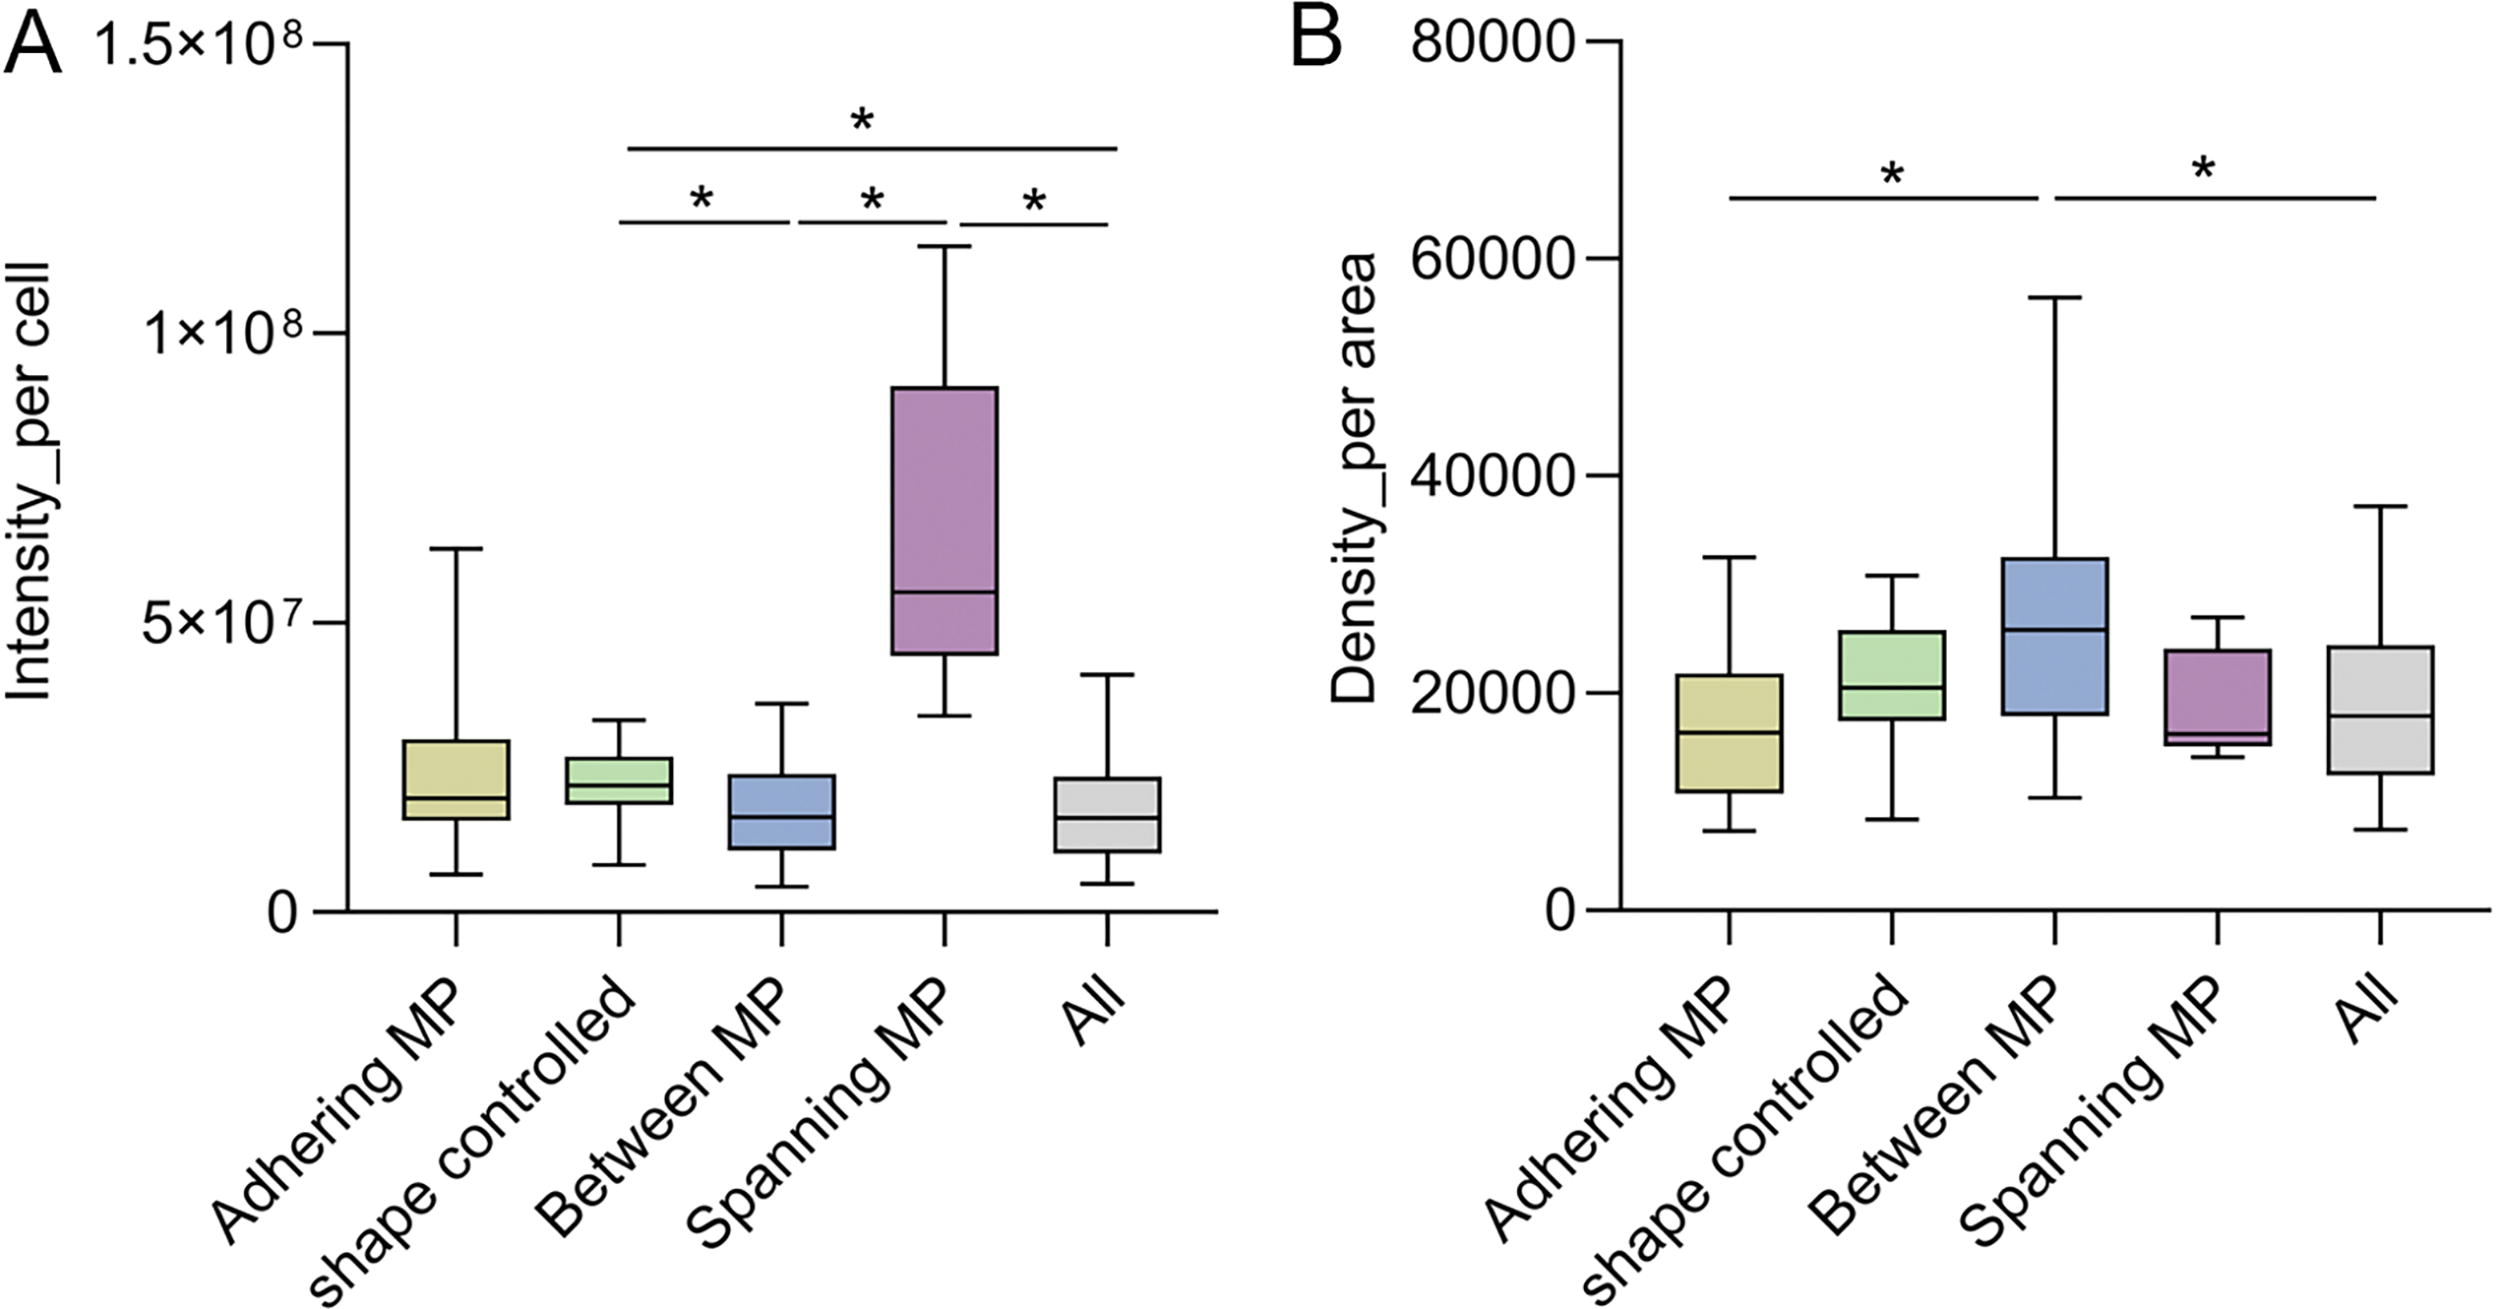
Scoring versus not subscoring MP efficiency impacts quantitative cytoskeletal F-actin measurements of single cells. Chondrocytes were cultured on circular MPs (type A MPs, since single cells adhered to single MPs) and classified into five categories: one category labeled “all” which includes all cells that were analyzed, regardless of the assigned efficiency descriptors, and one category for each efficiency descriptor for type A MPs (A1: adhering cells but no efficient shape control, A2: fully shape-controlled cells, A3: cells are situated between MPs, and A4: cells spanning across MPs; definitions and illustrations are given in Table 1). Given are the single cell F-actin intensity
Discussion
Advances in biological and medical applications are relevant for transformative improvements of therapies and, ultimately, patient outcomes. However, such advances are highly dependent on standardized quality reports of interest to interdisciplinary communities. Although MP technologies are widely used methods with clinical potential, 4 a standardized system for assessing MP’s efficiency to control single-cell shape and downstream functions does not exist. This study introduces a simple, easily replicable method to score MP fabrication quality and efficiency in four simple steps. For introducing an MP evaluation score, this study presented illustrations intended to serve as a reference “atlas” for user-specific MP type identification and how to assign the efficiency descriptors correctly to the cells for scoring their behavior. This study then presented scored fluorescent microscopic images of cells cultured on MPs to show specific examples of how to quickly apply the score and to easily generate scoring results.
Scoring MPs and the adhering cells can affect quantitative readouts of markers of phenotype. To formally support this point, the present study demonstrated the scientific benefit of applying versus not applying the here introduced score. For our readouts, which could be different in other studies, we cultured single cells on circular MPs, quantified the resulting morphology with quantitative cell shape descriptors, determined cytoskeletal F-actin with intensity-calibrated immunofluorescence microscopy, and compared the results as a function of scoring versus not scoring MP fabrication quality and effectiveness. Most important, the unconditional inclusion of all experimental read-outs (i.e., all MP data regardless of MP quality and effectiveness) into the final results significantly misjudged the experimental readouts, compared to including only the experimental read-outs of quality-controlled and effective MPs into the final results that were identified by using our simple four step MP evaluation scoring approach. Specifically, in our case, nonscoring and the unconditional inclusion of all MP data into the final results (i) underestimated F-actin intensity per cell and quantitative cell morphology descriptors such as circularity, solidity, and width and (ii) overestimated aspect ratio, compared to inclusion of experimental read-outs of quality-controlled and effective MPs. Our data shows that cellular protein measurements and single cell morphology descriptors are sensitive to subscoring MP efficiency, and that failing to subscore leads to inaccurate measurements of these parameters. On a side note, these evaluations were carried out on the samples used for actual experiments on human chondrocytes. These were chosen in conjunction with type A MPs since chondrocyte morphology changes from a round shape in healthy cartilage to a fibroblast-like shape in osteoarthritis, 1 a degenerative whole joint disease. MPs can be used to mimic such shapes in vitro and to study the associated functional changes, providing insights into disease mechanisms and potential therapeutic interventions. This highlighted that scoring can accompany quantitative, image-based experimental read-outs using the same samples. Overall, these results clearly demonstrated that scoring improved the precision of cellular readouts. Thus, the here introduced MP evaluation score can be used by investigators as criteria for improving the fabrication and usage of MPs, e.g., by excluding low-quality or ineffective MPs, enhancing data precision. Please note that the presents study used only circular (type A) MPs for demonstrating that scoring improved the precision of cellular readouts, whereas the here introduced simple methodology to score MP quality and effectiveness can be broadly used in conjunction with all currently available MP design types. This simple methodology will help in future studies to assess the extent to which the observed MP effects or even lack of effects on cell function are related to MP quality and efficacy. For example, the interpretation of quantitative read-outs of MP-controlled cells such as effects on the mRNA, protein and cellular level would greatly benefit from this approach as scoring may answer if lack of effects could be related to lack of MP quality or effectiveness. Thus, the fabrication subscore could be used as quantitative decision-supporting tool aiding in deciding whether or not particular MPs should be used for future experiments. This could save both time and costs for efficiently generating MP cells. Based on our experience, we recommend to define excellent MP fabrication quality by having at least 80% good MPs and 80% pure subunits, and to report the calculated subscore results (percentages) in future studies. This standardized approach will enable experimental reproducibility, allows comparisons across studies, and foster potential future clinical use of MPs.
In conclusion, the present study introduced a MP fabrication quality and efficiency score with four simple, quickly achievable scoring steps that (i) score MP and (ii) background fabrication quality, (iii) define the type of MP geometry (types A–F), and (iv) assign efficiency descriptors that best describe cell behavior. These steps produce subscore results, which collectively are the MP evaluation score results. This would help identify where potential problems lie, e.g., whether problems are associated with the fabrication and/or with the behavior of the investigated cells. Furthermore, we presented a dataset focused on cell morphology and protein to highlight how choosing shape-controlled cell morphology versus choosing an entire cell population impacts these two phenotype marker readouts. Collectively, this study presented scoring examples containing schematics and images that can help future investigators to correctly and quickly use the here introduced score. This approach can help foster standardization in studying and assessing MP quality and effectiveness in basic science and translational regenerative medicine, improving MP-medicated cell phenotype controllability as well as comparability across future studies.
Footnotes
Authors’ Contributions
B.R. and H.C.: Conceptualization. H.C., J.C.H.: Methodology. M.S.: Software. H.C., B.R., M.S., and M.L.H.: Data analysis. B.R.: Resources. H.C., BR., and M.L.H.: Writing—original draft. B.R. and M.L.H.: Draft editing. All authors have read and agreed to the published version of the article.
Disclosure Statement
There are no conflicts to declare.
Funding Information
This work was supported by German Research Council (Deutsche Forschungsgemeinschaft; DFG) [grant number RO2511/11–1]; the State Scholarship Fund of the China Scholarship Council [grant number CSC201908080215], and the Sino-German Mobility program of the Chinese-German Research Center of the National Science Foundation of China (NSFC) and the German Research Council (DFG) [grant number M-0332], National Natural Science Foundation of China (82402982).