
Abstract
Cardiovascular and inflammatory biomarkers in therapeutic hypothermia have been studied in cardiac arrest, but data on patients with ST-segment elevation myocardial infarction (STEMI) treated with therapeutic hypothermia are currently unavailable. A multiplex proximity extension assay allowed us to measure 157 cardiovascular disease (CVD) and inflammatory disease-related biomarkers in patients from the international, multicenter, and randomized trial; CHILL-myocardial infarction (MI) and to explore the associations of cardiovascular and inflammatory biomarkers. Blood samples were obtained from 119 patients with STEMI, randomized to hypothermia as adjunctive therapy to percutaneous coronary intervention (PCI) or standard care with PCI only. Blood samples were obtained at baseline (0 hour), 6, 24, and 96 hours post PCI, and stored at −80°C until they were analyzed by PROSEEK Multiplex CVD and PROSEEK Multiplex INF (Olink Bioscience, Uppsala, Sweden). Peak values from 6, 24, and 96 hours postrandomization were compared between treatment groups. One hundred fifty-seven cardiovascular and inflammatory biomarkers were evaluated. Peak values of four biomarkers (BDNF, DNER, CCL20, MMP3) were reduced in the hypothermia group as compared with the control group. In addition, seven markers were slightly elevated in the hypothermia group (OPG, FGF21, FS, IL12B, PRL, TIM, IL6). In a prespecified subgroup analysis of anterior infarctions, two additional markers were reduced (PTX3 and SELE). In this explorative proteomic study from the randomized trial CHILL-MI, four biomarkers were identified as having reduced peak plasma values in patients with STEMI treated with therapeutic hypothermia as adjunctive therapy to PCI as compared with patients treated with standard care of PCI. In addition, seven biomarkers were elevated in the group treated with hypothermia therapy. The effect of hypothermia on biomarker peak values was modest, possibly due to a low reduction in mean body temperature. Whether a faster and deeper cooling results in more pronounced effects is yet to be established.
Introduction
I
In recent years, biomarkers have been widely studied in attempts to understand different cell functions and their role in cardiovascular disease (CVD) and a number of biomarkers have been studied with regard to different cardiovascular outcomes. A number of studies have been conducted on therapeutic hypothermia in cardiac arrest, but no recent studies have been conducted on patients with STEMI treated with percutaneous coronary intervention (PCI) and hypothermia (Callaway et al., 2008; Fries et al., 2009; Bro-Jeppesen et al., 2014, 2016; Liu et al., 2016). Recently, developed bioassays have facilitated the studying process of these biomarkers; the multiplex proximity extension assays (PEA) from Olink (Olink Bioscience, Uppsala, Sweden) analyze as many as 96 biomarkers simultaneously with only 1 μL serum. The reagent kit Proseek Multiplex CVD I96 × 96 (www.olink.com/wp-content/uploads/2015/12/0968-v1.2-Panel-list-CVD-I_final.pdf) combines and measures 92 CVD-related biomarkers, and Proseek Multiplex Inflammation I96 × 96 (www.olink.com/wp-content/uploads/2015/12/1029-Proseek-Multiplex-Inflammation-I_Panel-content_final.pdf) measures 92 inflammatory disease-related biomarkers.
Using the CHILL-MI cohort, we performed a retrospective biomarker analysis combining the CVD and inflammatory panel testing the overall hypotheses that therapeutic hypothermia affects the values of the studied biomarkers.
Materials and Methods
Patients
Patients with STEMI who underwent PCI between July 2011 and March 2013 were randomized to hypothermia induced by rapid infusion of cold saline and endovascular cooling or standard care in the CHILL-MI trial. Patients with cardiac arrest, previous MI, previous PCI or coronary artery bypass grafting, known congestive heart failure, end-stage kidney disease or hepatic failure, recent stroke, coagulopathy, pregnancy, or Killip class II to IV at presentation were excluded. Hypothermia was initially induced by forced infusion of 4°C cold saline by using pressure bags. The volume administered was 600–2000 mL, according to a weight-adjusted schedule (10 mL/kg for anterior STEMI and 20 mL/kg for inferior STEMI). Cooling was maintained for 1 hour after reperfusion, followed by spontaneous rewarming, or continued until the end of the procedure if the procedure took more than 1 hour (Erlinge et al., 2014). The mean temperature at reperfusion was 34.7 ± 0.6°C for the hypothermia group. Baseline differences are visualized in Table 1. Blood samples were collected at baseline before the start of hypothermia and PCI (0 hour), 6 hours post PCI, 24 hours post PCI, and 96 hours post PCI by peripheral venous puncture.
Continuous variables are presented as means ± standard deviation. BMI, body mass index; STEMI, ST-segment elevation myocardial infarction.
Study design
All patients from the CHILL-MI trial were included. A total of 61 patients were treated with hypothermia, and 59 were treated with standard care. Blood samples were available for 119 patients, 61 of whom were treated with hypothermia and 58 of whom were treated with standard care. Blood samples were centrifuged and stored at a temperature of −80°C until they were analyzed by Olink Bioscience. The analysis of blood samples took place in 2015. The study was approved by the Ethics Committee of Lund University (in agreement with the declaration of Helsinki), and all participants provided informed consent. The primary analysis was a comparison of mean biomarker peak values between the hypothermia and the standard care group. An explorative, prespecified subgroup analysis of anterior infarctions was conducted as well.
Assay method
One microliter of plasma EDTA samples, stored at a temperature of −80°C, was prepared according to the manufacturer's instructions and analyzed by using a high-throughput technique, Proseek Multiplex CVD I96 × 96, and Proseek Multiplex Inflammation I96 × 96. The PEA design has been previously described in detail (Assarsson et al., 2014). Briefly explained, plasma samples of 1 μL were mixed with a 3 μL incubation mix containing pairs of oligonucleotide-labeled antibodies. The mixture was incubated overnight, during which antibodies bound to their respective target in the blood sample, bringing the probe of oligonucleotides into close proximity. Unique annealing sites on the oligonucleotides allowed pair-wise binding of matching probes. A DNA polymerase was then added, leading to joining of the two oligonucleotides, forming a polymerase chain reaction (PCR) template. A combined extension and PCR reagent mix of 96 μL was then added and incubated for 5 minutes, after which the plate was transferred to a thermo cycler, allowing for 17 cycles of DNA amplification of all 96 sequences in parallel, with a universal primer. After DNA amplification, uracil-DNA glycosylase digest DNA templates and the remaining universal primers were added. The sample mix was then quantified by microfluidic real-time PCR. The measurements were then converted into normalized protein expression units on a log2-scale where high protein values corresponded to a high protein concentration and not absolute quantification.
Biomarkers with missing values or values below the limit of detection (LOD) exceeding 15% were excluded from the primary analysis. The excluded markers were: IL-1RA, mAmP, ITGB1BP2, Ca125, IL-17A, IL-20RA, IL2RB, IL-1alpha, IL-2, TSLP, IL-10RA, IL-22RA1, PDL1, IL-24, IL-13, ARTN, TNF, IL-20, IL-33, IFNgamma, IL-4, LIF, NRTN, ST1A1, IL-5, and PSGL1, leaving a total of 131 biomarkers in the final analysis. A list of all markers and their abbreviations is shown in Table 2. For markers in the final analysis, values below LOD were replaced by LOD/2. The peak values from the measurements at 6, 24, and 96 hours were analyzed.
A total of 131 biomarkers were included after excluding biomarkers with values below limit of detection >15%.
Biomarkers included in the cardiovascular panel as well.
Statistics
Continuous variables are expressed as means with standard deviations (SD). A test for normality was done with visual inspection through a histogram for each individual marker. Independent t-tests were used to compare means between the hypothermia and standard care group; the assumptions were verified. No adjustment for multiple testing was done. A prespecified subgroup analysis of anterior infarctions was conducted with respect to all biomarkers. Bootstrapping was done for internal validation with 1000 samples. A two-sided p < 0.05 was considered statistically significant. All statistical analyses were performed by using R version 3.2.2 for Macintosh, The R Foundation for Statistical Computing, Vienna, and STATA version 14.1 for Macintosh, StataCorp, Texas.
Results
A total of four markers were reduced in the hypothermia group as compared with the controls. These biomarkers were BDNF (hypothermia group mean ± SD, 5.39 ± 3.93; standard care group 7.04 ± 3.78, p = 0.021), DNER (hypothermia group 6.97 ± 0.22; standard care group 7.07 ± 0.22, p = 0.022), CCL20 (hypothermia group 6.88 ± 0.95; control group 7.38 ±1.41, p = 0.025), and MMP3 (hypothermia group 1.73 ± 0.73; control group 2.03 ± 0.80, p = 0.034). Likewise, a number of biomarker peak values were elevated in the hypothermia group compared with the control group (Table 2). For complete results on all biomarkers, see Supplementary Table S1 (Supplementary Data are available online at www.liebertpub.com/ther). A heatmap depicting all biomarker values is presented in Figure 1. Mean peak value and 95% confidence interval at baseline, 6, 24, and 96 hours postrandomization for biomarkers with significant differences are presented in Figure 2. In the prespecified subgroup analysis of anterior infarctions, only two biomarkers were reduced in the hypothermia group. These were PTX3 (hypothermia group 2.61 ± 0.74; control group 3.34 ± 1.00, p = 0.006) and SELE (hypothermia group 4.38 ± 0.68; control group 4.80 ± 0.74, p = 0.039) (Table 3).

Heatmap depicting individual peak values for each biomarker. Heatmap visualizing individual peak values for each individual biomarker clustered on biomarkers. Superior left heatmap visualizes peak values for cardiovascular biomarkers in the group treated with therapeutic hypothermia clustered on markers. Superior right heatmap visualizes peak values for inflammatory biomarkers in the group treated with therapeutic hypothermia clustered on markers. Inferior left heatmap visualizes peak values for cardiovascular biomarkers in the standard care group clustered on markers. Inferior right heatmap visualizes peak values for inflammatory biomarkers in the standard care group clustered on markers. Letter labels can be viewed online at www.liebertpub.com/ther
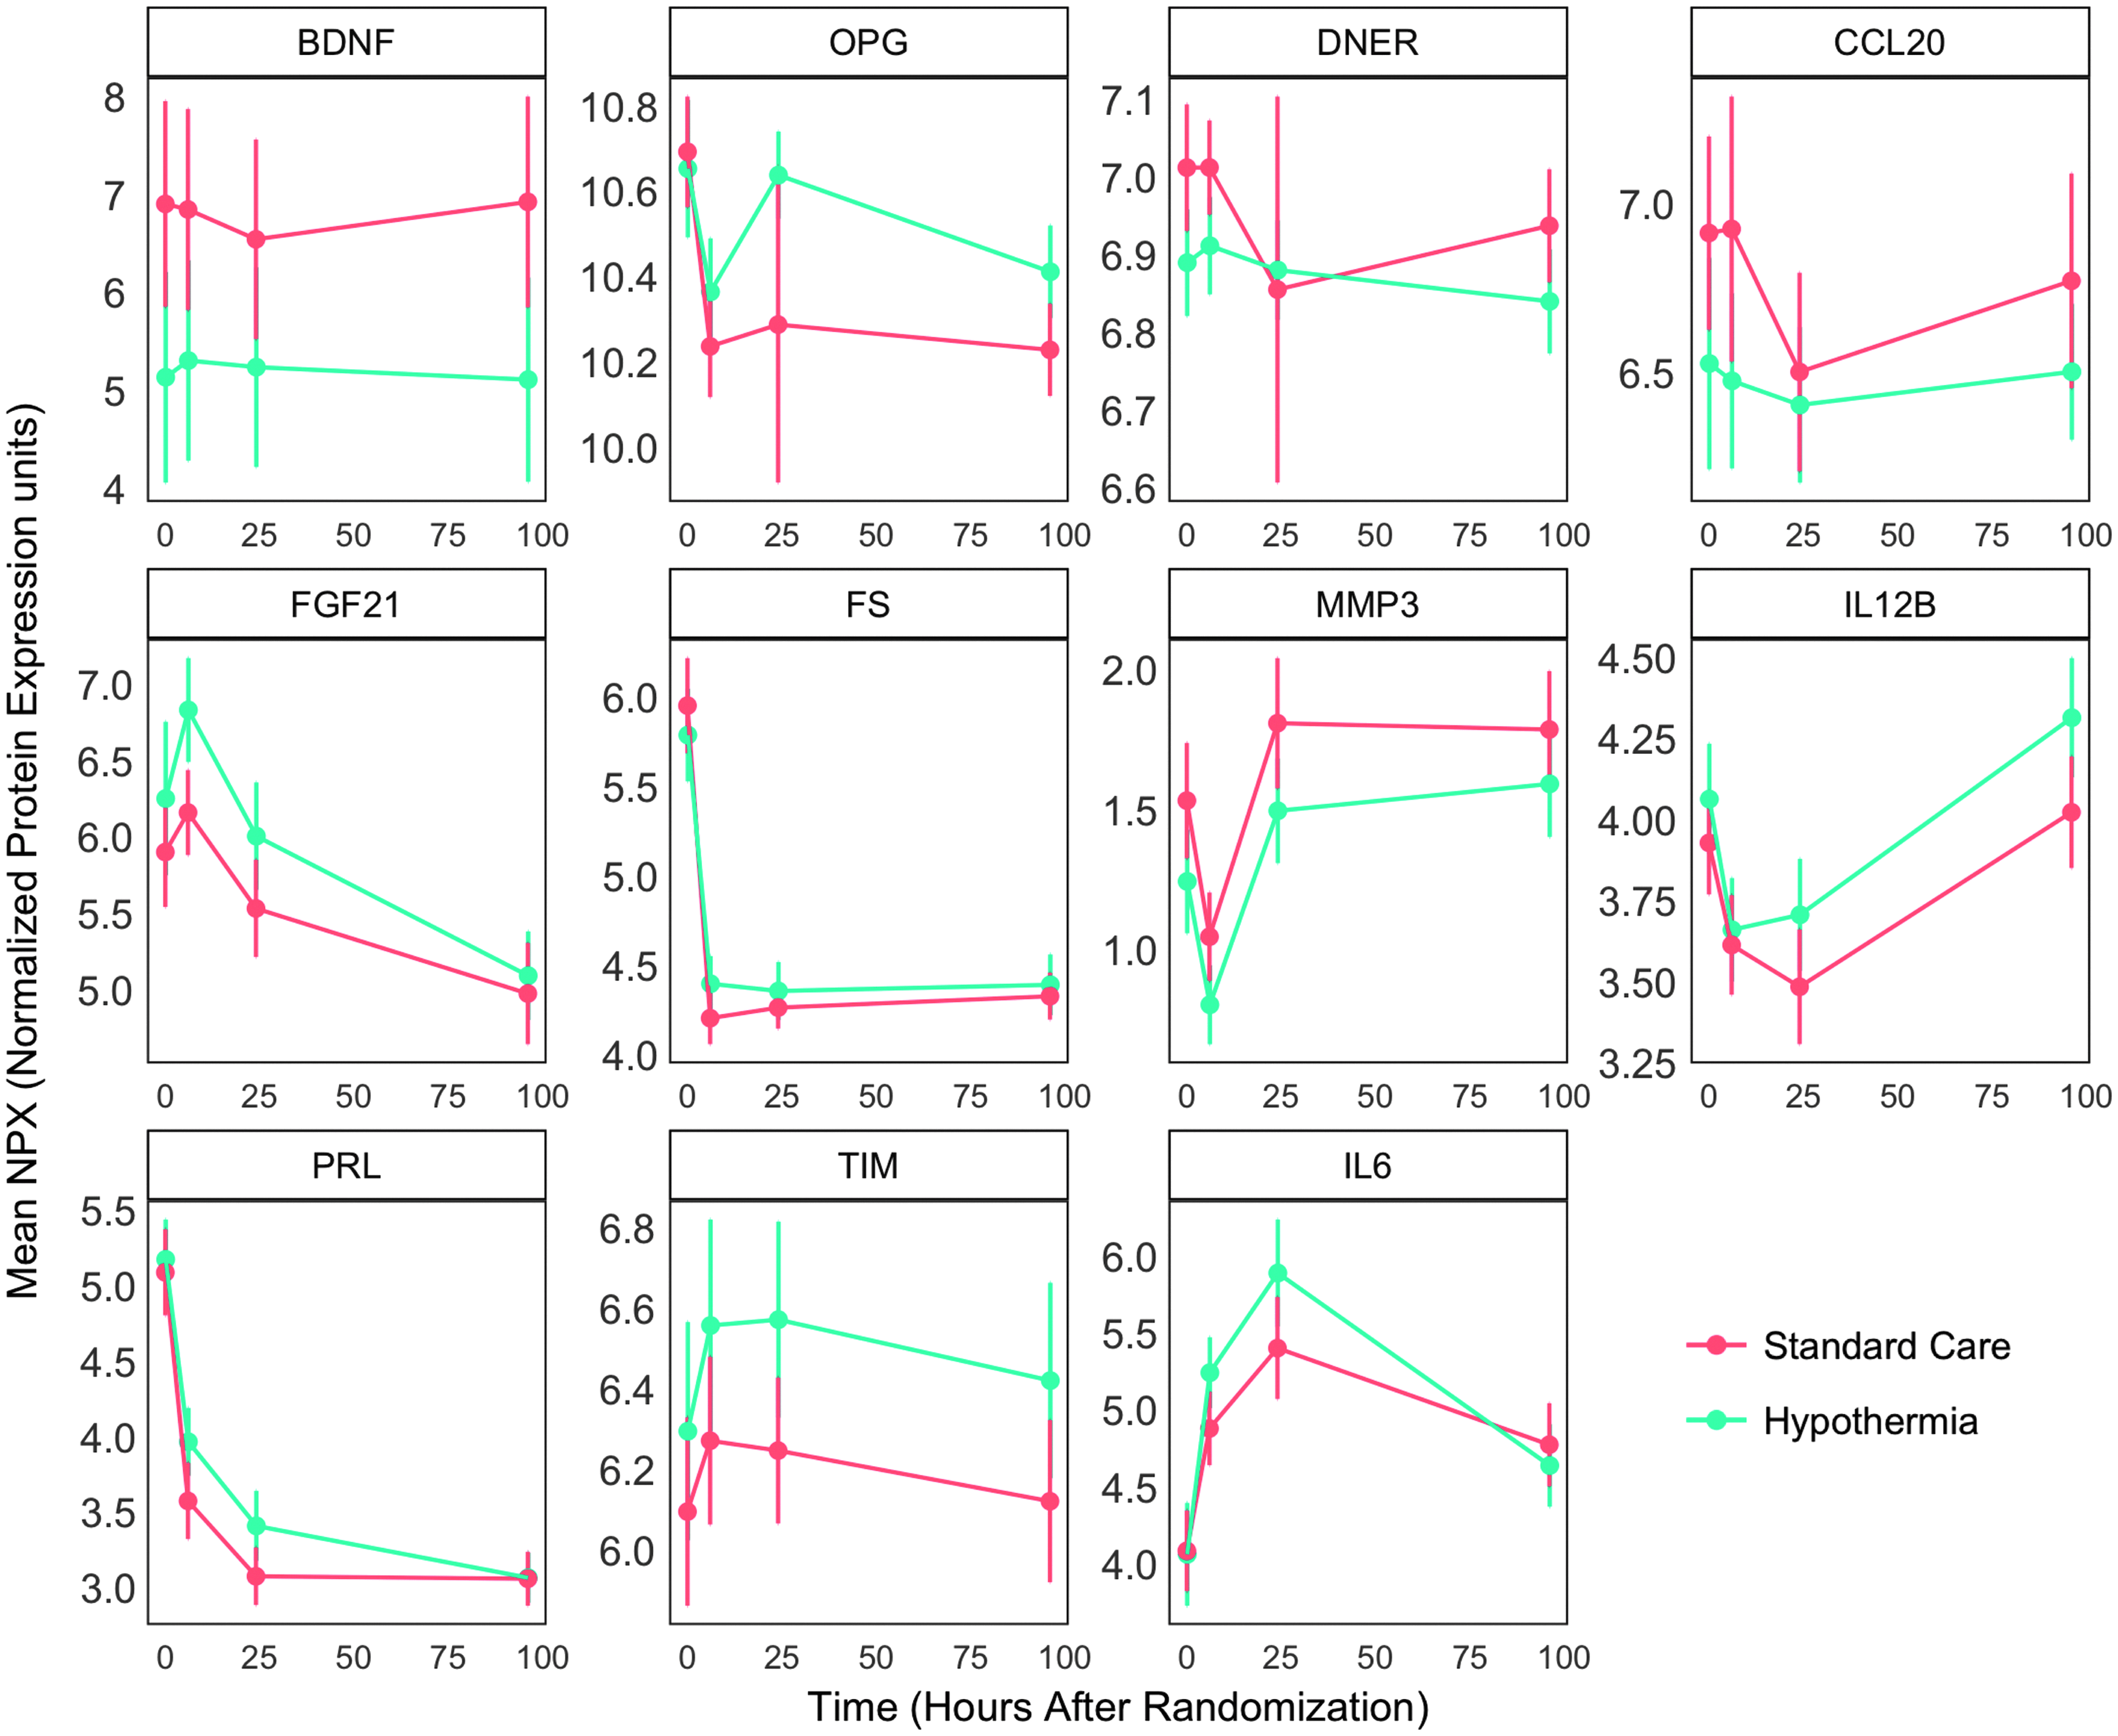
Line plots for biomarkers with significant differences in the primary analysis. Presented are mean values and confidence intervals at baseline, 6, 24, and 96 hours postrandomization for biomarkers that were significantly reduced or elevated in the primary analysis.
Results for the biomarkers with p < 0.05. Results for all biomarkers are shown in Supplementary Table S1.
BDNF, brain-derived neurotrophic factor; CCL20, C-C motif chemokine 20; DNER, delta and Notch-like epidermal growth factor-related receptor; FGF21, fibroblast growth factor 21; FS, follistatin; IL6, interleukin 6; IL12B, interleukin-12 subunit beta; MMP3, matrix metalloproteinase 3; OPG, osteoprotegrin; PRL, prolactin; TIM, TIM-1.
Discussion
In this large explorative proteomic CHILL-MI substudy, we observed minor differences in peak values of 11 out of 131 cardiovascular and inflammatory biomarkers in patients with STEMI treated with therapeutic hypothermia before PCI as compared with standard care with PCI only. Hypothermia suppressed the levels of four biomarkers (BDNF, DNER, CCL20, and MMP3) and elevated the levels of seven biomarkers (OPG, FGF21, FS, IL-12B, PRL, TIM, and IL-6). In the prespecified subgroup analysis of anterior infarctions, hypothermia reduced the levels of two biomarkers, PTX3 and SELE.
Biomarkers in patients treated with hypothermia after cardiac arrest have been studied with conflicting results (Callaway et al., 2008; Fries et al., 2009; Bro-Jeppesen et al., 2014, 2016). Some studies have shown elevated IL-6 levels in patients treated with hypothermia; however, the results could not be replicated in a larger study (Fries et al., 2009; Bro-Jeppesen et al., 2014, 2016).
The exact mechanism behind the effects of therapeutic hypothermia in ischemic settings has not yet been established. A number of mechanisms have been proposed (Delhaye et al., 2012). Further studies utilizing large sets of biomarkers may, therefore, provide insights into the mechanism behind the cardioprotective effects of adjunctive hypothermia. In the CHILL-MI trial, mean body temperature was only reduced by 1.3°C in the hypothermia group compared with the standard care group. Whether a faster and deeper cooling results in a more pronounced difference in levels of biomarkers between the hypothermia and standard care group remains unknown.
Biomarkers
Of the biomarkers that were suppressed by hypothermia, BDNF had the highest mean difference. BDNF is a growth factor that is expressed in the nervous system, has previously been studied in neurodegeneration, and has a recently discovered role as a regulator of cardiac contraction force mediated by the truncated TrkB.T1 receptor in cardiomyocytes (Fulgenzi et al., 2015). DNER is a transmembrane protein that is primarily found in the central nervous system, with a largely unknown function, but it has been associated with body mass index (Larsson et al., 2015). CCL20 is a chemokine ligand that binds to the CCR6 receptor on TH17 and regulatory Treg cells and becomes upregulated after an inflammatory stimulus (Lee et al., 2013). MMP3 belongs to the group of matrix metalloproteinases, a family of structurally related proteases that are capable of degrading extracellular matrix proteins. They have been widely studied in inflammatory joint disorders and are expressed by smooth muscle cells, macrophages, and atherosclerotic and injured vessels (Woessner, 1991; Rajavashisth et al., 1999). Elevated levels of MMPs have been observed after acute MI, and there is evidence associating MMP3 genes to the development of coronary artery disease (Niu and Qi, 2012). OPG acts as an endogenous inhibitor for receptor activator of nuclear factor kappa B ligand (RANKL) and functions as a negative regulator of bone resorption (Simonet et al., 1997). It has been associated with bone diseases such as osteoporosis and Paget's disease. When OPG binds to the receptor activator of nuclear factor kappa B (RANK), it prevents the mediated nuclear factor kappa B activation, a central acting transcription for immune-related genes and a key regulator of inflammation, innate immunity, and cell survival and differentiation (Anderson et al., 1997; Simonet et al., 1997; Krakauer, 2008). FGF21 is a fibroblast growth factor, and increased levels have been associated with diabetes mellitus and overnutrition. (Cheng et al., 2011; Yan et al., 2011). It stimulates glucose uptake in adipocytes only (Kharitonenkov et al., 2005). Follistatin (FS) is an inhibitory protein of pituitary FSH as well as an inhibitory protein neutralizing the bioactivity of the TGF-β superfamily (Mather et al., 1997). IL12B is produced by dendritic cells, monocytes, and macrophages and is an important regulator of T-Helper 1 cells and innate immune responses (Trinchieri et al., 1992; Hsieh et al., 1993; Macatonia et al., 1995; Gately et al., 1998; Langrish et al., 2004). A genetic association with Takayasu arteritis has been observed (Saruhan-Direskeneli et al., 2013). PRL is a hormone that is secreted by the anterior pituitary gland and acts as a growth regulator for many tissues. It is essential for lactation but may also play a role in cell survival as an apoptosis suppressor and in the innate immune system by activation of nuclear factor kappa B (Bole-Feysot et al., 1998; Brand et al., 2004; Boutet et al., 2007). TIM-1 is a membrane receptor for human hepatitis virus A, is expressed on Th2 cells, and has been found to costimulate T-cell activation (Umetsu et al., 2005). Among the elevated biomarkers, perhaps IL6 is the most interesting and well-studied biomarker in inflammatory and cardiovascular settings. IL6 is a pro- and an anti-inflammatory cytokine that is secreted by T-cells and macrophages at sites of acute and chronic inflammation, and it acts as an immunological switch between innate and adaptive immunity. IL6 is considered to be protective in the acute phase response but pathogenic when chronically elevated (Torre-Amione et al., 1996; Dawn et al., 2004; Hirota et al., 2004; Smart et al., 2006; Braunwald, 2008; Fontes et al., 2015).
Anterior infarctions
A reduction of IS/MaR of 33% was observed in the exploratory analysis of early anterior infarctions in the CHILL-MI trial, indicating that the largest effect of hypothermia may be found in the larger infarctions. Understanding the pathophysiological mechanisms behind the effects of hypothermia is, therefore, an important objective in improving the treatment. In the sub-group analysis on anterior infarctions, PTX3 is one of the two biomarkers that were significantly reduced and is, therefore, a potentially interesting biomarker (Table 4). It belongs to the pentraxin superfamily and is a component of the humoral arm of the innate immunity, expressed by neutrophils, macrophages, endothelial cells, fibroblasts, and smooth muscle cells among others (Bottazzi et al., 2010). Increased plasma levels of PTX3 have been observed in patients with MI and atherosclerosis, and they have been associated with CVD and all-cause mortality independent of C-reactive protein and other CVD risk factors (Jenny et al., 2009, 2014). PTX3 has also been described to induce endothelial dysfunction through a P-selectin/MMP-1 pathway (Carrizzo et al., 2015). PTX3 has been proposed to have a cardioprotective role in myocardial ischemia, as studied in PTX3-deficient mice (Salio et al., 2008; Shimizu et al., 2015). No differences were observed for PTX3 or SELE in the primary analysis. Whether this finding is specific to anterior infarctions or related to the higher myocardial salvage observed in this subgroup remains to be explored.
Results for the biomarkers with p < 0.05 in the subgroup analysis of anterior infarctions.
PTX3, pentraxin-related protein; SELE, E-selectin.
In conclusion, hypothermia altered levels of a number of biomarkers that are involved in the innate immune system. The effect of hypothermia on these biomarkers was only minor, suggesting that either (1) hypothermia does not affect the inflammatory response and CVD biomarkers or (2) the reduction in mean body temperature provided by forced saline infusion was not sufficient to alter the peak values of the studied biomarkers more extensively, thus raising the question of whether a more aggressive cooling may produce more pronounced effects.
Strengths and limitations
Due to the limited sample size, no internal validation on a test sample was performed and instead only bootstrapping was used to test the stability of the model. Another important limitation is using peak values as a measure of effect. If hypothermia shifts the time to peak values rather than affecting the absolute value, then information regarding these relations will be missed. Due to the nature of this study as an explorative hypothesis-generating study, no adjustment for multiple testing was done and the results should, therefore, be interpreted with caution. Numerical differences existed between groups with regard to smoking, hypercholesterolemia, and anterior versus inferior infarctions; however, the statistical differences were left unexplored, as the cohort was randomized to therapeutic hypothermia or standard care, which are the testing groups in our study. Adjusting for these factors may have altered the results, although this remains unknown. The strength of our study lies in it utilizing a multi-center, international, and randomized population from a well-known clinical trial. Furthermore, the PEA used to analyze the biomarkers utilizes small amounts of bio bank material, yet yielding a large number of biomarker measurements in a single batch and, thus, minimizing batch variation. Although the PEA has been validated, prior studies have been conducted with different assay methods and this may complicate external comparisons of the results.
Conclusion
In this explorative proteomic study from the randomized trial CHILL-MI, four biomarkers were identified as having reduced peak plasma values in patients with STEMI treated with therapeutic hypothermia as adjunctive therapy to PCI as compared with patients treated with standard care of PCI. In addition, seven biomarkers were elevated in the group treated with hypothermia therapy. The effect of hypothermia on biomarker peak values was modest, possibly due to a low reduction in mean body temperature. Whether a faster and deeper cooling results in more pronounced effects is yet to be established.
Footnotes
Acknowledgments
This work was supported by: Swedish Heart and Lung Foundation; Swedish Scientific Research Council; Knut and Alice Wallenberg Foundation; Swedish Foundation for Strategic Research; and ALF and Skåne University Hospital Funds. The authors would like to thank all investigators in the CHILL-MI studies.
Author Disclosure Statement
No competing financial interests exist.
References
Supplementary Material
Please find the following supplemental material available below.
For Open Access articles published under a Creative Commons License, all supplemental material carries the same license as the article it is associated with.
For non-Open Access articles published, all supplemental material carries a non-exclusive license, and permission requests for re-use of supplemental material or any part of supplemental material shall be sent directly to the copyright owner as specified in the copyright notice associated with the article.