




Abstract
To demonstrate the importance of calibration measurements in 3 Tesla proton magnetic resonance (MR) spectroscopy (1H-MRS) thermometry for human brain temperature estimation for routine clinical applications. In vitro proton MR spectroscopy to obtain calibration constants of the water–chemical shift was conducted at 3 Tesla with a temperature-controlled phantom, containing a pH-buffered aqueous solution of N-acetyl aspartate (NAA), creatine (Cr), methylene protons of Cr (Cr2), dimethyl silapentane sulfonic acid (DSS), and sodium formate (NaFor). Estimations of absolute human brain temperature were performed utilizing the correlation of temperature to the water–chemical shift for the resonances of NAA, Cr, and Cr2. Data for calibration of the metabolites' chemical shift differences and in vivo temperature estimations were acquired with single-voxel point-resolved spectroscopy (PRESS) sequences (repetition time/echo time = 2000/30 ms; voxel size 2 × 2 × 2 cm3). Spectroscopy data were quantified in the time-domain, and a Pearson correlation analysis was performed to estimate the correlation between the chemical shift of metabolites and measured temperatures. The correlation coefficients (r) of our calibration measurements were NAA 0.9975 (±0.0609), Cr −0.9979 (±0.0621), Cr2 − 0.9973 (±0.0577), DSS −0.9976 (±0.0615), and NaFor −0.8132 (±2.348). The mean calculated brain temperature was 37.78 ± 1.447°C, and the mean tympanic temperature was 36.83 ± 0.2456°C. Calculated temperatures derived from Cr and Cr2 provided significant (p = 0.0241 and p = 0.0210, respectively) correlations with measured temperatures (r = 0.4108 and r = −0.4194, respectively). Calibration measurements are vital for 1H-MRS thermometry. Small numeric differences in measured signal and data preprocessing without any calibration measurements reduce accuracy of temperature calculations, which indicates that calculated temperatures should be interpreted with caution. Application of this method for clinical purposes warrants further investigation and a more practical approach.
Introduction
T
In clinical routine, only invasive techniques enable precise measurements of brain temperature but require neurosurgical intervention for probe insertion. This kind of intervention has numerous significant risks, including intracerebral hematoma and infection. Therefore, this method is restricted to the severely ill and additionally only allows the acquisition of temperature in around a 5 mm radius of the probe, completely neglecting the possibility of local thermo-pooling in different compartments of the brain as temperature has been shown to correlate with depth of measurement site (Ishigaki et al., 2009; Karaszewski et al., 2009; Inoue et al., 2013). Consequently, noninvasive measurement of brain temperature combining high spatial and thermal resolution is of utmost interest to the critical care community (Marshall et al., 2006; Ishigaki et al., 2009; Inoue et al., 2013). Furthermore, 1H-magnetic resonance spectroscopy (MRS) thermometry is rigorously researched for clinical applications, including targeted temperature management, monitoring of brain trauma and image-guided therapy, and diagnosis of intracranial tumors (Sapareto and Dewey, 1984; Corbett et al., 1997; Zeiner et al., 2010; Covaciu et al., 2011; Babourina-Brooks et al., 2014; Shi and Mao, 2017). Today, there are several temperature-dependent magnetic resonance imaging (MRI) parameters that can be exploited for thermometry, such as magnetic resonance (MR) spectroscopy to determine the water–chemical shift. This has been demonstrated to be the most feasible method and allows for the estimation of the absolute temperature in combination with high-spatial-resolution MRI (Kuroda, 2005; McDannold, 2005; Rieke and Pauly, 2008; Bainbridge et al., 2013; Babourina-Brooks et al., 2015). The water–chemical shift difference is determined by the temperature-dependent variation of the water peak and a temperature-independent reference compound (e.g., DSS) in MR spectra. This temperature dependency correlates linearly with the water–chemical shift by approximately −0.01 ppm/°C (Hindman, 1966). The main purpose of this study was to demonstrate the importance of calibration measurements in 1H-MRS thermometry before estimating individual subject or patient brain temperature by comparing our findings with results published from previous studies addressing calibrations in 1H-MRS thermometry.
Materials and Methods
Overview
In this study, we prepared a spherical phantom containing various chemical compounds applied in routine human brain spectroscopy measurements, such as N-acetyl aspartate (NAA), creatine (Cr), and methylene protons of Cr (Cr2) (Zhu et al., 2008; Covaciu et al., 2010). We hypothesized that it is necessary to apply individual scanner-specific calibration curves gained from phantom measurements, before measuring healthy volunteers, to utilize the proposed correlation parameters between temperatures to the water–chemical shift (ΔδH2O-δMetabolite) and to quantify the absolute brain temperature in vivo. The temperature dependency of −0.01 ppm/°C was obtained from the literature (Hindman, 1966) and is commonly used in 1H-MRS thermometry. Additionally, we investigated the feasibility of a simplified algorithm for spectral curve analysis, enabling a more practical approach for noninvasive 1H-MRS thermometry in clinical routine use. Finally, we analyzed inter- as well as intraindividual brain temperature variations.
Scanner and 1H-MRS
Phantom as well as in vivo measurements were performed on a 3T-Siemens MAGNETOM Verio (Siemens AG, Erlangen, Germany) fitted with a standard transmit/receive 12-channel head coil. Room temperature (22.1°C; standard deviation [SD] ±0.5°C) and lighting were constant; the MR scanner fan was switched off. After standard shimming, a localizer measurement was applied and single-voxel spectroscopy (SVS) with a voxel size of 2 × 2 × 2 cm3 was performed. This large voxel of interest (VOI) should ensure a reasonable signal-to-noise ratio to gain sufficient 1H-MRS signal for further data processing. The scan parameters for the SVS were as follows: repetition time = 2000 ms, echo time = 30 ms, flip angle = 90°, with 64 averages and a scan time of 2′16″. For more precise data analysis, weak water suppression during the scanning sequence was applied. Each raw free induction decay signal, as well as Fourier transformed data, was stored on an external workstation without preprocessing for further analysis.
Phantom measurements
For the calibration measurements, a double spherical phantom with an outer diameter of 120 mm and 1000 mL of volume was used. It was specifically designed with two separate compartments, whereby the interior sphere of 50 mm diameter and 50 mL volume contained an aqueous solution to which we added the metabolites NAA, Cr, and Cr2 with a concentration of 50 mM (Supplementary Fig. S1; Supplementary Data are available online at www.liebertpub.com/ther).
This aqueous solution contained additional 3 mM DSS (dimethyl silapentane sulfonic acid), 72 mM K2HPO4 (dipotassium phosphate), 28 mM KH2PO4 (monopotassium phosphate), 200 mM NaFor (sodium formate), and 1.00 g/L of NaN3 (sodium acide) to provide microbiological and pH stability (Covaciu et al., 2010).
All chemicals were purchased at Sigma–Aldrich® (Sigma-Aldrich Corp., St. Louis). The aqueous solution pH was 7.2 to mimic an intracellular environment. DSS was added as a chemical shift reference, which represents an established calibration standard in nuclear MR (Markley et al., 1998). Tempered water was pumped through the phantoms outer sphere to ensure a continuous temperature-controlled circulation and stable thermal conditions within the inner sphere. The heated or cooled water circulated by a self-developed computer-controlled gear pump (Huttary et al., 2001) from a 5 L Erlenmeyer flask, positioned outside the MR examination room, via a total 10 m of thermally insulated polyvinylchloride tubes to the inlet of the outer sphere, and back to the flask. The water temperature in the Erlenmeyer flask was controlled by a hot-plate magnetic-stirrer device (RCT basic with rotation and hot-plate control; IKA, Staufen, Germany) and measured with a J-Thermocouple probe connected to a digital multimeter (Fluke Multimeter 77-IV; Fluke Corp., Everett, WA) with a stated accuracy of ±0.1°C. Within the MR scanner, the temperature of the aqueous calibration mixture was measured with a fluoroptic thermometer (LUXTRON FOT LabKit; LumaSense Technologies, Inc., Santa Clara, CA) utilizing four fluoroptic fiber probes, which delivered real-time temperature data (scan rate every second) throughout the experiment with a stated accuracy of (±0.2°C within 20°C of calibration temperature). All fluoroptic probes have been calibrated before data acquisition with an ice water bath and stable air pressure conditions. After calibration, two of four probes were excluded for further measurements due to an excessive high temperature drift throughout a total scan time of 5 hours. MR spectroscopy measurements were performed once the phantom mixture reached a thermal equilibrium at six different temperature levels ranging from 47.99°C to 30.19°C in 3°C steps. A minimum of 20-minute temper time of the temperature-controlled water ensured stable thermal conditions within the inner sphere.
The mean temperature fluctuation during each spectroscopy measurement was 0.091°C (±0.005°C). SVS was performed at steps of ∼3°C after pre-scan adjustments and standard shimming (total scan time: ∼2′30″). The VOI was positioned in the center next to the fluoroptic probes. For minimal temperature drift, water circulation in the outer compartment was maintained throughout MR data acquisition. After data acquisition, all data were transferred to a local workstation for further analysis with the software package jMRUI (v. 5.1) (Naressi et al., 2001; Stefan et al., 2009).
Subsequently, NAA, Cr, and Cr2 signals were processed utilizing the implemented AMARES algorithm (Advanced Method for Accurate Robust and Efficient Spectral Fitting, a nonlinear-least-squares quantitation algorithm; Vanhamme et al., 1997). The composition of the phantom fluid in this study was taken from the studies of Covaciu (Covaciu et al., 2010) (for comparison reasons)—other study groups investigated several concentrations and compositions of the phantom fluid and derived calibration curves with different temperature dependencies related to the ionic strength and protein concentrations (Vescovo et al., 2013). Estimated calibration curves in this study were compared with previous published studies to primarily assess the impact of utilizing different hardware and software environments.
Calibration calculations of the correlation between the water–chemical shift of each metabolite can be carried out by assuming 37°C as brain temperature using the following equation:
where A is the slope and C is the intersection of the regression line.
To compare our results with other studies, we calculated the ppm of the measured metabolites at 37°C and used these output values to estimate the temperatures with the published parameters (Table 2, last two columns).
Subjects
Thirty healthy volunteers have been recruited to perform an estimation of absolute brain temperatures. In accordance with the Declaration of Helsinki for ethical principles for medical research involving human subjects, approval of the local ethics committee was granted and all volunteers provided informed consent after thorough explanation of all study procedures and risks. For inclusion in the present study, participants' age was restricted to 18–50 years.
The subjects' ages ranged between 22 and 37 years (mean 26.71 years; SD ±2.84 years). One participant was left-handed, whereas 29 were right-handed inherently. Both female and male subjects have been included in this experiment (15 females and 15 males) after verifying the absence of contraindications to perform MRI examination (e.g., claustrophobia, cochlear implants, metal fragments in the subjects' eye or head, pacemakers) as well as other conditions posing a potential risk for participating in this study. Other exclusion criteria were alcohol or drug abuse within 2 years before screening, recently suffered fever, acute infection, pregnancy, and active participation in any other study.
In vivo measurements
All measurements were acquired between 8:00 am and 3:50 pm (median 1:08 pm; SD ±2:18 hours). Subjects' temperatures have been recorded utilizing an infrared ear thermometer (Braun IRT6020 ThermoScan 5, Kronberg im Taunus, Germany) three times before and three times after examination in left and right ears, respectively. The subjects were positioned comfortably within the scanner and equipped with earplugs and headphones. Subsequently, standard shimming was performed and localizer measurements were applied. Three SVSs (for parameters, see the Phantom Measurement section) have been performed with the VOI positioned in the left and right hemispheres as well as at the level of the superior vermis cerebelli, respectively (Fig. 1 depicts the VOI placed in the left hemisphere). Additionally, a gradient field map scan was performed, which was not further used in this study.

Raw spectrum derived from magnetic resonance scanner console. Placement in the left hemisphere. ROI, region of interest.
Total time scheduled for the experiment was about 30 minutes for each subject. Fourteen minutes for subject preparation and positioning and 16 minutes for mere MR data acquisition. In total, 120 MR measurements were performed (30 subjects with 3 SVS and 1 chemical shift imaging measurement each).
A first inspection of the gained data was performed at the MR scanner console by visually verifying the plausibility of the metabolite's position and amplitude within the spectral curve.
Statistics/data analysis
1H-MRS data were processed with the jMRUI (v. 5.1) (Naressi et al., 2001; Stefan et al., 2009) software package. To prevent bias on an early-level conservative, pre-processing was applied as follows:
The water peak was set as reference point to 0 ppm without manual zero-order phase correction, line-broadening, or zero-filling of data points. To discriminate the individual metabolite peaks, the water peak was quantified utilizing the Hankel–Lanczos Total Least-Squares Algorithm (HLTLS) and the spectra were modeled with residue. The region of interest was selected by applying an extraction and reduction filter (ER filter) (Cavassila et al., 1997) discarding the residual signal containing the water peak and its vicinity.
Post-processing
Finally, the signal was quantified utilizing nonlinear least-squares quantification in the time domain with the AMARES algorithm.
A standard linear regression analysis was performed to estimate the correlation between the chemical shift of each metabolite and the measured temperature.
For this, the equation
was used.
Categorical data are given as counts and percentages (e.g., gender) and continuous data (e.g., temperature) as mean ± 1 standard deviation. Normal distribution of continuous data was checked by the D'Agostino–Pearson omnibus test. Statistical correlations were analyzed utilizing a Pearson Product Moment Correlation test (95% confidence interval). For comparison reasons, a two-sided Student's t-test was performed. p < 0.05 was considered as statistically significant.
GraphPad Prism version 7.00 for Windows (GraphPad Software, La Jolla, CA) and IBM SPSS Statistics 25 (IBM Corp., New York, NY) were used to analyze data; for data represented as graphs or tables, we used GraphPad Prism, SPSS Statistics, Adobe Photoshop CS6 (Adobe Systems, Inc., San José, CA) and Microsoft Office 2013 Package (Microsoft Corp., Redmond, WA).
Results
Phantom measurements
Six fluoroptic temperature measurements were performed in steps of ∼3°C from 48°C to 30°C, and the relation between temperature and chemical shift of the metabolites was estimated by regression line analysis and yielded excellent correlation coefficients for δH2O-NAA R2 = 0.9949, δH2O-Cr R2 = 0.9956, δH2O-Cr2 R2 = 0.9947, and δH2O-DSS R2 = 0.9953. The correlation coefficient for δH2O-NaFor as internal reference was low, as anticipated with R2 = 0.6612 (Table 1).
Phantom Measurements: Fluid Temperature and Spectral Differences of Water to Metabolite
Parameters of regression line (slope, y-axis intercept and correlation coefficient R2). For the measured phantom temperatures, the mean value of fluoroscopic probe 1 and probe 2 was utilized.
NAA, N-acetyl aspartate; Cr, creatine; Cr2, methylene protons of Cr; DSS, dimethyl silapentane sulfonic; NaFor, sodium formate.
Subject measurements
Subjects' temperatures from measurement with the infrared ear thermometer showed a mean temperature of 36.83°C (±0.2456), 95% confidence interval (36.73°C–36.92°C). Compared with the temperature at the beginning of data acquisition, a mean warming of +0.12°C (±0.11) occurred in 21 and a mean cooling of −0.04°C (±0.02) in 8 individuals during scanning. Temperature of one subject remained unchanged. Female subjects had significantly higher overall temperatures (mean f = 36.95°C vs. m = 36.78°C) (p = 0.0474). The calculated mean brain temperature (37.78°C, ±1.447) derived from NAA + Cr + Cr2 was significantly (p < 0.0001) higher than the mean tympanic temperature of 36.83°C (±0.2456). Calculated temperatures derived from Cr and Cr2 correlated significantly (p = 0.0241 and p = 0.0210, respectively) with measured temperature (r = 0.4108 and r = −0.4194, respectively) (Fig. 2), whereas NAA showed no correlation (r = 0.044).
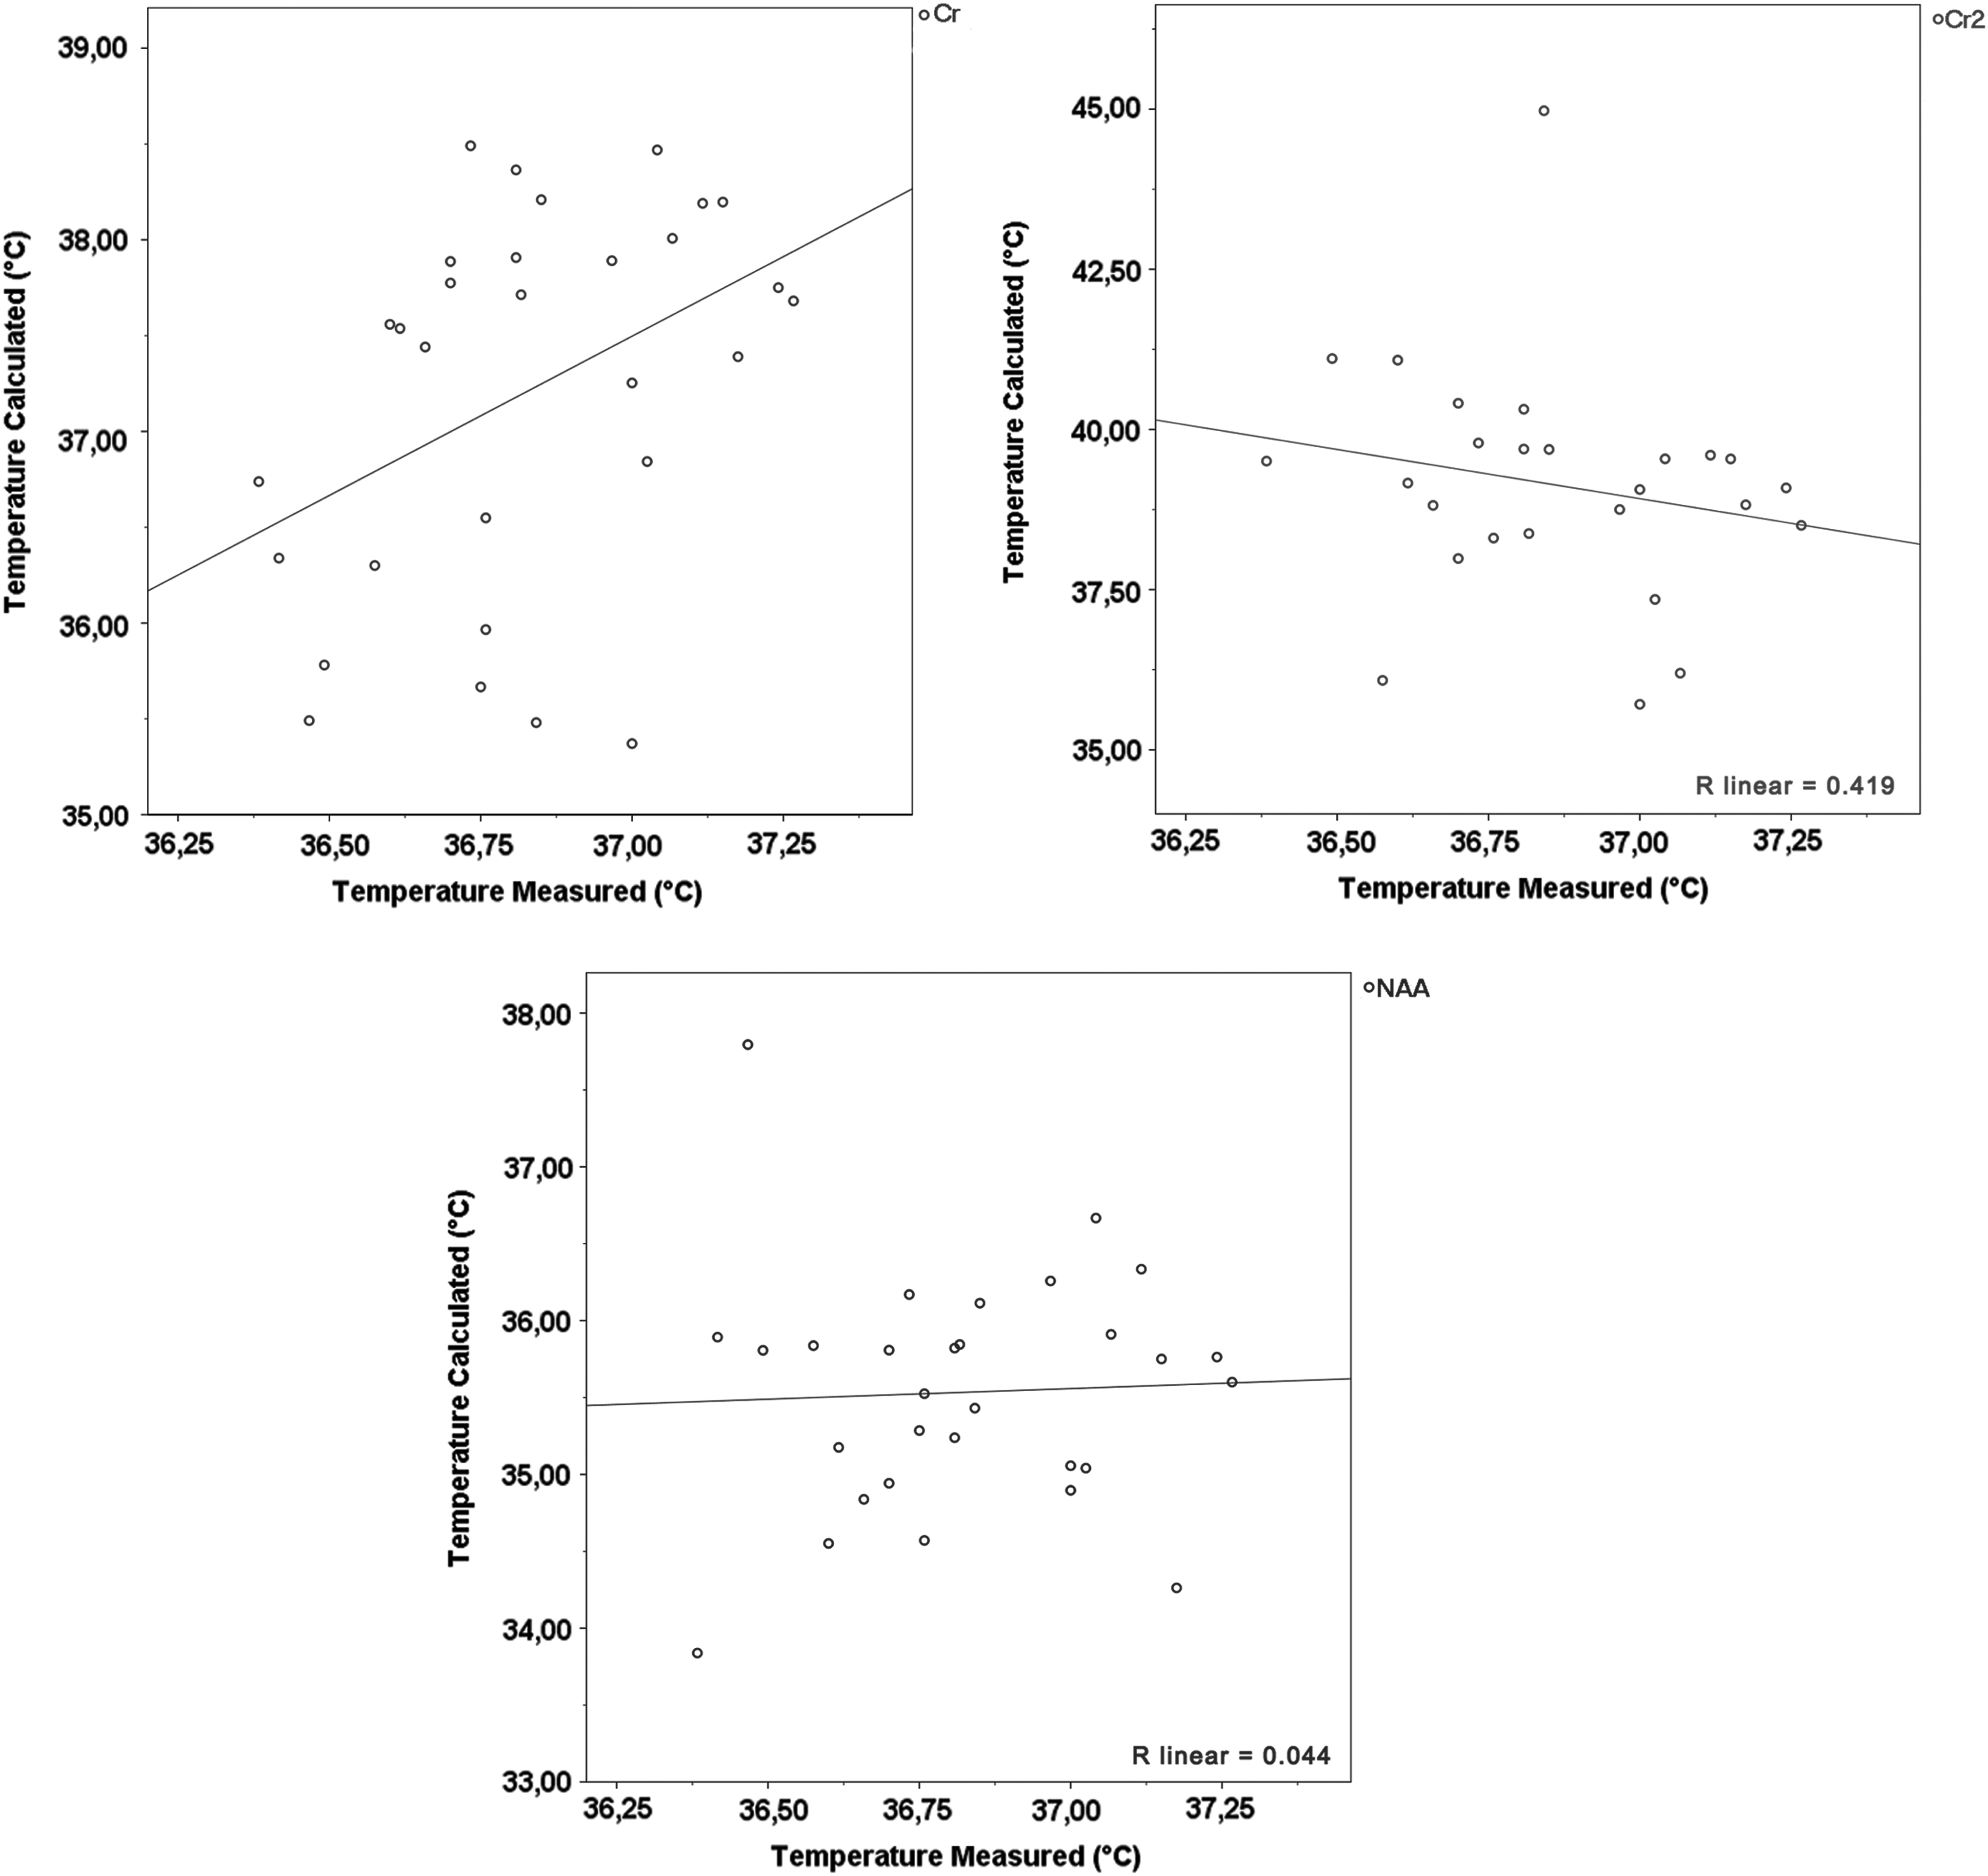
Correlation of tympanically measured and estimated brain temperatures expressed with correlation coefficient (R). Cr, Cr2, and NAA plotted.
Corrected values to 37°C
For the ppm value calculation at an assumed brain temperature of 37°C (Table 2), we used the following formula:
Comparison to Other Studies: Calibration Results to Obtain Regression Line Parameters
NAA, N-acetyl aspartate; Cr, creatine, Cr2, methylene protons of Cr; DSS, 3-(Trimethylsilyl)Propane-1-Sulfonic acid; NaFor, HCOONa.
By inserting data from measured spectra normalized to 37°C, we obtained the following ppm values:
δH2O-NAA_37 = 2.653719189
δH2O-Cr_37 = 1.641249562
δH2O-Cr2_37 = 0.750170581
δH2O-DSS_37 = 4.668388407
δH2O-NaFor_37 = −4.273081124
Comparison of measured loci
The calculated mean and median temperature difference between the left and right hemispheres for NAA was +0.89°C and +1.19°C, respectively. For Cr, the mean and median temperature differences of −0.5°C and +0.1°C, respectively, were estimated. For Cr2, we calculated the mean − 0.15°C and median −0.22°C. The measurements for Cr2 were quite inhomogeneous due to some large outliers—the standard deviation for the left hemisphere was ±3.68°C and ±2.25°C for the right hemisphere (Fig. 3). Outliers larger than ±10°C were excluded from further analysis.
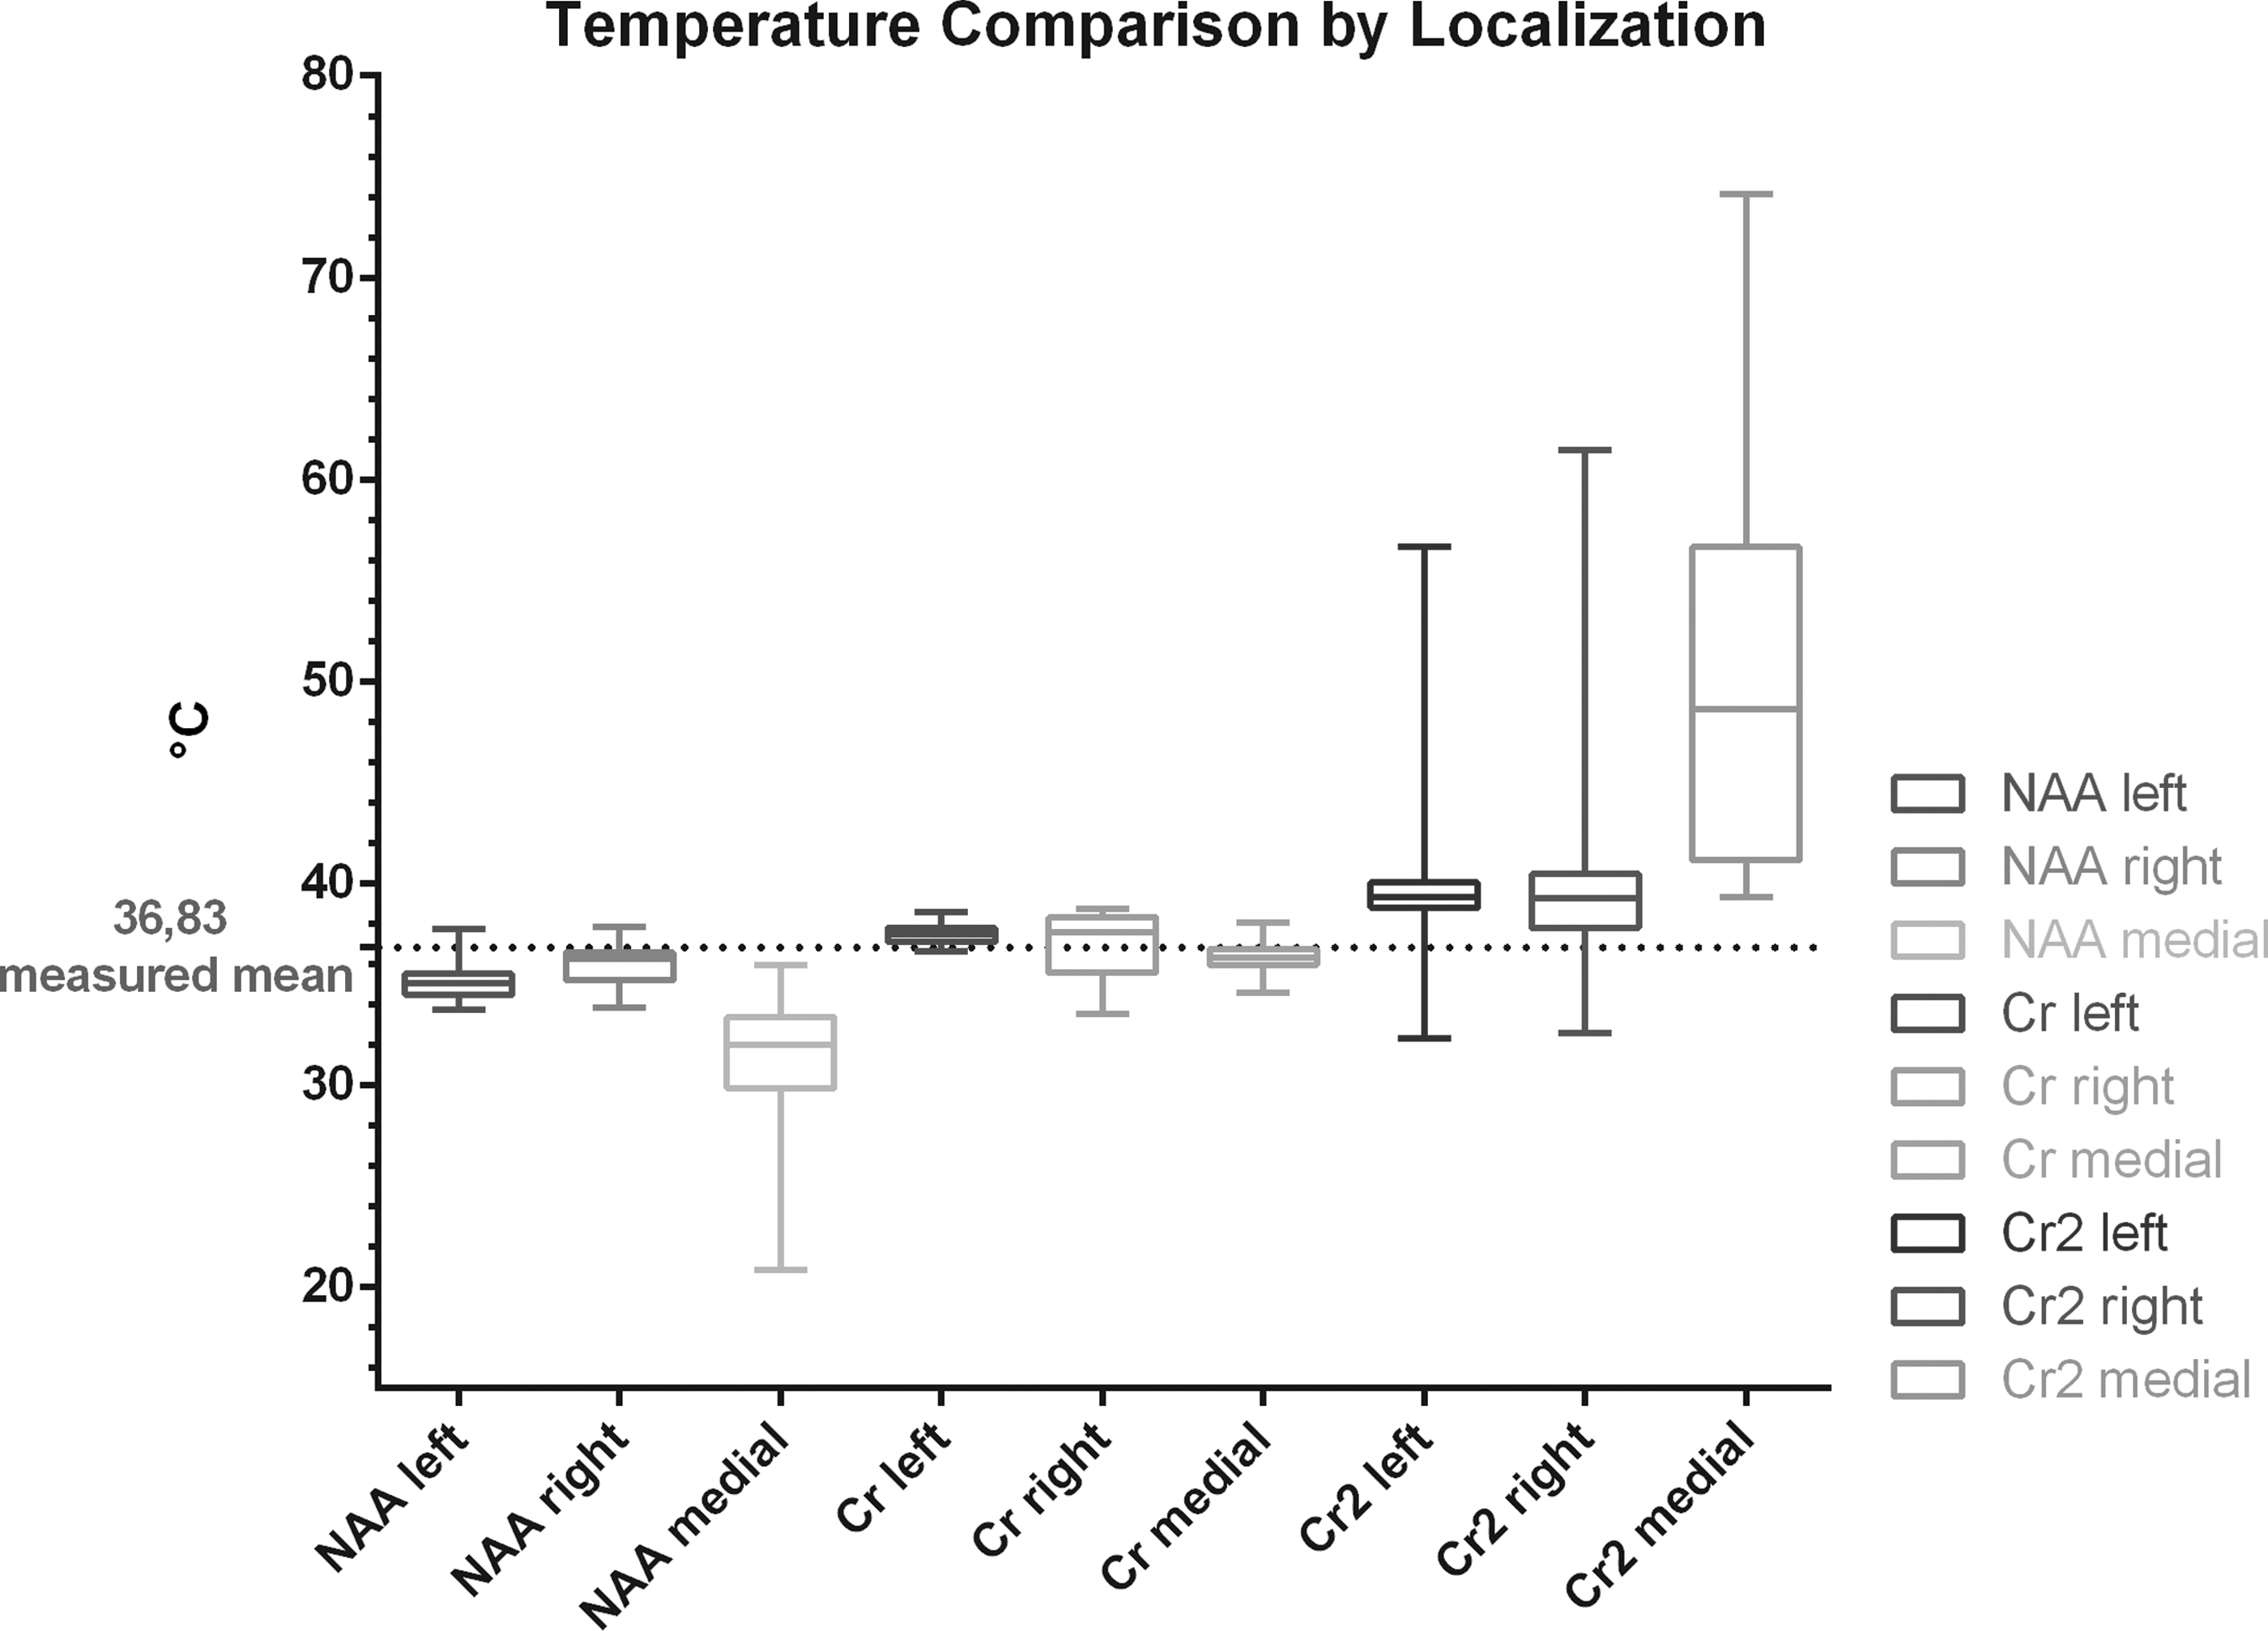
Calculated temperatures of the left hemisphere compared with calculated temperatures of the right hemisphere and cerebellar measurements (medial). Outliers ±5°C have been excluded for this figure (n = 2 for Cr2 left and n = 8 for Cr2 right).
The measurements and analyses from data gained in the region of interest of the cerebellum showed the following values: NAA mean 31.17°C ± 3.08, Cr mean 36.35°C ± 0.65, and Cr2 mean 50.19°C ± 9.62 (maximum Cr2 was 74.15°C and minimum Cr2 39.32°C).
Additionally, the peaks of MI (Myo-Ionisitol) and Cho (Choline) were analyzed but not used for further temperature estimation since no previous phantom measurements with these metabolites and consequently also no calibration curves were available.
The ppm values for MI in the cerebellum were mean 0.892852 (±0.200332) ppm, in the left and right hemispheres 0.94676 (±0.12098) and 1.01578 (±0.11178), respectively. For Choline, our analysis showed the following ppm values: cerebellum: 1.45424 (±0.00766), left hemisphere: 1.44435 (±0.00569), and right hemisphere: 1.448537 (±0.01423) ppm.
Discussion
The major finding of our study is twofold:
By performing phantom measurements and subsequently generating MR scanner-specific calibration curves, noninvasive 3 Tesla 1H-MRS thermometry is a feasible method to assess human brain temperature in vivo. The selection of a suitable metabolite and scanning sequence in MR thermometry is pivotal as data quality and accuracy are highly dependent on these variables.
In this study, we could show the direct relation between 1H-MRS and brain temperature of healthy subjects in in vivo measurements for NAA, Cr, and Cr2. Additionally, 30 volunteers were examined by SVS measurements after thoroughly generating calibration curves obtained by in vitro phantom measurements. The scientific rationale for calibration measurements before performing MR thermometry in vivo is explained by the variance due to different hardware and software environments applied in different research groups, scientific institutions, and clinical routine. Implementing our calibration constants into the regression parameters of other studies (Corbett et al., 1995; Samson et al., 2006; Covaciu et al., 2010; Cady et al., 2011; Vescovo et al., 2013; Babourina-Brooks et al., 2015) resulted in varying temperatures further underlining the importance of calibration measurements, particularly when considering MR thermometry for patients with acute brain injury.
The linear regression analysis of our phantom measurements provided robust data for each metabolites' chemical shift indicating a thorough and accurate choice of acquisition methods in agreement with the previous literature (Marshall et al., 2006; Zhu et al., 2008; Covaciu et al., 2010; Vescovo et al., 2013; Tarasek et al., 2014; Babourina-Brooks et al., 2015). However, by comparing the measured tympanic temperature with the calculated temperature from in vivo measurements, only NAA and Cr were consistent enough regarding their standard deviations.
The main source of bias in temperature estimation in our approach might be introduced by the user dependence in the curve-fitting process carried out by jMRUI. Nonetheless, the accuracy of noninvasive human MR thermometry is still surprising when compared with invasive probe insertion, the current gold-standard of brain temperature monitoring, only providing an accuracy of 0.1–0.3°C as reported (Schartner and Monro, 2014; Musolino et al., 2016; Fekete et al., 2017).
Limitations of MR thermometry measurements
A strict and standardized approach regarding phantom and in vivo measurements must be chosen to minimalize the inclusion of systematic bias. However, our results might not be applicable to other scanning environments or patients with neurological injury or disease. Future clinical studies are warranted to investigate this in greater detail.
Measurements of metabolites near the water peak
Due to the very small distance between the water and Cr2 peak on the spectra, a sharp separation from each other during the data analysis is in some cases not possible, hence resulting in large outliers (Fig. 3). Figure 4 depicts the close position of Cr2 to the left axis, which is the position of the water peak as defined by the MR Scanners' proprietary software.
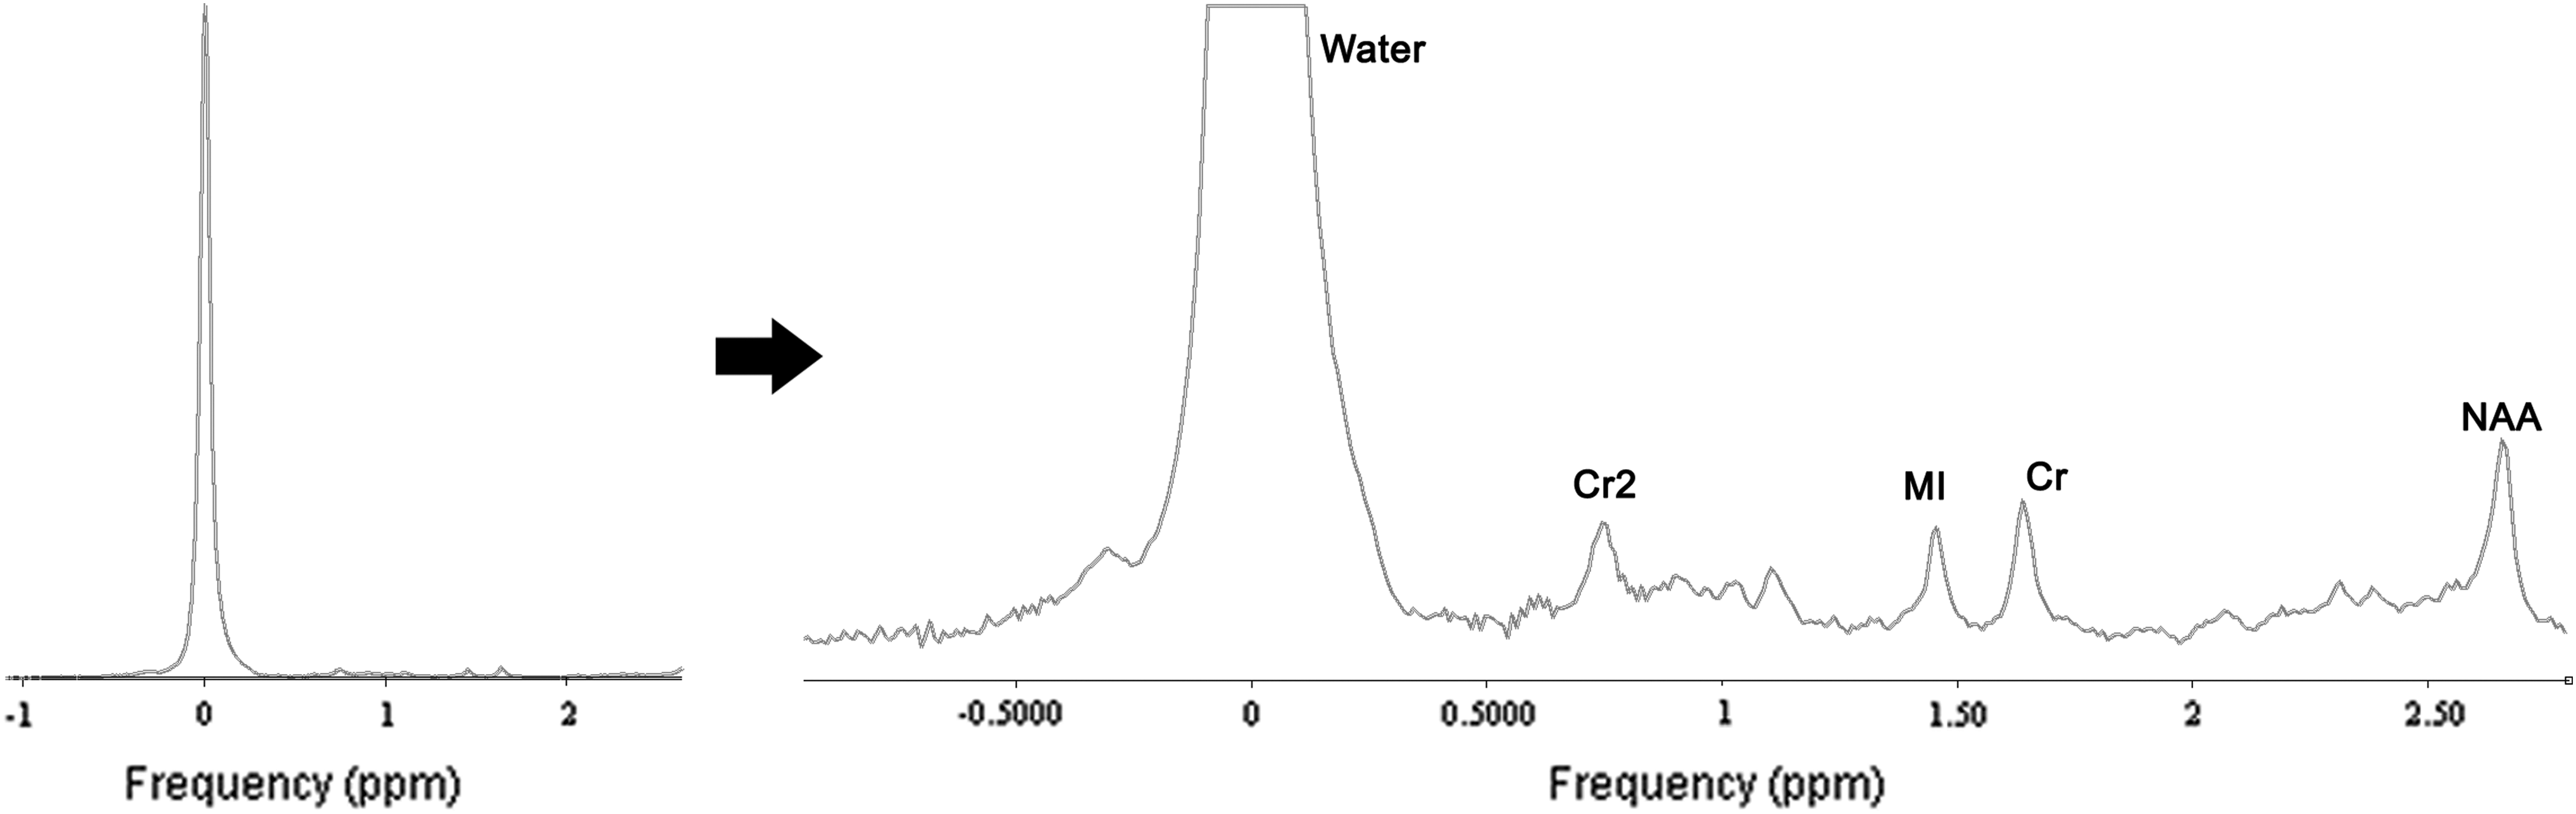
Spectrum in jMRUI. Full spectrum left was cropped and zoomed to display metabolite peaks. The close position of Cr2 to the water peak results in a difficult separation from noise signal. The black arrow indicates zooming in to the spectrum from the left-hand side so that metabolite peaks are visible.
Comparison to other studies
Prior establishing MR spectroscopy for temperature calculations, an estimation of the calibration curve with phantom measurements should be performed and the regression line parameters should be calculated, since each MR scanner, hardware and software environment hold individual properties and cannot be generalized. Comparing the calculated temperatures for Cr, Cr2, and DSS with other studies (Corbett et al., 1995; Samson et al., 2006; Covaciu et al., 2010; Cady et al., 2011; Vescovo et al., 2013; Babourina-Brooks et al., 2015), we could gain similar temperature results (Table 2; Fig. 5), but still there are differences in the calculated temperatures. In Table 2, we used our calibration curve values (column “Slope,” “Intersection,” and “ppm calculated for 37°C”) as “reference” values for all other studies we compared. Therefore, we could show a median difference in calculated temperatures to other studies for NAA 1.07°C (min −1.30°C, max 2.90°C), for Cr −0.75°C (min −0.75°C, max −0.75°C), and for Cr2 − 1.32°C (min −1.32°C, max −1.32°C) (Fig. 5). These differences show that an imprudent use of published calibration values (not gained from own phantom measurements) might lead to false temperature estimations, and therefore, it is not useful for the clinical routine.
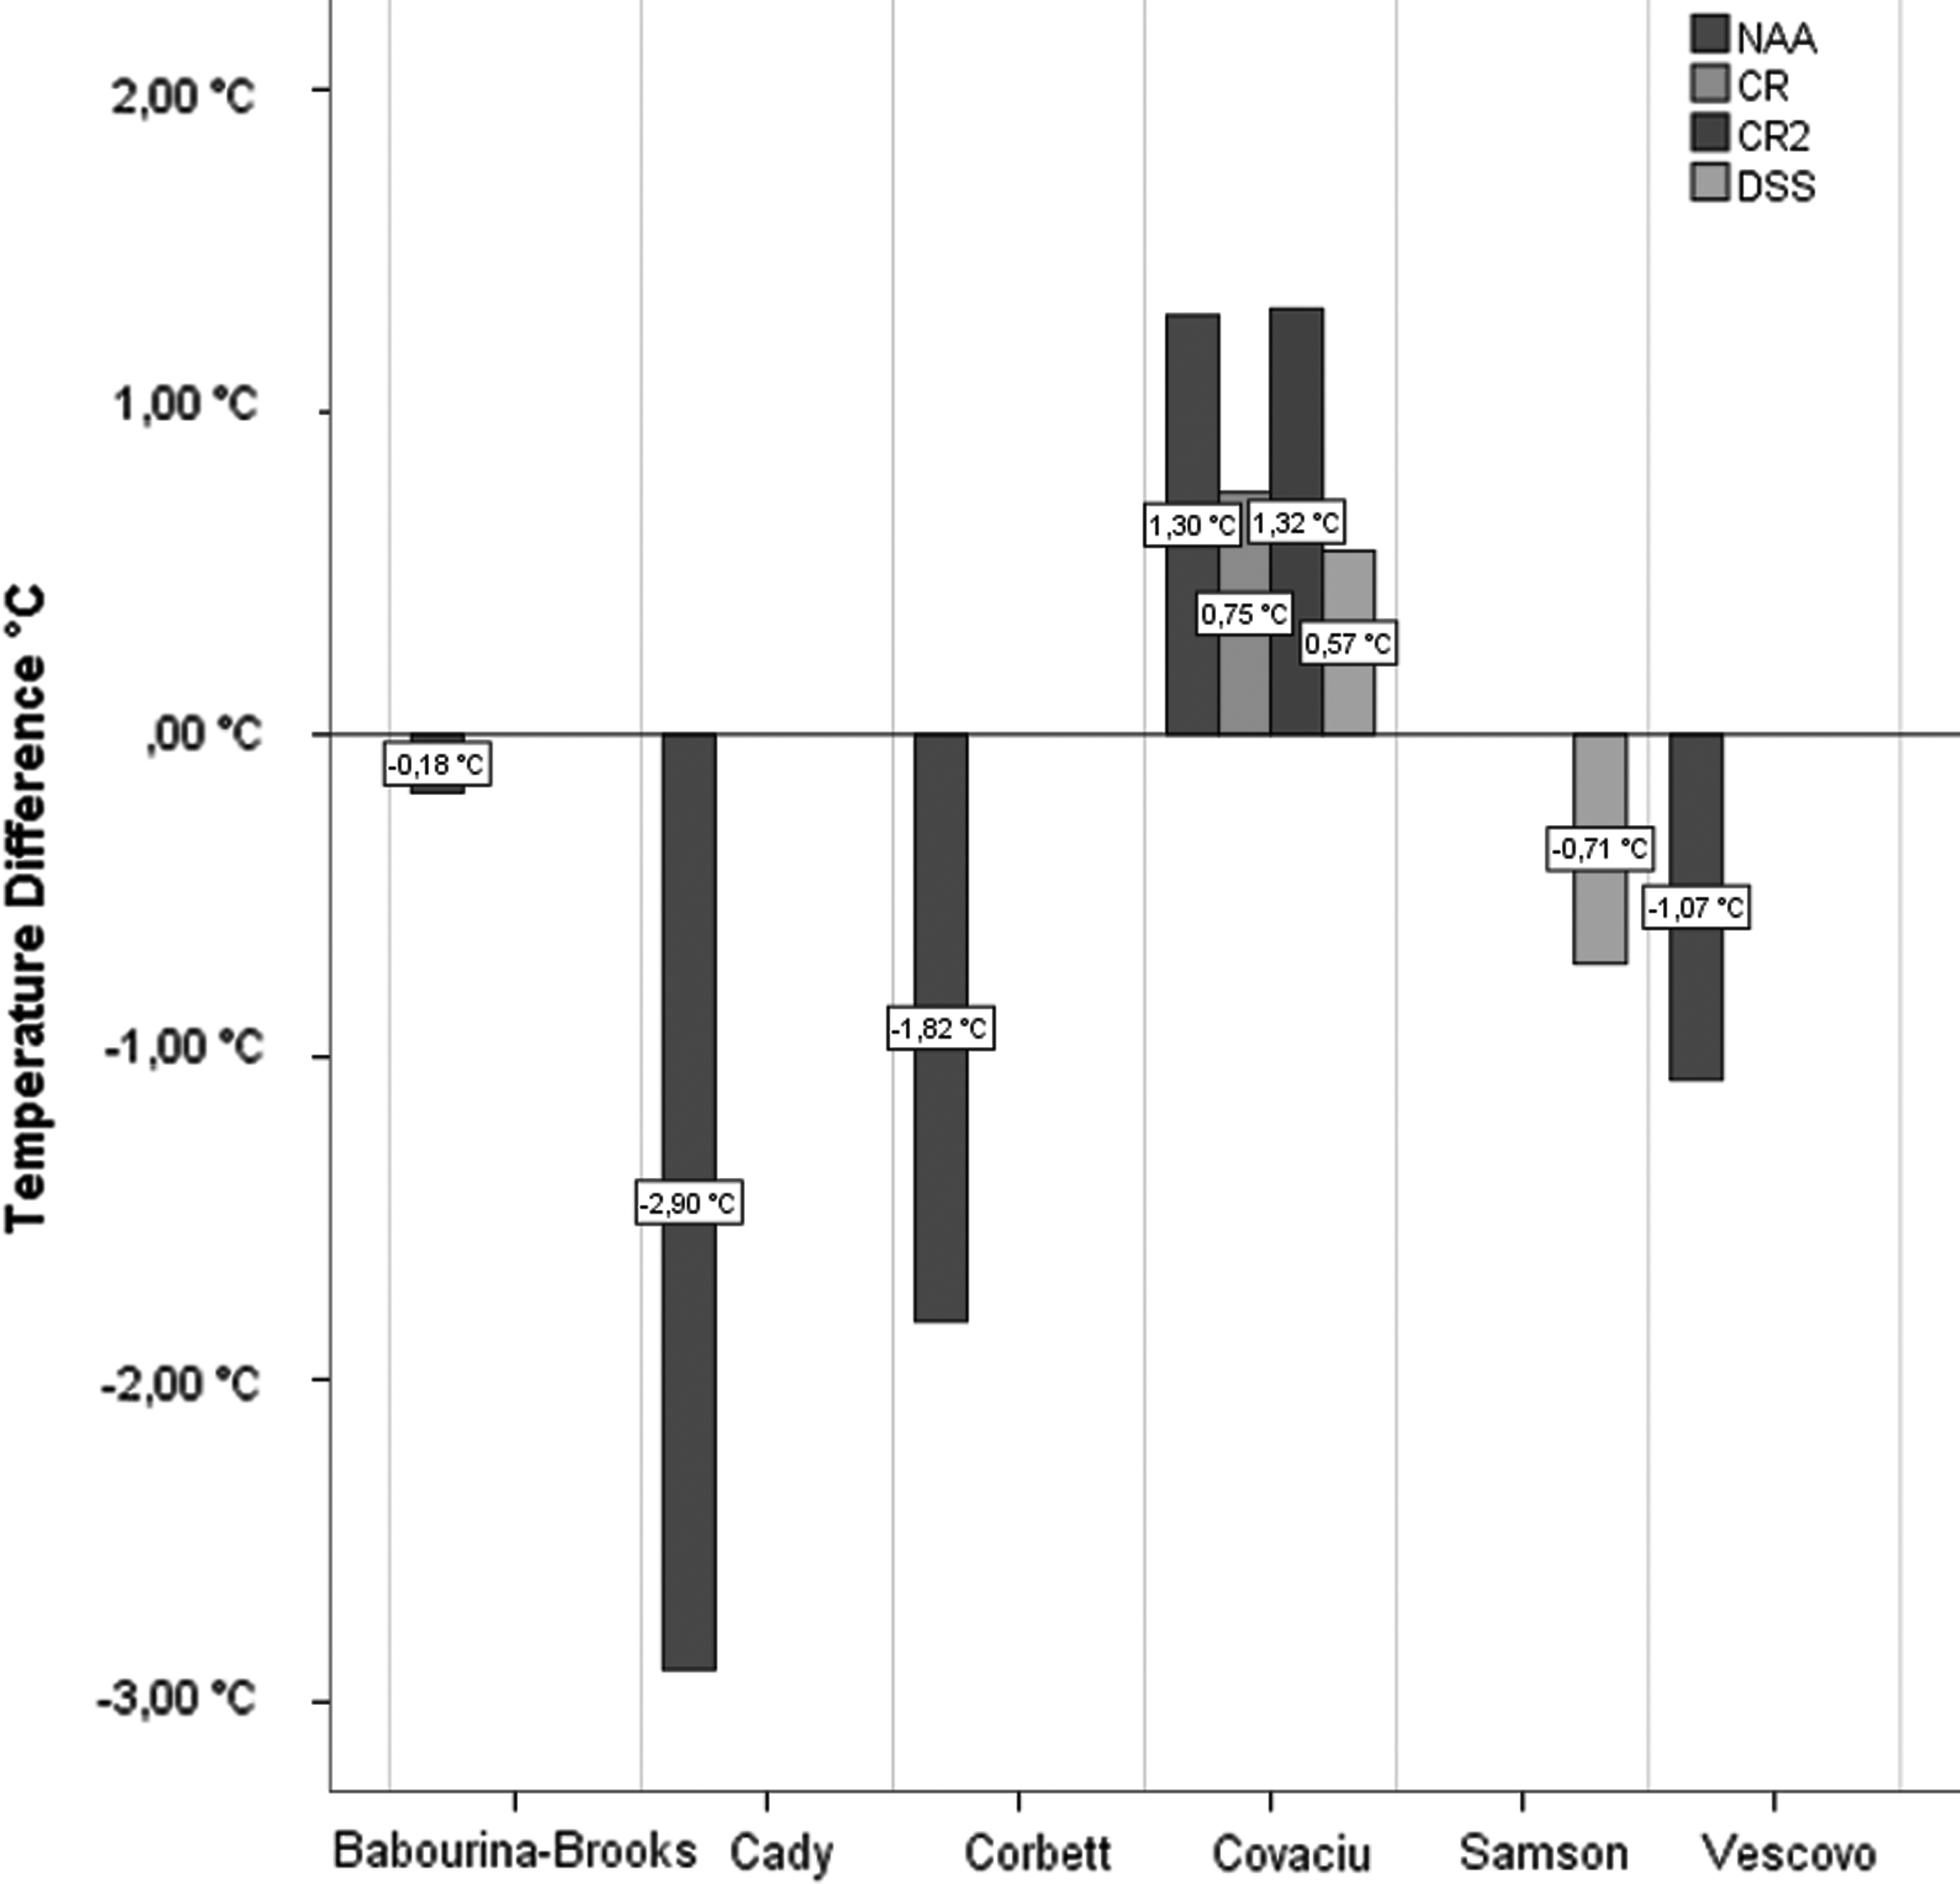
Comparison of our calibration formula with previous studies. Difference in calculated temperatures between studies resulting from applying our calibration values for 37°C to previously published studies.
Other studies such as Babourina-Brooks et al. (2015) or Vescovo et al. (2013) varied the protein concentration and ionic concentration in the phantom fluid to gain a more realistic or physiological fluid mimicking the composition of human brain tissue. These variations in ionic concentration indicated a temperature slope of −0.008 C/mM. Implementing these results with previously measured ionic differences in human tissue would imply a temperature difference of 0.06°C and 0.30°C for basal ganglia versus white matter (8 mM difference) and healthy versus tumor tissue (38 mM difference) (Ouwerkerk et al., 2003), respectively.
Conclusion
Today, monitoring of human brain temperature is restricted to the use of invasive devices and can therefore only be implemented in intubated patients with acute severe brain injury providing good temporal but poor spatial resolution. To understand brain (patho-) physiology, the assessment of brain temperature at different locations to detect possible gradients in comatose but also in awake patients is of particular interest to enlighten secondary pathways post-injury (Greer et al., 2008; Frank and Broessner, 2017). Noninvasive 1H-MRS thermometry performed after scanner-specific calibration using a phantom model is a feasible method to assess brain temperature in healthy volunteers but also in the severely injured. Although data captured with 1H-MRS thermometry have temporal limitations, it can cover a wide region of interest and is easily repeatable. This repeatability allows for the monitoring of processes even if the region of interest in the brain has shifted due to progressing conditions. Still, with the current given hardware and software, an accuracy of less than ±0.5°C in the estimation of absolute brain temperatures as described in earlier studies at 3 Tesla is somewhat questionable. However, compared with the invasive gold standard, the resolution and feasibility render 1H-MRS thermometry a promising tool that should be further developed in controlled scientific settings. Clinical trials in targeted temperature management using 1H-MRS thermometry for noninvasive brain temperature measurements will be required to assess its utilization in clinical practice. Within these future clinical studies assessing optimized parameters for targeted temperature management, 1H-MRS enables researchers to compare patients with healthy controls as it does not require any invasive intervention. Another advantage of the noninvasive nature of 1H-MRS thermometry is the possibility for longitudinal studies investigating the progression of a disease. We are fully aware that 1H-MRS thermometry yet has to be further developed for its application in clinical routine in order conduct studies addressing the impact of controlled normothermia versus therapeutic hypothermia in various diseases. However, we are confident that with the emergence of more sensitive hardware and software, noninvasive MR thermometry will be implemented as a valuable tool for future scientific and clinical practice.
Footnotes
Acknowledgments
We express our gratitude to Sandra Busch, BSc, MSc; Thomas Bob Lang; Prof. Hubert Huppertz, PhD; and Abraham Siedler for their valuable contribution to this project. Furthermore, we thank Christopher and Thomas Ryan for their helpful comments on our article. This research received funding from the MUI-START programme for young scientists, which is sponsored by the Medical University of Innsbruck (grant: ST2013042008).
Author Disclosure Statement
G.B. received travel grants for scientific conferences and honoraria for lectures from Bard Medical, Austria, and Zoll Medical, Austria. He received honoraria for consulting from Zoll Medical, Austria. F.F. received travel grants for scientific conferences from Bard Medical, Austria. All other authors have no conflict of interest in this investigation.
References
Supplementary Material
Please find the following supplemental material available below.
For Open Access articles published under a Creative Commons License, all supplemental material carries the same license as the article it is associated with.
For non-Open Access articles published, all supplemental material carries a non-exclusive license, and permission requests for re-use of supplemental material or any part of supplemental material shall be sent directly to the copyright owner as specified in the copyright notice associated with the article.
