




Abstract
We aimed to compare the relationship of mean arterial pressure (MAP) and intracranial pressure (ICP) to predict the neurological prognosis in cardiac arrest (CA) survivors. We retrospectively examined out-of-hospital CA patients treated with targeted temperature management. ICP was measured using cerebrospinal fluid (CSF) pressure, whereas MAP was measured as blood pressure monitored through the radial or femoral artery during CSF pressure measurement. Primary outcome was 6-month neurological outcome. Of 92 enrolled patients, the favorable outcome group comprised 31 (34%) patients. The median and interquartile range of MAP were significantly higher and ICP was significantly lower in patients with favorable neurological outcomes than in those with unfavorable neurological outcomes (94.3 mmHg [80.0–105.3] vs. 82.0 mmHg [65.3–96.3], p = 0.021 and 9.4 mmHg [10.8–8.7] vs. 18.8 mmHg [20.0–15.7], p < 0.001, respectively). ICP showed the higher area under the receiver operating characteristic curve (area under curve [AUC] = 0.953, 95% confidence interval [CI] = 0.888–0.986) for neurological outcome prediction. MAP showed the lower AUC (0.648, 95% CI = 0.541–0.744). Higher accurate prognosis was predicted by ICP than MAP, and the prognostic performance was good. Prospective multicenter studies are required to confirm these results.
Introduction
In recent decades, despite the improvements in education and training on cardiopulmonary resuscitation (CPR), and the management of out-of-hospital cardiac arrest (OHCA) and post-CA such as the targeted temperature management (TTM), only 11.4% of CA patients survive until hospital discharge (Callaway et al., 2014; Sandroni et al., 2016; You et al., 2018).
Withdrawing life-sustaining therapy (WLST) because of perceived poor neurological prognosis (WLST-N) is a common cause of hospital death after OHCA (Peman et al., 2012; Lemiale et al., 2013). However, patients exposed to WLST-N have a 26% chance of survival, which is the same as that of the unexposed patients (Elmer et al., 2016). Therefore, to reduce WLST-N in patients who might survive, improving the ability to predict the prognosis of survival in these patients at an early stage post-CA through a multimodal approach is necessary.
CA may cause cerebral edema because of transient global cerebral ischemic–reperfusion injury, which under the Monro–Kellie doctrine, given the rigid encasement of the skull, leads to a reduction in blood and cerebrospinal fluid (CSF) volumes to compensate for this expansion (Hacke et al., 1996). However, if this compensatory action is not effective, a rise in the intracranial pressure (ICP) will ensue (Czosnyka and Pickard, 2004; Wartenberg et al., 2007). Mean arterial pressure (MAP) is the driving force of cerebral blood flow (CBF) and is the principal determinant of the autoregulatory response of the cerebral vasculature. CBF can normally be maintained over a certain cerebral perfusion pressure (CPP) range. If this autoregulation fails, CBF will be even more dependent on CPP (Robertson, 2001; Wartenberg et al., 2007). Patients with an increased ICP have a lowered CPP; therefore, if the ICP increases slightly, CPP may cause autoregulatory failure, leading to a decrease in CBF, exacerbating cerebral ischemia (Wartenberg et al., 2007).
Neurological outcomes in small cohorts of CA survivors, who have undergone TTM, were reportedly related to directly measured CPP and ICP (Gueugniaud et al., 1991; Iida et al., 1997; Nordmark et al., 2009; Naito et al., 2016; Hifumi et al., 2017). We hypothesized that ICP and MAP measured before TTM could be useful tools for predicting the neurological outcome in CA survivors. Hence, we investigated the relationship between neurological outcomes of CA patients treated with TTM, and ICP and MAP values measured at a single time point before TTM.
Materials and Methods
Study design and population
We retrospectively analyzed prospectively collected data on comatose OHCA patients, who were treated with TTM at the Chungnam National University Hospital (CNUH) in Daejeon, Korea, between January 2014 and March 2018. This study was approved by the CNUH Institutional Review Board (CNUH 2018-12-001).
CA patients >18 years old who had undergone TTM were included in this study. Patients were subsequently excluded if they (1) were <18 years old; (2) had experienced a traumatic CA or an interrupted TTM (owing to transfer from another facility); (3) were ineligible for TTM (i.e., intracranial hemorrhage, active bleeding, known terminal illness, or poor pre-arrest neurological status); (4) were ineligible for lumbar puncture (LP) (i.e., severe cerebral edema, obliteration of the basal cisterns, or an occult intracranial mass lesion on computed tomography [CT]); (5) were receiving extracorporeal membrane oxygenation. (6) If the legal guardian did not agree with the LP, then, we did not perform the LP.
TTM protocol
The patients had been treated according to our previously published TTM protocol (Yoo et al., 2018). In brief, TTM was induced with ice packs, intravenous cold saline, and TTM devices, namely, Arctic Sun® and Energy Transfer Pads™ (Bard Medical, Louisville, CO). If the patient's vital signs were stable, the target temperature was maintained at 33°C, otherwise 36°C, for 24 hours, and monitored with bladder probe. On completion of the TTM maintenance phase, patients were rewarmed at a rate of 0.25°C to 0.5°C per hour. Midazolam (0.05 mg/kg intravenous bolus, followed by a titrated intravenous continuous infusion between 0.05 and 0.2 mg/kg/hour) as a sedative agent and cisatracurium (0.15 mg/kg intravenous bolus, followed by an infusion up to 0.3 mg/kg/hour) as a paralyzing agent to control shivering were administered before induction, followed by continuous infusion during the entire TTM phase. An anesthetic depth monitor for sedation (ADMS™; Unimedics Co., Ltd., Seoul, Korea) was used to monitor anesthesia depth. A cannula was routinely inserted into the radial or femoral artery to monitor the blood pressure. All patients received standard intensive care according to our institutional intensive care unit protocol. Neuroprognostication was performed using various modalities such as clinical examination (light reflex, cornea reflex, etc.), magnetic resonance imaging, electroencephalography, and biomarker (neuron-specific enolase) at 72 hours after CA. However, in Korea, the clinics are not permitted to perform WLST unless the patient is considered brain dead during TTM.
Measurement of MAP and ICP
Patients were treated as soon as possible after the return of spontaneous circulation (ROSC) according to our previously published post-CA management protocols (Yoo et al., 2018). CSF pressure was measured by LP before TTM, if no severe edema was found on the brain CT scan, then the value was defined as the ICP. However, a CSF pressure measurement is not mandatory and is performed with consent from legal guardians. Midazolam was used as a sedative agent before CSF pressure measurement. MAP was measured through the radial or femoral artery while the pressure of the CSF was measured. (The mmH2O value was multiplied by 0.074 and converted to mmHg.)
Outcomes
The primary outcome was the 6-month neurological outcome post-CA. Neurological status was obtained by assessing the medical records or through telephone interview with the patients or the patients' caregivers. Neurological outcome was assessed using the Glasgow–Pittsburgh cerebral performance categories (CPC) scale, 6 months post-CA. The CPC scale was classified as CPC 1 (good performance), CPC 2 (moderate disability), CPC 3 (severe disability), CPC 4 (vegetative state), or CPC 5 (brain death or death). A favorable neurological outcome was defined as a CPC of 1 or 2, and an unfavorable neurological outcome was defined as a CPC between 3 and 5.
Statistical analysis
Continuous data are presented as mean ± standard deviation or median with interquartile range (IQR) values using a normality test. Categorical variables are presented as frequencies and percentages. A Mann–Whitney U test was conducted for comparisons of the two continuous variables between the favorable and the unfavorable neurological outcome group. Comparisons of categorical variables were performed using chi-squared or Fisher's exact tests, as appropriate. We examined the receiver operating characteristics (ROC) curves to examine the performances of the variables in predicting unfavorable neurological outcome 6 months post-CA. We calculated the sensitivity, specificity, positive predictive value, negative predictive value, and area under the ROC curve (area under curve [AUC]). The optimal cutoff value was determined using Youden's index. Subsequently, to determine the differences in the prognostic performance between MAP, ICP, and unfavorable neurological outcome, we used the Delong test (DeLong et al., 1988). Data were analyzed using SPSS for Windows, version 18 (IBM, Inc., Chicago). The ROC curves were calculated and compared using MedCalc 15.2.2 (MedCalc Software, Mariakerke, Belgium). A two-sided significance level of 0.05 was used to indicate statistical significance.
Results
Patient demographics
A total of 202 adult OHCA comatose patients had been treated with TTM during the study period. Of these, 92 patients were included, as shown in Figure 1. At 6 months post-CA, 61 (66.3%) patients had unfavorable neurological outcomes. Demographic and CA characteristics stratified according to neurological outcome at 6 months are given in Table 1. Patients with favorable neurological outcomes were younger, had a higher incidence of having received bystander CPR, a shorter no-flow and low-flow time, and a shorter delay from ROSC to LP time.

Schematic flow of patients enrolled in this study.
Demographic Data and Cardiac Arrest Characteristics After Restoration of Spontaneous Circulation
CPR, cardiopulmonary resuscitation; IQR, interquartile range; LP, lumbar puncture; ROSC, return of spontaneous circulation.
Comparison of MAP and ICP with neurological outcomes
Figure 2 provides the comparisons of MAP and ICP with neurological outcome. The median and IQR level of MAP were significantly higher in patients with favorable neurological outcomes (94.3 mmHg [80.0–105.3] vs. 82.0 mmHg [65.3–96.3], p = 0.021); however, ICP was significantly lower (9.4 mmHg [8.7–10.8] vs. 18.8 mmHg [15.7–20.0], p < 0.001).
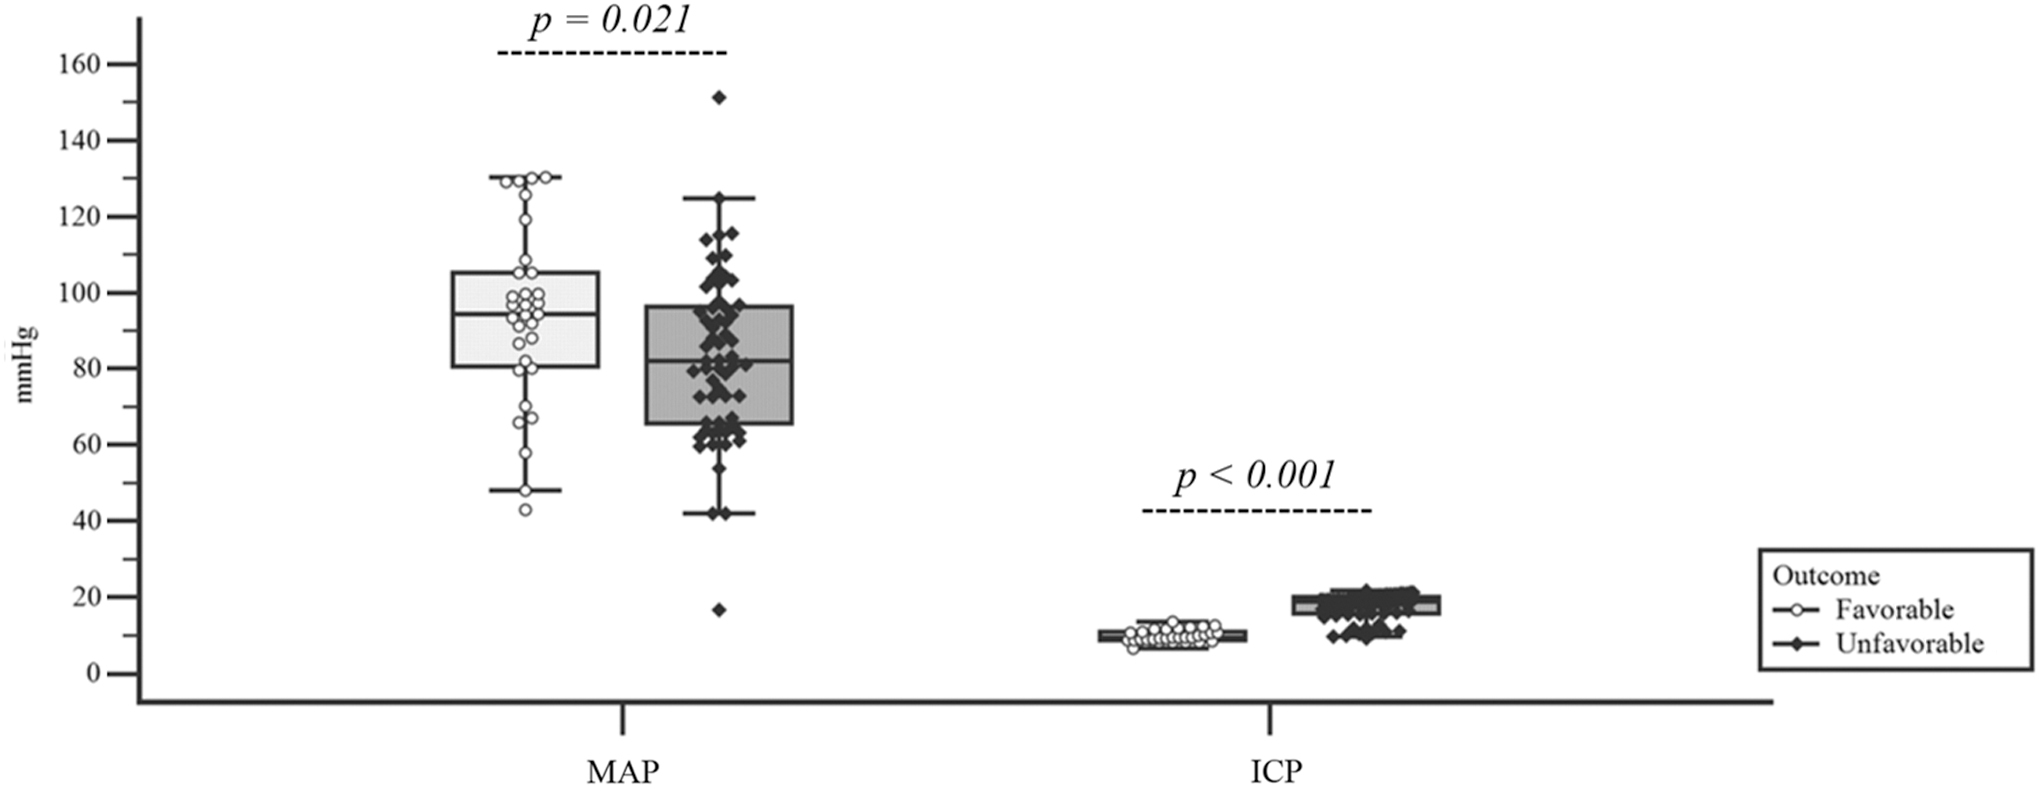
Comparison of ICP and MAP in relation to 6-month neurological outcomes. ICP, intracranial pressure; MAP, mean arterial pressure.
Comparisons between the prognostic performance of MAP and ICP
ICP showed the higher AUC values (0.953, 95% confidence interval [CI] = 0.888–0.986) for predicting the 6-month unfavorable neurological outcome. However, MAP had significantly lower AUC values (0.648, 95% CI = 0.541–0.744) than ICP (p < 0.001). ICP showed a higher sensitivity of 83.6% with 100% specificity at the Youden index cutoff level (Table 2).
Prognostic Performances of Intracranial Pressure and Mean Arterial Pressure for the Prediction of 6-Month Neurological Outcomes
AUC, area under curve; CI, confidence interval; ICP, intracranial pressure; MAP, mean arterial pressure; NPV, negative predictive value; PPV, positive predictive value.
Comparison of ICP between the two groups
We evaluated ICP individually for each level of the CPC scale. The lowest ICP levels were seen in patients with a CPC score of 1 or 2 with no statistically significant differences between these scores (Fig. 3A). Moreover, all 31 patients who had a favorable outcome showed an ICP of ≤13.4 mmHg (Fig. 3B).
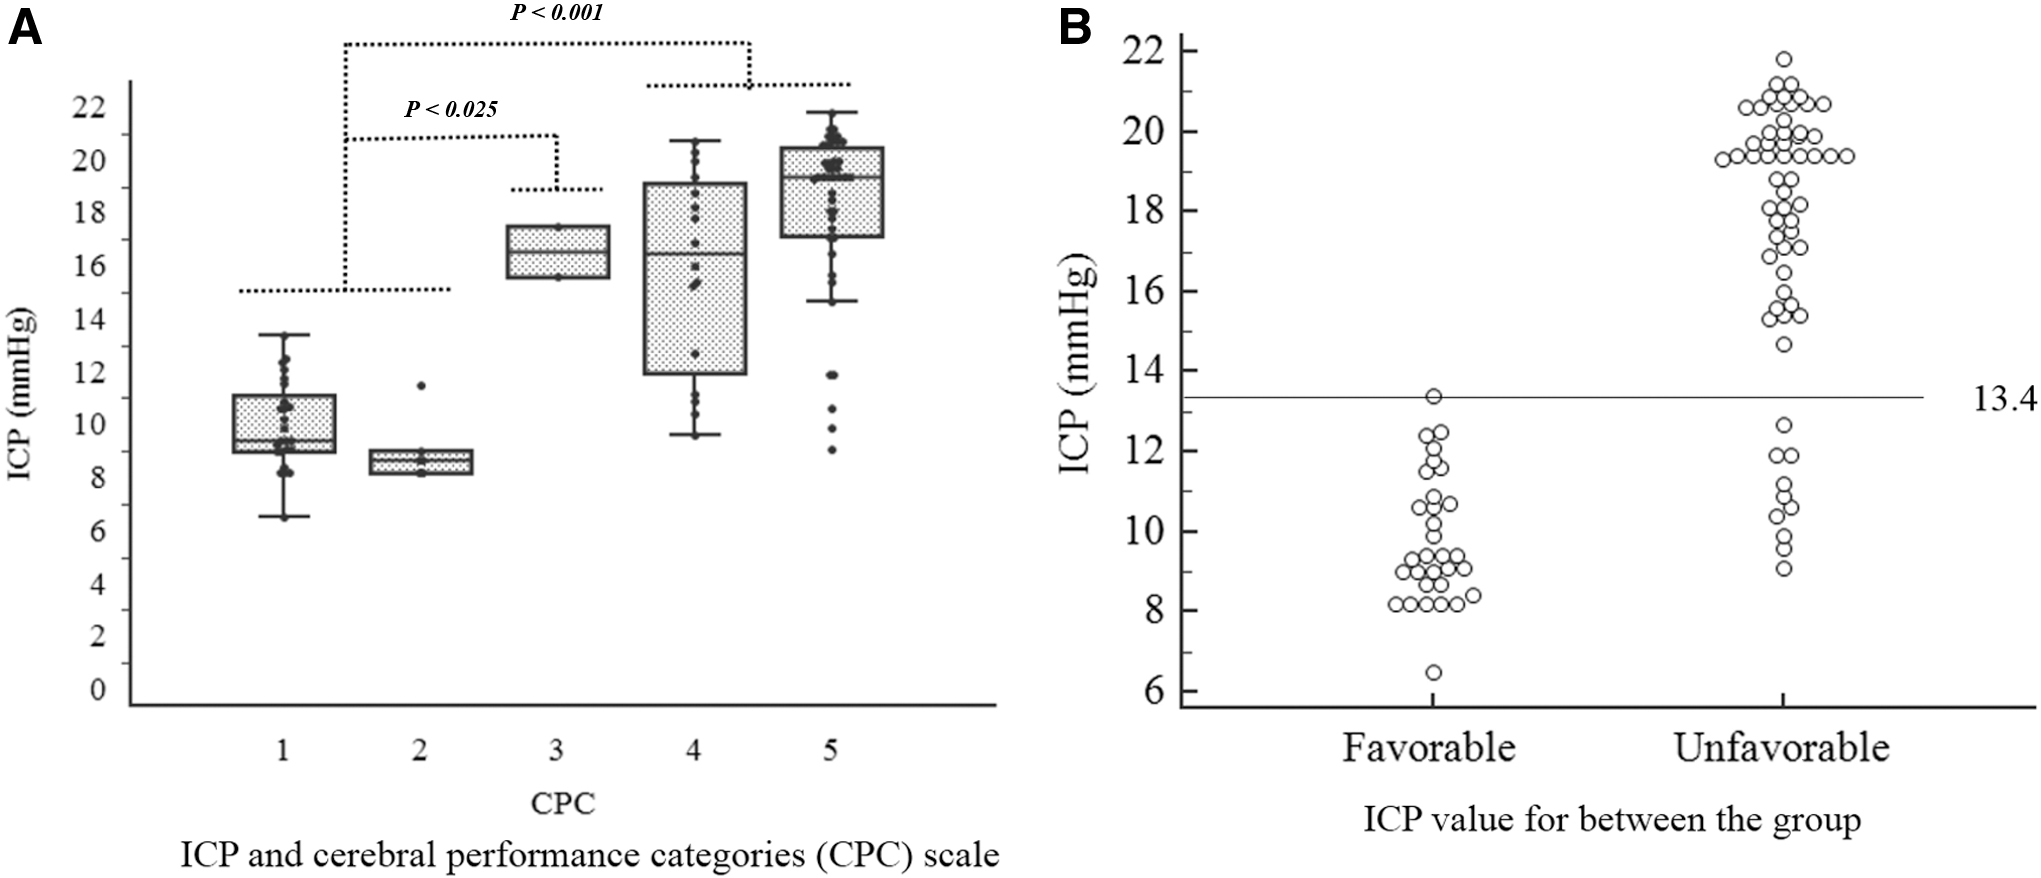
Comparison of ICP and cerebral performance categories scale
Correlation between MAP and ICP
MAP and ICP did not show significant correlation (r = 0.20, p = 0.055) (Fig. 4). However, regardless of the MAP value, the high ICP showed an unfavorable outcome.
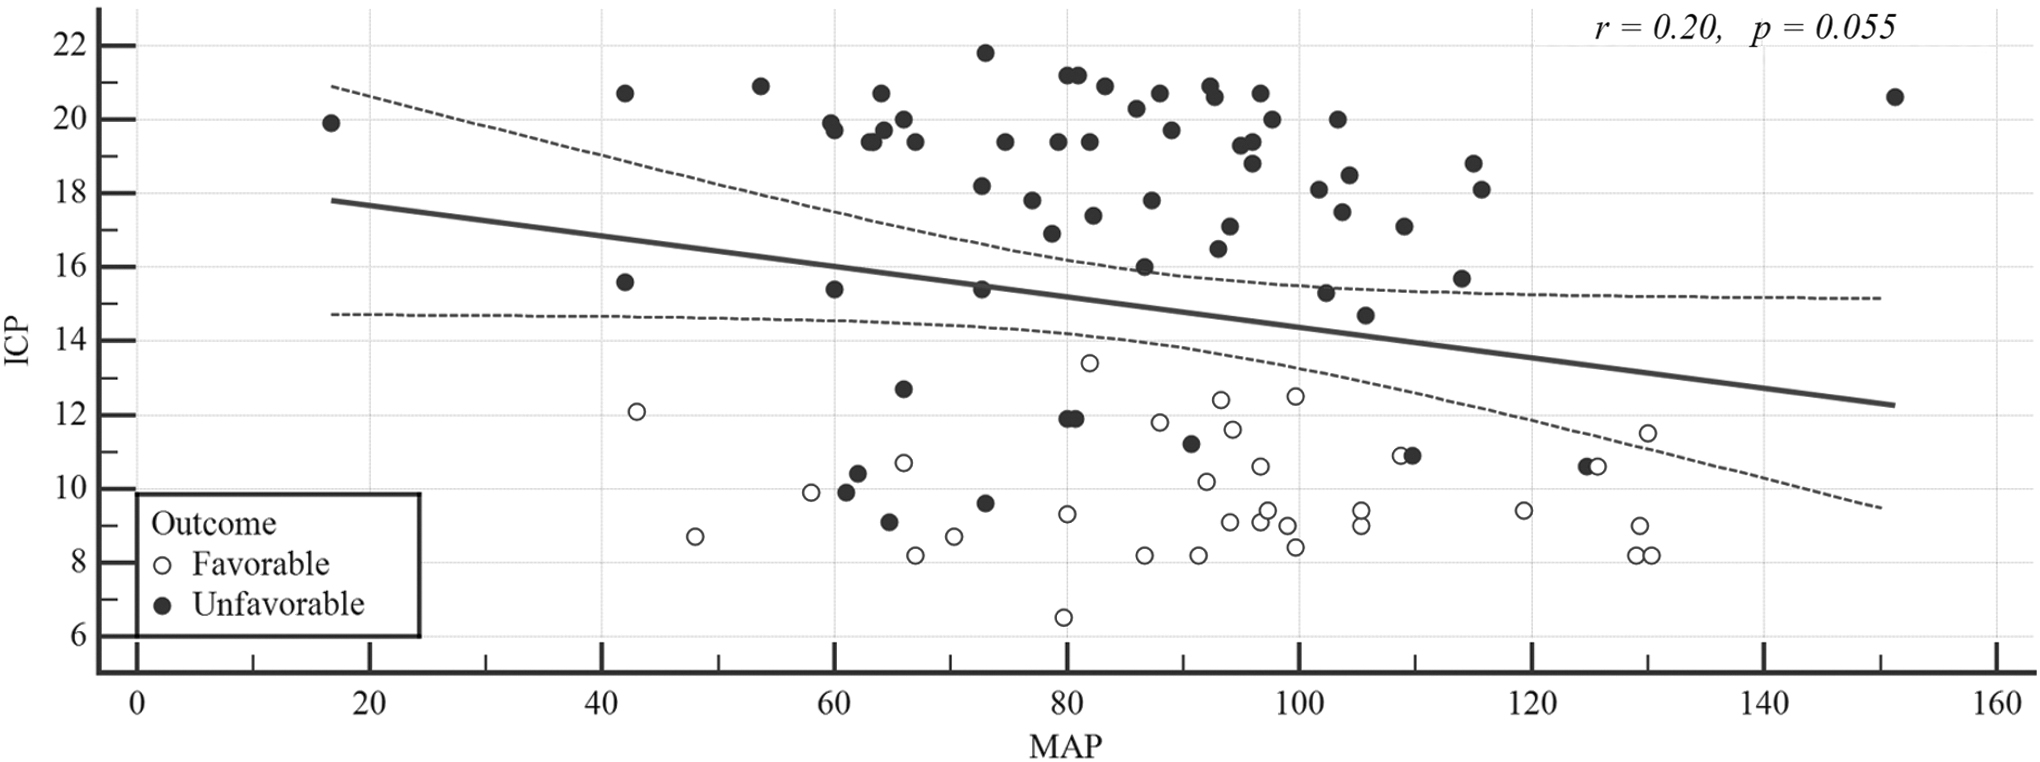
Correlations of ICP and MAP between the favorable and unfavorable neurological outcome group.
Discussion
In this study, MAP and ICP differed significantly in relation to favorable and unfavorable neurological outcomes at 6 months post-CA. Prognostic performance showed ICP as a higher accurate predictive prognostic indicator of neurological outcome than MAP. All patients with ICP >13.4 mmHg showed unfavorable outcome.
To supply blood to the brain, a driving force is needed to push the blood, and is calculated as the difference between ICP and MAP (Ko, 2011). In terms of circulation to the brain, the ICP acts as “resistance” influencing blood circulation within the brain. Under normal conditions, blood pressure and CPP fluctuate; however, blood vessels in the brain repeatedly contract and relax to maintain a constant CBF, a process known as “autoregulation” (Wartenberg et al., 2007). When cerebrovascular autoregulation is maintained, ICP decreases as blood pressure rises because the blood vessels contract to maintain a constant CBF. However, when there is loss of cerebrovascular autoregulation, CBF increases as the blood pressure rises, leading to an increased cerebral blood volume and ICP (Wartenberg et al., 2007; Ko, 2011). Cerebral autoregulation ensures a stable CBF over a wide range of MAP (Robertson, 2001; Czosnyka and Pickard, 2004). If MAP is outside the autoregulation zone, it can result in secondary brain injury (Robertson, 2001; Czosnyka and Pickard, 2004; Wartenberg et al., 2007). The current American Heart Association guidelines on post-CA care recommend maintaining an MAP of ≥65 mmHg post-CA, although evidence for this is limited (Callaway et al., 2015). Bhate et al. (2015) reported that higher blood pressure was associated with improved outcomes (neurological outcome or decreased mortality) in their systematic review. In this study, the cutoff MAP value for predicting neurological outcome was 92.7 mmHg, which was higher than 65 mmHg. In addition, the favorable outcome group had a higher MAP than unfavorable outcome group.
Several studies have reported ICP in patients surviving after CA, but few studies have directly measured ICP. Most studies have shown that ICP values for the first 24 hours after ROSC are not useful in predicting prognosis. In one study, ICP was monitored in six patients after CA (Iida et al., 1997). During the first 24 hours, no increase in ICP was detected; however, three patients developed an increased ICP, with brain death subsequently observed in two patients. In another study, the ICP did not differ between the patients in the favorable neurological outcome group and those in the unfavorable group for the first 24 hours (Hifumi et al., 2017). After 36 hours, ICP levels were significantly different between the two groups. We measured ICP 90 minutes after ROSC, which showed significant differences between the favorable and the unfavorable neurological outcome groups. In the favorable neurological outcome group, all measurements were
This study had several limitations. First, it was a single-center retrospective study, and a multicenter prospective study is required to enhance the generalizability of the findings. Second, among the 202 patients reviewed for inclusion, 56 (27.7%) were excluded from the study as CSF pressure was not measured. This might have caused selection bias. Besides these patients, a substantial number of patients were excluded according to various missing data, which could limit the generalizability of our findings. Third, this is a retrospective study with many limitations in study design (e.g., an isolated measurement to estimate a continuous physiological process, without the data necessary to fully explore the relationship between ICP and MAP at a patient level; limited data about whether MAP measured at the time was affected by concomitant procedures, such as CSF tapping; and no data were available on vasopressor administration during the CSF pressure measurement). Fourth, previous studies have revealed that ICP values measured 24 hours post-CA are meaningful for predicting neurological outcome or death; thus, continuous monitoring is required. Despite these limitations and unlike values reported in previous studies, ICP values measured before TTM also showed high AUC values in predicting neurological outcomes and mortality in CA survivors who underwent TTM. We believe ICP and MAP are useful tools to predict neurological outcomes before performing TTM.
Conclusion
ICP and MAP measured early after ROSC were significantly associated with neurological outcome 6 months after TTM. Higher accurate prognosis was predicted by ICP than MAP. A multicenter study with a larger sample size is needed to confirm these results.
Footnotes
Author Disclosure Statement
No competing financial interests exist.
Funding Information
This study was supported by research fund of Chungnam National University in 2018.