




Abstract
We aimed to use temperature and the area under temperature curve to represent the severity of abnormal body temperature of patients with septic shock and to observe their impact on the prognosis. Five hundred twenty-eight adult patients with septic shock admitted to intensive care unit (ICU) were analyzed. Within the first 24 hours and throughout the period in ICU, the maximum temperature (24hTmax, Tmax), lowest temperature (24hTmin, Tmin), and the temperature range (24hTmax–min, Tmax–min) were aggregated. Patients were divided into the survival group and the death group. Binary logistic regression was used to assess the relationship between body temperature aberrations and survival. The following risk factors of death in 21 days were identified: Tmax (odds ratio [OR] 2.967, 95% confidence interval [CI] 1.626–5.414, p < 0.001), Tmin (OR 0.337, 95% CI 0.143–0.794, p = 0.013), and Tmax–min (OR 3.259, 95% CI 1.847–5.749, p < 0.001). This is an observational study, so one can infer association but not causation. Therefore, we infer that abnormal body temperature is associated with an adverse prognosis in patients with septic shock.
Introduction
Fever is one of the defensive mechanisms of the human body against pathogens, which contributes to enhanced immunity and subsequent pathogen elimination (Evans et al., 2015). Fever is common in septic patients, some of whom could develop hypothermia (Kushimoto et al., 2013; Drewry et al., 2015; Wiewel et al., 2016). Sepsis is defined as life-threatening organ dysfunction as a result of dysregulated host response to infections (Singer et al., 2016). Questions remain whether patient's body temperature can be “dysregulated,” and whether abnormal body temperature can be detrimental to patients. If abnormal body temperature is associated with outcome in this high-risk population, it is plausible that active temperature management may improve outcomes.
Many clinical studies have suggested that hypothermia aggravates the prognosis of septic patients (Tiruvoipati et al., 2010; Kushimoto et al., 2013; Drewry et al., 2015; Wiewel et al., 2016). However, the role and impact of fever on final prognosis of septic patients are still controversial, as some studies suggested fever might be beneficial (Drewry et al., 2015, 2018; Rumbus et al., 2017), whereas others suggested that it is associated with harm (Lee et al., 2012; Zhang et al., 2015). We have noted that those studies measured body temperature at different time points, such as immediately after enrollment (Kushimoto et al., 2013), within 24 hours of diagnosis of sepsis (Drewry et al., 2015, 2018), within 24 hours (Tiruvoipati et al., 2010; Wiewel et al., 2016), or the whole period (Lee et al., 2012; Zhang et al., 2015) in intensive care unit (ICU) after admission.
Schortgen et al. (2015) reported that the longer time spent with a temperature below 38.4°C, the better the patient's outcome. Therefore, we speculate that both the magnitude and the duration of abnormal body temperature may affect the outcome of patients. In line with this notion, the area under the temperature curve combines the magnitude and the duration of body temperature, thereby more accurately representing the severity of body temperature abnormality. A retrospective case cohort study was therefore designed to observe the impact of abnormal body temperature and area under the temperature curve on the prognosis among septic shock patients.
Materials and Methods
Adult patients, who were diagnosed of septic shock according to Surviving Sepsis Campaign 2016 guidelines and admitted to ICU from January 2013 to December 2017, were identified by searching our hospital electronic medical records. Exclusion criteria were as follows: (1) suffering from cardiopulmonary resuscitation, (2) with acute trauma, (3) with brain injury or cerebrovascular accident, (4) with hypothyroidism or hyperthyroidism, (5) ICU time over 21 days, and (6) with incomplete prognostic information.
Related data were obtained from the database of Wuxi People's Hospital affiliated to Nanjing Medical University, including gender, age (admission time − birth time), use of antipyretics, time of ICU stay (discharge time in ICU − admission time in ICU), sites of infection, first Sequential Organ Failure Assessment (SOFA) score, and prognosis information of patients in 21 days (survival or nonsurvival). The core temperature (rectal temperature) of patients were also retrieved from the hospital electronic medical record and recorded as body temperature and measurement time in the format of T1t1, T2t2, and so on. The temperature data interval was 4 hours, with additional data in the middle if abnormal body temperature happened. The maximum body temperature (24hTmax), minimum body temperature (24hTmin), and temperature range (24hTmax–min) within 24 hours after admission to ICU were calculated. The maximum body temperature (Tmax), minimum body temperature (Tmin), and temperature range (Tmax–min) during the ICU stay were also calculated.
We set different body temperature magnitude as T and calculated: (1) the area under the temperature curve when body temperature was higher than T (area > T, A>T, shown in Supplementary Fig. S1); (2) the area under the temperature curve when body temperature was lower than T (area < T, A<T, shown in Supplementary Fig. S2). The area between two temperature points was first calculated. Supplementary Figures S3, S4, S5, S6 illustrates the calculation methods. The total area was calculated at last. The area section covered by the temperature curve between T1 and T2 (AT1–T2) was calculated by the method of two area subtraction (shown in Supplementary Fig. S7). For example, the area of 38–38.5°C covered under the curve (A38–38.5°C) was A>38°C minus A>38.5°C.
Patients were divided into the survival group and the nonsurvival group according to their prognosis within 21 days in ICU. The differences in gender, age, time in ICU stay, sites of infection, and SOFA score between the two groups were analyzed. The effects of Tmax, Tmin, Tmax–min, 24hTmax, 24hTmin, and 24hTmax–min on the prognosis of patients were analyzed. Different T values were set up to analyze the effects of A<T on the prognosis. AT1–T2 were analyzed to observe their effects on the prognosis.
SPSS 18.0 (IBM, Inc., USA) was used for statistical analysis. The Shapiro–Wilk test was used to test the normality of the continuous variables. The continuous variable with normal distribution was presented as mean ± standard deviation, and the differences between two groups were determined by Student's t-test. The continuous variable of nonnormal distribution was presented as median with interquartile range, and the differences between the two groups were determined by rank test. Categorical variables were described as number or rate, and the differences between two groups were determined by chi-square test. The effect of temperature date on prognosis was analyzed by binary logistic regression analysis, and the Hosmer–Lemeshow test was used to test goodness of fit for logistic regression models. p-Value <0.05 was considered to be statistically significant for all tests.
Results
A total of 862 patients with septic shock were treated in ICU during 2013–2017, of which 528 were finally eligible after exclusion. Three hundred ninety-nine patients survived in ICU within 21 days, whereas 129 patients died. The gender, age, use of antipyretics, time of ICU stay, SOFA score, and the sites of infection between the two groups are shown in Table 1. Between the two groups, the differences in terms of gender, use of antipyretics, and the sites of infection were not statistically significant (p > 0.05), whereas age and SOFA score were significantly higher and time of ICU stay was shorter in the nonsurvival group than the survival group (p < 0.05).
Baseline for Patients with Septic Shock
ICU, intensive care unit; M (IQR), median (interquartile range); SOFA, Sequential Organ Failure Assessment.
The effects of Tmax, Tmin, Tmax–min, 24hTmax, 24hTmin, and 24hTmax–min on prognosis were analyzed, and the results were adjusted by age, time of ICU stay, and SOFA score (Fig. 1). The results showed that there was no relationship between temperature in the first 24 hours and outcome, but there was between overall temperature and outcome. Increased Tmax, increased Tmax–min, and decreased Tmin were found to be risk factors of death within 21 days (p < 0.05). The differences were statistically significant, with odds ratio (OR), 95% confidence interval (CI), and p values shown in Figure 1.
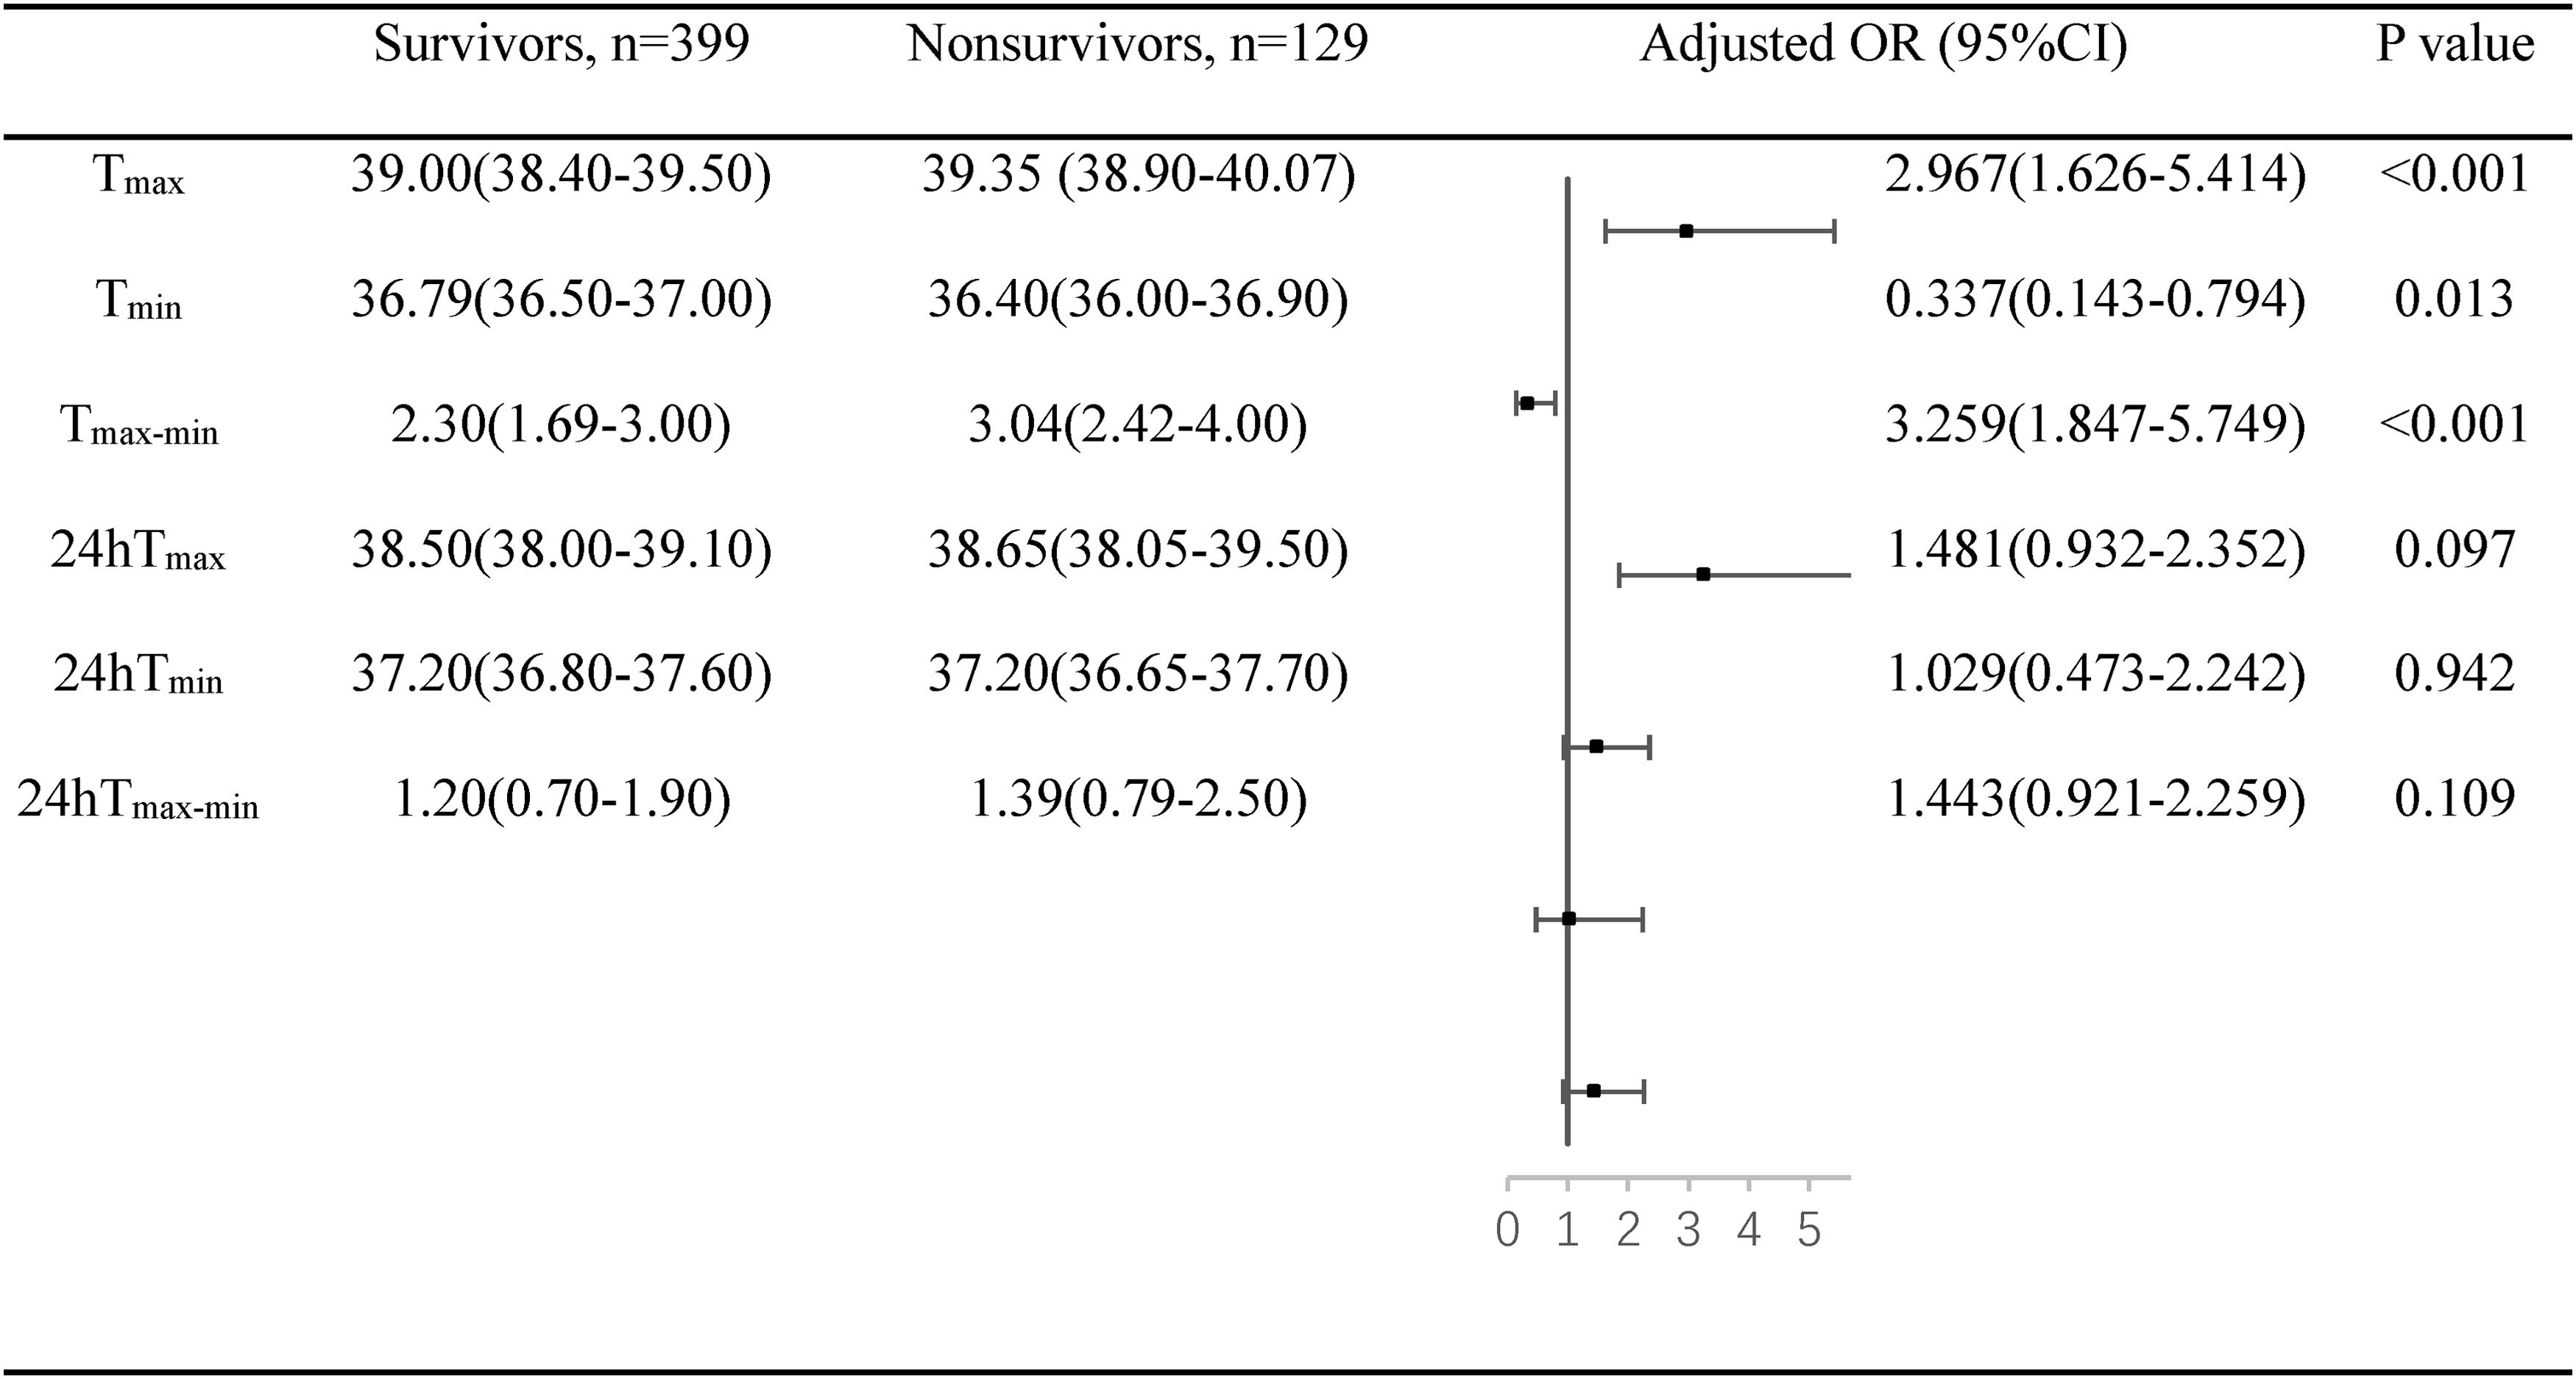
The effects of Tmax, Tmin, Tmax–min, 24hTmax, 24hTmin, and 24hTmax–min on prognosis in patients with septic shock. Data are expressed as M (IQR). The following variables were entered into the model: age, time of ICU stay, and SOFA score. CI, confidence interval; ICU, intensive care unit; M (IQR), median (interquartile range); OR, odds ratio; SOFA, Sequential Organ Failure Assessment; Tmax, maximum temperature during ICU; Tmin, minimum temperature during ICU; Tmax–min, difference of Tmax and Tmin; 24hTmax, maximum temperature within the first 24 hours in ICU; 24hTmin, minimum temperature within the first 24 hours in ICU; 24hTmax–min, difference of 24hTmax and 24hTmin.
The effect of A<T on prognosis was analyzed in Figure 2, with the results adjusted by age, time of ICU stay, and SOFA score. A<35.9°C and A<36°C were risk factors of death in 21 days. OR, 95% CI, and p values are shown in Figure 2.
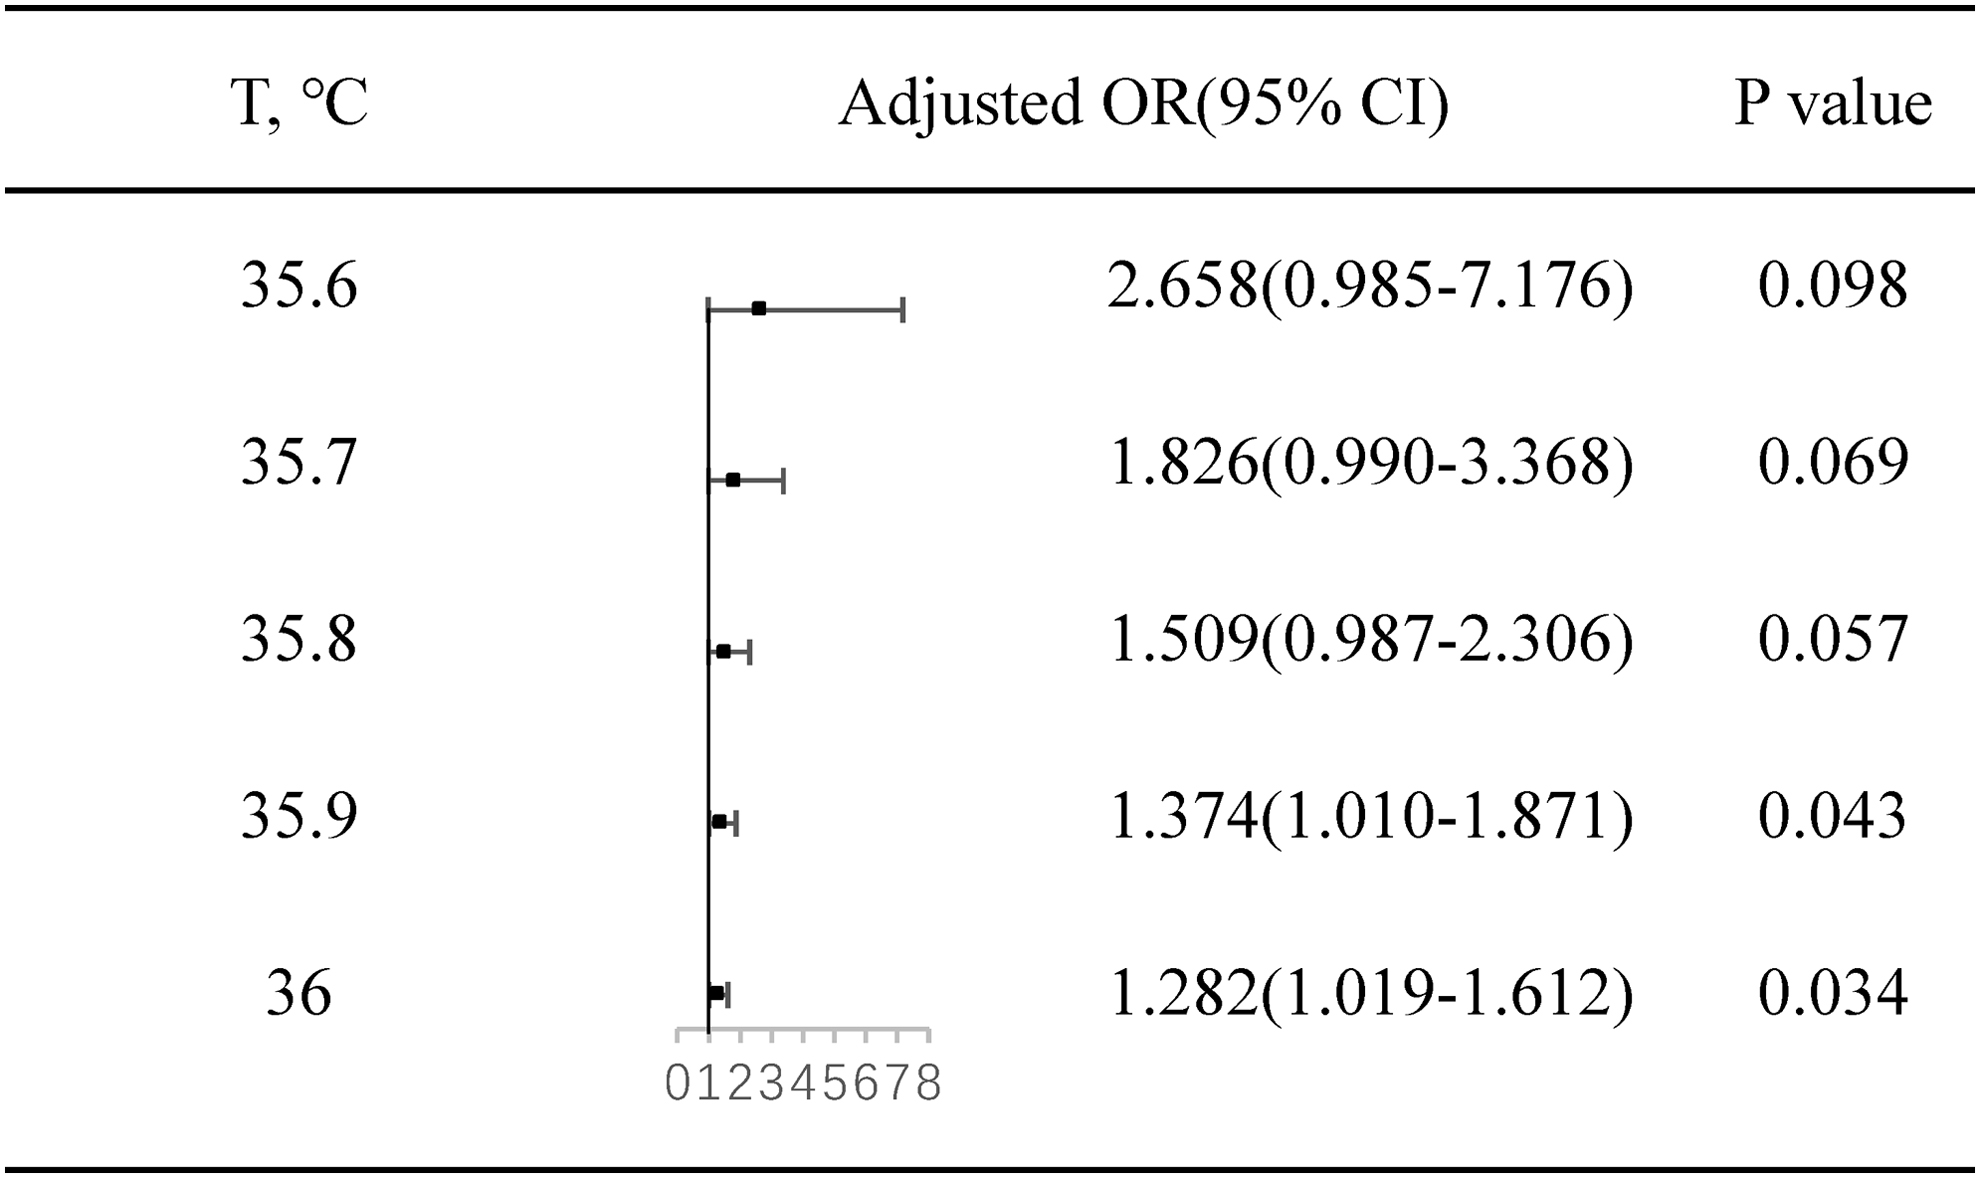
The effects of A<T on prognosis in patients with septic shock. A<T, area above temperature curve when below different T levels. The following variables were entered into the model: age, time of intensive care unit stay, and Sequential Organ Failure Assessment score. CI, confidence interval; OR, odds ratio.
The independent effect of AT1–T2 on prognosis was assessed after adjustment for age, time of ICU stay, and SOFA score. The analysis showed that A37–37.5°C and A37.5–38°C had no significant effect on prognosis. A36.5–37°C exhibited protective impacts on prognosis (OR 0.960, 95% CI 0.933–0.989). However, A38–38.5°C, A38.5–39°C, and A39–39.5°C exhibited adverse impacts on prognosis. And, the relative risk of death was increased by 4.4%, 11.7%, and 36.7%, respectively, when area was increased by 1°C × hours. The differences were statistically significant (p < 0.05), with OR, 95% CI, and p values shown in Figure 3.

The effects of AT1–T2 on prognosis in patients with septic shock. AT1–T2, area under temperature curve between T1 level and T2 level. The following variables were entered into the model: age, time of intensive care unit stay, and Sequential Organ Failure Assessment score. CI, confidence interval; OR, odds ratio.
Discussion
In the current study, we have confirmed that among patients with septic shock within 21 days in ICU, the prognosis becomes worse with decreased Tmin, as well as increased Tmax and Tmax–min. Further analysis showed that A36.5–37°C was associated with a favorable prognosis. Meanwhile, A38–38.5°C, A38.5–39°C, and A39–39.5°C could aggravate prognosis, and when the area was increased by 1°C × hours, relative risks for death in 21 days for patients could be enhanced by 4.4%, 11.7%, and 36.7%, respectively. If patients having a core temperature within a specific range are associated with outcome, then active temperature management to maintain patients within that range may be associated with outcome.
Our results are consistent with previous studies. Zhang et al. (2015) reported that increased Tmax was associated with increased mortality during ICU stay. Lee et al. (2012) divided the highest body temperature of sepsis patients into five groups, in which the highest temperature ranged from <36.5°C to >39.5, and mortality in 28 days decreased first but then increased. Similar comparison of the highest temperature was not performed in our study. When analyzing the effects of A37–37.5°C on prognosis, we observed that OR value was lower than 1, which can explain their results. Schortgen et al. (2012) found that external cooling of fever patients with septic shock could improve prognosis in 14 days. To verify that reduced mortality was caused by lowered body temperature or heart rate, time of fever, and heart rate were recorded as potential mediating factors for analysis, and the results indicated that decreased mortality in 14 days was correlated with reduced body temperature. The authors concluded that the time body temperature stayed below 38.4°C was correlated with the lower mortality in 14 days (Schortgen et al., 2015), consistent with our results that duration of abnormal body temperature could affect prognosis.
In Zhang's study, temperature load, defined as the difference between actual temperature area and normal temperature area, was employed to study effects on prognosis, and the results showed that higher the temperature load correlated with the higher mortality rate (Zhang et al., 2015), similar to our results. However, their method is not reasonable enough since value of the above-mentioned difference in two areas might be negative, as no temperature load was analyzed in fever patients. In our current study, A<T and AT1–T2 were analyzed as severity of abnormal temperature, which we believe are more appropriate.
However, some of our results are different from previous studies. Drewry et al. (2018) reported that mortality of severe septic patients with body temperature above 38°C was lower than others (18.2% vs. 37.5%), whereas in another study by Drewry et al. (2015), mortality was higher in patients with temperature below 36°C (50%). However, if patients with temperature below 38°C were divided into groups of 36–38°C and <36°C, the results of the analysis could then possibly be consistent with ours. In a meta-analysis, some scholars compared prognosis of septic patients with temperatures of <36°C, 36–38°C, and >38°C and reported that higher body temperature was correlated with lower mortality (Kushimoto et al., 2013). However, their sources of data were not homogeneous. For example, Kushimoto's data with temperature between 36.5°C and 37.5°C were categorized as 36°C and 38°C. In addition to heterogeneous data sources, the temperature values adopted in the study were recorded at different time points, which may impact on the generalizability of the study results.
Influence of fever and hypothermia on human body is very complex (Launey et al., 2011; Annane, 2018). Romanovsky and Székely (1998) reported that fever and hypothermia were two indicative forms of systemic inflammatory responses, and their occurrence could be determined by energy metabolism. While Gogos et al. (2003) suggested that fever and hypothermia in severe septic patients were symptoms of multiple organ failure. Oxygen consumption is reduced with low body temperature. However, hypothermia may lead to left shifting of oxygen dissociation curve, aggravated hypoxia, and disordered metabolism. Hypothermia could influence coagulation function (Martini, 2007), leading to disorders in cardiac functions, multiple organs, and even lack of responsiveness to fluid resuscitation (Leisman et al., 2018). During fever, the inflammatory factors stimulate innate and adaptive immunity (Evans et al., 2015) and improve the efficacy of antibiotics (Mackowiak and Marling-Cason, 1983), assisting the body to eliminate pathogens.
However, metabolic requirement in fever patients is increased, and oxygen consumption of organs is increased as well, potentially leading to tachycardia, cardiac function injury (Haupt and Rackow, 1983), and lung injury (Pernerstorfer et al., 1995). Septic shock is a severe sepsis status. Influence of body temperature on prognosis is determined by the balance between benefits and damages. Although it is impossible to calculate A<T and AT1–T2 in clinics, but we know that the greater the abnormal temperature, the longer the time, the worse the prognosis.
There are nevertheless some limitations in our study. The time point of discharge or 28 or 30 days is generally considered to study the prognosis of patients with sepsis. The choice of 21 days is a limitation of this study. In the analysis of A<T, severe hypothermia is associated with worse prognosis. However, because of the limited number of cases, only A<35.9°C and A<36.0°C have statistical significance. When using binary logistic regression for prognosis analysis, ages, time of ICU stay, and SOFA score were adjusted. However, other confounders, such as duration of renal replacement therapy, use of steroids or neuromuscular blockers, features of cultured pathogen, amount of fluid resuscitation, and fitness of antibiotics, may affect the prognosis and temperature. Despite the moderate sample size of this study, it lacked power to detect small but important relationships between core temperature and outcome. This study is a retrospective analysis; we cannot give direct causality between temperature and prognosis. Further prospective studies with larger sample size, more homogeneity of the temperature index, and more adjusted confounders could provide more comprehensive and accurate analysis.
In conclusion, we hereby demonstrate that Tmax, Tmin, and Tmax–min are risk factors for death in patients with septic shock in ICU within 21 days. Greater temperature burden below 36°C or above 38°C was associated with increased mortality. The area under curve can be used to study the effect of abnormal temperature on prognosis of septic shock.
Footnotes

References
Supplementary Material
Please find the following supplemental material available below.
For Open Access articles published under a Creative Commons License, all supplemental material carries the same license as the article it is associated with.
For non-Open Access articles published, all supplemental material carries a non-exclusive license, and permission requests for re-use of supplemental material or any part of supplemental material shall be sent directly to the copyright owner as specified in the copyright notice associated with the article.
