




Abstract
Traumatic brain injury (TBI) has the potential to perturb perception by disrupting electrical propagation within and between the thalamus and cerebral cortex. Moderate and severe TBI may result in posttraumatic epilepsy, a condition characterized by convulsive tonic-clonic seizures. Spike/wave discharges (SWDs) of generalized nonconvulsive seizures, also called absence seizures, may also occur as a consequence of brain trauma. As mild hyperthermia has been reported to exacerbate histopathological and behavioral outcomes, we used an unbiased algorithm to detect periodic increases in power across different frequency bands following single or double closed head injury (CHI) under normothermia and hyperthermia conditions. We demonstrated that mild TBI did not significantly alter the occurrence of events containing increases in power between the delta (0.5–4 Hz), theta (4–8 Hz), alpha (8–12 Hz), and beta1 (12–20 Hz) frequency bands in the Sprague Dawley rat 12 weeks after injury. However, when hyperthermia (39°C) was induced before and after CHI, electrographic events containing a similar waveform and harmonic frequency to SWDs were observed in a subset of animals. Further experiments utilizing chronic recordings will need to be performed to determine if these trends lead to absence seizures.
Introduction
Traumatic brain injury (TBI) is a devastating injury resulting in a range of chronic consequences, including memory, attention, speech, and motor dysfunction (Marshman et al., 2013; Strasberg et al., 2016; Gardner et al., 2017; Manley et al., 2017; Shah et al., 2017). Posttraumatic epilepsy (PTE) occurs in ∼22–43% of civilian TBIs and can have an effect on morbidity and mortality (Lhatoo et al., 2001; Lucke-Wold et al., 2015). Nonconvulsive seizures (Lennox, 1945) can be a precursor to the development of convulsive seizures (Young and Jordan, 1998).
Although significant work has been done in the area of PTE following moderate or severe TBI, limited data are available documenting episodes of abnormal neuronal excitation following models of concussion or mild TBI (mTBI). The involvement of concussions (Shandra et al., 2019), or mTBI, in the development of PTE is less clear than in brain injuries of greater severities, including penetrating injuries (Kharatishvili and Pitkanen, 2010; Kelly et al., 2015; Bragin et al., 2016; Ostergard et al., 2016).
Multiple concussions present with the possibility of exacerbated neurological sequela in humans, including progressive neurodegenerative disorders, such as Alzheimer's disease (AD) and chronic traumatic encephalopathy (Manley et al., 2017). To clarify the pathophysiology of repetitive mTBI, experimental models have been used to elucidate injury mechanisms that may underlie the cumulative effects of injury. Various factors, including frequency and number of insults as well as the interval between injuries, are important variables in aggravating injury outcomes compared to single insults (Meehan et al., 2012; Brody et al., 2015; McAteer et al., 2016; Gao et al., 2017; Yu et al., 2017; Huibregtse, 2018). Several mechanisms, including aggravated white matter damage, increased cortical and hippocampal excitability, glucose metabolism, and inflammatory cascades, have been reported to participate in the pathophysiology of repetitive TBI (Brody et al., 2015; Logue et al., 2016; Gao et al., 2017; Robinson et al., 2017; Shandra et al., 2019).
In the area of PTE, evidence for repetitive insults resulting in abnormal patterns of cortical activity are limited. In a study by Shandra et al. (2019), repetitive mild/concussive TBI generated spontaneous convulsive and nonconvulsive seizures in a subset of animals. Thus, more studies are required to clarify what other factors may aggravate the consequences of a single or a multiple mTBI that have possible clinical implications.
The importance of brain temperature has been shown by many laboratories to impact the consequences of TBI ranging from mild to severe. While mild hypothermia following TBI has been shown to attenuate various pathophysiological mechanisms and improve outcomes, a period of mild hyperthermia aggravates a number of secondary injury mechanisms and worsens outcomes in several injury models (Thompson et al., 2003; Dietrich and Bramlett, 2010, 2016; Sakurai et al., 2012; Titus et al., 2015; Truettner et al., 2018). For example, if a period of hyperthermia is induced 24 hours after moderate fluid percussion injury, mortality is increased along with the presentation of swollen axons in the somatosensory cortex, corpus callosum, and internal capsule (Dietrich et al., 1996).
Periods of mild hyperthermia occur in persons following a variety of neurological disorders, including TBI, stroke, and spinal cord injury. Importantly, these periods of refractory hyperthermia have been shown to correlate with worse neurological outcomes (Dietrich and Bramlett, 2007). Mild hyperthermia can also occur in individuals undergoing strenuous activity especially when ambient temperature is elevated (Nybo et al., 2002; Atkins et al., 2017). Furthermore, a comparison of registries by Wade et al. (2011) containing 4093 civilian and 4394 patient military records of TBIs demonstrated that hyperthermia was present in 2.2% of civilians and 7.4% of military patients. Out of 7145 patients with acute head trauma, Li and Jiang reported unfavorable outcomes in 37.6% and 64.4% of patients whose core temperature was between 38°C and 39°C and >39°C, respectively (Li and Jiang, 2012).
When hyperthermia accompanies TBI, a collection of physiological responses ensues, which further exacerbate the primary insult. These responses include increased glutamate and cytokine release, elevated intracranial pressure, and the formation of reactive oxygen species (Dietrich and Bramlett, 2016; Nyholm et al., 2017). Our laboratory has demonstrated that an induced period of hyperthermia (39°C) before and after mild fluid percussion injury increases the cortical contusion and decreases the neuronal count in the dentate hilus of the hippocampus (Sakurai et al., 2012), an area regulating the activity of the seizure-prone dentate gyrus (Santhakumar et al., 2000; Longo et al., 2003; Jinde et al., 2013; Wright and Jackson, 2014). To determine if the presence of hyperthermia during closed head injury (CHI) or repetitive CHI causes electrographic signatures indicative of epilepsy, electrocorticography (ECoG) was recorded 12 weeks following injury.
Materials and Methods
Subjects
Twenty-five male Sprague Dawley rats were randomly assigned to five groups as follows: sham (n = 4), single CHI-normothermia (n = 4), CHI X2-normothermia (n = 6), single CHI-hyperthermia (n = 5), and CHI X2-hyperthermia (n = 6). All animals were housed with access to food and water ad libitum and were exposed to a 12-hour light/dark cycle. All surgical procedures were conducted under the guidelines of the National Institutes of Health (NIH) Guide for the Care and Use of Laboratory Animals and were approved by the University of Miami Animal Care and Use Committee.
Traumatic brain injury
The impact acceleration model of TBI was used to study mTBI as it does not produce a focal lesion, but rather a more diffuse pattern of histopathological damage (Abd-Elfattah and Marmarou, 1994). Rats underwent mild single or repetitive TBI by methods previously described (Foda and Marmarou, 1994; Marmarou et al., 1994). Animals were fasted overnight to avoid fluctuations in blood glucose levels as hyper- or hypoglycemia can affect outcome on brain injury. Rats were anesthetized with 1.5% isoflurane, delivered with 70% nitrous oxide and 30% oxygen. A steel disc (10 mm in diameter and 3 mm thickness) was placed on the skull between bregma and lambda suture lines and secured using dental acrylic. Animals were moved onto a foam mattress underneath the trauma device, and a weight of 450 g fell freely through a vertical tube from 1 m to strike the metal disc. Body temperature and brain temperature were monitored throughout the procedure. The TBI-hyperthermia group was maintained at hyperthermia (39°C), starting 15 minutes before injury and followed by a 2-hour period of hyperthermia. The TBI-normothermia and sham groups were maintained at normothermia (37°C) throughout the surgical procedure and for 2 hours following trauma. Blood pressure was measured continuously through catheterized tail artery, and arterial blood gasses were monitored at standard intervals to ensure adequate oxygenation and ventilation. For those animals undergoing repetitive CHI, the rat was reanesthetized 7 days after the first insult for the second CHI and underwent similar temperature manipulation as described above. The sham group was treated with normothermia in this study because previously published data demonstrated no histopathological consequence of an induced period of restricted mild hyperthermia in sham animals (Dietrich et al., 1996; Suzuki et al., 2004). Following injury, incisions were closed, and after awakening, animals were placed back into their home cage.
Electrode implantation and recording
Twelve weeks after injury Sprague Dawley rats weighing 380–420 g were reanesthetized with isoflurane (3% induction/2% maintenance) and 0.8% nitrous oxide. Depth of anesthesia was monitored by corneal reflex and tail/hind-paw pinch. The animal was head fixed via ear and mouth bars in a stereotaxic head frame. Anesthesia was delivered by a nose cone. A four-centimeter incision was made along the scalp to allow placement of a telemetry battery pack (Millar Research model TR50B) containing two insulated electrodes for differential ECoG recording. A craniotomy the size of each electrode was made 2 mm lateral and 2 mm posterior to bregma and 2 mm lateral and 5 mm posterior to bregma. Burr holes were drilled to not surpass the bottom of the skull and electrodes were secured into position with adhesive. Signals were amplified by 1000 × and visualized with PowerLab AD instruments. When reliable signals were obtained, dental acrylic was applied to secure the two electrodes. Skin staples were used to close the incision. The animal was then transferred to the home cage with food and water. Twenty-four hours later, the animal was placed in an open field for a 1-hour video ECoG recording session. After the recording session was complete, the animal was reanesthetized and transcardially perfused with 4% paraformaldehyde.
Automated detection of power increases
All ECoG recordings were analyzed using EEGgui (Sick et al., 2013) (Fig. 1). Power values for each frequency band, delta (0.5–4 Hz), theta (4–8 Hz), alpha (8–12 Hz), beta1 (12–20 Hz), beta2 (20–30 Hz), and gamma (30–60 Hz), were obtained using a median decaying memory algorithm (Logesparan et al., 2015). Five minutes of normalized awake ECoG from each sham-operated control animal were averaged to serve as a comparator file to detect increases in power (three standard deviations) above the mean for each frequency band. Epileptiform spike/wave discharges (SWDs) were classified as having increases in power across all frequency bands except for gamma.
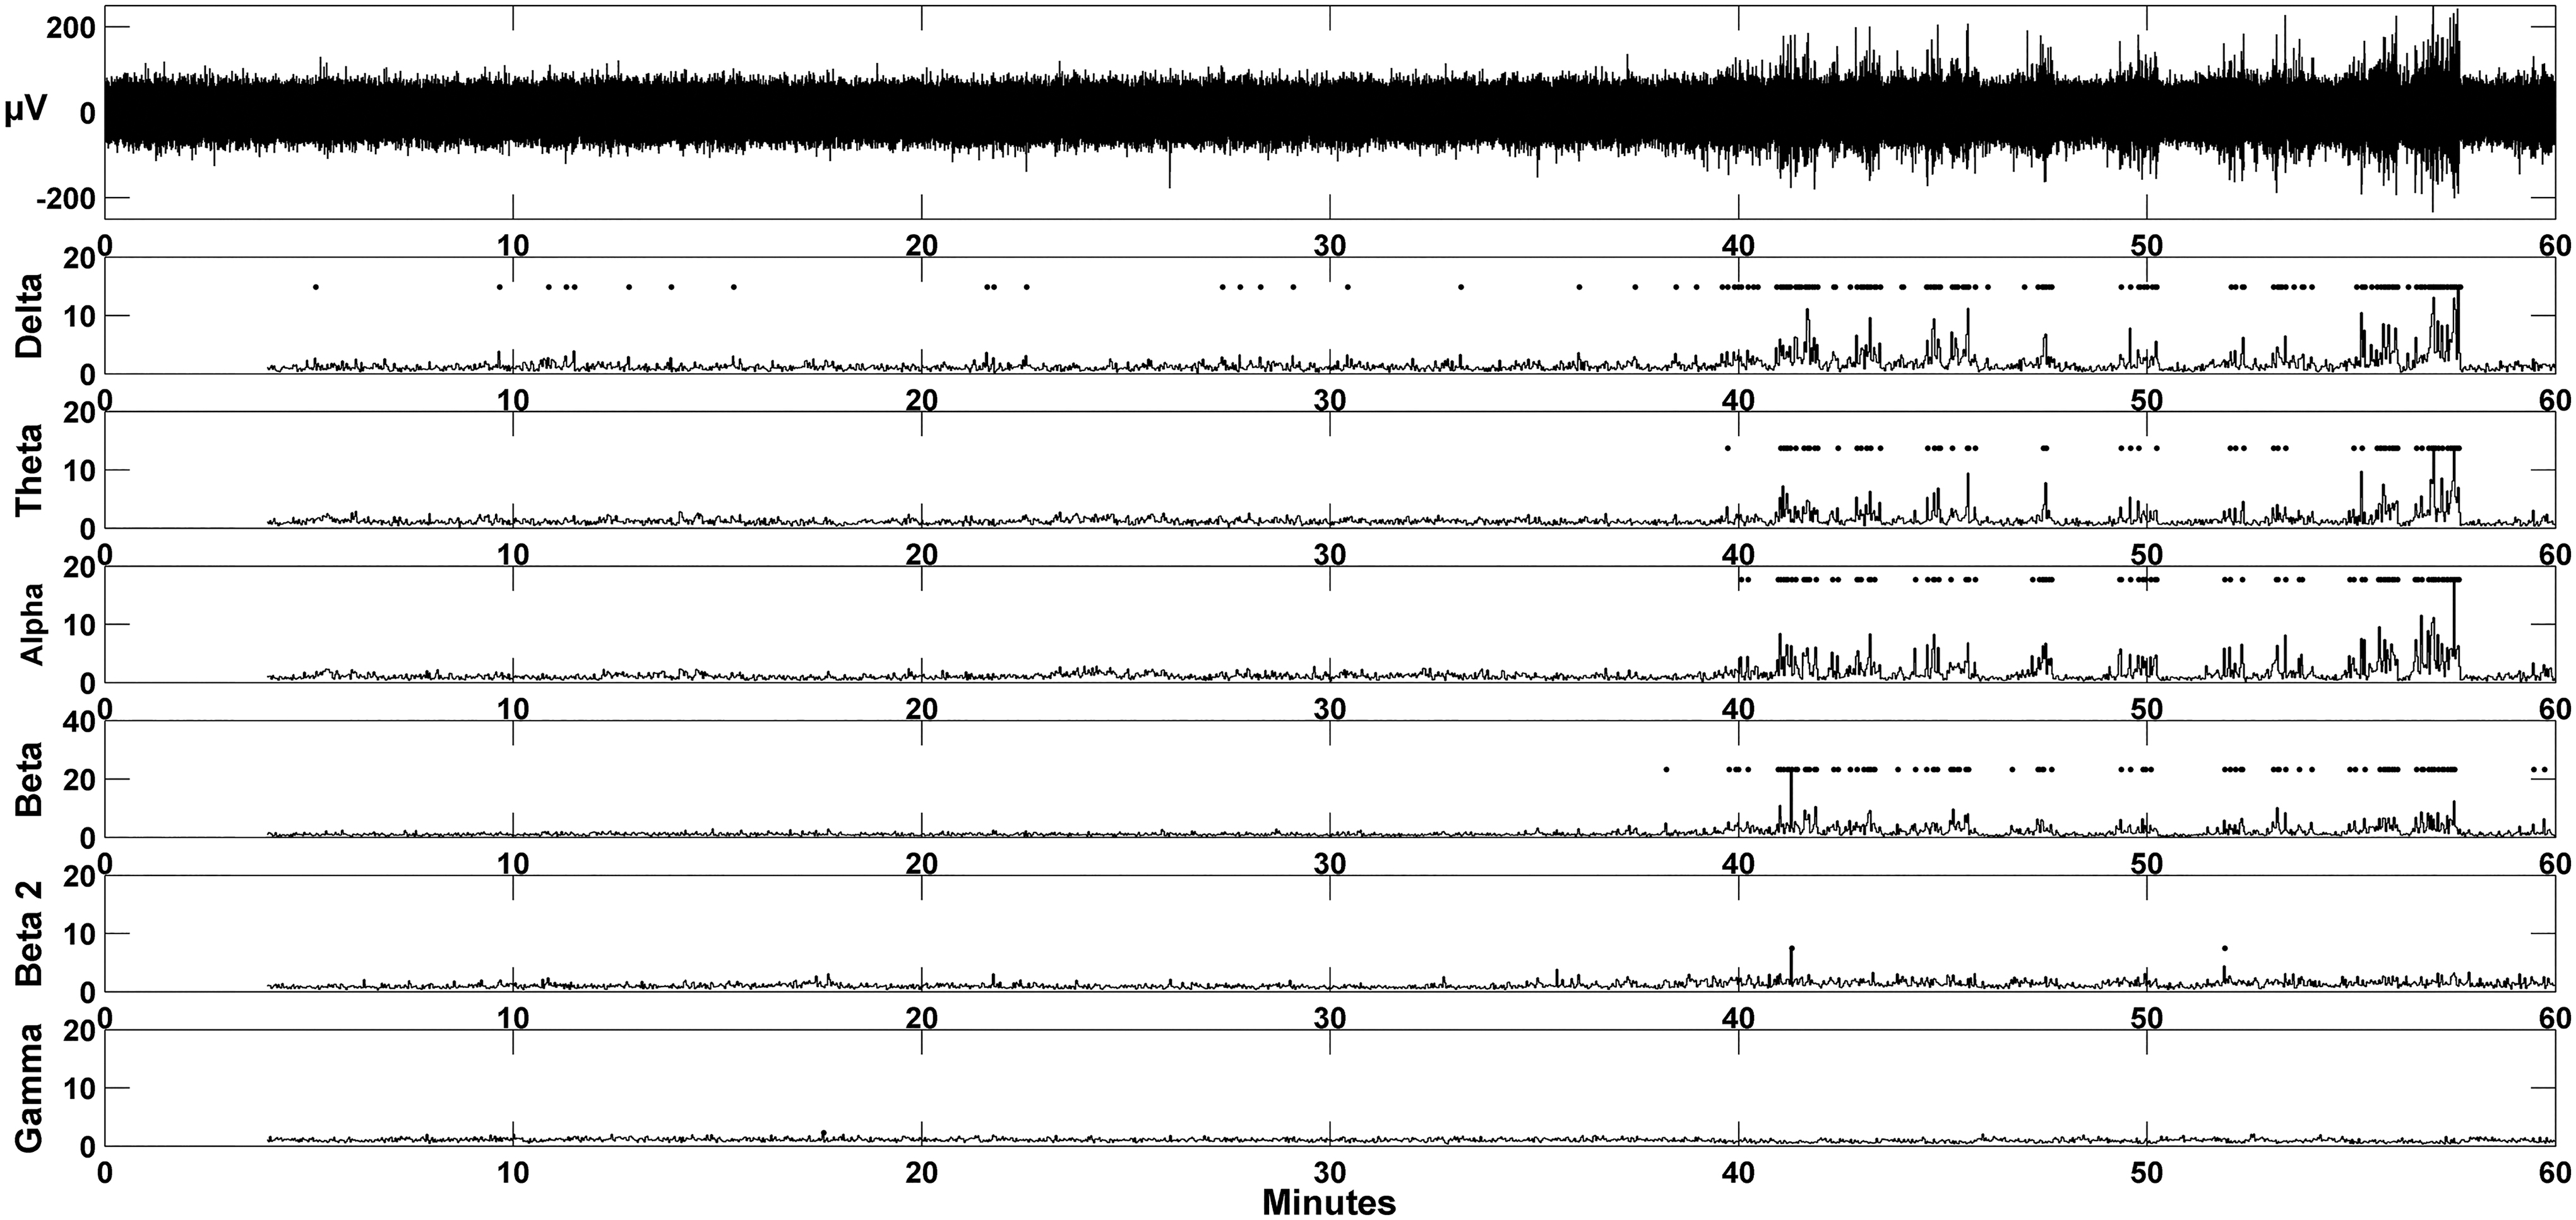
Automatic detection of epileptiform activity. Increases in power were detected using an unbiased algorithm written in the MATLAB platform. The top trace in the figure is 1 hour of ECoG activity from an animal which underwent a single CHI under normothermic conditions. Each row illustrates normalized power for each frequency band: delta, theta, alpha, beta-1, beta-2, and gamma. A diamond is displayed if normalized power for each 2 second epoch exceeded three SDs above baseline exploratory activity. CHI, closed head injury; ECoG, electrocorticography; SD, standard deviation.
Statistical analysis
Epochs containing increases in power between the theta and beta-1 and theta and beta-2 frequency bands were compared using a one-way analysis of variance. Significance was defined as p < 0.05. Seven animals (three shams, three CHIs, and one CHI+hyperthermia) were discarded from the study due to cortical injury from the ECoG electrodes during implantation. An observer blinded to the experimental conditions of each animal verified the presence of cortical injury through histological assessment. One animal from the CHI X2+hyperthermia group was removed due to an audible disturbance during the recording session.
Results
Power spectra during exploratory behavior
ECoG activity during exploratory behavior was quantified by an observer blind to experimental conditions for determination of baseline activity to be compared to animals undergoing experimental manipulation (Fig. 2). Two prominent oscillations were observed when rats were placed into an open field arena, theta oscillations, and delta oscillations (Fig. 2. Panels I and II, respectively). During active exploration, the peak oscillatory frequency was centered at 7 Hz. Some rats demonstrated delta oscillations during periods of immobility, during which peak frequency was between 1 and 2 Hz. Midway through the hour, a third electrographic signature appeared (Fig. 2. Panel III) containing increases in power in the delta, theta, alpha, and beta-1 frequency bands. This particular subject appeared to be sleeping; however, the absence of electromyography (EMG) combined with the ECoG did not allow for determination of arousal state. These events also were evident, to a lesser extent, during what appeared to be awake immobility.
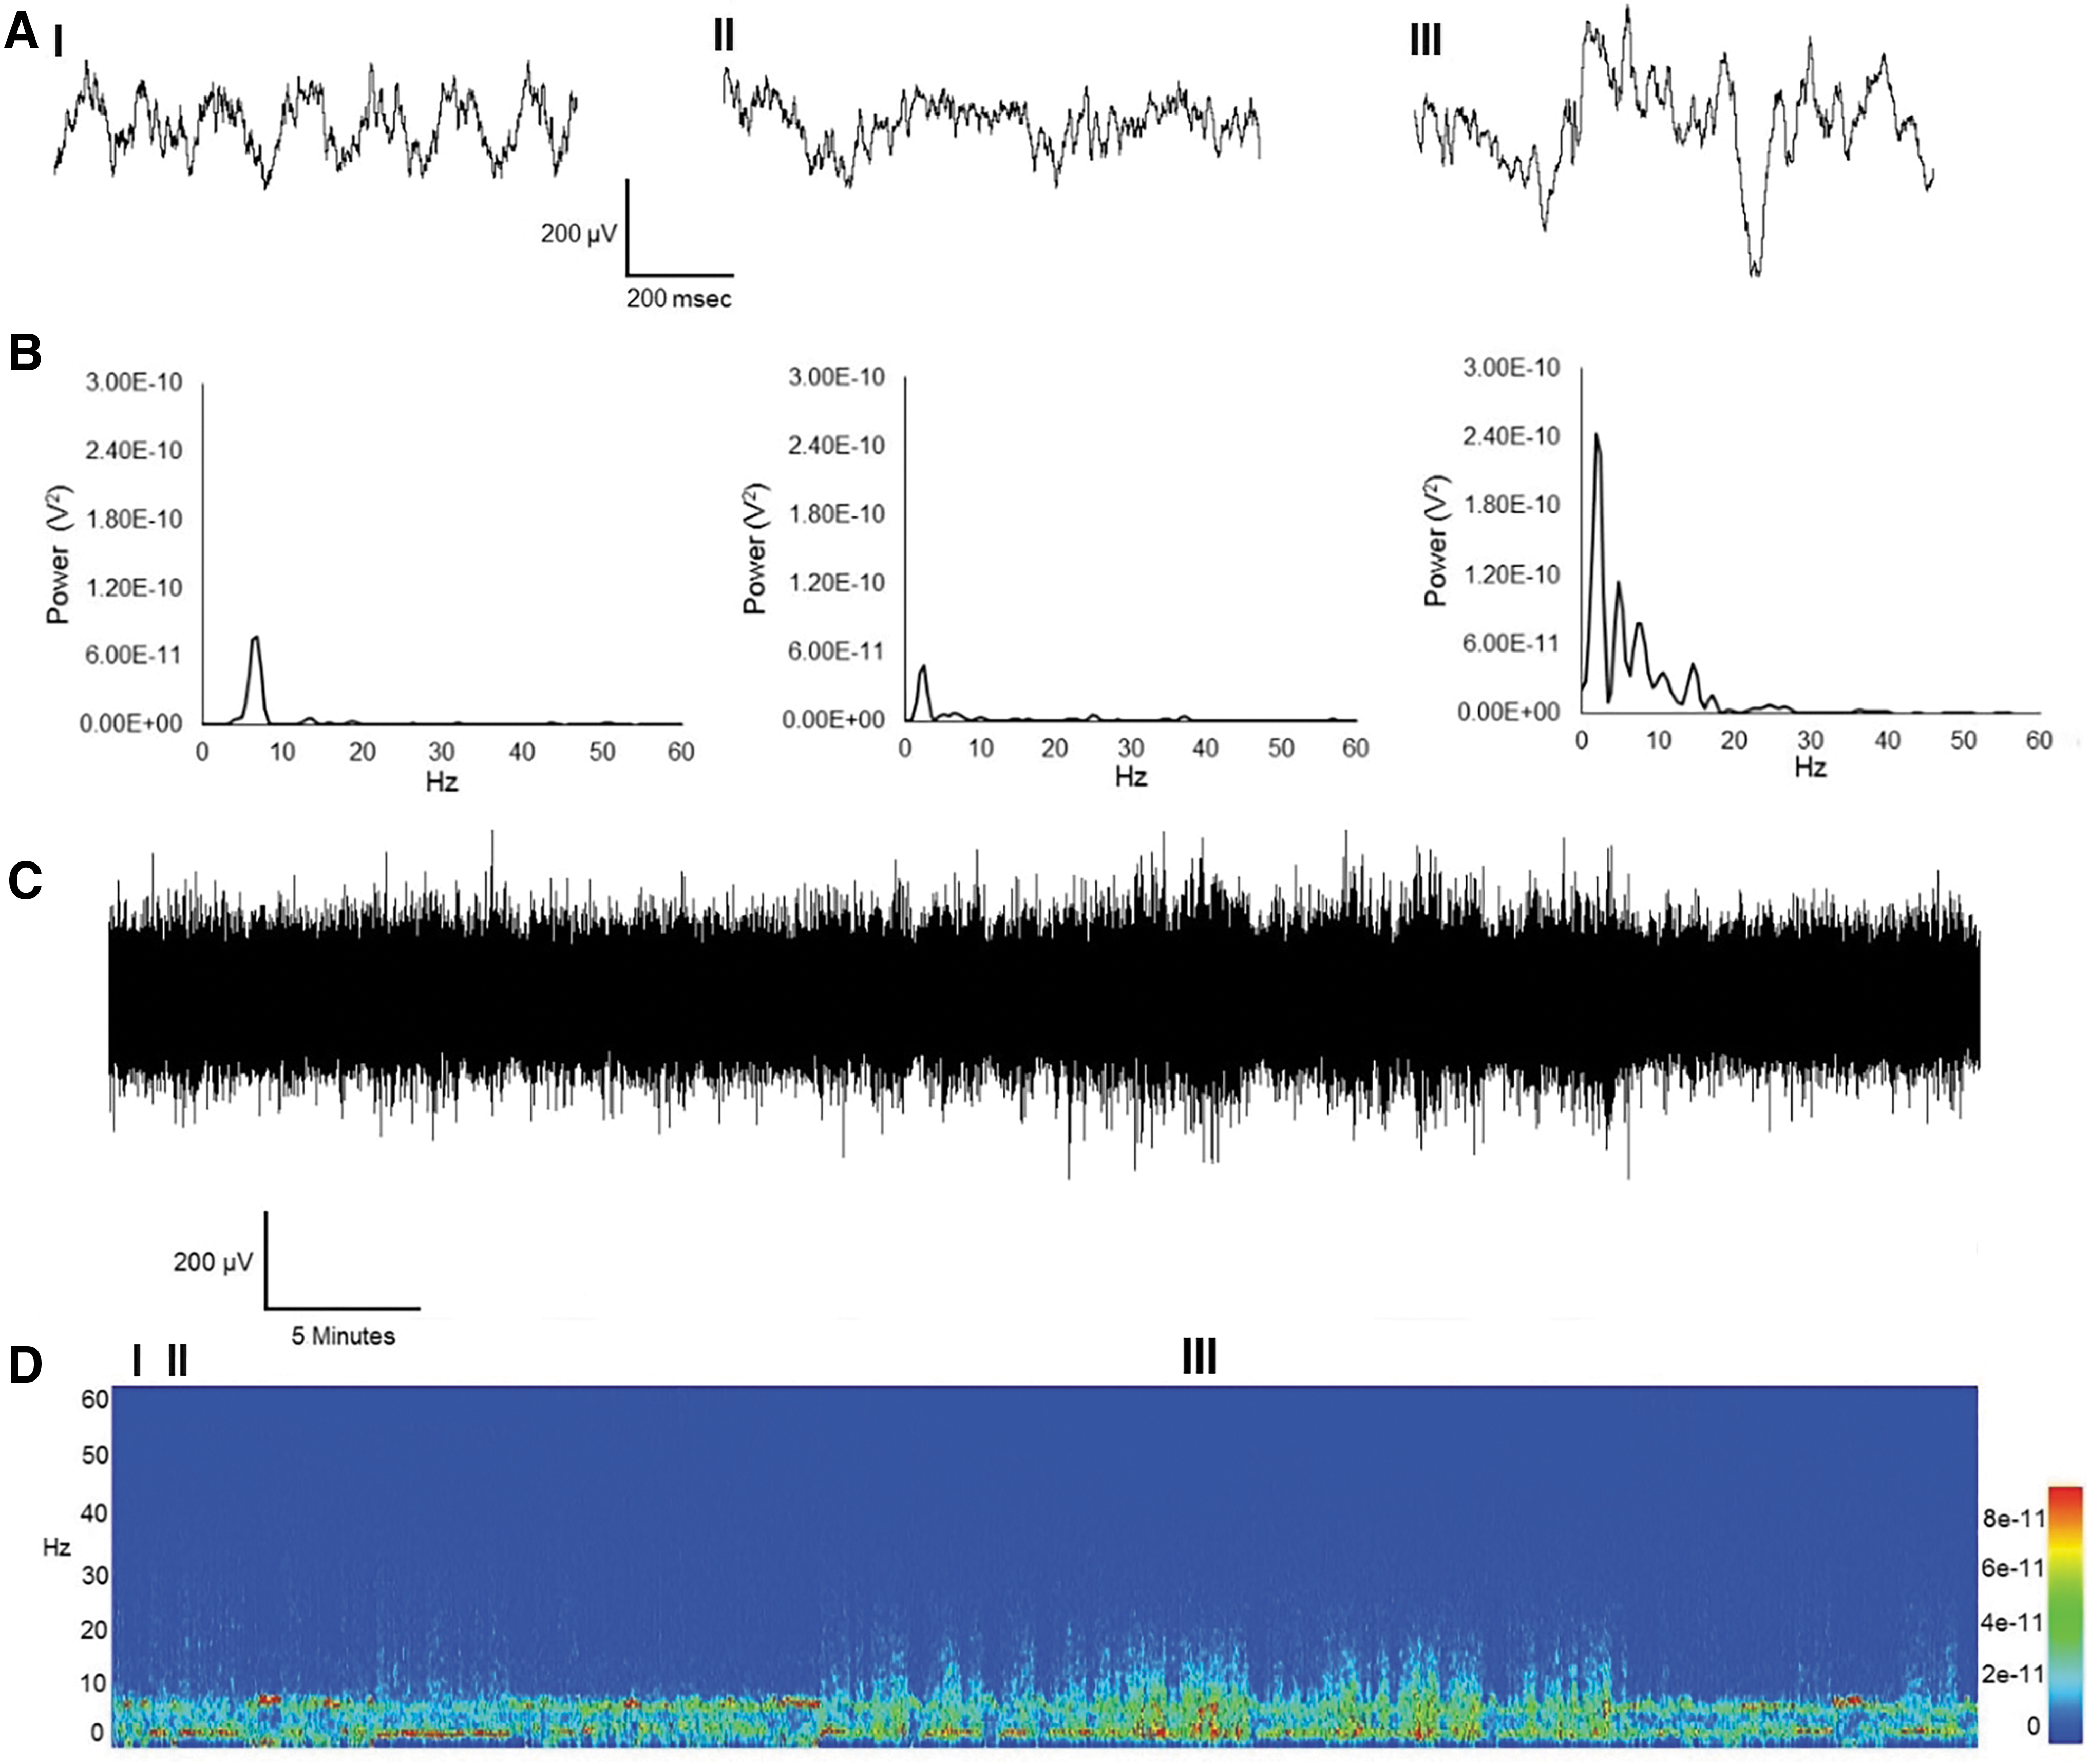
Three spectrally distinct behavioral states. One hour of ECoG and the corresponding spectrogram from a sham-operated control animal.
Effects of normothermic and hyperthermic CHI on the number of ECoG epochs containing increased power in the delta, theta, alpha, and beta-1 frequency bands
One hour of an ECoG record from a subject who underwent a single CHI is shown in Figure 3. Three electrographic signatures are present: prominent theta and delta oscillations (Fig. 3. Panel I and II, respectively) and an electrographic event (Fig. 3. Panel III) containing increased power between delta, theta, alpha, and beta-1 frequency bands. These increases in power lasted several seconds and typically occurred during moments of sleep and, to a much lesser extent, awake immobility. Electrographically, these events resemble nonrapid eye movement (NREM) sleep. They were quantified as the number of 2-second ECoG epochs containing this event. We observed a nonsignificant increase in the occurrence of these events (Fig. 4) across all injury groups ([17.3 ± 9 standard error of the mean (SEM)] in CHI, [16.4 ± 5.9 SEM] in CHI plus hyperthermia, [15.3 ± 10.8 SEM] in CHI X2, and [21.3 ± 13.7 SEM] in CHI X2 plus hyperthermia).

Increases in power in the delta, theta, alpha, and beta-1 frequency bands.

Quantification of epochs containing power increases in the delta, theta, alpha, and beta-1 frequency bands. Each 2-second epoch of the ECoG record was analyzed for increases in power across all frequency bands. This histogram displays the number of epochs containing power increases in the delta, theta, alpha, and beta-1 frequency bands. Sham (3 ± 2.5 SEM), CHI (17.3 ± 9 SEM), CHI+hyperthermia (16.4 ± 5.9 SEM), CHI X2 (15.3 ± 10.8 SEM) and CHI X2+hyperthermia (21.3 ± 13.7 SEM). One-way ANOVA was not significantly different between groups (p = 0.78). ANOVA, analysis of variance; SEM, standard error of the mean.
Effects of hyperthermic single and repetitive CHI on epileptiform SWDs
Convulsive seizures were not detected in any of the control or experimental animals. However, the ECoG record of two of the six animals exposed to hyperthermia following a single CHI contained electrographic events whose waveform (Fig. 5. Panel II) and power spectral content contained harmonics at frequency bands up to and including beta-2 (20–30 Hz) ([0.25 ± 0.29 SEM] in sham-operated controls, [1 ± 0.82 SEM] in CHI, [11.4 ± 7.01 SEM] in CHI+hyperthermia, [0.16 ± 0.18] in CHI X2, and [0.83 ± 0.92] in CHI X2+hyperthermia groups) (Fig. 6).

CHI with hyperthermia does not cause SWD.

Quantification of SWDs. Each 2-second epoch of the ECoG record was analyzed for increases in power across all frequency bands. This histogram displays epochs containing power increases in the delta, theta, alpha, beta-1, and beta-2 frequency bands. Sham (0.25 ± 0.29 SEM), CHI (1 ± 0.82 SEM) CHI+hyperthermia (11.4 ± 7.01 SEM), CHI X2 (0.16 ± 0.18) and CHI X2+hyperthermia (0.83 ± 0.92). One-way ANOVA was not significantly different between groups (p = 0.48).
This increase in SWDs in the CHI with hyperthermia group was not significant (p = 0.48). This “spike and wave” pattern is observed in generalized nonconvulsive seizures. However, since bilateral ECoG was not used, we were not able to determine if these events were generalized. One out of the six animals in the repetitive CHI with hyperthermia group had these events, but the ECoG of this subject was discarded due to an audible disturbance during the recording session.
Discussion
In this exploratory report, CHI (single or double) under normothermic or hyperthermic conditions does not cause electrographic signatures indicative of seizures. We observed a trend for increased power in the delta, theta, alpha, and beta-1 frequency bands following CHI compared to sham-operated animals. Electrographically, these events appeared to resemble NREM sleep. Sleep disturbances and chronic sleepiness have been reported from TBI patients (Werner and Baumann, 2017). The ability to record ECoG/EMGs would allow one to distinguish sleep from wakefulness because it is possible that some of these power increases pertain to medium voltage 5–9 Hz oscillations, first described in the genetic absence epilepsy rat from Strasbourg (GAERS) model (Pinault et al., 2001). These events have prominent power in the delta and theta frequency bands while maintaining a peak at ∼6 Hz. These events lasted several seconds and typically occurred during moments of drowsiness and awakened immobility. Medium-voltage 5–9 Hz oscillations are not seizures; however, they may prime groups of cells in the cortex to evolve into a mode where epileptic activity could ensue given the appropriate trigger. The striking resemblance of medium-voltage 5–9 Hz oscillations to sleep spindles must not be ignored; however, the duration of these oscillations exceeded those of typical spindles, did not contain a wax/wane waveform, and the fundamental frequency centered on delta and theta and not delta and beta. Again, it should be noted that due to the absence of EMG, it was not possible to determine if animals were sleeping or awake during these events. It is possible that the increases in power between delta and beta frequency bands reflect more bouts of NREM sleep in the injury groups.
Even though medium voltage 5–9 Hz oscillations are observed in nonepileptic rats, they precede SWDs of absence epilepsy in GAERS. Medium-voltage 5–9 Hz oscillations have also been observed in the WAG/Rij rat model of absence epilepsy (Sitnikova and van Luijtelaar, 2009). Dual extracellular recordings from thalamocortical and reticular thalamic neurons combined with ECoG from GAERS reveal striking similarities between medium-voltage 5–9 Hz oscillations and SWDs suggesting that medium-voltage 5–9 Hz oscillations can be a “pro-epileptogenic” phenomenon (Pinault et al., 2006).
Under hyperthermia conditions, a distinct electrographic signature tended to occur, although not significant, in a subset of animals. The increases in power were detected between the delta, theta, alpha, beta-1, and beta-2 frequency bands. These events resembled those of SWDs similar to absence epilepsy both in waveform and harmonic frequency content (Shandra et al., 2019). Shandra et al. (2019) demonstrated with chronic recordings that three CHIs will produce similar electrographic changes in the mouse. In this regard, chronic recordings may be required to demonstrate that a single CHI with hyperthermia may result in posttraumatic epilepsy.
Thus, future studies will be required to document whether these electrographic changes progress to epileptic events. The internal capsule contains corticothalamic and thalamocortical axon fibers regulating the genesis of SWDs of generalized absence seizures (Steriade and Contreras, 1998). It is possible that disruption of internal capsule integrity after hyperthermia exacerbated TBI (Dietrich et al., 1996) coupled with increased glutamate release (Thompson et al., 2003) could transform bouts of NREM sleep and/or medium-voltage 5–9 Hz oscillations into an electrographic event containing highly synchronous activity with faster frequency components. Related to this possibility are previous histopathological findings showing that at chronic survival periods after TBI, progressive atrophy of white matter structures as well as degeneration of specific thalamic regions takes place (Bramlett et al., 1997; Bramlett and Dietrich, 2002). These late occurring progressive changes in brain connectivity could therefore promote the cortical electrographic events documented in the study.
There are several limitations to this study that should be emphasized with regard to the current findings. First, we only investigated one chronic posttraumatic time period (12 weeks) for a limited 1-hour period. This limited observational period does not allow one to predict earlier or later occurring events that may be important in the temperature-dependent pathophysiology associated with mTBI. It is possible that electrophysiological events occurred at various posttraumatic periods that were not recorded in this study period. It is known that the frequency of posttraumatic seizures can vary widely even following more moderate or severe TBIs. Future studies will require more frequent recording intervals since the electrophysiological events are not associated with overt behavioral seizures. It is possible to speculate that with a larger sample size, SWDs would have occurred in both CHI with hyperthermia and repetitive CHI with hyperthermia groups, suggesting that the occurrence of hyperthermia before and after CHI can synchronize brain activity to result in epileptiform activity. In addition, the administration of proconvulsive agents in future experiments would be of utility in assessing the extent to which CHI (single or double) under normothermic or hyperthermic conditions would impact seizure threshold.
It should also be emphasized that we assessed a limited number of repetitive insults separated by a 1 week period. Recent studies using several models of repetitive TBI have reported that the frequency of impacts and the intervals between insults are both important factors in determining the consequences of repetitive TBI (Prins et al., 2013; Fehily and Fitzgerald, 2017; Greco et al., 2019). It will therefore be important in future studies to modify these parameters and their effects on cortical electrographic changes. The ECoG recordings of Sprague Dawley rats in this study exposed to hyperthermia before and after CHI not only tended to have increases in power between the delta, theta, alpha, and beta bands seen in the normothermia (37°C) CHI group but also contained an electrographic event that was not seen in sham or normothermia CHI groups. These events contained increases in power from the delta, theta, alpha, beta-1, and beta-2 frequency bands. The waveform and multiple harmonic frequency content resembled that of SWDs of a generalized absence seizure. Future experiments using ECoG/EMG chronic recordings will determine whether mild CHI increases the occurrence of these NREM and medium voltage 5–9 Hz oscillation events and if the addition of hyperthermia before and after mild CHI causes medium-voltage 5–9 Hz oscillations to convert to an electrographic entity possessing striking similarities to SWDs of absence seizures.
Footnotes
Author Disclosure Statement
No competing financial interests exist.
Funding Information
This research was funded by NINDS 5R01NS042133 and DOD W81XWH-12-1-0618.