




Abstract
We aimed to investigate the prognostic performance of the proportion of cerebrospinal fluid volume (pCSV) using brain apparent diffusion coefficient-magnetic resonance imaging (ADC-MRI) in cardiac arrest (CA) survivors. This retrospective single-cohort study comprised adult comatose CA survivors who underwent brain MRI and targeted temperature management (TTM) from March 2018 to October 2019. We calculated pCSV (pCSV0 and pCSV72 within 6 and 72 hours after return of spontaneous circulation, respectively) using an automated quantitative analysis program. The difference between pCSV0 and pCSV72 was defined as the pCSVd. Neurologic outcome 3 months after CA was assessed with the Cerebral Performance Category scale and dichotomized as good (1 or 2) or poor (3–5). Of the 73 patients included, 44 (60.3%) had a poor neurological outcome. Patients with poor outcome had significantly lower pCSV at baseline and at 72 hours, and a negative change in pCSV over time. The prognostic performance of pCSV72 and pCSVd was significantly higher compared with pCSV0 (all p < 0.001). The pCSVd showed excellent area under the curve values (0.96; 95% confidence interval 0.85–0.99) and highest sensitivity (95%) at 100% specificity. pCSV on brain ADC-MRI was associated with 3-month neurologic outcome in CA survivors. The pCSVd is a highly predictive and sensitive marker of 3-month poor neurological outcome in CA survivors treated with TTM. Multicenter prospective studies are required to determine the generalizability of these results.
Introduction
One of the most serious complications of cardiac arrest (CA) survivors is cerebral edema caused by ischemia/reperfusion injury, which is associated with poor neurological outcome and mortality (Xiao, 2002; Xiao et al., 2002). Elevated intracranial pressure (ICP) results in decreased cerebral perfusion pressure, which can cause cerebral ischemia (Hacke et al., 1996; Chen et al., 2016), resulting in cerebral edema, which is a major cause of brain swelling (You et al., 2018). According to the Monro-Kellie doctrine, the volumes of other intracranial components such as blood and cerebrospinal fluid (CSF) decrease to compensate for brain swelling owing to the rigid confinement by the cranium (Chen et al., 2016).
However, in our previous study, we failed to prove, using brain computed tomography (CT) scans (Lee et al., 2018), that the proportion of cerebrospinal fluid volume (pCSV) in the intracranial component volume (ICCV) was a useful tool to predict prognosis in CA survivors (You et al., 2019). It is likely that the median time to the brain CT scan was 70 minutes after return of spontaneous circulation (ROSC) and scanning was undertaken during the cytotoxic edema state, which does not cause an increase in ICP.
Magnetic resonance imaging (MRI) provides a quantitative value for brain injury severity through measurement of the apparent diffusion coefficient (ADC) (Hagen et al., 2007; Youn et al., 2015; Kim et al., 2016; Moon et al., 2018). Several studies have reported that the ADC volume of specific region of interest (ROI) values in CA survivors is useful for predicting neurologic prognosis (Youn et al., 2015; Kim et al., 2016; Moon et al., 2018). Moreover, CSF, white matter, and gray matter are known to have characteristic ROI values in ADC-MRI (Annet et al., 2002; Helenius et al., 2002; Cauley et al., 2014; Luminita et al., 2017; Ogura et al., 2019). And usually, a magnetic resonance (MR) scan of brain provides a thinner section image than a CT scan, which reduces the possibility of CSF contamination (Park et al., 2020), enabling more accurate pCSV measurement.
We hypothesized that post-CA brain swelling would have a greater effect on pCSV measured after 24 hours than soon after ROSC; therefore, pCSV measured or repeatedly measured after 24 hours could be used as a prognostic tool in CA survivors. To the best of our knowledge, no study has assessed whether the repeated measurement of pCSV using ADC-MRI is useful for predicting clinical outcomes. Therefore, we aimed to investigate the prognostic performance of pCSFV, measured by two ADC-MRI scans of brain, in CA survivors treated with targeted temperature management (TTM).
Materials and Methods
Study design and population
This was a retrospective single-center observational cohort study of adult comatose out-of-hospital cardiac arrest (OHCA) survivors treated with TTM at Chungnam National University Hospital (CNUH), a 1365-bed tertiary care referral center, in Daejeon, Korea, from March 2018 to October 2019. CNUH attends to >50,000 patients in its emergency department annually. This study was approved by the Institutional Review Board of CNUH (CNUH-2019-07-057-003).
This study included OHCA patients >18 years of age, who had undergone one or two MR scans of brain and been treated using TTM. The exclusion criteria for this study comprised the following: patients not eligible for TTM (i.e., patients with intracranial hemorrhage, active bleeding, or known terminal illness); patients who had experienced a traumatic CA; patients receiving extracorporeal membrane oxygenation; and responsible members of the patient's family unable to consent to provide an MRI.
TTM protocol
The patients were managed according to our previously published TTM protocol (You et al., 2019). TTM was performed using cooling devices (Arctic Sun® Energy Transfer Pads™; Bard Medical, Louisville, CO, USA); a target temperature of 33°C was maintained for 24 hours, with rewarming to 37°C at a rate of 0.25°C/h; the temperature was monitored using a bladder temperature probe. Sedatives and a neuromuscular blocking agent were used during TTM. Midazolam (0.05 mg/kg intravenous bolus, followed by a titrated intravenous continuous infusion between 0.05 and 0.2 mg/kg/h) and cisatracurium (0.15 mg/kg intravenous bolus, followed by an infusion up to 5 μg/kg/min) were administered for sedation and to control shivering. Anesthetic depth was monitored using ADMS™ (Anaesthetic Depth Monitor for Sedation; Unimedics CO., Ltd., Seoul, Korea).
All other aspects of patient management involved standard intensive care in accordance with our institutional intensive care unit protocol.
Data collection
The following data were obtained from hospital's records: age, sex, first monitored rhythm, etiology of CA, presence of a witness at the time of collapse, bystander cardiopulmonary resuscitation (CPR), no flow time, low flow time, time from ROSC to first or second brain MRI, and neurological outcome at 3 months post-CA
Measurement of proportion of CSF volume
Our hospital has a standardized MRI protocol for nontraumatic OHCAs. MRI includes diffusion-weighted imaging (DWI) and ADC (Park et al., 2020). Most OHCA received MR scans twice, if the patient's family consented. The first MRI was obtained within 6 hours after ROSC, and the second was obtained between 72 and 96 hours after ROSC. Forty contiguous DWI sections were acquired per patient using a 3T scanner (Achieva 3 T; Philips Medical System, The Netherlands). The standard of b = 1000 s/mm2 was used for all DWIs. ADC maps were created from the monoexponential calculation of DWI with a commercial software and workstation system (Leonardo MR Workplace; Siemens Medical Solutions, Erlangen, Germany).
For quantitative analysis of ADC values, only intracranial components of the ADC image require analysis, so voxels representing the cranium, optic structure, and soft tissues outside the cranium were eliminated. The analysis was performed using the FMRIB Software Library program (www.fmrib.ox.ac.uk/fsl) after converting Digital Imaging and Communications in Medicine (DICOM) files obtained with MRI (using DWI and ADC) into Neuroimaging Informatics Technology Initiative files (NITFI) using MRIcron (www.nitrc.org/projects/mricron).
In brain ADC images, the ADC value of major intracranial components is generally not >4350 × 10−6mm2/s or <0 × 10−6mm2/s, and the ADC value of CSF has been reported to range from 1590 to ∼4350 × 10−6mm2/s (Table 1) (Annet et al., 2002; Helenius et al., 2002; Cauley et al., 2014; Luminita et al., 2017; Ogura et al., 2019). As such, intracranial components from 0 to 4350 × 10−6mm2/s were used, and the CSF ADC values were used for the attenuation threshold limits from 1590 to 4350 × 10−6mm2/s. Any voxel with ADC values outside this boundary condition was excluded from the analysis (Fig. 1):
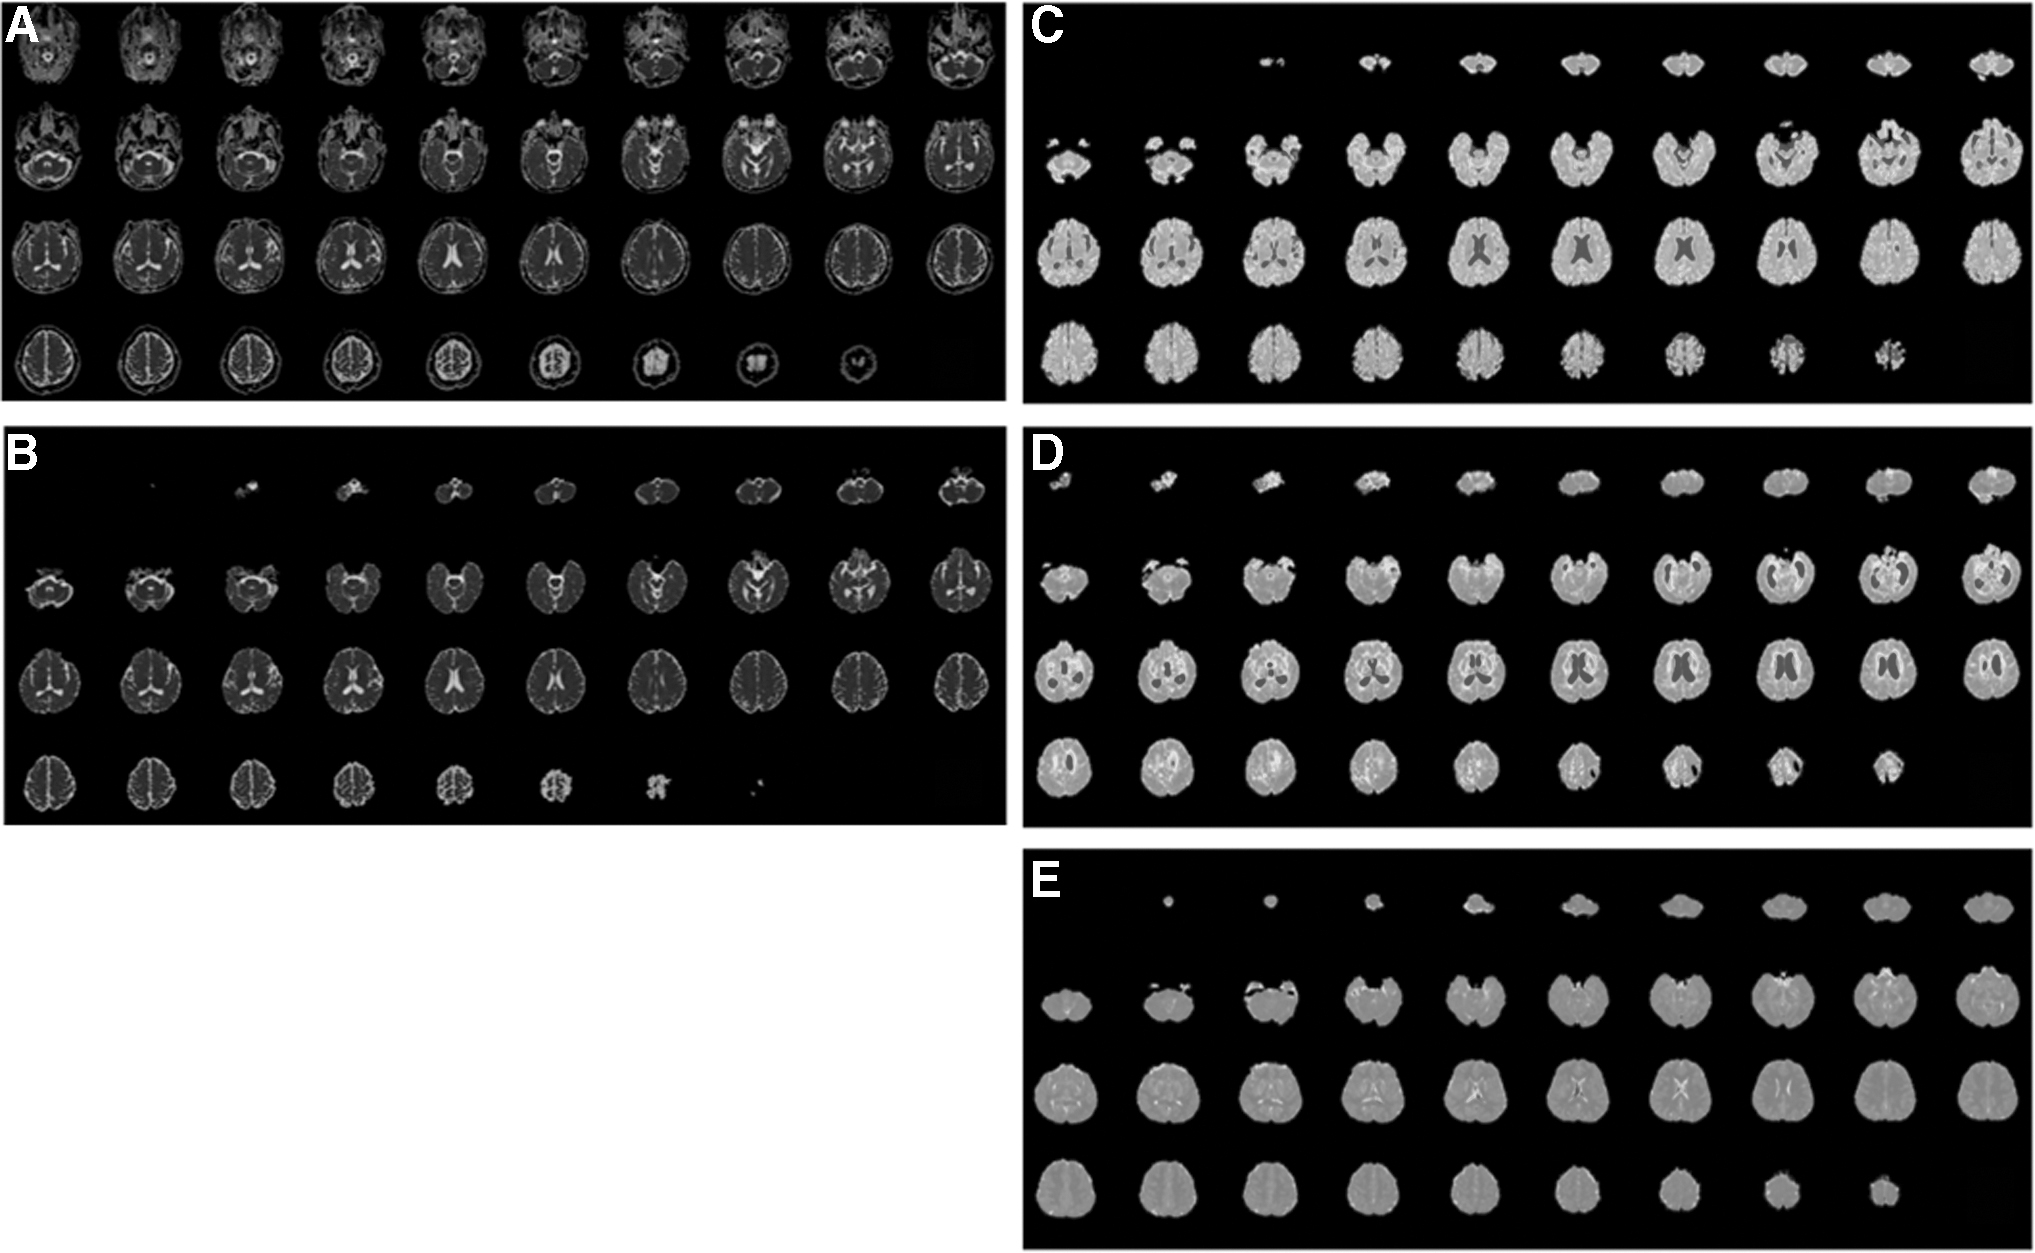
pCSV analysis using automated quantitative programming through brain ADC-MRI. Example of ADC-MRI image showing gradual reduction of pCSV with increase of brain edema. Color mapping—blue color shows the CSF space.
Study on ADC Values of Major Intracranial Components ( × 10–3 mm2/s)
SD, standard deviation.
pCSV in ICCV (CSFv/ICCv)
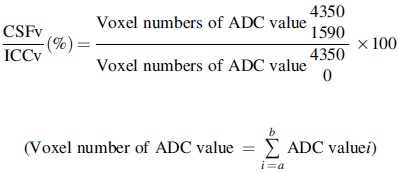
We calculated pCSV on the first MRI (pCSV0) and the second MRI (pCSV72). The pCSV change between pCSV72 and pCSV0 was defined as pCSVd.
Outcome measure
The primary outcome of this study was neurological outcome at 3 months post-CA. The neurological status of the patients was obtained through hospital records or telephone interviews. Neurological outcome was assessed using the records to determine a cerebral performance category (CPC). A good neurological outcome was defined as a CPC of 1 or 2, and a poor neurological outcome was defined as a CPC of 3 to 5.
Statistical analysis
Categorical variables are presented as frequencies and percentages. Continuous variables are presented as medians with interquartile range values. We used the Mann-Whitney test to compare pCSFV between poor versus good neurological outcome groups. At each time point and difference, receiver operating characteristic (ROC) curves were plotted and corresponding areas under the curve (AUC) were determined to evaluate the predictive performance of pCSV on poor neurological outcome. Cutoff values with 100% specificity were calculated for predicting poor neurological outcome at 3 months after ROSC. Subsequently, we used the Delong test to determine differences in prognostic performance between pCSV0, pCSV72, and pCSVd for poor neurological outcome in patients who underwent MRI scans twice (DeLong et al., 1998). Data were analyzed using SPSS for Windows, version 21 (IBM Corp., New York, NY, USA). The ROC curves were calculated using MedCalc version 15.2.2 (MedCalc Software, Mariakerke, Belgium). A two-sided significance level of 0.05 was used to indicate statistical significance.
Results
Patient demographics
Of 79 OHCA patients who had been admitted to the intensive care unit for TTM, 1 patient had neither first nor second MRI performed and 5 patients had MRI performed with >6 hours (first scan) or >96 hours (second scan) of delay. Ultimately, a total of 73 patients was analyzed (Fig. 2).
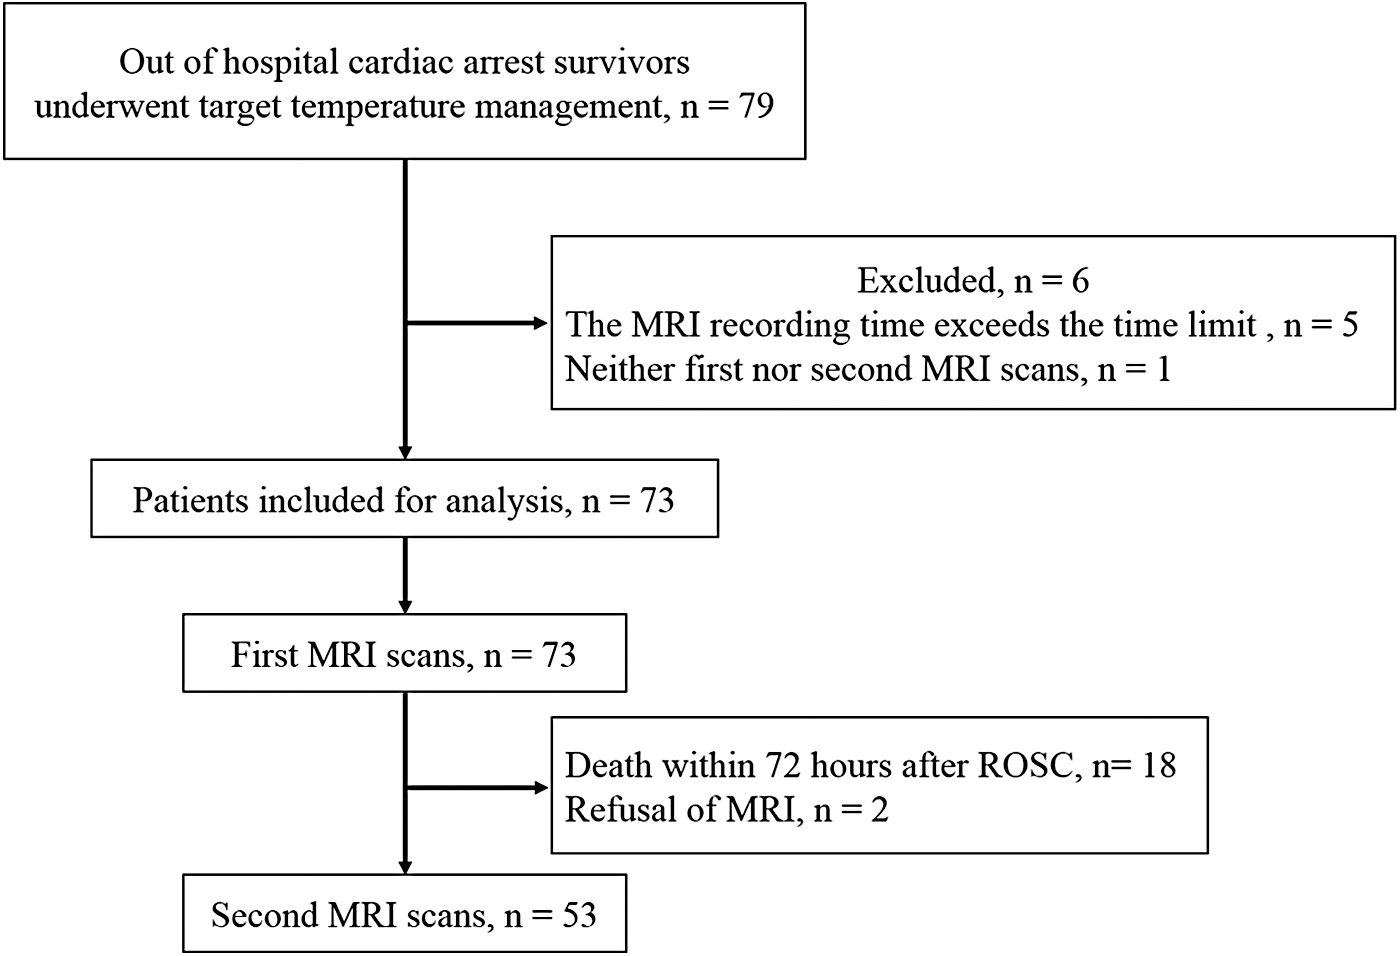
Schematic diagram showing the number of patients included in this study. ROSC, return of spontaneous circulation.
At 3 months post-CA, 44 (60.3%) patients had a poor neurological outcome. The median age was 53.0 (38.0–69.0) years, and 51 patients (69.9%) were men; the first brain MR scans were obtained at a median of 3.0 (2.3–4.0) hours after ROSC; and the second brain MR scans were acquired at a median of 77.5 (75.8–79.5) hours after ROSC (Table 2). Patients with poor neurological outcomes were less likely to have had witnessed CA, bystander CPR, shockable rhythms, and cardiac etiology. Moreover, they had a longer low flow time and no flow times (Table 2).
Baseline Demographic Data and Arrest Characteristics
Included number of patients for analysis.
CPR, cardiopulmonary resuscitation; IQR, interquartile range; MRI, magnetic resonance imaging; ROSC, return of spontaneous circulation; SOFA, sequential organ failure assessment.
Comparison of pCSV between good and poor outcome groups
The poor neurological outcome group had a significantly lower pCSV0, pCSV72, and pCSVd: pCSV0, 19.1% (12.9–21.8%) versus 12.0% (8.8–23.2%) respectively, p = 0.011; pCSV72, 19.2% (13.7–23.4%) versus 3.1% (2.3–11.6%) respectively, p < 0.001; and pCSVd, 0.5% (−0.3% to 1.5%) versus −6.5% (−10.9% to −3.3%) respectively, p < 0.001 (Figs. 3 and 4).

Comparison between 3-month neurological outcomes using a proportion of the cerebrospinal fluid volume at pCSV0, pCSV72, and pCSVd. pCSV0, pCSV on day 0; pCSV72, pCSV on day 3; pCSVd, difference in pCSV between day 3 and 0.
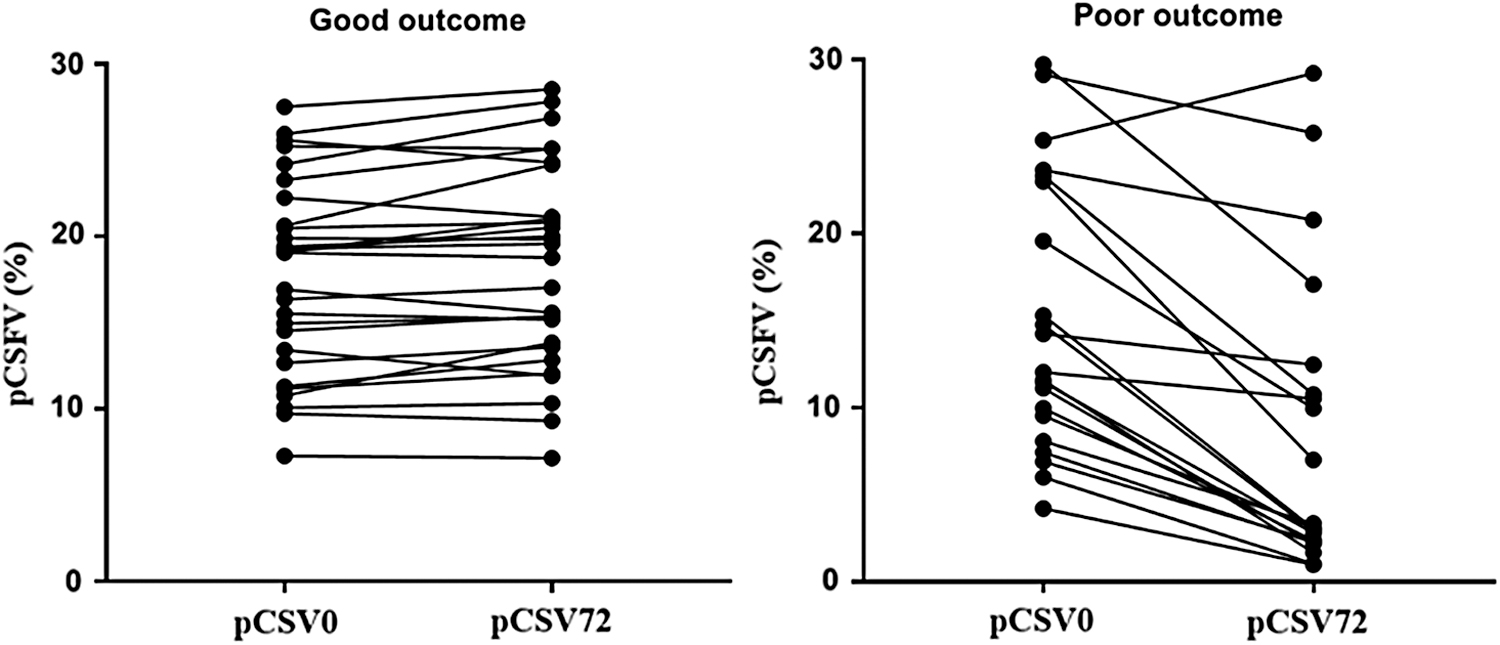
Comparison of pCSV changes between pCSV0 and pCSV72 between good and poor neurological outcome groups.
Prognostic prediction performance of pCSV for poor outcome
ROC analysis was used to determine the performance of pCSV to predict poor neurological outcome at 3 months. The AUC values for pCSV72 and pCSVd were significantly higher than that for pCSV0, with pCSVd showing the highest AUC values, followed by pCSV72. The sensitivity for poor outcomes with 100% specificity was the highest with 95% (76–100) pCSVd, followed by 62% (38–82) with pCSV72 (Table 3).
Prognostic Performances of Proportion of Cerebrospinal Fluid Volume on Day 0 and 3 and Differences of Proportion of Cerebrospinal Fluid Volume for the Prediction of 3-Month Poor Neurological Outcomes
No. of patients included in the analysis.
No. of patients who underwent MRI scans twice included in the analysis.
AUC, area under curve; CI, confidence interval; NPV, negative predictive value; pCSV, proportion of cerebrospinal fluid volume; pCSV0, pCSV on day 0; pCSV72, pCSV on day 3; pCSVd, difference in pCSV between day 3 and 0; PPV, positive predictive value.
Discussion
In this retrospective observational study, pCSV obtained using ADC-MRI showed a significant difference between good and poor neurological outcomes after 3 months in CA survivors treated with TTM. pCSV72 and pCSVd showed better prognostic performance than pCSV0 at baseline; pCSVd had the highest prognostic performance and sensitivity, with 100% specificity.
Brain edema is one of the most serious post-CA complications in survivors, and is associated with poor neurological outcome (Helenius et al., 2002; Youn et al., 2015; Park et al., 2019). Several recently published studies have reported that brain edema affected pCSV and ventricular characteristics (Morimoto et al., 1993; Kim et al., 2014; Dhar et al., 2016; Pappu et al., 2016; Lee et al., 2018; Kang et al., 2019; You et al., 2019); therefore, these could be used as objective tools to predict the prognostic performance of OHCA comatose survivors. However, these studies showed poor predictive performance of ventricular characteristics or pCSV at 6 months concerning poor neurological outcomes (0.683; 95% confidence interval [CI], 0.623–0.739 vs. 0.521; 95% CI, 0.446–0.694) (Lee et al., 2018; You et al., 2019), with several explanations provided.
One previous study showed that brain edema was more prominent 24 hours after ROSC (Park et al., 2019); however, >75% of the patients had undergone brain CT within 2–3 hours after ROSC (Lee et al., 2018; You et al., 2019). Therefore, to understand the relationship between neurological outcome and the progressive pattern of brain edema, further studies were proposed, including repeated CT scans or CT scans obtained 24 hours after ROSC.
We found that prognostic performance of pCSV on day 3 was better than that on day 0 in this study, which supports that optimal brain imaging timing for prognostication would be at least 24 hours after ROSC, given the timing of brain edema expression. Nevertheless, pCSV on day 0 was significantly different between patients with good and poor neurological outcomes and showed a significant prognostic performance (AUC 0.68) in this study. However, a previous study showed that pCSV on brain CT on day 0 was not different between neurological outcomes and showed poor prognostic performance (AUC 0.52) (You et al., 2019). There are two possible explanations. First, this study had a longer time from ROSC to obtaining a brain scan (180 minutes [138–240 minutes] vs. 70 minutes [39–122.5 minutes]). Second, MR scans have thinner sections than CT (3 mm vs. 5 mm). Therefore, this study examined the brain in a more advanced state of edema and with more detailed scans compared with the previous study.
For prognostic prediction using pCSV, it is more useful to use the amount of change than the single point value. For that reason, the first study by Kang et al. (2019) showed that the ICP change in the poor outcome group was larger than in the good outcome group. Therefore, in this study, poor prognosis was associated with pCSV changes of −1.52% or more. Moon et al. showed that the proportion of parenchyma with a specific ADC value (range, 200–400) of a total brain parenchymal ADC value (range, 200–1200) predicted poor outcome with high performance at between 48 hours and 7 days after ROSC (Moon et al., 2018). The AUC and sensitivity of the study were 0.906 (95% CI, 0.809–0.964) and 79%, respectively, with 100% specificity. However, our results indicated that pCSV is a superior prognostic predictor to that studied by Moon et al.
MRI has well-known clinical utility in the prediction of neurological outcomes in CA survivors, although its application has several limitations (Jeon et al., 2017; Kang et al., 2019; Park et al., 2020; Son et al., 2020). In particular, it is challenging to conduct the scan when patients are hemodynamically unstable (mean arterial pressure <60 mmHg or systolic blood pressure <90 mmHg) before TTM. However, at our institution, MRI is the standard imaging modality, except in hemodynamically unstable patients who are CA survivors. There are several reasons why MRI scans are feasible for CA survivors at the study center compared to other institutions. First, we are convinced that a baseline MRI on day 0 through several imaging studies is more useful than CT for predicting the neurological outcomes (Jeon et al., 2017; Kang et al., 2019; Park et al., 2020; Son et al., 2020). Second, our hospital has a CT and MRI room for emergency patients in the emergency department; therefore, a significant “time delay” does not occur for the investigation. Third, MRI is a diagnostic modality that is covered under the national medical insurance system in Korea and, therefore, is available at a low cost.
This study had several limitations. First, this was a small sample-sized single-center retrospective study. However, all included patients were scanned using the same MRI machine, and most of the scans were taken at a certain time according to the protocol. Therefore, although this was a retrospective study, the data were relatively homogeneous. To enhance generalizability, prospective multicenter studies involving more institutions and greater patient numbers are required. Second, of 72 patients reviewed for inclusion, 16 (22.2%) were excluded due to a lack of ADC-MRI data. This might have caused selection bias. Third, in this study, we obtained pCSV using the FMRIB Software Library program. However, the complexity of application of this program will limit its feasibility among most physicians as they may find it difficult to use. Fourth, the study was based on the Monro–Kellie doctrine. However, the effect of blood, the major component of the Monro–Kellie doctrine, was excluded. This will constitute a limitation of the CSF volume proportion measurement. Fifth, obtaining two MR scans of CA survivors is unlikely to be feasible in other institutions. Therefore, to generalize our results, a prospective study using CT is needed.
Conclusions
pCSV performed using automated quantitative analysis through ADC-MRI obtained after 72 hours at ROSC in post-CA patients treated with TTM was a valuable tool to predict neurological outcome. For prognostic prediction using pCSV, it is more useful to use the amount of change than the single point value. Compared with pCSV72, we found pCSVd to be a highly predictive and sensitive marker of 3-month poor neurological outcome in OHCA survivors treated with TTM.
Footnotes
Author Disclosure Statement
No competing financial interests exist.
Funding Information
This work was supported by research fund of Chungnam National University in 2019.