




Abstract
Targeted temperature management (TTM) exerts substantial impact on hemodynamic function in out-of-hospital cardiac arrest (OHCA) patients. Whole-body oxygen consumption (VO2) and delivery (DO2) have not previously been investigated in a clinical setting during TTM at different levels of temperature after OHCA. A substudy of 151 patients randomized at a single center in the TTM-trial, where patients were randomly assigned TTM at 33°C (TTM33) or 36°C (TTM36) for 24 hours. We calculated VO2 according to the principle of Fick (VO2 = cardiac output*arteriovenous oxygen content difference). DO2 was calculated as cardiac output*arterial oxygen content. Cardiac output was measured by pulmonary artery catheter with thermodilution. Arteriovenous oxygen content difference was calculated from arterial and mixed venous oxygen saturation and hemoglobin. Oxygen extraction ratio = VO2/DO2. At 24 hours, the VO2 was 169 ± 59 mL O2 per minute in TTM33 and 217 ± 53 mL O2 per minute in TTM36 (p < 0.0001). During 24 hours of TTM, the overall difference was 53 mL O2 minute (95% confidence interval [CI]: 31–74, pgroup < 0.0001). After rewarming at 36 and 48 hours, there was no difference in VO2 between the groups. DO2 was overall 277 mL O2 per minute (95% CI: 175–379, pgroup < 0.0001) higher in the TTM36-group during TTM. Oxygen extraction ratio during TTM was not significantly different between the two groups (2% [95% CI: −0.1 to 5, pgroup = 0.09]). VO2 during the first 36 hours after OHCA correlated significantly with temperature, and VO2 was 19 mL O2 per minute lower per degree reduction in temperature (95% CI: 15–22), p < 0.0001. TTM at 33°C compared to 36°C after OHCA is associated with significantly lower VO2 and DO2, however, oxygen extraction ratio was not significantly different. For each degree lower body temperature, the VO2 fell by 19 mL O2 per minute.
Introduction
After resuscitation, patients who remain comatose after out-of-hospital cardiac arrest (OHCA) have a high in-hospital mortality (Nolan et al., 2010), which is primarily related to hypoxic brain injury (Laver et al., 2004). During a cardiac arrest, systemic oxygen-delivery (DO2) is abruptly reduced, and in the cells, aerobic metabolism with adenosine triphosphate production pauses, leading to dysfunction and ultimately cell death (Hossmann et al., 1973). After return of spontaneous circulation (ROSC), DO2 can continuously be impaired due to hemodynamic instability involving myocardial stunning and low cardiac output (Laurent et al., 2002; Nolan et al., 2010). If sufficient DO2 is not maintained to accommodate whole-body oxygen consumption (VO2) after OHCA, a mismatch between oxygen supply and demand occurs, which can result in further organ dysfunction and cell death (Vincent, 1996; Sekhon et al., 2017). However, low DO2 as a single parameter is not necessarily a sign of poor hemodynamic function, since it can be a result of reduced whole-body oxygen demand in sedated and/or hypothermic patients (Baraka, 1994). Therapeutic hypothermia (also termed targeted temperature management [TTM]) for neuroprotection after cardiac arrest was introduced almost 20 years ago (Bernard et al., 2002). At that time, it was assumed that hypothermia was neuroprotective because of a temperature-dependent reduction in brain metabolism leading to decreased oxygen consumption (Polderman, 2009). Although the use of TTM in comatose OHCA-patients is an established part of neuroprotection, its effects on oxygen consumption and metabolism have not been investigated after OHCA in a clinical setting. Some studies of metabolism during hypothermia have reported that a reduction in VO2 occurs, however, DO2 remains unchanged during hypothermia, which has been termed a “luxury perfusion and oxygenation condition” with a very low oxygen extraction ratio (O2ER) (Bacher et al., 1997). Oxygen release in the tissues may be compromised during hypothermia and experimental studies have shown a leftward shift in the oxyhemoglobin dissociation curve (Bacher et al., 1997), thus impairing the ability of hemoglobin to release oxygen in the tissues. The relationship between oxygen variables and parameters of metabolism such as VO2 and oxyhemoglobin dissociation curve is inadequately investigated, because most studies are small (Hoedemaekers et al., 2017), without a control group (Bacher et al., 1997), or have limited access to measurements of oxygen consumption and delivery. This study reports the impact of TTM at 33°C (TTM33) versus 36°C (TTM36) on metabolism and oxygen variables in comatose survivors after OHCA undergoing 24 hours of TTM.
Materials and Methods
For this study, we performed post hoc analyses of data from a single site of the TTM-trial, which was a prospective, randomized clinical trial comparing TTM33 versus TTM36 for 28 hours, followed by rewarming to 37°C with a 0.5°C increase per hour. There was no difference in patient-related outcomes between the two temperature-strata (Nielsen et al., 2013) (ClinicalTrials.gov Identifier: NCT01020916). The trial was carried out between 2010 and 2013 in 36 centers. At Copenhagen University Hospital, Rigshospitalet, Denmark, 171 comatose-resuscitated OHCA patients were enrolled, and per local protocol applied invasive hemodynamic monitoring, which included protocolized measurements from pulmonary artery catheters (PAC) in addition to standard intensive care monitoring. We have previously published analyses of systemic vascular resistance and cardiac index and relationship to the intervention of the TTM-trial and outcome, where we have shown that cardiac output is reduced during hypothermia (Bro-Jeppesen et al., 2014; Grand et al., 2019a, 2019b).
The protocol was approved by the Ethics Committee of the Capital Region of Denmark (H-1-2010-059), including the use of PAC for research purposes. Written informed consent was immediately obtained from next-of-kin and subsequently from the patients' general practitioner. If the patients regained consciousness, a written consent was obtained in all cases. Good Clinical Practice guidelines were followed. Inclusion criteria were Glasgow Coma Scale Score <9, age ≥18 years, and resuscitated after OHCA of presumed cardiac cause. Unwitnessed asystole patients with more than 4 hours from ROSC to randomization and patients in refractory shock (systolic blood pressure <80 mmHg despite treatment) were among exclusion criteria (Nielsen et al., 2012). Utstein style was followed for reporting of prehospital data (Peberdy et al., 2007).
Patient management
All patients were sedated (to a Richmond Agitation-Sedation Scale score of −4 with propofol and fentanyl), intubated, and mechanically ventilated. Neuromuscular blocking agents were not routinely used, but were used at the decision of the treating physician if shivering was present after analog sedation. Presence of shivering was assessed by the treating physician. All patients were actively surface cooled (Thermowrap with Allon unit, Israel). TTM was initiated immediately postrandomization, which was achieved as soon as possible after intensive care unit (ICU) admission.
Hemodynamic monitoring
A thorough hemodynamic assessment in addition to the sampling of arterial and mixed venous blood (SvO2) was made at five prespecified time points: when the PAC was inserted (T0, as soon as possible after ICU admission), when target temperature was reached (T4, which was ∼4 hours after ICU admission), halfway through TTM (T16), before rewarming (T28), after 36 hours (at 37°C) (T36), and after 48 hours (T48). Patients were monitored with continuous arterial blood pressure in the radial artery, and a balloon-tipped, 7.5F triple lumen Swan-Ganz catheter/PAC (Edwards Lifesciences, Irvine, CA) was inserted through the internal jugular vein. We used the thermodilution technique for cardiac output measurements: A rapid infusion of cold (5°C) isotonic glucose was injected (Monnet et al., 2011). The mean of three measurements with low variance was used. Interobserver variability of the cardiac output measurements was low (Bro-Jeppesen et al., 2014). Cardiac output was divided by the body surface area to derive the cardiac index.
Hemodynamic treatment goals were as follows: (1) central venous pressure of 10 to 15 mmHg by fluid administration, (2) mean arterial pressure (MAP) ≥65 mmHg by catecholamines (norepinephrine and dopamine were first-line agents, and epinephrine was used secondarily), and (3) urine output >1.5 mL/(kg·h). We determined the mean dose of vasopressor load, which was calculated using the following formula: vasopressor load [μg/(kg·min)] = norepinephrine [μg/(kg·min)] + dopamine [μg/(kg·min)/100] + epinephrine [μg/(kg·min)].
Outcome measures
The calculated variables VO2 and DO2 and the oxygen extraction ratio (O2ER) were derived using standard equations related to the reversed Fick method (Vincent, 1996). This method has been validated previously (Fukui et al., 1997). Equations are described below.
Content of arterial (CaO2) and venous (CvO2) oxygen were calculated as follows:
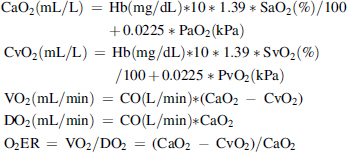
where CO represents the cardiac output (cardiac index is used where relevant to adjust for body size in m2), Hb is the hemoglobin concentration, SaO2 and SvO2 the arterial and mixed venous saturation, CaO2 and CvO2 the arterial and mixed venous oxygen content, and 1.39 the constant value representing the amount in milliliters of oxygen bound to 1 g of Hb (Rivers et al., 1992). We also calculated CO2 contents as described by Douglas et al. (1988):

where S (plasma CO2 solubility) and pK′ are adjusted for temperature (Austin et al., 1963) and calculated as follows:
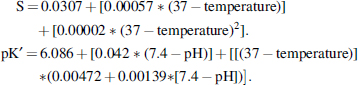
Finally, we calculated blood CO2 content: Blood CO2 content = plasmaCO2 content*[1 − [0.0289*Hb]/[[3.352 − 0.456*SO2]*[8.142 − pH]]]. Whole-body CO2-production (VCO2) was as follows:

To estimate the resting energy expenditure (REE), we used the Abbreviated Weir Equation (Weir, 1949):

The respiratory quotient (RQ) was calculated as RQ = VCO2/O2.
The oxygen-binding capacity of hemoglobin was estimated by mixed venous pO2 at 50% saturation (p50), using the algorithm described by Lichtman et al. (1976). The Hill constant was considered to be 2.7 in all subjects (Lichtman et al., 1976). Since all arterial blood gas analyses were performed at 37°C, we adjusted for the temperatures as described by Samaja et al. (Effect of Temperature on the p50 Value for Human Blood, 1983).
Endpoints
The primary endpoint was between-group difference of VO2 during the first 24 hours of TTM. Secondary endpoints were difference in DO2, O2ER, p50, and REE between TTM-groups.
Statistics
Baseline continuous variables are reported as mean and standard deviation if data were normally distributed or median and quartiles (Q1–Q3) in nonnormal distributed data. Student's t-test and the nonparametric Kruskal–Wallis tests were used to tests between group differences. Categorical variables are reported as count with proportions (%) and Fisher's exact test to compare differences between groups. Between-group differences in oxygen variables measured during TTM were assessed by repeated-measurements mixed models with an unstructured covariance structure. Time and group were fixed effects. The interaction of group with time is included. p-Values for differences between groups are denoted pgroup. All simultaneously obtained values of oxygen variables at time points T4, T16, T28, and T36 (during TTM and rewarming) were pooled and linear regression and Pearson correlations were used to assess relationship between variables. Statistical analyses are made using the SAS statistical software, version 9.4 (SAS Institute, Cary, NC). All tests are two-tailed, and statistical significance is defined as p < 0.05.
Results
In 151 patients, hemodynamic measurements were available (Fig. 1). Excluded patients did only differ from the study-population regarding having longer time to ROSC. Table 1 summarizes baseline characteristics of the two groups. Overall, there were no baseline differences between the groups (Table 1).
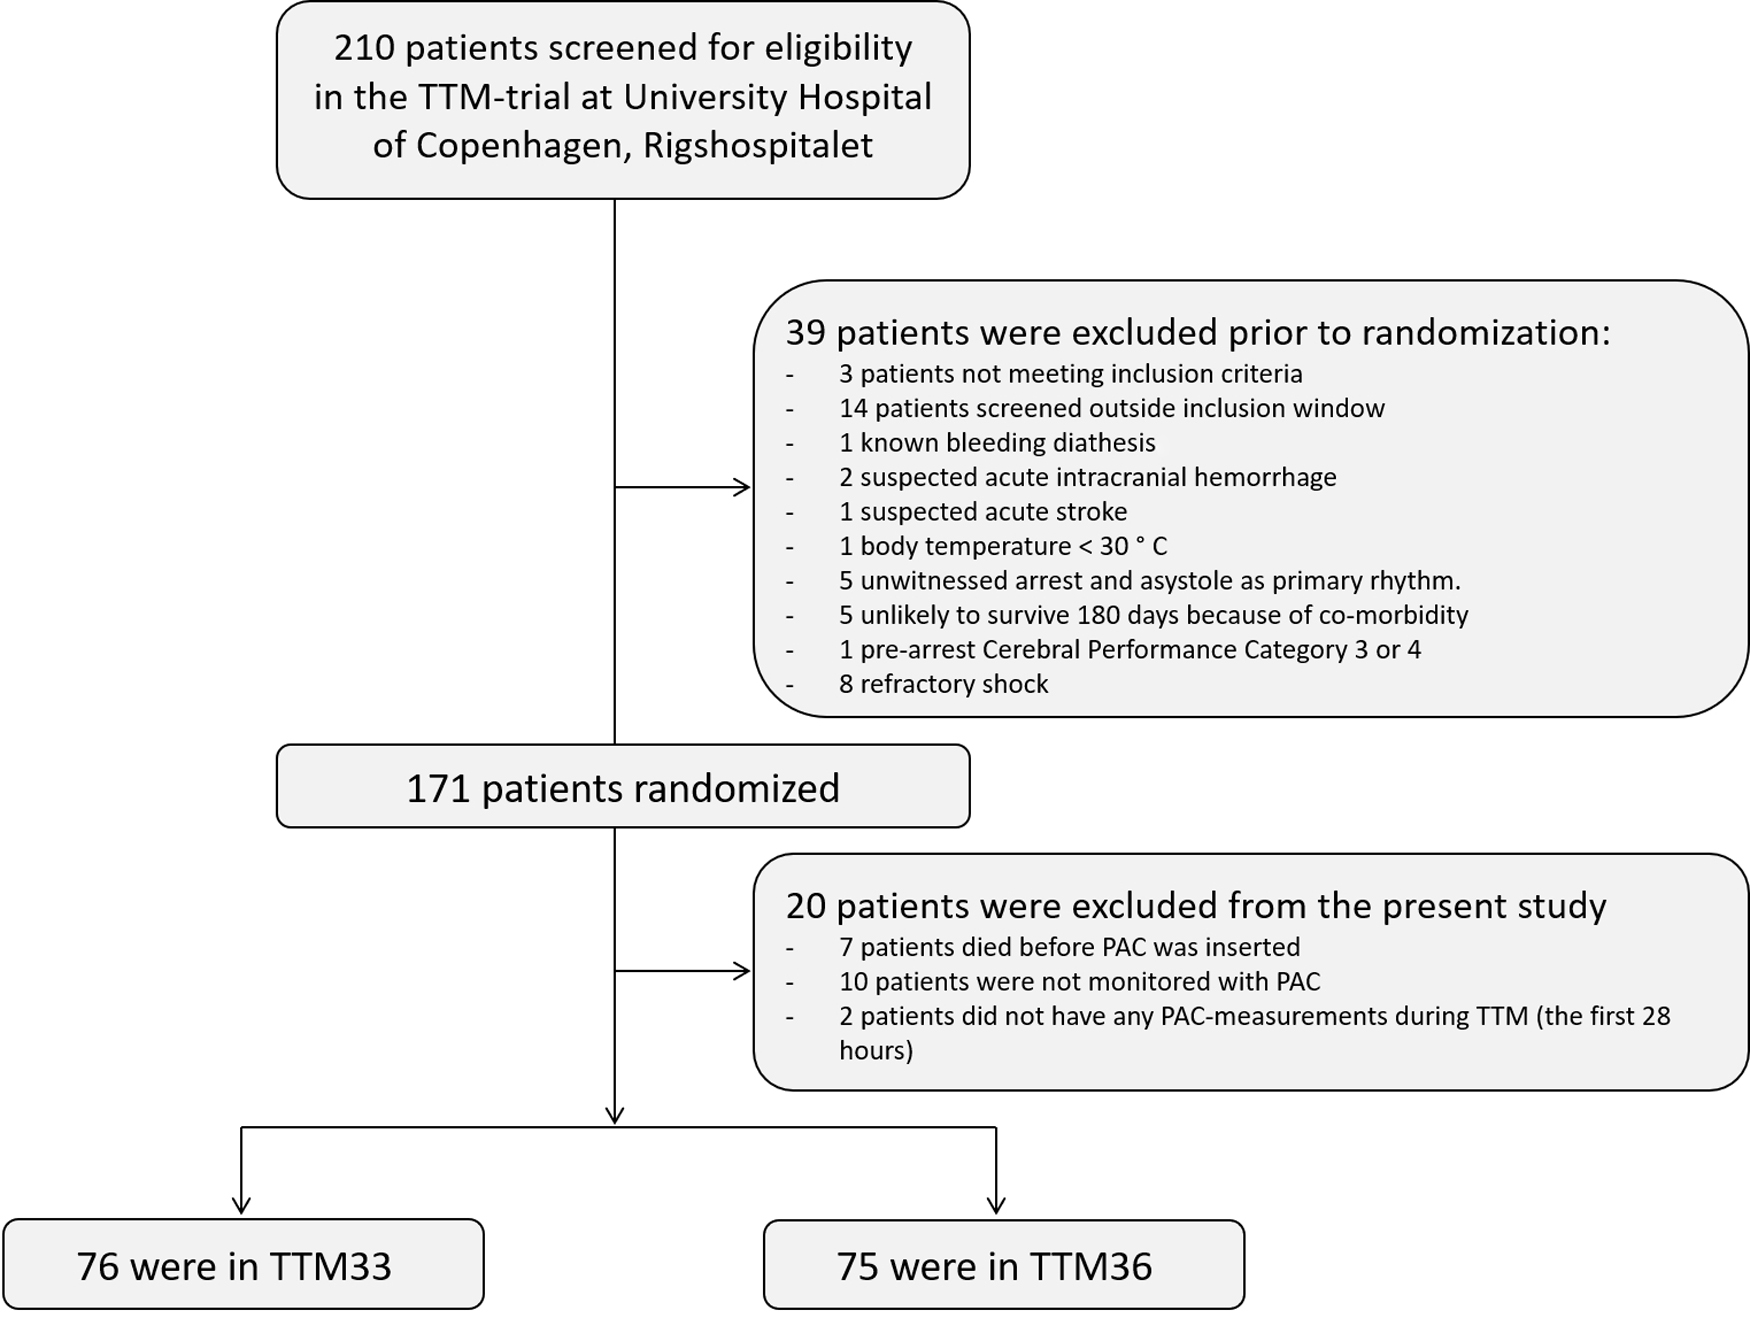
The flow of patients included in the TTM-trial at Copenhagen University Hospital, Rigshospitalet. PAC, pulmonary artery catheter; TTM, targeted temperature management; TTM33, targeted temperature management at 33°C; TTM36, targeted temperature management at 36°C.
Demographic and Prehospital Data of Study Population Stratified by Allocated Temperature Group
AMI, acute myocardial infarction; CAG, coronary angiography; COPD, chronic obstructive pulmonary disease; CPR, cardiopulmonary resuscitation; LVEF, left ventricular ejection fraction; PCI, percutaneous coronary intervention; ROSC, return of spontaneous circulation; SD, standard deviation; TCI, transitory cerebral ischemia; TTM, targeted temperature management.
Oxygen variables during TTM at 33°C versus 36°C
During hypothermia (T16), VO2 [81 ± 29 mL/(min·m2) vs. 102 ± 23 mL/(min·m2), p < 0.0001], DO2 [316 ± 139 mL/(min·m2) vs. 431 ± 123 mL/(min·m2), p < 0.0001], VCO2 [81 ± 29 mL/(min·m2) vs. 102 ± 23 mL/(min·m2), p < 0.0001], and REE (1186 ± 443 kcal/day vs. 1498 ± 369 kcal/day, p < 0.0001) were significantly decreased in the TTM33 compared to TTM36 group. In contrast, p50 was significantly increased in the TTM33-group (3.77 ± 0.29 mmHg vs. 3.67 ± 0.29 mmHg, p = 0.01). RQ (1.03 ± 0.54 vs. 0.99 ± 0.43, p = 0.59) and O2ER (0.27% ± 0.08% vs. 0.25% ± 0.06%, p = 0.05) was not significantly different during hypothermia (Table 2).
Hemodynamic Measurements and Oxygen Metabolism Variables During Hypothermia and Normothermia
Bold values signify statistical significance.
RQ, respiratory quotient.
Changes in oxygen consumption and delivery during TTM
Figure 2 shows the temporal changes of VO2, DO2, and O2ER during TTM. During 24 hours of TTM, the TTM33 group had a significantly lower VO2 (−53 mL/min; 95% confidence interval [CI]: −31 to −74 mL/min, pgroup < 0.0001), lower DO2 (−277; 95% CI: −175 to −379 mL/min; pgroup < 0.0001), lower VCO2 (−34; 95% CI: −5 to −64 mL/min; pgroup = 0.002), and lower REE (−352; 95% CI: −202 to −502 kcal/day; pgroup < 0.0001). O2ER was not significantly different between TTM groups (−2; 95% CI: −5 to 0.1; pgroup = 0.09).
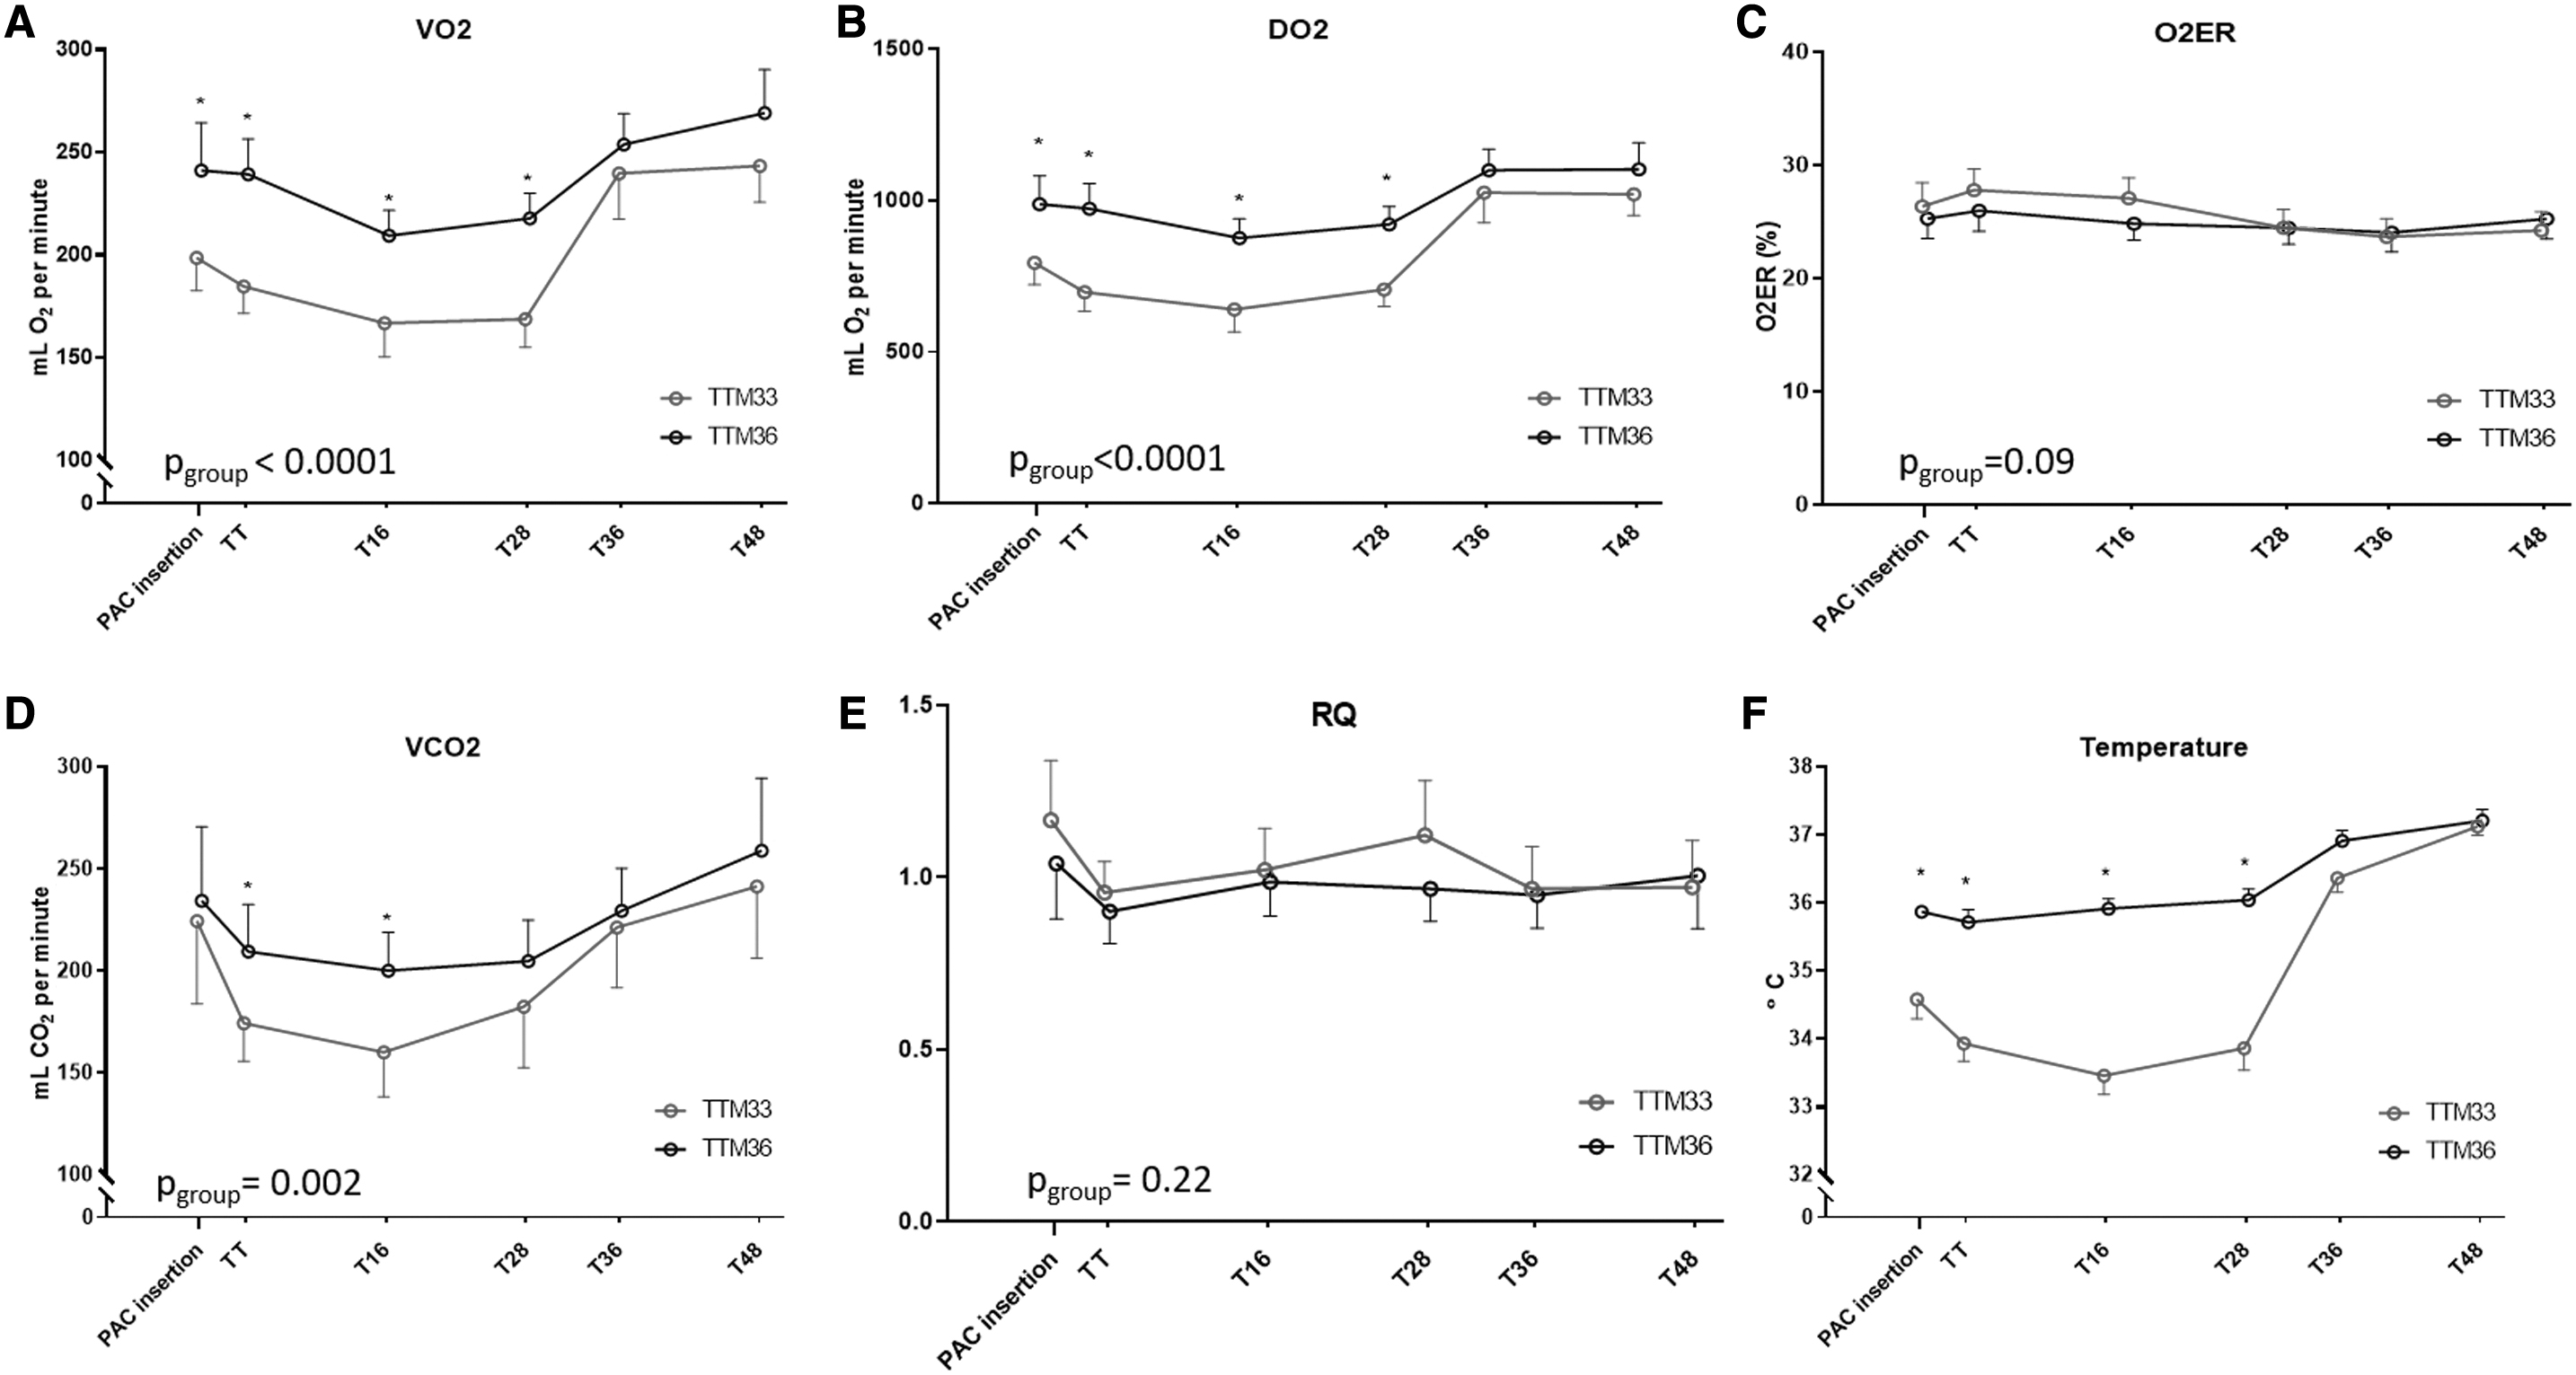
Temporal changes in metabolism during TTM33 and TTM36.
Correlations of oxygen variables
VO2 during the first 36 hours (during TTM and rewarming) of hospital admission correlated significantly with temperature, and for each degree lower body temperature, the VO2 was 19 mL O2 per minute lower (95% CI: 15–22), p < 0.0001. Spearman's correlations coefficient was r = 0.40. Same results were seen when analyzing the relationship of VO2 and temperature in the TTM33 and TTM36-groups separately (TTM33: VO2 decreased by 19 mL O2 per minute; [95% CI: 15–23], p < 0.0001. TTM36: VO2 decreased by 16 mL O2 per minute; [95% CI: 8–24], p < 0.0001).
During the first 36 hours, DO2 correlated also significantly with temperature, and for each degree lower body temperature, the DO2 was 94 mL O2 per minute lower; (95% CI: 79–108), p < 0.0001, r = 0.42 (Fig. 3).
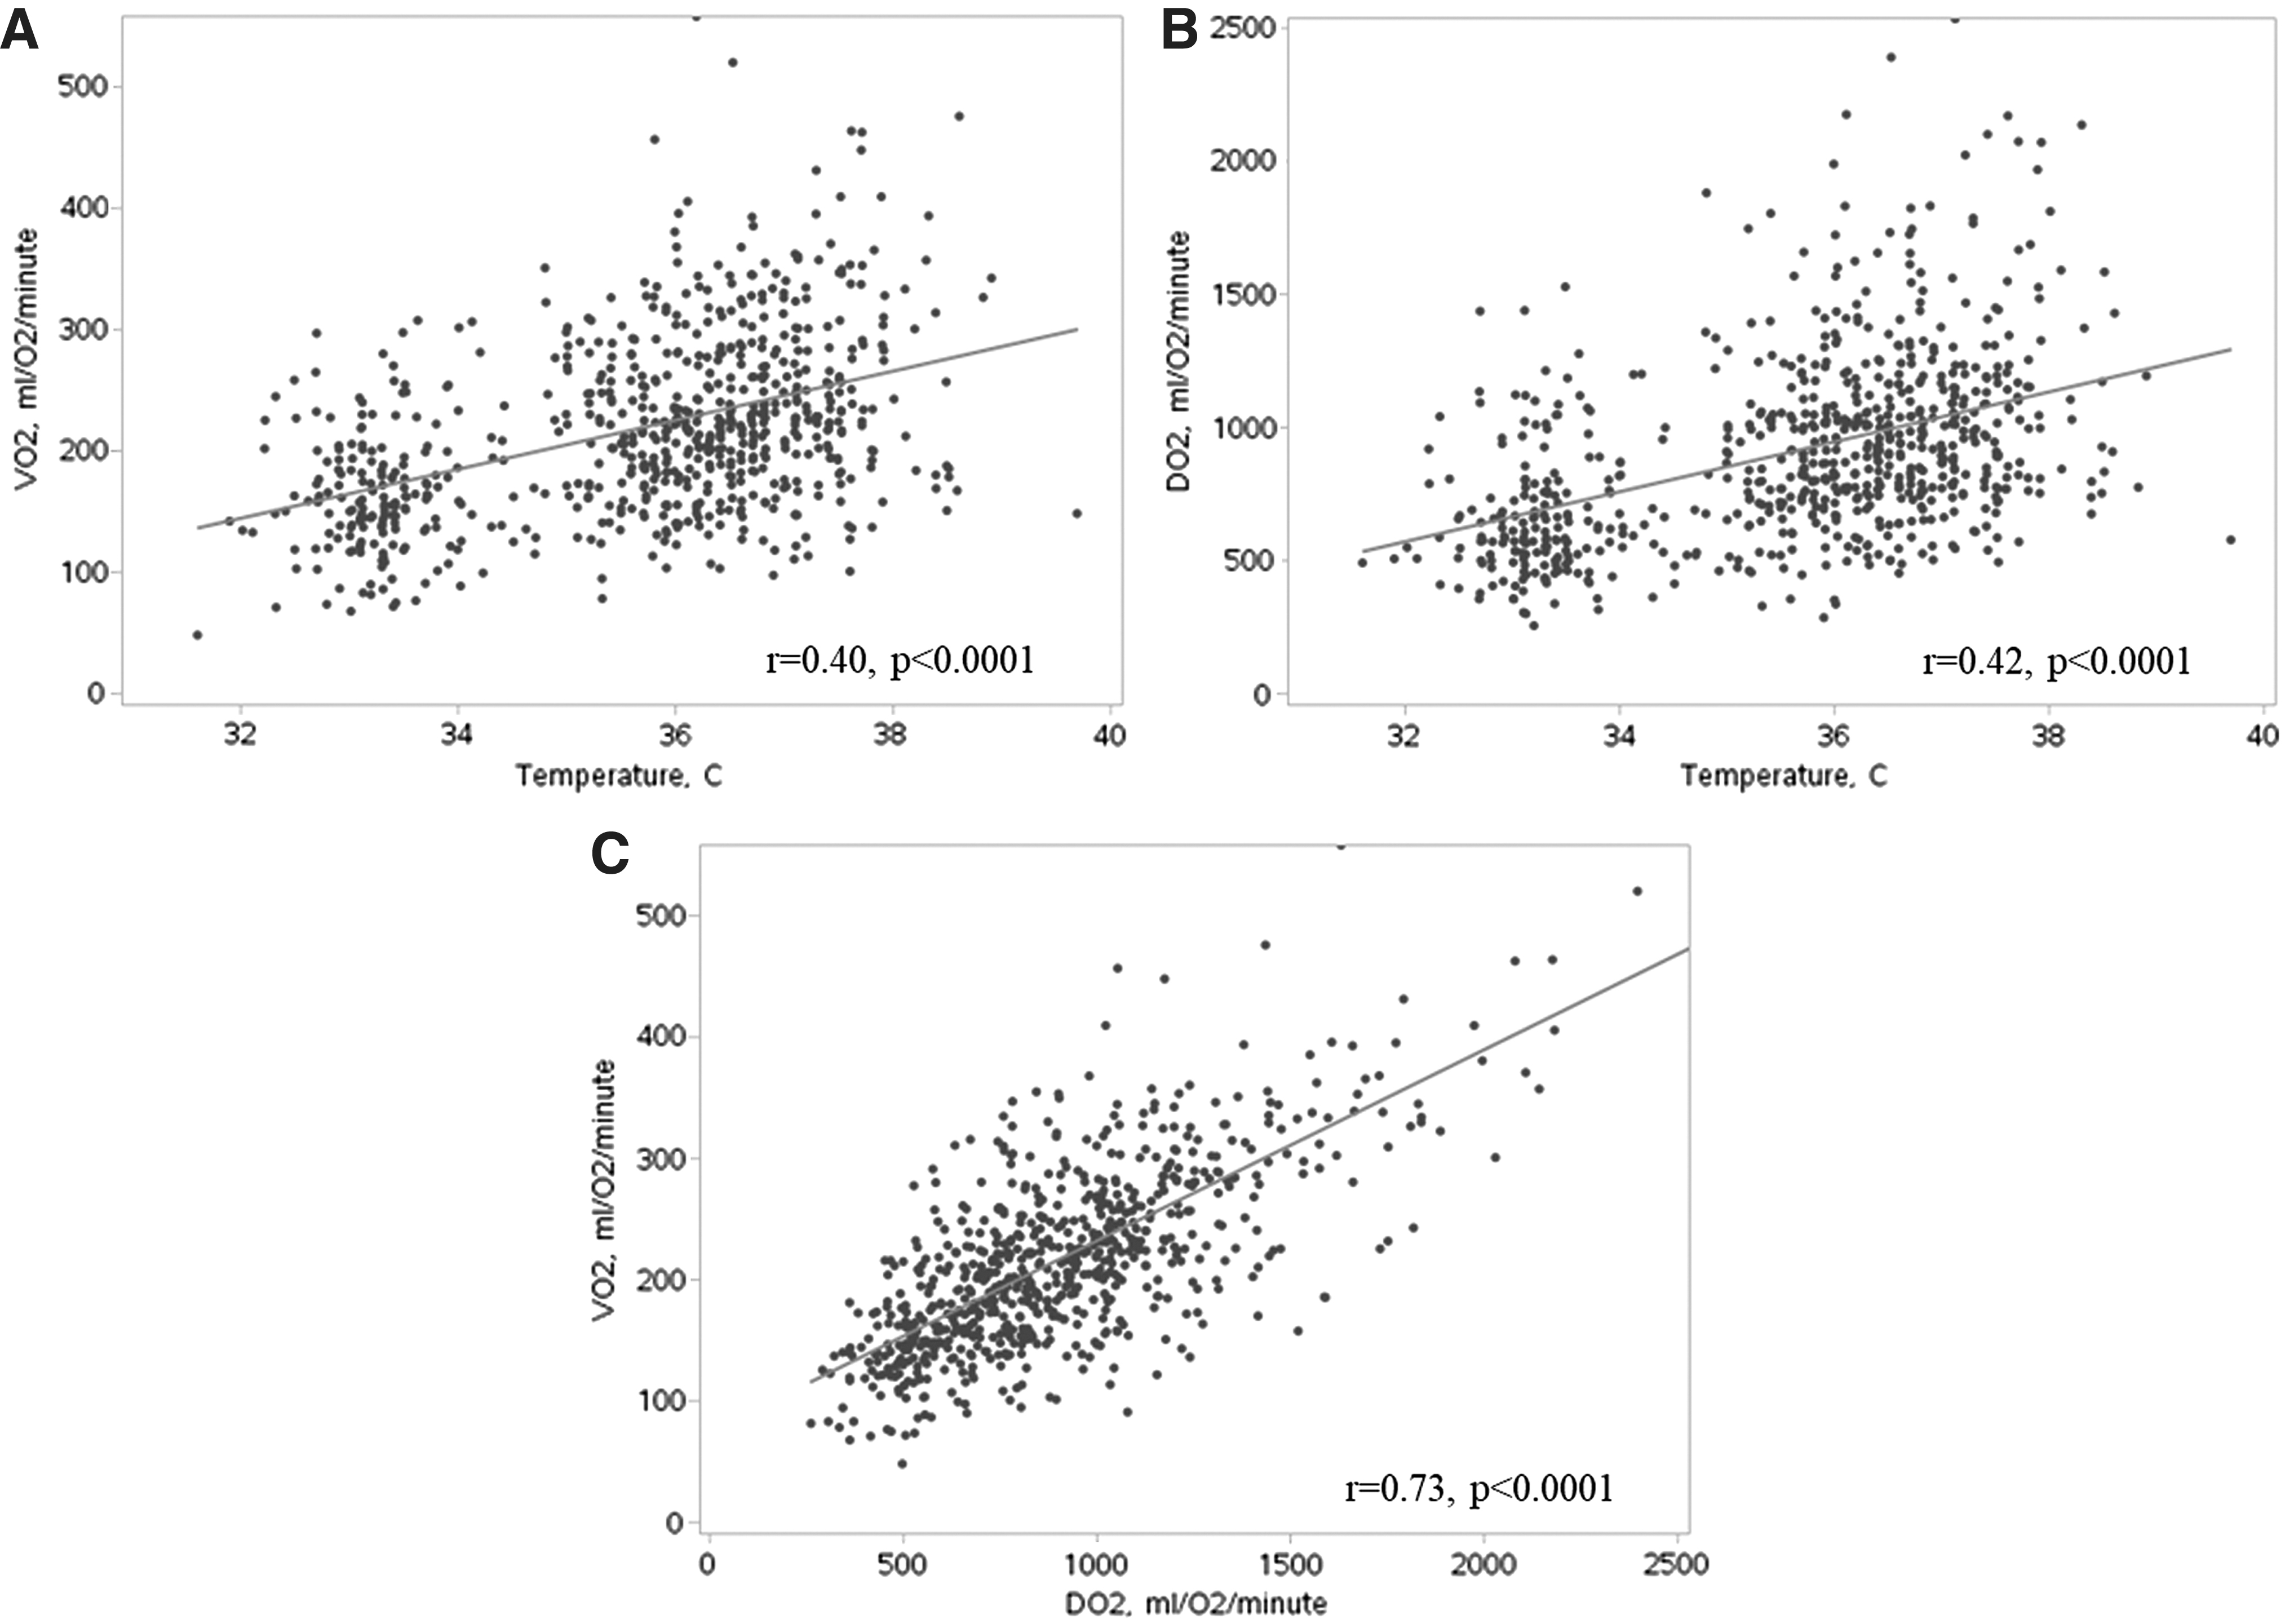
Correlation of whole-body oxygen consumption (VO2) and temperature
DO2 and VO2 correlated highly significantly, and VO2 increased by 23 mL O2 per minute when DO2 increased by 100 mL O2 per minute, p < 0.0001 (Fig. 3).
Shivering was reported in 17 (11%) patients during TTM. VO2 at T16 was mL/(min·m2): 90 ± 17 versus 92 ± 29, p = 0.86 in shivering versus nonshivering patients. DO2 at T16 was mL/(min·m2): 351 ± 69 versus 376 ± 149, p = 0.83 in shivering versus nonshivering patients.
Vasopressor load was significantly lower in the TTM33 group at T16 compared with TTM36 group: 0.03 (0.02–0.05) μg/(kg·min) versus 0.04 (0.03–0.07) μg/(kg·min) (p = 0.04). Vasopressor load during TTM correlated inversely with temperature, r = 0.19, p = 0.02. However, no correlation was found between vasopressor load and DO2 (r = 0.02, p = 0.69) and VO2 (r = 0.09, p = 0.23). There was also no correlation after adjusting for temperature.
SvO2 correlated highly significantly with DO2 (r = 0.46, p < 0.0001), and correlated inversely with VO2 (r = −0.17, p = 0.005). There was no linear correlation among VO2, DO2, or O2ER and lactate. However, when stratifying patients into groups based on their O2ER, patients with high O2ER (>30%) had significantly increased median lactate during TTM: 2.66 (1.65–4.26) mmol/L compared to 1.53 (1.13–1.99) in patients with normal O2ER (25–30%) and 1.53 (1.02–2.37).
Lactate and vasopressor load correlated significantly (r = 0.23, p < 0.0001).
Oxygen affinity
Temperature and p50 did not correlate at T16 (p = 0.14, r = 0.06). However, there was a significant inverse correlation of p50 and pH (−1.93 [95% CI: −2.35 to −1.50], p < 0.0001, r = 0.34). There was a positive and significant correlation between p50 and pCO2 at T16 (0.097 [95% CI: 0.055–0.139], p < 0.0001, r = 0.18) and between p50 and phosphate (0.119 [95% CI: 0.068–0.171], p < 0.0001, r = 0.19) (Fig. 4). In a model with temperature, pH, pCO2, and phosphate, only phosphate (p = 0.03) and pH (p < 0.0001) were correlated with p50. There was a significant correlation at T16 between O2ER and p50 (1.59 [95% CI: 1.14–2.04], p < 0.0001, r = 0.27). There was no correlation between O2ER and temperature.

Correlation of p50 (the oxygen tension when hemoglobin is 50% saturated with oxygen) and temperature
Discussion
In comatose patients resuscitated from cardiac arrest, VO2 and DO2 were significantly reduced during therapeutic hypothermia; however, the O2ER was unchanged. DO2 and VO2 correlated linearly in both temperature groups. This suggests that VO2 in both TTM-groups is largely independent of DO2 during hypothermia and normothermia in hemodynamic stable patients. The low DO2 during hypothermia is likely a consequence of low metabolism with low VO2, since O2ER remained unchanged. This finding is in contrast with a previous study of hypothermia by Bacher et al. (1997) who investigated 13 anesthetized patients undergoing intracranial surgery and hypothermia at 32°C. They found that VO2 decreased, but DO2 remained unchanged during hypothermia, therefore suggesting a “luxury perfusion and oxygenation condition” with a very low O2ER (Bacher et al., 1997). In the TTM-trial, there were no therapeutic targets for cardiac output, hemoglobin, or oxygen saturation in the study protocol. The local hospital protocol advised a MAP of ≥65 mmHg as the only hemodynamic target. Therefore, it was possible for DO2 to drop to low values without interventions being initiated to avoid this unless it was clinically judged that systemic perfusion was inadequate. The low DO2 was primarily driven by a low cardiac output, since saturation and hemoglobin values remained relatively constant during TTM. In other studies, a below-normal DO2 per se, could potentially be seen as a target of treatment thus stimulating the urge to administer inotropic drugs (increasing cardiac output), or increasing oxygen carrying capacity of the blood. This may be the explanation for the low O2ER during hypothermia found by Bacher et al. (1997). From a physiological point of view, however, low DO2 as a single parameter should not be treated, if it is a consequence of low VO2. We found no correlation between DO2 and lactate, which suggests that low DO2 is related to low oxygen consumption and not related to hypoperfusion in most patients. Low DO2 can simply be a result of low oxygen demand (i.e., low VO2), which is supported by a close correlation between VO2 and DO2 and unchanged O2ER during hypothermia, which also were found in this study. However, in patients with high O2ER (suggesting a mismatch between DO2 and VO2), we found significantly increased lactate levels. Animal studies of dogs (Morray and Pavlin, 1990) and sheep (Sinard et al., 1992) have found an unchanged O2ER during hypothermia and is thus in line with the findings from our study.
Surprisingly, shivering did not seem to influence VO2 and DO2, since these parameters were similar between patients with and without shivering. In the TTM-trial, patients were heavily sedated to a Richmond Agitation Sedation Scale of −4, and shivering was treated with neuromuscular blockade, which likely has reduced oxygen consumption in these patients. Another interesting finding was that vasopressor usage was not associated with increases in VO2 or DO2. Possibly higher doses of vasopressors are administered to patients with unstable circulatory function, who without vasopressors would have had impaired hemodynamics with decreased VO2 and DO2. The hemodynamic treatment goals are used to titrate vasopressors to maintain homeostasis. Therefore, the data presented in this study cannot be used to state that vasopressors do not affect VO2 and DO2. A randomized, prospective study of different treatment goals for central hemodynamic parameters is needed to evaluate the effect of vasopressors on oxygen variables. At least one study in this regard is ongoing (ClinicalTrials.gov Identifier: NCT03141099).
In a clinical study of comatose and hypothermic trauma patients by Biancolini et al. (1993) DO2 and VO2 were reduced during hypothermia, whereas O2ER remained unchanged as in our study. Furthermore, they found that p50, a marker of the oxyhemoglobin dissociation curve, was decreased during hypothermia. When p50 increases, hemoglobin-oxygen affinity decreases, and the oxyhemoglobin dissociation curve shifts to the right, which can be advantageous for oxygen-release in the tissues but disadvantageous in case of pulmonary disease. Changes in oxygen affinity happen because of alterations in the quaternary shape of the hemoglobin molecule affecting oxygen binding. Lower temperature as a lone factor should cause a left shift in the curve, which contrasts with our findings (Astrup et al., 1965). However, p50 is more dependent of other factors than temperature, which are pH, PCO2 (known is the Bohr effect) (Jensen, 2004), S-phosphate, and 2,3-DPG (Astrup et al., 1965). We showed that p50 correlated significantly with pH, phosphate, and pCO2 (we did not have data on 2,3-DPG) and in a model with all factors, pH was more strongly correlated with p50 than any other variable, thus temperature in the range of 33–36 degrees may be less important for hemoglobin oxygen affinity in the clinical setting (Bacher et al., 1997). We found that p50 and O2ER correlated significantly, suggesting that a higher p50 is associated with higher oxygen extraction in the tissues, which can compensate for impaired DO2 in critically ill patients. This finding proposes a potential target for treatment if hemodynamics is compromised and O2ER is low (Srinivasan et al., 2017).
As an exploratory measure, we found that the REE during TTM was significantly lower in the TTM33-group. On average, patients in TTM36 consumed 352 kcal more compared to TTM33. Surprisingly, we found that the RQ was unaffected by hypothermia, suggesting that the relationship between carbohydrates and fat as substrate for aerobic metabolism was unaffected during TTM. It has previously been argued that hypothermia after cardiac arrest leads to increased fat metabolism (Polderman, 2009).
Limitations
This study has some advantages as it is relatively a large study of oxygen delivery and consumption from a real-life clinical setting with a randomly allocated target temperature, whereas most studies of oxygen variables in critically ill patients are from experimental studies of humans and animals. However, we acknowledge some limitations: (1) this was a post hoc analysis from a clinical study, and even though data were collected consecutively and prospectively, this is a retrospective study limiting the ability to assess causality. (2) We used the reversed Fick method for estimating oxygen consumption, which ignores oxygen consumption of the lungs. Future studies could measure oxygen consumption with indirect calorimetry, which does not have this limitation. (3) For calculations of the energy expenditure, we used the abbreviated Weir Equation, where we did not have measures of urine nitrogen excretion. This is limitation, since we do not know to which amount protein metabolism contributes to the metabolism.
Conclusions
During TTM, VO2 and DO2 were significantly lower in patients targeted at 33°C compared to 36°C, whereas O2ER was not significantly affected by hypothermia. The oxygen dissociation-curve biomarker p50 correlated significantly with O2ER. Increasing p50 could potentially increase O2ER, which could be investigated in future clinical studies.
Footnotes
Author Disclosure Statement
No competing financial interests exist.
Funding Information
The research fund Gangstedfonden and the research fund of Rigshospitalet has supported this study with unrestricted salary in Dr. Grand's PhD project.
Dr. Kjaergaard was supported by unrestricted grants from the Novo Nordisk Foundation: NNF17OC0028706.
Dr. Hassager was supported by the Lundbeck Foundation.
The TTM-trial was supported by independent research grant from TrygFonden (Denmark) (Grant No: 7-12-0454).