
Abstract
Background:
Following exposure to radiation during the Chernobyl fallout tragedy, papillary thyroid carcinoma (PTC) increased significantly in individuals who were children at the time of the accident. We have used two high-throughput, whole genome platforms to analyze radiation-induced PTCs from pediatric patients from the Chernobyl region.
Methods:
We performed comparative genomic hybridization using Affymetrix 50K Mapping arrays and gene expression profiling on 10 pediatric post-Chernobyl PTCs obtained from patients living in the region. We performed an overlay analysis of these two data sets.
Results:
Many regions of copy number alterations (CNAs) were detected including novel regions that had never been associated with PTCs. Increases in copy numbers were consistently found on chromosomes 1p, 5p, 9q, 12q, 13q, 16p, 21q, and 22q. Deletions were observed less frequently and were mapped to 1q, 6q, 9q, 10q, 13q, 14q, 21q, and 22q. Gene expression analysis revealed that most of the altered genes were also perturbed in sporadic adult PTC; however, 141 gene expression changes were found to be unique to the post-Chernobyl tumors. The genes with the highest increases in expression that were novel to the pediatric post-Chernobyl tumors were TESC, PDZRN4, TRAa/TRDa, GABBR2, and CA12. The genes showing the largest expression decreases included PAPSS2, PDLIM3, BEXI, ANK2, SORBS2, and PPARGCIA. An overlay analysis of the gene expression and CNA profiles was then performed. This analysis identified genes showing both CNAs and concurrent gene expression alterations. Many of these are commonly seen in sporadic PTC such as SERPINA, COL8A, and PDX, while others were unique to the radiation-induced profiles including CAMK2N1, AK1, DHRS3, and PDE9A.
Conclusions:
This type of analysis allows an assessment of gene expression changes that are associated with a physical mechanism. These genes and chromosomal regions are potential markers for radiation-induced PTC.
Introduction
The most dramatic demonstration of the effects of radiation exposure on the pediatric thyroid was the accident involving the Chernobyl nuclear power plant in April 1986, in which 1760 PBq of 131I were released into the environment. An extremely large increase in the incidence of thyroid cancer in children and adolescents under the age of 15 was noted 5 years later in Belarus and surrounding regions (7). Iodine 131 was concentrated in the thyroid gland with children and adolescents receiving higher doses due the smaller size of the thyroid gland and the greater amount of milk ingested (see Ron [8] for review). Prior to the fallout accident, papillary thyroid carcinoma incidence in children in Gomel (the most contaminated region of Belarus) was less that 1 per million per year, similar to other countries. The rate increased to 90 per million from 1991 to 1994 (9). The most current estimates suggest that 4000 cases of thyroid cancer occurred among individuals exposed before the age of 15 years between 1986 and 2002 in Belarus, Ukraine, and four highly contaminated regions in Russia (10). The Chernobyl tragedy is the most important source of information for the study of risks to young people from exposure to radioactive isotopes of iodine.
Papillary thyroid carcinoma (PTC) has been the most frequent type of thyroid carcinoma observed in these pediatric patients. The tumors have been relatively aggressive with high rates of metastases (11). The most common molecular pathological finding involves rearrangements of the RET proto-oncogene on 10q11.2 in approximately 90% of radiation-associated tumors (12,13). There are up to 15 variants of RET rearrangements; however, the two most predominant variants in radiation-induced pediatric PTC are an inversion of chromosome 10 whereby RET is fused with H4 (RET/PTC1) and secondly, RET fuses with ELE1, an androgen receptor transcription co-activator (RET/PTC3). Chromosomal rearrangements of these two genes are also common in sporadic adult PTCs but the reported occurrences are inconsistent and range from 0% to 60% (14).
Global cytogenetic analyses of radiation-induced PTC are scarce. For example, Richter et al. (15) used conventional comparative genomic hybridization (CGH) to detect gains and losses in 60 post-Chernobyl childhood PTCs. This analysis revealed that 30% of the tumors carried copy number alterations (CNAs) and the most frequent of these involved gains on chromosomes 2, 7q, 13q, and 21. Losses were detected on chromosomes 16, 20q, and 22q. Copy number analyses have been conducted more frequently on sporadic adult PTC; however, the majority of these analyses have used conventional CGH and have found very few CNAs. For instance Hemmer et al. (16) used CGH to study DNA CNAs in sporadic PTCs but found only 3 of 26 patients had any alterations, while Singh et al. (17) used CGH to analyze 21 sporadic PTCs and found that almost 50% of these had gains or losses. Using conventional cytogenetic analysis, Roque et al. (18) reported that 19 of 90 sporadic PTCs had CNAs, the most common being a loss of the Y chromosome in four cases. Bauer et al. (19) evaluated copy number in 15 PTCs using conventional CGH and found only four of the tumors had CNAs. These studies suggest that PTCs, in general, have low levels of CNAs.
With the emergence of array-based CGH (aCGH) technologies it is now possible to resolve regions of genomic amplification and deletion as small as 2 kb with a single assay. In addition to improved resolution, we are also able to incorporate statistical methods to identify novel regions of loss or gain that correlate to known amplifications or deletions. For example, Finn et al. (20) used cDNA clone-based aCGH to examine five laser-captured PTC tumors and found CNAs in all cases. More recently, Unger et al. (21) used BAC-based aCGH to look at CNAs that would segregate RET/PTC-positive tumors from RET/PTC-negative from both sporadic and Chernobyl, adult and pediatric patients. They reported a wide range of CNAs. Here we report the analysis of 10 post-Chernobyl childhood thyroid tumors using high-density single nucleotide polymorphism (SNP) array CGH analysis (SNP-CGH) with the Affymetrix 50K Mapping array (Affymetrix Inc., Santa Clara, CA) and recently developed copy number analysis tools. We assumed that these pediatric PTCs were a result of exposure to radiation. This analysis has allowed us to define the regions of CNAs with greater resolution and identify regions of consistent alterations. Differences in the behavior of individual tumors are likely a direct result of multiple genetic mutations and epigenetic changes within the cancer cell. For alterations at the DNA level to be relevant to tumorigenesis, they must directly impact gene expression and ultimately the amount and activity of the protein produced. Because genes are transcribed into mRNA, measuring the abundance of mRNA within the tumor is reflective of genetic and epigenetic alterations that determine tumor behavior.
Comprehensive analyses of transcript expression patterns of individual tumors can now be achieved using oligonucleotide microarrays. We have used 10 radiation-induced childhood PTC samples to establish the pattern of expression of all of the known genes in the human genome using Affymetrix 133A GeneChips. We and others have performed global gene expression on sporadic PTCs and, using these data repositories, we compared gene expression profiles from the radiation-induced childhood tumors to the available published data on sporadic PTC. With these data in hand we were able to generate a profile of genes that show increases and decreases in expression that are unique to the pediatric radiation-induced tumors. With this information it will become possible to identify patients that have been exposed to radiation and evaluate possible targets for therapeutic intervention of these more aggressive tumors.
One way to assess the relative importance of gene expression changes is to combine complementary analyses from the same biological samples that assess changes in the physical genomic profile. This type of overlay analysis can potentially identify genes within specific chromosomal regions that demonstrate CNA with corresponding increases or decreases in gene expression, thereby providing a filter to determine the “drivers” of the CNA. This follows since it is perceived that tumors gain increased malignancy as a result of acquiring selective chromosomal gains or losses as mechanisms for altering gene function or expression. The underlying advantage of this approach is the high-throughput identification of potential changes in gene expression with associated mechanism, which then increases the robustness of either platform by itself.
We conducted an overlay analysis of gene expression data with CNA data obtained using SNP-CGH in a subset of these radiation-induced tumors.
Materials and Methods
RNA and DNA derived from PTC and accompanying normal samples from pediatric patients were obtained from the Chernobyl Tissue Bank (
Included is the RET oncogene status of each tumor. Also shown are which samples were used for the copy number, gene expression analysis or both (Overlay Analysis).
PTC, papillary thyroid carcinoma; NEG, negative.
Copy number analysis using SNP-CGH
The Affymetrix GeneChip 50K Mapping Assay is designed to detect >50,000 SNPs in samples of genomic DNA. The physical position of all SNPs on the mapping array was designed using the May 2004 genome assembly (hg17) at
Copy number data analysis
Following washing, staining, and scanning, the raw image data were incorporated into GTYPE 4.0 (Affymetrix Inc.), which automatically generates genotype calls. GTYPE uses the Bayesian Robust Linear Model with Mahalanobis (BRLMM) distance classifier algorithm (Affymetrix White Paper,
Loss of heterozygosity analysis
Allele calls were obtained from scanned images using GTYPE (Affymetrix). The files were normalized using the BRLMM algorithm. The Trio HapMap data set of 90 CEPH individuals were also normalized using BRLMM and used as a baseline to determine loss of heterozygosity (LOH).
Gene expression analysis
RNA was obtained from the Chernobyl Tissue Bank that had been isolated from individual primary PTC samples and accompanying normal tissues and used to prepare cRNA for hybridization to the Affymetrix U133A oligonucleotide arrays as described previously (22). Total RNA was isolated and cleaned using RNeasy columns (Qiagen, Germantown, MD), and the quality was assessed using the Agilent (Santa Clara, CA) Bioanalyzer Lab-on-Chip. Using 1–5 μg of total RNA as a template, double-stranded cDNA was synthesized using the Superscript Choice System (Invitrogen). A T-7 (dT24) primer was used to prime the first strand cDNA synthesis. An in vitro transcription reaction, which amplifies and biotinylates the samples, was then performed using a BioArray IVT (Affymetrix) kit and the template was labeled by incorporation of biotinylated-11-CTP and 16-UTP ribonucleotides. At each stage of this process the quality of the samples was monitored using both gel electrophoresis and spectrophotometry. The full-length cRNAs were then fragmented to 20–200 bp. Once the samples passed this quality control they were hybridized to the U133A arrays containing representations of 20,000 genes. The arrays were washed, stained, and scanned as previously described (22).
Gene expression data analysis
The probe logarithmic intensity error (PLIER) (Affymetrix) algorithm was used to normalize the gene expression data from the 20 samples (10 PTC compared to 10 matched normal samples). Once all arrays were normalized gene expression alterations were calculated for each probe set using a paired t-test with a p-value cutoff of 0.05 and twofold differential expression. A p-value correction was performed using the Benjamini–Hochberg false discovery rate (FDR). After performing the normalization, a principle components analysis (PCA) was used to examine whether clusters could be explained by the first few principle components, which is ordered by the eigen values of the covariance matrix. As dimensionality reduction using PCA has been shown to degrade cluster quality in certain instances (23), unsupervised hierarchal clustering using the Pearson correlation coefficient as a distance metric is performed as a comparison to the clustering structure provided by PCA. If concordance of the clustering structure is observed between the two dimensionality-reduction procedures, n-way ANOVA analysis is performed comparing the various clusters. Generally, a group difference of twofold between the clusters and a p-value of 0.05 based on the t-statistic after adjustment for multiplicity by way of the Bonferroni correction.
To assess the possible functional connections between the differentially expressed genes (DEGs), a pathways analysis, which assesses statistically overrepresented functional terms within a list, was conducted using Ingenuity Pathways Analysis version 7.5 (IPA; Ingenuity Systems, Redwood City, CA). IPA generates networks of interrelated genes based on the input-eligible molecules in the DEG list. The score is a numerical value used to rank the generated networks according to their degree of relevance to the molecules represented by the DEG list. The score is generated using a right-tailed Fischer's exact test, and the score is the negative log of this p-value. Functional analysis of the DEG was also performed using IPA. This enables an association of biological functions with the DEG using the Ingenuity knowledge database.
Comparison to sporadic PTC
In order to define a profile of post-Chernobyl tumors that differed from sporadic PTCs we compared a profile of sporadic PTC that had been deposited in the Gene Expression Omnibus (GEO accession GSE3467, 24) to our Chernobyl tumors. We used the same normalization and analysis strategy described above in the data analysis section. Analysis of this data using PCA showed very divergent profiles between the two data sets we compared. Since we were aware that many of the gene expression alterations were the same between sporadic and radiation-induced PTCs, we were able to attribute these differences to technical issues related to processing. We then compared the sporadic PTCs to their normal counterparts from a GEO data set and systematically compared this list of gene expression alterations to the one we had generated from the 10 Chernobyl samples. From this analysis we developed a “unique” profile for the radiation-induced tumors. Next we systematically compared the PTC profiles published in the literature. A list of genes showing consistent over- or under-expression unique to the radiation-induced tumors was then compiled.
SNP-CGH gene expression overlay analysis
Using Partek (St. Louis, MO) Genomics Suite, an analysis was performed on five samples with complementary data sets from both SNP-CGH and expression profiling. Each sample was analyzed for overlapping events in copy number and gene expression analysis. For the Affymetrix GeneChip U133A platform, signal log ratios (SLRs) of gene expression were generated for each tumor via comparison with the surrounding normal tissues. A 1.0 log2 ratio in signal intensity was used to evaluate either up- or down-regulation of gene expression. Copy number alterations were defined as <1 (loss) or >3 (gains). Concordant changes in SNP-CGH and gene expression as defined above (i.e. chromosomal gain with up-regulation of gene transcript and vice versa) were calculated for each tumor. For an overlay event we specified the loss/underexpression (or gain/overexpression) had to occur in at least two of the five overlapping data sets.
Results
Copy number analysis
In this study we analyzed 10 radiation-induced PTCs from the Chernobyl Tissue Bank using the 50K SNP Mapping array. Chromosomal aberrations were defined as genomic regions in which the signal in the tumors differed from that of the normal samples. Copy number analysis using SNP-CGH often results in large numbers of chromosomal regions displaying losses or gains because of the high resolution of these arrays. To avoid excessive identification of false positives in our data we not only used the statistical analysis available in Partek 6.0 Suite, but also restricted our CNAs to those events that occurred in segments of the genome that contained >10 contiguous markers and occurred in two or more tumors compared to the baseline samples. The summary results are presented in Fig. 1. Amplifications are defined as having more than three copies. The width of each bar represents the number of samples showing the CNA. The complete list of amplifications and deletions is shown in Supplemental Table S1 (available online at

Genome view of copy number alterations in radiation-induced pediatric PTC. The red bars to the right of the chromosomes represent amplifications and deletions are represented by blue bars. The number of tumors showing the amplification or deletion is shown by the width of the vertical bars. The extent of the amplification or deletion is represented along the length of the chromosome. Color images available online at
Amplifications
The most frequent amplification occurred on chromosome 22 in all 10 samples. This relatively small amplicon has an average of five copies, is 0.46 Mbp, and contains only seven genes. Several other amplifications occur in this same region of chromosome 22. Two of these amplifications occurred in 9 of the 10 tumors and had an average of three copies. Both are large, comprising 1.1 and 3.4 Mbp, respectively, but are not discernable in Fig. 1. The more centromeric amplification contained 10 genes and the amplification closer to the telomere contains 14 genes and has a mean copy number of 3.9.
Other common amplifications were observed in 9 of the 10 tumors and mapped to chromosomes 1 and 12. The amplification on chromosome 1 was relatively large, spanning a 17 Mbp region and containing 143 genes including TP73 and the entire family of PRAME genes. The amplification on chromosome 12 had an average of 3.7 copies and comprised 7 Mbp on the distal q arm of the chromosome (see Fig. 2). Sixty-nine SNPs and 27 genes map to this region. As seen in Fig. 1, amplifications on 5p, 9q, 16p, and 21q also occurred in a large number of tumors.
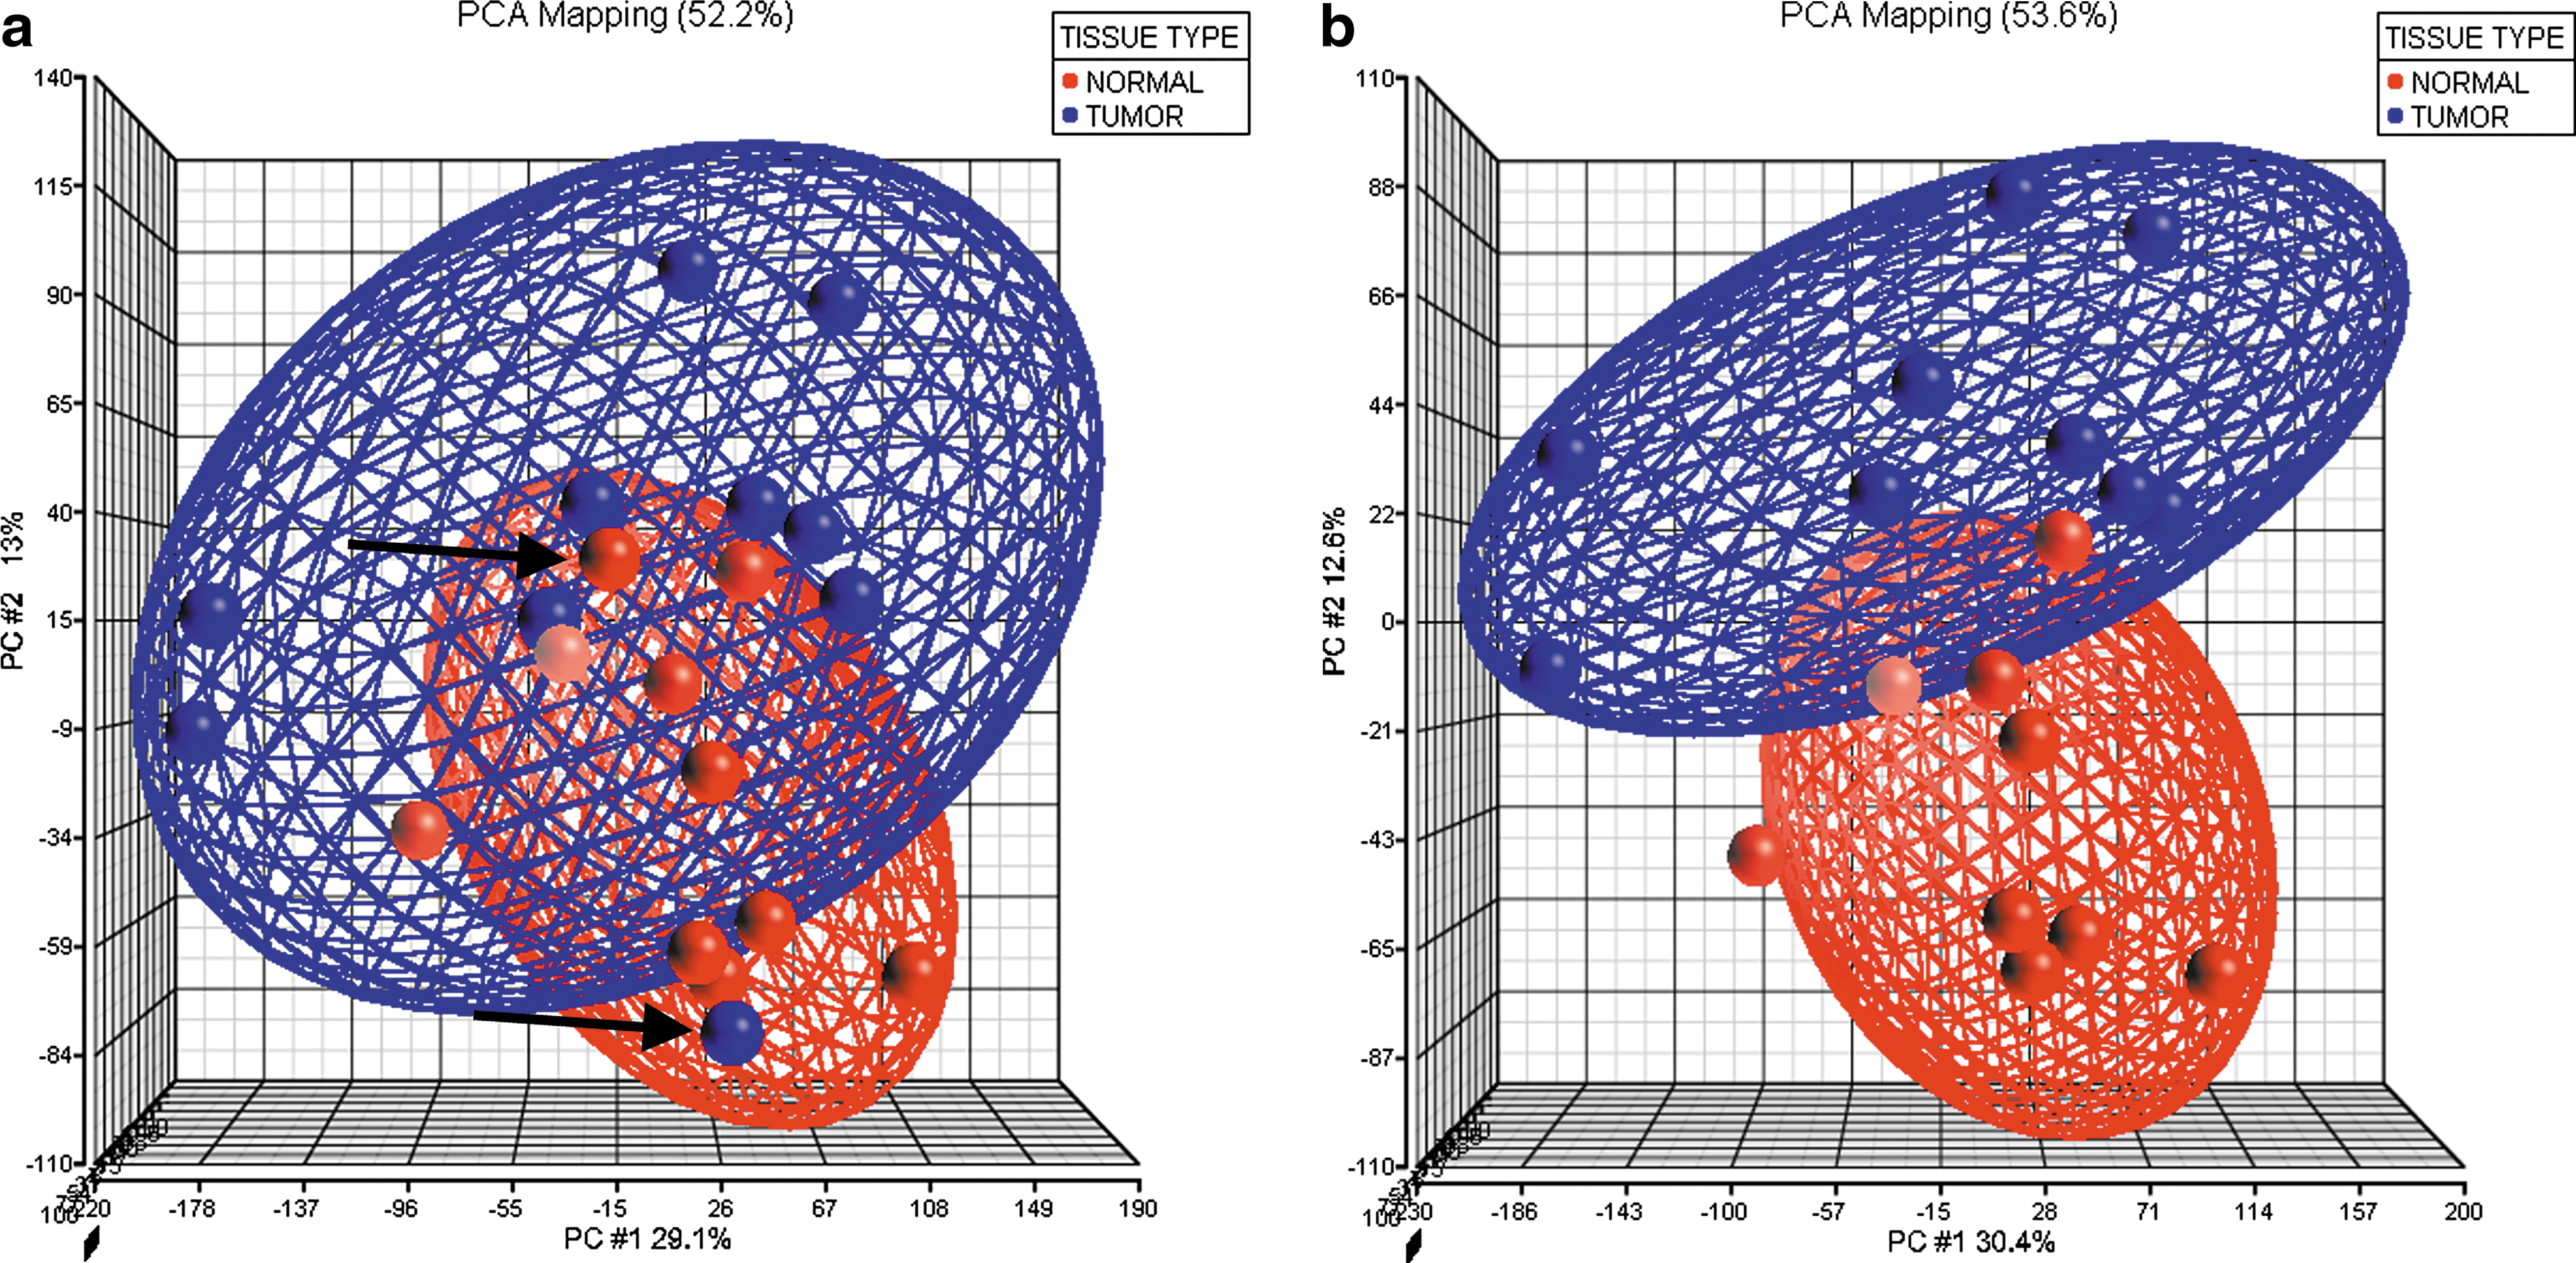
Principle components analysis (PCA) of the gene expression data generated by comparing 10 normal thyroid tissues to 10 matched tumor samples from the same patients. (
Deletions
Deletions in PTC have generally been less frequently reported in the literature, and we found a similar pattern in which deletions were less common than amplifications. The most prevalent deletion occurred in 7 of the 10 samples. This 4.4 Mbp deletion maps to chromosome 21q. All seven tumors show a single copy and nine genes map to the region including all the members of the B melanoma antigen (BAGE) family. The next most common deletion occurred in 6 of the 10 tumors also on chromosome 21. The two deletions are very close and not discernable in Fig. 1. This smaller deletion is 0.1 Mbp and contains only two genes. Several small regions on chromosome 14 show deletions in 3 of the 10 tumors including one close to the centromere in 14q12. This 0.2 Mbp deletion contains seven genes, which are all members of the olfactory receptor family 4 set of genes. The other two deletions on chromosome 14 occurred in 2 of the 10 samples and both are located in 14q23. The most centromeric deletion contained four genes and the more distal one contained two. The other deletions all occurred in 2 of the 10 tumors and on these tumors showed single copies including a small region of 1q, a larger region of 6p and 9p, and two regions on 10p, 13q and 22.
LOH analysis
LOH is a mechanism of exposing recessive mutations in tumor cells and cannot be detected using copy number aCGH arrays alone. The SNP mapping arrays, however, not only define CN but can also characterize LOH events simultaneously, on the same platform (25) based on algorithms that estimate the possibility that linear strings of SNPs could not occur by chance based on their allele frequencies in the population. The presence of LOH is defined by an LOH score based on the detailed analysis by Lo et al. (25). Based on these studies we set the cut-off score at 20 at which no significant regions of LOH were identified in this cohort. These results are consistent with previous studies of LOH in PTC using different platforms to assess LOH (26).
Gene expression analysis
RNA from 10 matched tumor and normal pairs was hybridized to the U133A array to compare transcript expression profiles. PCA of these 20 samples was performed following normalization of the data using PLIER. This preprocessing demonstrated that two samples (UA135 TI and UA135 N1) were clear outliers (see Fig. 2a), which often indicates that much of the variation seen may be attributed to sample processing issues. We were, however, unable to correlate these variants with common technical factors such as hybridization date, global scaling factors, or RNA quality. Since these samples represented normal and tumor tissue from the same patient, it is likely that the inconsistency is related to procurement or diagnosis issues. To avoid compromising the data analysis, these samples were removed, and the remaining nine paired samples were assembled into distinct normal and tumors categories (Fig. 2b). The PLIER normalization was then followed by a paired t-test for significance using a Benjamini–Hochberg correction with a 0.05% cutoff level (see Materials and Methods), which resulted in a DEG list consisting of 242 genes displaying up-regulation in the tumors compared to the paired normal samples, and 210 genes displaying down-regulation. The complete data set is shown in Supplemental Table S2 (available online at
To investigate deregulated pathways in these PTCs, we submitted the DEG list to analysis by IPA. The functional networks with the highest scores identified included (1) Cancer, Cellular Growth and Proliferation, and Reproductive System Disease; and (2) Cellular Movement, Cell-to-Cell Signaling, and Cell-Mediated Immune Response. The first network is shown in Figure 3. It is notable that the majority of genes interact directly or indirectly with ESR1 and TERT genes, although these genes do not have altered expression themselves in the tumors. The biological functional analysis determined that the most significant (p = 5.15E-10) molecular function was Cellular Growth and Proliferation and the most significant (p = 2.75E-08) physiological function implicated by the DEG list was Tissue Development.
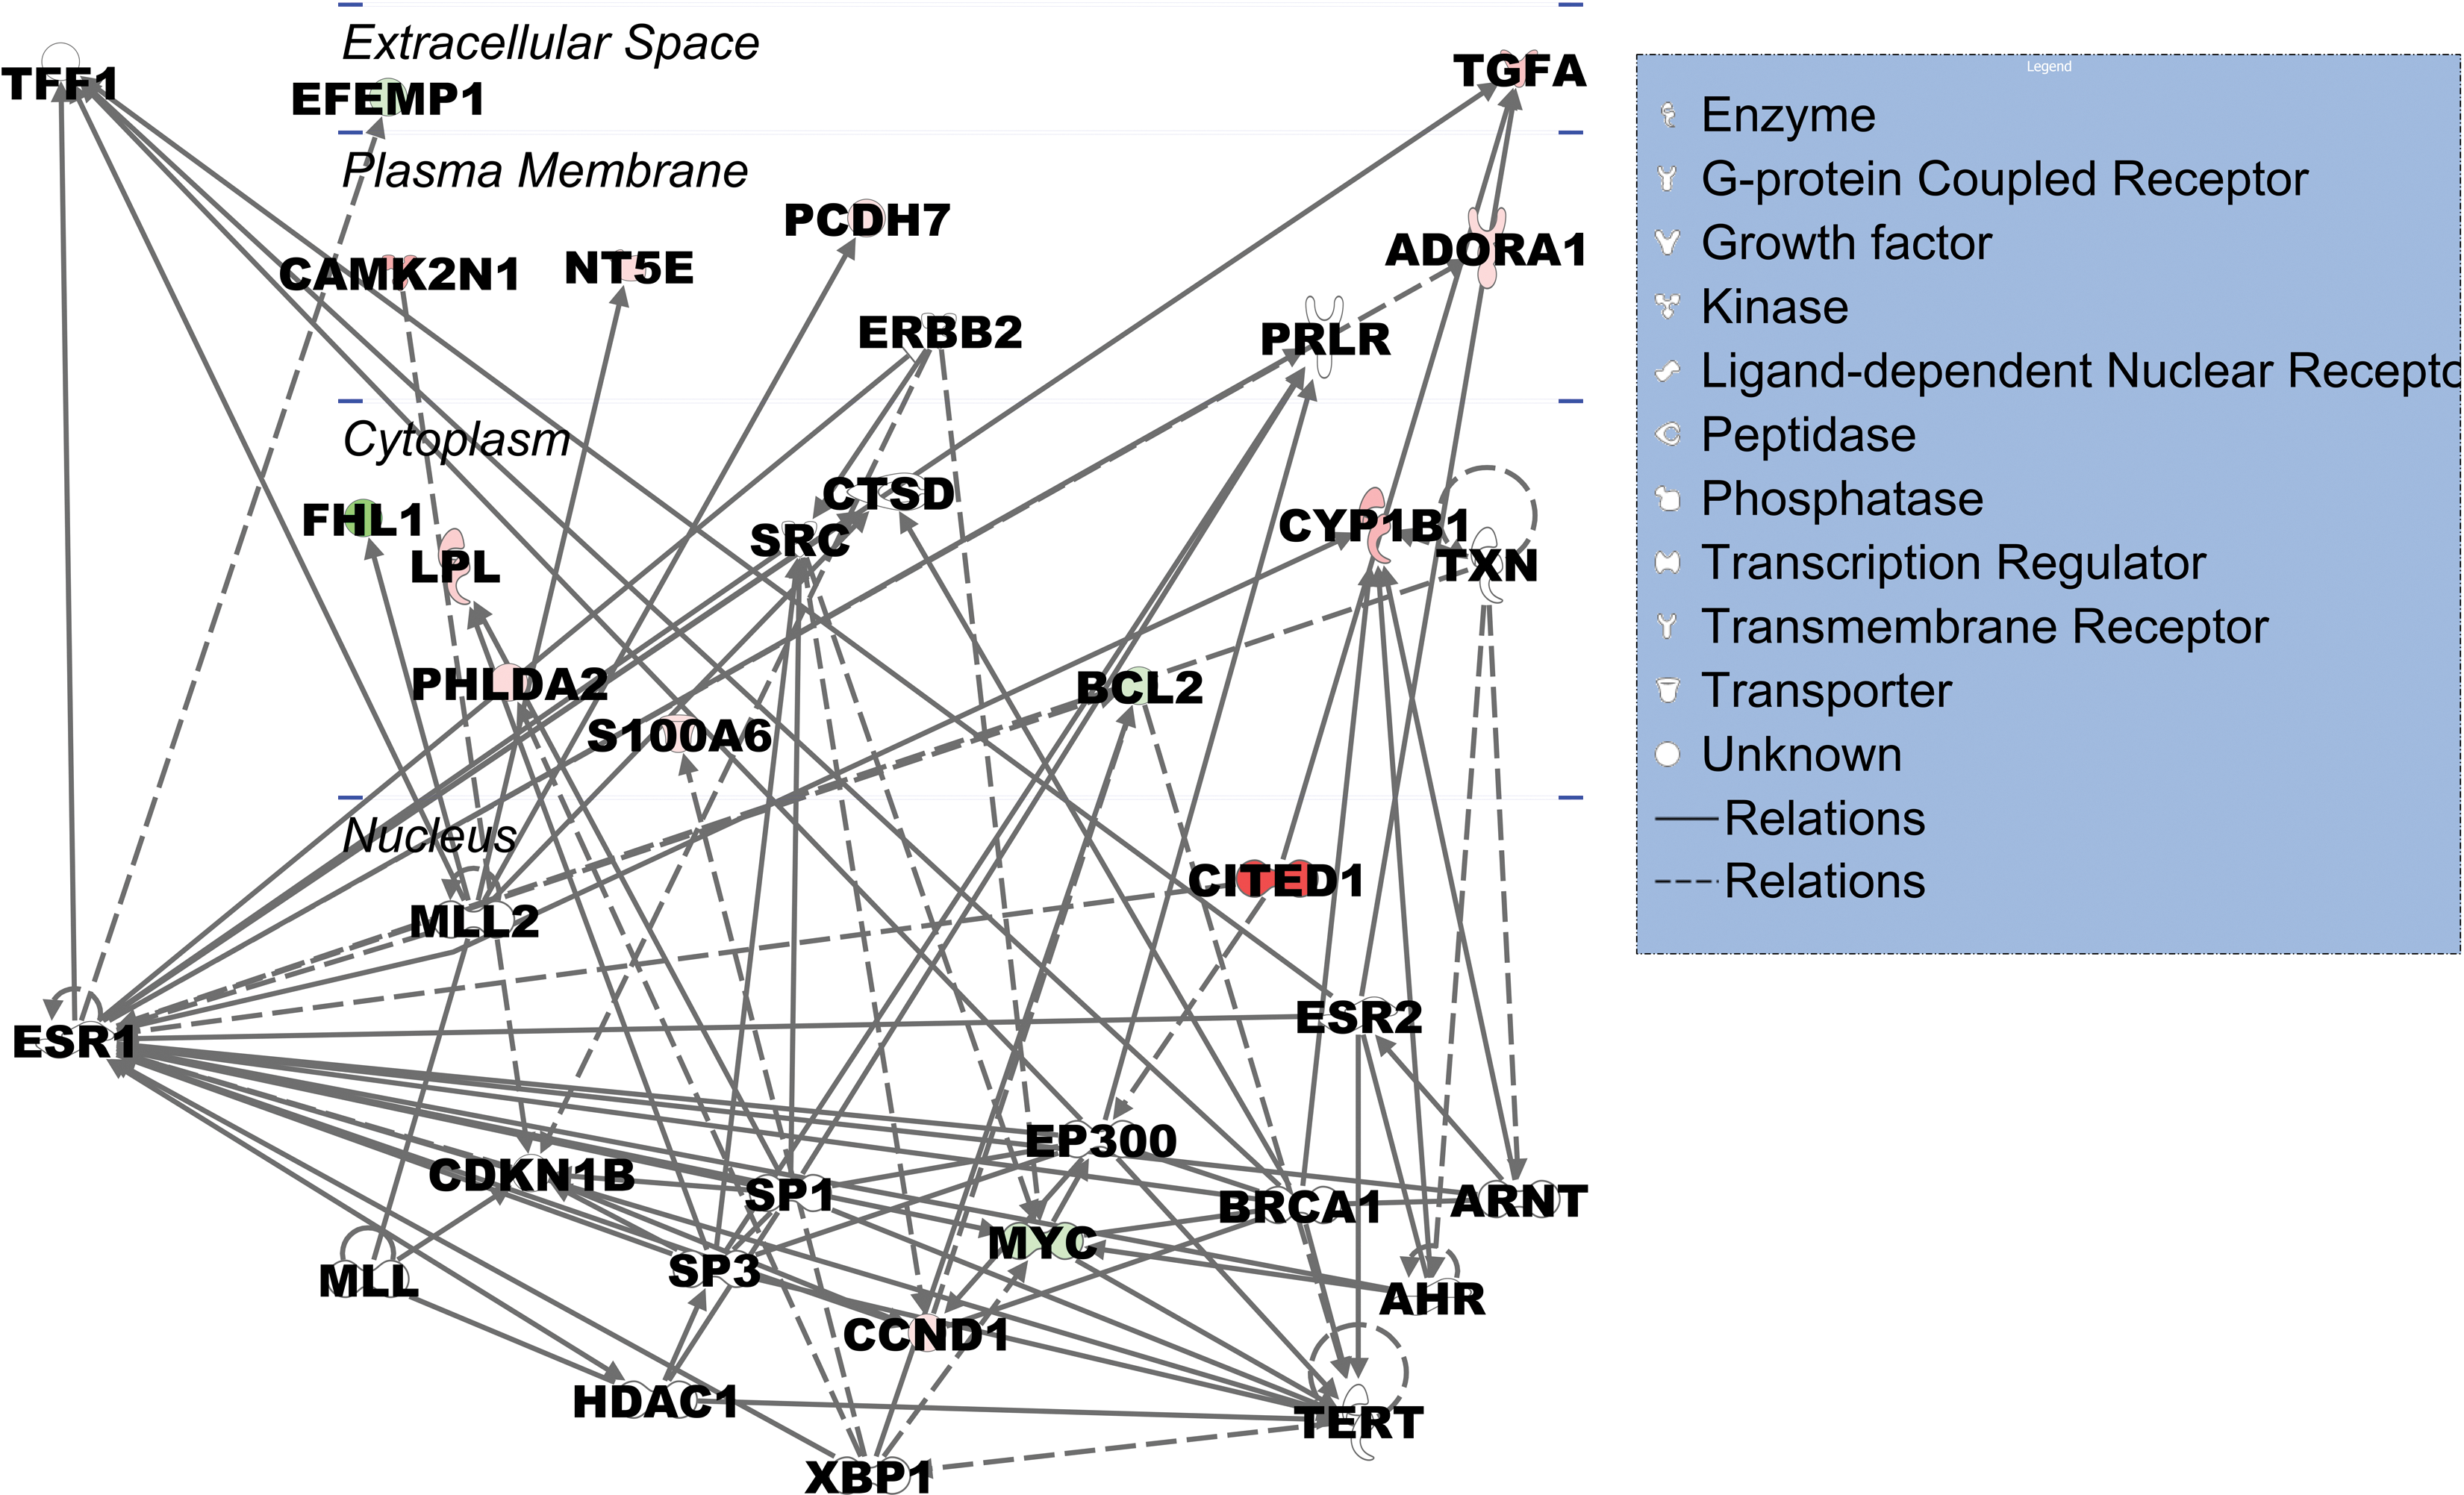
Network generated by Ingenuity Pathways Analysis (IPA; Ingenuity Systems, Redwood City, CA) of gene expression differences between PTCs and matched normal tissues. The network displayed was the highest-ranked network generated by the differentially expressed gene list (DEG list). This network is functionally characterized as the Cancer, Cellular Growth and Proliferation, and Reproductive System Disease network. The genes depicted in red are downregulated genes from the DEG list, and those in green are upregulated. The more intense coloring indicates larger fold change differences observed in the tumors compared with the matched normal samples. It is noteworthy that the majority of the genes interact directly or indirectly through ESR1 or TERT, although these genes do not have altered expression levels in the tumors. Color images available online at
Genes in common with sporadic tumors
Despite using different populations and analysis methods the gene expression profile across studies of PTC has remained highly consistent. Interestingly, approximately 70% of the genes altered in the radiation-induced tumors were also altered in sporadic PTCs, but the other 30% were genes that had never been reported to have altered expression in PTC. Of the 242 up-regulated genes in the radiation-induced samples, 175 had been previously been reported to be involved in sporadic PTC. The genes showing the most significant increases (p = 0.005) were LRP4, IGSFI, ODZI, CITED1, HMGA2, SERPINA1, KCNJ2, AGR2, TACSTD2, and NELL3, all with increases greater than 10-fold. Additionally, gene expression alterations in sporadic PTCs have been reported in 136 of the 210 down-regulated genes. The genes showing the largest decreases in expression were TPO, TFF3, CRABP1, MATN2, SLC4A4, D101, KIT, CCL21, and FBLN1 showing significant decreases with greater than sevenfold changes.
After removing the genes that are commonly differentially expressed between sporadic and radiation-induced tumors 177 genes remained that were unique to the Chernobyl tumors. Table 2 describes only those genes showing greater than threefold changes and the full list of genes is shown in Supplemental Table S3 (available online at
In order to generate a Chernobyl-unique profile, sporadic PTCs were compared to their normal counterparts from the GEO data set (see text). The gene expression alterations from this comparison were then systematically compared to the one we had generated from the 10 Chernobyl samples. From this analysis we developed a “unique” profile for the radiation-induced tumors. All current literature on sporadic PTCs expression profiles were then compared to this list of unique genes and any overlapping genes removed. The result of this analysis produced a list of genes showing consistent over or underexpression unique to the radiation-induced tumors.
GEO, Gene Expression Omnibus.
The pathway analysis of the Chernobyl-unique genes using IPA revealed that the highest scoring functional network was Cancer, Cell Cycle, and Gene Expression. This network ideogram is shown in Supplemental Figure S2 (available online at
Overlay Analysis
Our group has previously explored the relationship between gene expression changes and chromosome abnormalities (28
–30). These studies streamline the identification of candidate genes by demonstrating coincident relationships between losses and gains and expression level changes. Expression levels for specific genes show significant normal variation between individuals, whereas copy number changes reflect specific events in tumor cells. From the cohort described here, we were able to generate complementary data sets from five tumor samples from which there was enough quality DNA and RNA from both tumor and normal samples to permit this analysis. The results are summarized in Table 3, which shows only those genes with log2 ratios >1.5 (threefold change). The complete list of 88 overlapping genes is shown in Supplemental Table S4 (available online at
Analysis was performed on five samples with complementary data sets from both single nucleotide polymorphism–comparative genomic hybridization array analysis (SNP-CGH) and expression profiling. Concordant changes in SNP-CGH and gene expression as described in text (i.e. chromosomal gain with up-regulation of gene transcript and vice versa) were calculated for each tumor. For an overlay event we specified the loss/underexpression (or gain/overexpression) had to occur in at least two of the five overlapping data sets. Length refers to the copy number alteration event.
Genes commonly reported in sporadic PTC.
Genes unique to the Chernobyl profile.
Discussion
The analysis of thyroid tumors from pediatric individuals exposed to radioactive fallout from the Chernobyl disaster has permitted a unique insight into the genetic events that are associated with this rare subset of thyroid tumors. Assembling the samples and processing them was challenging because of the variable way in which they were originally collected and processed. Consequently, only 10 samples from the original cohort were usable. Since this project has been ongoing, we felt it was important to maintain the analysis on the same array platform that we used initially. As such we realize that there are currently higher resolution platforms for aCGH available, but the 50K was the one used at the outset. Despite the lower resolution of these arrays it has been clearly demonstrated in our group that the vast majority of CNAs are equally detectable whether the 50K or 500K arrays are used (29,30). This was clearly the case in our study since we identified regions of gains and losses on many chromosomes in this group that were consistent with other reports using lower resolution platforms. Early reports, however, suggested that there were relatively few cytogenetic abnormalities in these radiation-induced tumors (15 –19). Recent CGH studies, however, using cDNA arrays (20) or BAC arrays (21) have now shown that CNAs are more frequent in radiation-induced PTC than previously thought. Clearly the higher resolution platforms permit a more in-depth analysis to the point where it is possible to combine studies to characterize these important events.
Although radiation might be expected to generate deletions and translocations through chromosome damage, our analysis suggested that amplifications are more frequent than deletions. Chromosome region 5p15.33 was amplified in 80% tumors as were regions within 12q24.31–q24.33, 13q34, and 16p13.3, which are novel observations and so may be specific to the profile of radiation-induced tumors. Other amplified regions such as 1p36.33–p36. have been described previously (31,32), although deletions of this region have also been described (17,20,21). Wreesmann et al. (32) found that amplification of 1p34–36 was more common in the aggressive tall cell variant of PTC and so may be related to aggressiveness. The region most frequently amplified in our study involved 22q31.31–p31. This ∼6 Mbp region contains 39 RefSeq genes and has not previously been associated with thyroid cancer or radiation.
Deletions in PTC have generally been less frequently reported, which is consistent with our study. Novel, frequent deletions were identified on chromosomes 2 and 21 and less frequent deletions were seen on chromosome 6, 10, and 14. Rodrigues et al. (33) reported loss of 9q in >50% of aneuploid PTCs. Similar to the radiation-induced PTCs, these PTCs tend to be more aggressive, suggesting that this deletion may be associated with a more aggressive tumor behavior. Previous studies described whole chromosome 13 loss whereas the region seen in our study involved only the 0.5 Mbp 13q14.11 region. Loss of chromosome 22 in PTC has been reported by a number of different groups (17,33,34) while in some cases it was associated with more metastatic tumors in younger patients. Richter et al. (15) also reported loss of 22q in post-Chernobyl patients and suggests that this region may play a role in radiation-induced PTC. Our analysis showed that 22q13.31–q13.33 was the most frequently amplified region in this cohort of tumors while the more proximal 22q11.1–q11.21 was deleted in 2 of the 10 tumors. Clearly this analysis defines radiation-specific genetic changes in PTC although still from relatively small numbers because of their rare nature. Whether additional studies will be able to extend these observations will depend on the availability of the tumors in the future.
Based on gene expression profiling, we were able to fully discriminate PTCs from adjacent normal tissues using two independent clustering algorithms. Pathways analysis of gene expression data determined that Cancer, Cellular Growth and Proliferation, and Reproductive System Disease were the functional networks that were deregulated in PTC. The majority of the molecules in the network interacted with ESR1 and TERT genes. ESR1 has not been frequently reported in relation to thyroid cancer. Chen et al. (35) recently reviewed the role of the estrogen receptors in thyroid cancer. The proliferation of thyroid cancer cells is promoted by an ESR1 agonist, whereas the proliferation is reduced by the enhanced expression of ESR2 or by an ESR2 agonist. Studies have shown that the expression of ESR1 in thyroid cancer cells is increased, whereas the expression of ESR2 is either very low or absent. Chen et al. concluded that estrogen receptors have opposite effects on the growth of thyroid cancer cells, depending on the balance between ESR1 and ESR2 in the cells. The modulation of ESR1 and ESR2 may represent new potential targets for the treatment of thyroid cancer.
Telomerase is a reverse transcriptase that maintains telomere length, a prerequisite for cellular immortality (36). The catalytic subunit of telomerase is human telomerase reverse transcriptase. Its expression is suppressed in most normal cells, but is reactivated in the majority of malignant neoplasms. Umbricht et al. (36) and others have documented telomerase activity and TERT gene expression in thyroid malignancy, as well as in inflammatory thyroid conditions, and its measurement is a potentially useful adjunct in the distinction of benign from malignant thyroid nodules.
Comparison of sporadic and radiation-induced PTC
Our clustering analysis based on gene expression patterns clearly shows a difference between tumor and normal, but the question arises whether there are differences between gene expression patterns seen in the sporadic and “radiation-induced” PTC profiles. Again, early studies were limited by the number of genes used in the analysis in which cDNA microarray analysis failed to identify any gene expression differences from the 2300 gene platform (37). Subsequently, Detours et al. (38) used an array representing a larger number of genes, which again demonstrated no differences in the profiles using hierarchical clustering. In contrast, Port et al. (39) used a whole genome array to compare pooled sporadic and radiation-induced tumors, which suggested that a seven-gene signature could distinguish between sporadic and radiation-induced PTCs. Curiously, none of these differentially expressed genes were identified by our analysis as being unique to radiation-induced tumors, although many of the genes identified by Port and colleagues showed expression alterations in both radiation-induced and sporadic tumors in our study. For these genes the differences may be attributed to different levels of expression between the two tumor types. Since our approach was to exclude any alteration that has previously been reported in sporadic PTCs, we would not have detected those that were differently expressed between sporadic and radiation-induced tumors. In our analysis the two types of PTC were analyzed in two complementary approaches. Firstly, we downloaded a data set from GEO that had previously compared 10 sporadic PTCs to 10 normal samples. To bypass the contribution of processing differences between the two data sets we compared the sporadic PTCs from GEO to their normal counterparts using the same analysis protocol we had used on the radiation-induced tumors. We then compared the differentially expressed genes from both groups and selected the differentially expressed genes that were unique to the Chernobyl samples. This group of genes was then compared to published data sets for PTC, including those with web-based data repositories (39 –45) and cross-referenced to all of the genes we had identified. In cases for which the supplemental data were available through web sites (38,46 –50), we were able to compare the entire data sets with the Chernobyl profiles that we had generated. We found that the majority of the genes intersect with sporadic tumors compared to their normal counterparts, but there were an additional 113 genes that were unique to the radiation-induced pediatric tumors. We suggest that this group of genes provides a baseline for further studies involving new cohorts of tumors.
Although it is not possible to review all of the genes that were identified in this study, it is interesting that four that were apparently unique to the radiation-induced tumor expression profile, were also apparently involved in radiation responses. CTGF belongs to a group known as the immediate-early genes, which are expressed after induction by growth factors. CTGF has been found to have increased expression in response to ionizing radiation in number of different cell lines (51) and keratinocytes (52). Fibroblasts exposed to 2 Gy of ionizing radiation showed upregulation of several genes including CYR61 2 hours post irradiation (53). NUAK2 was identified using subtraction hybridization following exposure of keratinocytes to ultraviolet radiation (54). GSTM3 was also found to be up-regulated in esophageal squamous cell carcinoma following 2–8 Gy of ionizing radiation (55). Interestingly, each of these genes showed increased expression in the cells tested but showed decreased expression in the PTC samples. This may be due to several factors including examined cell types being different in each case and the pediatric thyroid potentially responding differently to radiation. Another reason could be attributed to the source radiation used in these cases, which was different from the exposure at Chernobyl. The differences in the expression of these genes may also be attributed to the time after exposure that the expression profiles were obtained. This would be especially relevant if these genes are early response genes and are shut off after a period of time following exposure and thus would not be detected in the tumors that were collected several years following exposure.
Two other genes that were included in the Chernobyl-unique list that displayed increased levels of expression have also been found to be overexpressed in different cells after exposure to radiation. TSC22D1 encodes a transcription factor and belongs to a large family of early response genes. Koike et al. (56) reported a marked increase in the expression of this gene in response to γ-irradiation. Irradiation of several different cancer cells with ionizing radiation has caused a long-lasting upregulation of NQO1 (57 –59).
The top functional network implicated by the Chernobyl-unique list of genes was Cancer, Cell Cycle, and Gene Expression (see Supplemental Fig. S2). Although this network was not the same as that generated by the DEG list, in both cases the majority of genes interacted through the ESR1 gene as discussed above.
Overlay analysis
While CGH analysis can provide valuable markers that can be used to distinguish between sporadic and radiation-induced tumors, and gene expression studies can define pathways that are involved in tumorigenesis, a combination of the two from the same tumor can help stratify genes for further analysis. Our final analysis of the data involved the selection of genes that had both CNAs and gene expression alterations resulted in a list that contained both genes that have been found altered in sporadic tumors and some novel candidates. Our list is relatively small compared to similar studies and this is attributable to the approach we incorporated into the analysis. The annotations that Affymetrix uses in assigning SNPs to specific genes are very generous. For example, a particular SNP may actually lay 50,000 bp upstream/downstream of the gene. In the context of a gene, especially not a large one, this seems a little overreaching. The actual positions of the SNPs were examined individually and compared to the NCBI's positions of the genes themselves. The SNPs that are actually closest to the gene were then assigned to that gene and others eliminated. We also analyzed only those tumors for which there existed both copy number and gene expression data instead of cross-referencing lists that were generated by the two types of analysis. This ensured that we were reporting gain/loss data and gene expression alteration in those tumors only and not on an unrelated set of tumors. Although our overlay analysis was performed on a small set of samples, with further validation studies it may be possible to screen PTCs for gene expression alterations or using loss or gain of the unique genes in a focused array.
Further studies will show if these genetic alterations can act as biomarkers or targets for therapeutic intervention. Our results have demonstrated that there are CNAs associated with these radiation-induced tumors and that the resolution of the platform used to detect them is a determining factor. We have also demonstrated that the gene expression profile of the radiation-induced tumor is different from that of the sporadic adult PTC. It would be of further interest to compare radiation-induced tumors from pediatric patients that have resulted from radiotherapy for other malignancies. The overlay analysis shows that CNAs result in perturbation at the gene expression level and this highlights those genes whose expression is altered due to physical alterations at the chromosomal level. Using the analyses presented here it would now be possible to identify PTCs that result from radiation exposure as well as isolate a specific set of target genes or pathways for the treatment of these aggressive tumors.
Footnotes
Acknowledgments
We would like to gratefully acknowledge the confirmation of diagnosis provided by the International Pathology Panel of the Chernobyl Tissue bank—Dr. A. Abrosimov, Professor T.I. Bogdanova, Professor M. Ito, Professor V. LiVolsi, Professor J. Rosai, and Professor E.D. Williams.
Disclosure Statement
No competing financial interests exist.