
Abstract
Background:
There is a plethora of partly contradictory reports on somatostatin receptor (SSTR) expression in thyroid tumors. Therefore, our goal was to systematically determine SSTR2 expression in benign cold thyroid nodules (CNs), hot thyroid nodules (HNs), papillary carcinomas (PCs), and Graves' disease (GD) in comparison with intraindividual control tissues by means of immunohistochemistry.
Methods:
Tissue sections from 19 HNs, 10 CNs, 17 PCs and their surrounding tissues, and 8 GD thyroids were immunostained for SSTR2. Membranous SSTR2 staining was quantitated by evaluating 10 high-power fields (HPFs) systematically distributed along the largest diameter of the tissue section.
Results:
The area covered by thyroid epithelial cells in 10 HPFs expressed as median (in mm2) was 0.53 for CNs, 0.44 for HNs, 1.5 for PCs, 1.3 for GD, and 0.3 for the surrounding tissues. The SSTR2 staining density determined by dividing the area of SSTR2 positively stained thyroid epithelial cells (in mm2) by the area of all thyroid epithelial cells (in mm2) in 10 HPFs was 0.1662 for CNs, 0.0204 for HNs, 0.0369 for PCs, and 0.0386 for GD.
Conclusions:
SSTR2 expression is inhomogeneous in thyroid disease, with the highest density detected in CNs. It remains to be determined whether this finding could be of pathophysiologic or therapeutic relevance. The high SSTR2 density in CNs should be considered in the interpretation of SSTR scintigraphy-positive findings.
Introduction
Moreover, there are only preliminary and contradictory data for the detection of somatostatin receptor (SSTR) mRNA in the thyroid gland. Real-time polymerase chain reaction (RT-PCR) is a sensitive technique capable of elucidating SSTR subtype expression. SSTR2 subtype expression has repeatedly been found by RT-PCR in PCs (18,19), and SSTR2 was detected by RT-PCR in 11 of 16 thyroid tumors, including some PCs (20). Preliminary northern blot data report SSTR2 expression only for 2 of 9 PCs and none of 8 follicular adenomas (FAs) (19). However, mRNA analysis may not always accurately reflect receptor protein expression and a number of cases have been reported in which SSTR mRNA was detected, but immunohistochemistry (IHC) (20,21) or immunoprecipitation (22) failed to detect SSTR protein expression. Moreover, RT-PCR cannot determine the cellular and subcellular pattern of SSTR expression (23).
IHC is clearly the method of choice for characterizing the cellular origin and the SSTR subtype expression in tumors (23,24). In normal human thyroid tissue, SSTR3 and 5 seem to be the predominant SSTR subtypes (18). However, Papotti et al. (25) did not detect SSTR expression in normal thyroid tissue by IHC. Moreover, clinical trials have shown that SSTR2-specific agonists such as octreotide have no or only little antiproliferative effect on thyroid carcinomas (26,27).
Therefore, the specificity and cellular origin of the SSRS findings in CNs, HNs, PCs, and GD are currently unclear and demonstrated partly only in case reports. Moreover, the current findings are difficult to understand in the context of the well-defined action of somatostatin on thyroid cell signaling. Therefore, we systematically evaluated SSTR2 expression in various neoplastic and nonneoplastic diseases of the thyroid by means of IHC.
Materials and Methods
Tissue specimens from 10 CNs (10 adenomatous nodules), 19 HNs, and 17 PCs and their surrounding normal tissues as well as from 8 patients undergoing surgery for GD (2 patients relapsing GD, 1 Graves' ophthalmopathy, 2 nonfunctional thyroid nodules, and 3 large goiters) were prospectively obtained during surgery at the Department of Pathology, University of Marmara Medical School in Istanbul, Turkey, during the period from March 2004 to October 2007. The patients' mean age was 56 years for PCs, 53 for HNs, 43 for CNs, and 42 for GD. All patients were preoperatively investigated by thyroid ultrasound, scintigraphy, and thyroid hormone levels. The PCs, HNs, and CNs were classified histologically according to World Health Organization (WHO) criteria. The study was approved by the ethics committee of the University of Marmara Medical School and all patients provided informed consent.
An HN was defined as a nodular region identified by ultrasound with increased uptake of technetium and clear suppression of the rest of the thyroid gland. A CN was defined as a thyroid nodule identified by thyroid ultrasound, which showed reduced technetium uptake compared with normal thyroid tissue. At the time of operation and with antithyroid drug treatment, 6 patients with HNs were euthyroid, 12 patients were subclinically hyperthyroid, and 1 patient was hyperthyroid. Thirteen of the 19 HNs were located in toxic multinodular goiters and the others were solitary nodules. According to WHO criteria, 1 HN was classified as follicular adenoma and 18 HNs were classified as adenomatous nodules. All 10 CNs were classified as adenomatous nodules.
Immunohistochemistry
The tissues were fixed in 4% formalin and embedded in paraffin. The sections were incubated in 1 mM levamisole-containing substrate solution to block endogenous peroxidase. The sections were then incubated with affinity-purified rabbit polyclonal antibody against SSTR2 (Bio Trend, Cologne, Germany) in a final dilution of 1:1000. The sections were heated at 124°C for 1 minute in 0.01 mol citrate buffer (pH 6) for improved target retrieval. They were then incubated overnight at 18°C. Staining of the primary antibody was performed using biotinylated goat anti-rabbit immunoglobulin G followed by incubation with antibody solution (ABC Elite; Vector Laboratories, Burlingame, CA).
Assessment of SSTR expression
For the semiquantitative determination of SSTR2 staining and for the semiquantitative determination of micro- and macrofollicles and dense epithelial cells/papillary tumor structures, 10 high-power fields (HPFs) systematically distributed along the largest diameter of the tissue section were examined at 400 × magnification. The total size of the observed tissue sections was measured. The total area of 10 HPFs at 400 × magnification was 1.96 mm2.
The area covered by thyroid epithelial cells was semiquantitatively determined for 10 HPFs as percentage of the total area evaluated (1.96 mm2) and was given in mm2 (Table 1). Moreover, the area (in mm2) of thyroid epithelial cells staining positive for SSTR2 expression was determined in the same 10 HPFs by semiquantitatively determining the percentage of all thyroid epithelial cells that stained positive for SSTR2. These results are thus reported as area (in mm2) of epithelial cells staining positive for SSTR2 (Table 2 and Fig. 1). To determine the SSTR2 staining density we divided the area of SSTR2 positively stained thyroid epithelial cells (in mm2) by the area of all thyroid epithelial cells (in mm2) (Fig. 2). The results are given as medians as the data were not normally distributed.

Area of thyroid epithelial cells staining positive for SSTR2 expression was determined semiquantitatively as the percentage of all thyroid epithelial cells that stained positive for SSTR2 in 10 HPFs (equivalent to 1.96 mm2) and expressed as median (in mm2). Significant differences were found between HN and CN (p < 0.008), CN and tissue surrounding CNs (p < 0.007), PC and tissue surrounding PCs (p < 0.002), CN and TS (p < 0.0001), and PC and TS (p < 0.007). All values including the outliers were considered for statistical analysis. A chi-square test was performed. Circles stand for mild outliers and stars stand for extreme outliers in boxplots. HN, hot thyroid nodule; TS of HN, tissue surrounding HN; CN, cold thyroid nodule; TS of CN, tissue surrounding CN; PC, papillary carcinoma; TS of PC, tissue surrounding papillary carcinoma; GD, Graves'disease; TS, tissue surrounding all groups; SSTR2, somatostatin receptor 2; HPFs, high-power fields.
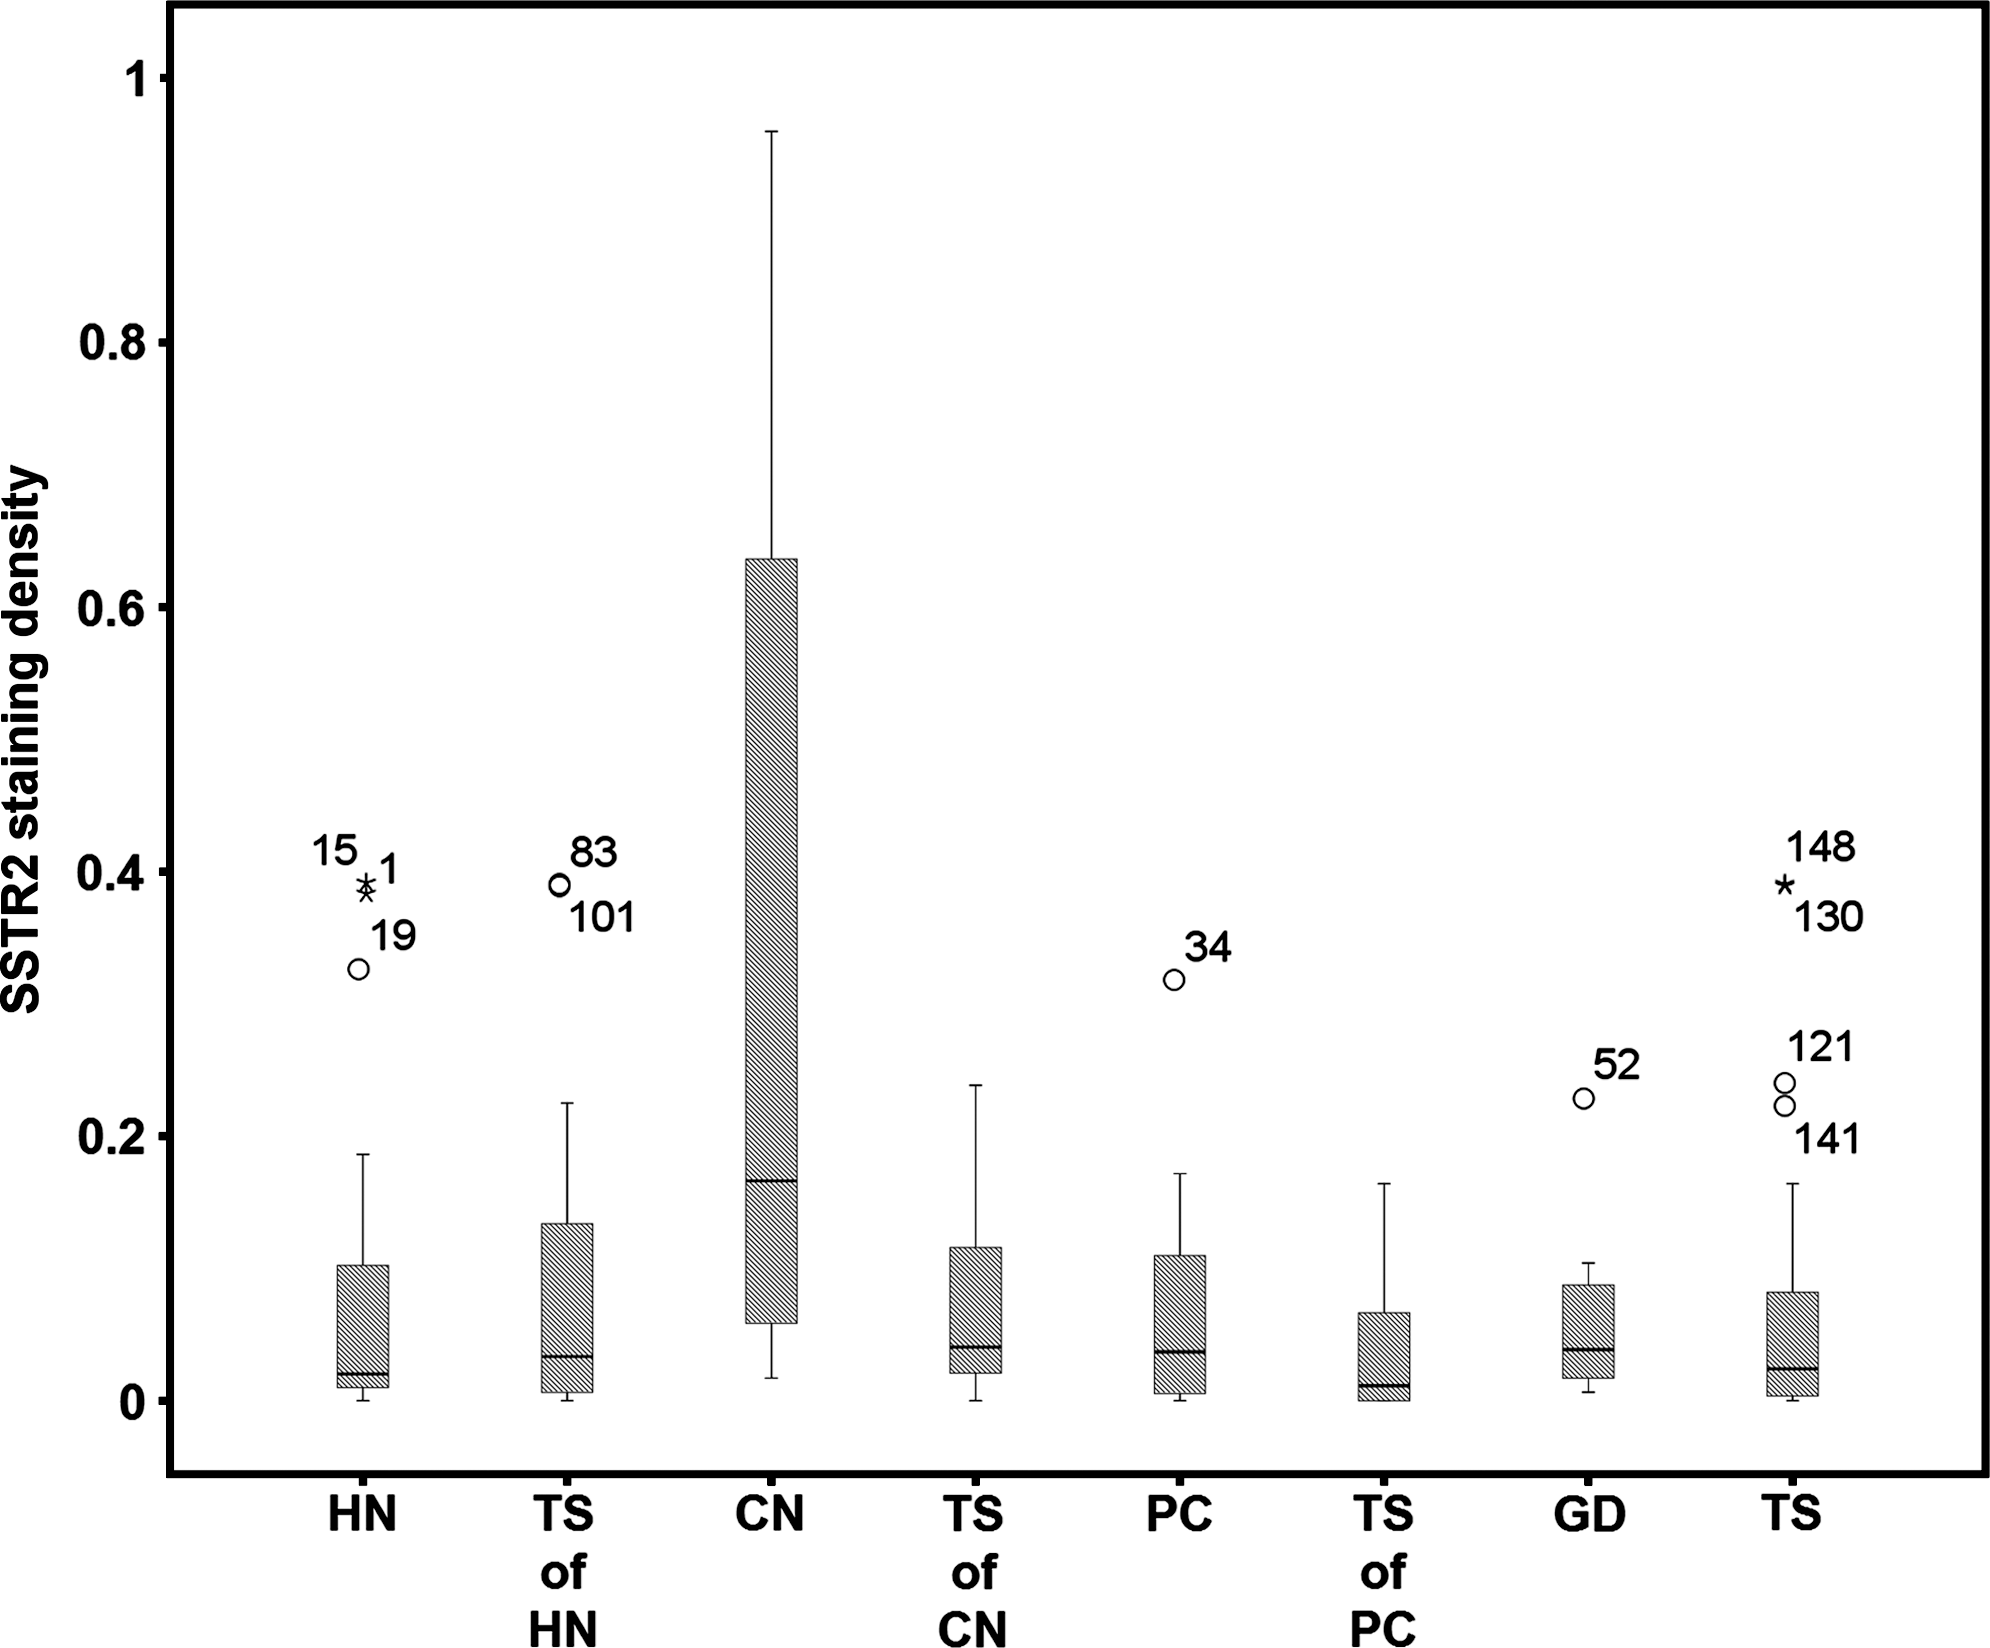
SSTR2 staining density determined by dividing the area (in mm2) of SSTR2 positively stained thyroid epithelial cells in 10 HPFs (equivalent to 1.96 mm2) by the area (in mm2) of all thyroid epithelial cells in 10 HPFs (equivalent to 1.96 mm2) and shown as median. Significant differences were found between HN and CN (p < 0.006) and CN and TS (p < 0.001); outliers are caused by cases with higher SSTR2 density. All values including the outliers were considered for statistical analysis; a chi-square test was performed. Circles stand for mild outliers and stars stand for extreme outliers in boxplots.
Significant: HN and PC (p < 0.0001); CN and PC (p < 0.002); PC and tissue surrounding PC (p < 0.0001); CN and TS (p < 0.003); PC and TS (p < 0.0001); GD and TS (p < 0.0001). Results are shown as median; a chi-square test was performed.
HN, hot nodule; TS of HN, tissue surrounding HN; CN, cold nodule; TS of CN, tissue surrounding CN; PC, papillary carcinoma; TS of PC, tissue surrounding PC; GD, Graves'disease; TS, tissue surrounding all groups.
SSTR2 expression was significantly different for HN and CN (p < 0.008); CN and TS of CN (p < 0.007); PC and TS of PC (p < 0.002); CN and TS (p < 0.0001); PC and TS (p < 0.007). Results are shown as median; chi-square test was performed.
SSTR2, somatostatin receptor 2.
For all 10 visual fields evaluated for the SSTR2 staining, the area covered by macrofollicles, microfollicles, or dense thyroid epithelial cells without apparent follicular lumen, and in the case of PC the papillary tumor structures, was determined semiquantitatively as a percentage value.
Statistical analysis was performed using the software package SPSS 15 (SPSS GmbH, Chicago, IL). Normal distribution was analyzed with the Kolmogorov–Smirnov test. Not normally distributed data are shown as median. Data were compared using the chi-square test with subsequent Mann–Whitney U test. Significance was assumed when p-value was below 0.05.
Results
There was a significant difference in the proportion of thyroid epithelial cells per 10 HPFs between PCs (1.5 mm2) and HNs (0.4 mm2), CNs (0.53 mm2), tissue surrounding PCs (0.3 mm2), and tissue surrounding all tumors (0.3 mm2) (Table 1). The percentage of macrofollicles was similar in HNs and CNs (Fig. 3). Ten of the 18 PCs showed no lymphocytic infiltration. Five PCs showed lymphocytic infiltration of the tumor margins, and three PCs had a capsule separating them from the surrounding, lymphocytic infiltration.

Classification of the follicle structure: PC is significantly different (p < 0.0001) from all other types of tumors and the surrounding tissues. Results are shown as median; a chi-square test was performed.
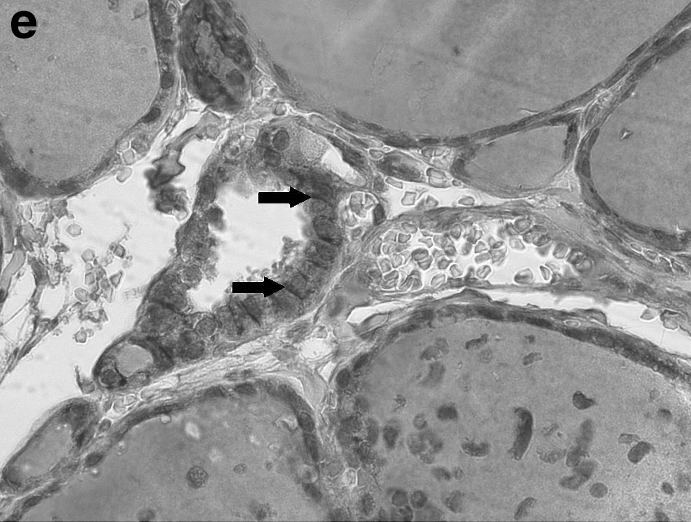
Figure 4a–e shows representative examples of SSTR2 cytoplasmic membrane positively stained cells in HNs, CNs, PCs, GD, and surrounding tissue.
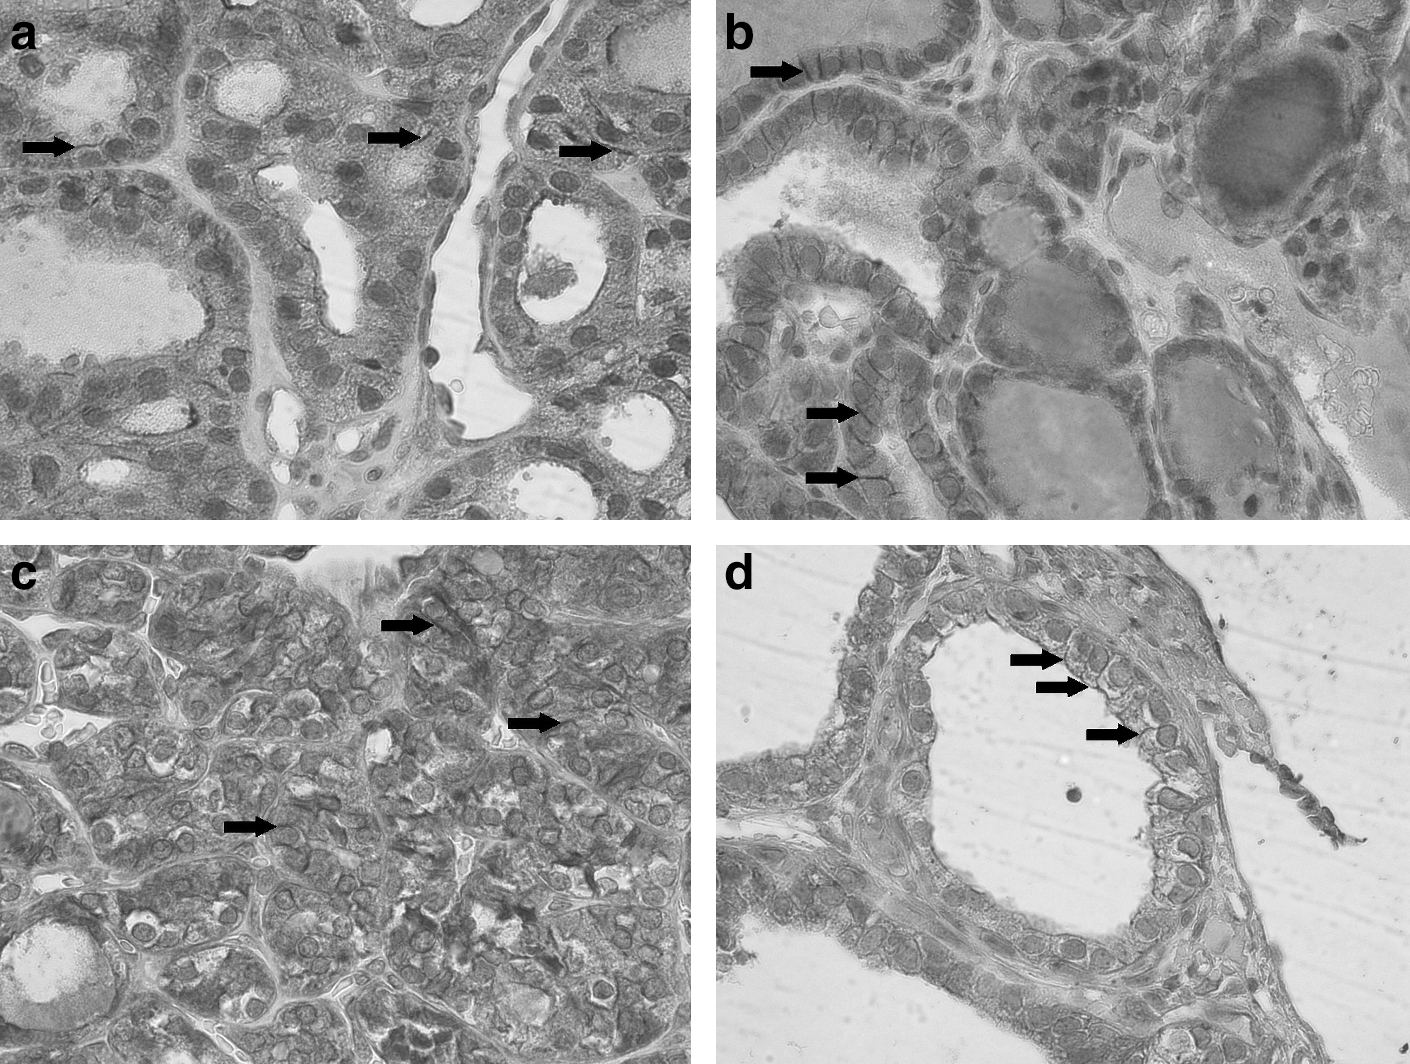
Representative examples of SSTR2-positive cells and/or positively stained cytoplasmic membrane (arrow) in (
SSTR2 expression was inhomogeneous in thyroid disease, with the highest density detected in CNs. Nonneoplastic thyroid cells, PCs, HNs, and CNs express SSTR2. There were significant differences for the area of thyroid epithelial cells staining positive for SSTR2 expression between CNs (0.2 mm2) and HNs (0.02 mm2), between tissues surrounding CNs (0.01 mm2) and surrounding tissues of all tumors (0.008 mm2), as well as between PCs (0.06 mm2) and the surrounding tissues (0.004 mm2) (Table 2 and Fig. 1). The SSTR2 staining density was significantly higher for CNs (0.1662) than for HNs (0.0204) or for PCs (0.0369) when compared with surrounding tissues (0.0242) and the highest density was observed in CNs (Fig. 2).
Discussion
Our study shows that SSTR2 can be demonstrated immunohistochemically in normal, hyperplastic, and neoplastic thyroid cells. Moreover, the findings reveal that SSTR2 expression is highest in CNs, when compared with HNs, PCs, and GD. Considering the high SSTR2 density in CNs and their high prevalence, these findings could be of relevance for the diagnosis, if not accessible by fine-needle aspiration biopsy or in the case of localization of radioiodine-negative thyroid cancer (7,28).
SSTRs have been demonstrated in the thyroid. This has been concluded from studies using SSTR autoradiography (21), IHC, RT-PCR (20), and radiolabeled octreotide (2,17,29). Our results in the normal thyroid tissue surrounding PCs, HNs, and CNs confirm this finding but are in disagreement with one report that was unable to localize SSTR2 in normal thyroid tissue (25). Moreover, goiters have been reported with increased 111In-octreotide (and Ga-68 DOTATAOC) uptake among patients who underwent 111In-octreotide scintigraphy for other diseases (5,12,13,15). These results are in line with our detection of SSTR2 by IHC in the tissues surrounding HNs and CNs because HNs and CNs often occur in goiters. Therefore, SSRS will detect CNs but also HNs and nodular goiters or PCs. We found discrete membrane staining for SSTR in a small percentage of follicular cells. Cells exhibiting only cytoplasmic staining were not considered positive, because primarily cytoplasmic SSTR2 staining (20) should be interpreted with caution, as STTRs constitute integral membrane glycoproteins. Binding studies with thyroid epithelial cell primary cultures of the respective tissues, like those that have been performed with cell lines (30), could help to further elucidate this issue. However, it is well known that primary cell cultures can lead to cell selection and different behavior when compared with tissues.
SSRS has been found to be positive in GD, PCs, HNs, and CNs (8,12,14 –16,31,32). In GD, these findings have been related to immune cells. However, our results demonstrate that in addition to the immunocompetent cells, SSTR2 expression is also found in thyroid epithelial cells in GD.
In PCs, HNs, and CNs, SSRS has been found to be positive (8,12,14 –16,31,32), suggesting the presence of SSTRs on follicular cells in these thyroid lesions (33 –36). Our study demonstrates that SSTR2 is expressed in these lesions and that the highest density of SSTR2 expression is seen in CNs. This finding is in line with the much higher tumor-to-blood ratio for 111In-DTPA-D-Phe1octreotide in follicular adenomas than in PCs (1), and two case reports have described SSTR2 visualization in three CNs by SSRS (15,16). Further, reports of positive SSRS of HNs (12,13) do support our positive IHC results for HNs. The lower density of SSTR2-positive thyroid epithelial cells for HNs compared with CNs may be related to the lower proliferation index of HNs than CNs (37,38). A further reason for the higher SSTR density in CNs than in HNs could be the partially dedifferentiated phenotype of CNs demonstrated by their decreased thyroid hormone synthesis and the alterations in signaling cascades that favor proliferation, but not differentiation (39). Further, it remains to be determined whether the lower intranodular iodine content in CNs compared with HNs (40) could be a cause for the higher SSTR expression in CNs compared with HNs.
Ligand binding to SSTRs has been demonstrated in the membranes of human PC cell lines (30). SSTR2 subtype expression has been repeatedly found by RT-PCR in PCs (18 –20). Moreover, SSTR2 expression has also been detected by RNAse protection assay, which was found to be associated with a high tumor-to-blood ratio for 111In-DTPA-D-Phe1octreotide in PC (1). However, the failure of northern blot to detect SSTR2 in the same study could also suggest 111In-DTPA-D-Phe1octreotide binding to other SSTR subtypes. Our immunohistochemical detection of SSTR2 expression in PCs (Fig. 1 and Table 2) is in line with the positive findings and further defines the cellular basis of the repeated positive SSRS reports for PCs (1,3,6,8). In addition to the clear localization of the positive SSTR2 IHC on thyroid epithelial cells in PCs, only 5 of the 18 PCs showed histologic signs of lymphocytic infiltration of the tumor. This further emphasises that the predominant reason for the positive SSRS of PCs can be attributed to SSTR2 expression by thyroid epithelial cells.
In summary, nonneoplastic thyroid cells express SSTR2. PCs, HNs, and CNs also express SSTR2 in their epithelial component, the highest density being found in CNs. It remains to be determined whether this finding could be of therapeutic relevance despite the negative findings in four patients with papillary or mixed papillary/follicular cancer (27). The high SSTR2 density in CNs has to be considered when using SSRS for the localization of radioiodine-negative thyroid cancer because DOTATOC (dotreotid (DOTA (o)-Phe1-Tyr(3)) octreotide) has a predominat affinity for SSTR2 and a much lower affinity for SSTR3 and 5 (41).
Footnotes
Disclosure Statement
The authors hereby disclose any commercial association that might create a conflict of interest in connection with the submitted manuscript. They do not have a financial or other relationship that might lead to a conflict of interest. This research did not receive any specific grant from any funding agency in the public, commercial, or not-for-profit sector.