
Abstract
Background:
99mTc pertechnetate is a well-known anion, used for clinical imaging of thyroid function. This gamma emitter is transported by the sodium iodide symporter but is not incorporated into thyroglobulin. Scintigraphy using 99mTc pertechnetate or 123iodide represents a powerful tool for the study of sodium iodide symporter activity in different organs of living animal models. However, in many studies that have been performed in mice, the thyroid could not be distinguished from the salivary glands. In this work, we have evaluated the use of a clinically dedicated single-photon emission computed tomography (SPECT) camera for thyroid imaging and assessed what improvements are necessary for the development of this technique.
Methods:
SPECT of the mouse neck region, with pinhole collimation and geometric calibration, was used for the individual measurement of 99mTc pertechnetate uptake in the thyroid and the salivary glands. Uptake in the stomach was studied by planar whole-body imaging. Uptake kinetics and biodistribution studies were performed by sequential imaging.
Results:
This work has shown that thyroid imaging in living mice can be performed with a SPECT camera originally built for clinical use. Our experiments indicate that 99mTc pertechnetate uptake is faster in the thyroid than in the salivary glands and the stomach. The decrease in 99mTc pertechnetate uptake after injection of iodide or perchlorate as competitive inhibitors was also studied. The resulting rate decreases were faster in the thyroid than in the salivary glands or the stomach.
Conclusions:
We have shown that a clinically dedicated SPECT camera can be used for thyroid imaging. In our experiments, SPECT imaging allowed the analysis of 99mTc pertechnetate accumulation in individual organs and revealed differences in uptake kinetics.
Introduction
NIS is not only found in the thyroid but is also expressed in the stomach and the salivary glands (2), where it mediates iodide accumulation. This process may be part of the host defense to microbe-containing food contaminants.
During the period 1940–1960, radioactive iodide was used in animal experiments (mostly rats) and proved to be useful for the understanding of thyroid function and regulation. Subsequently, thyrocyte regulation was studied in in vitro experiments on primary cultures and cell lines derived from thyroid cells. However, animal experiments are still required for a better knowledge of thyroid function and regulation. This is of particular interest since the development of genetically modified mice, which represent powerful tools for such investigations.
For several decades, thyroid scintigraphy has been a well-established technique for the diagnosis of thyroid pathologies, but it has not been often used in animal experiments. Radioactive 123iodide or 131iodide is used in recording the uptake of free iodide and incorporated iodine. Several gamma emitters are substrates of NIS and are actively accumulated in the thyroid. One of these, 99mTc pertechnetate (99mTcO4), is transported by NIS but it is not incorporated into thyroglobulin (TG) and, therefore, allows the specific study of uptake capacity.
For mouse imaging, resolution is an important issue, to distinguish the different organs that are capable of iodide accumulation. Some of these organs are very small. For example, the size of a mouse thyroid lobe is approximately 1 mm × 0.3 mm. In addition, organs that accumulate radioactive 99mTc pertechnetate can be very close to each other, that is, the salivary glands and the thyroid. Consequently, radioactive 99mTc pertechnetate uptake into these two organs may be superimposed in the same image. It is therefore mandatory to use tomography (single-photon emission computed tomography [SPECT]) with improved spatial resolution.
Large rotating clinical cameras are a low-cost alternative to dedicated microSPECT systems for small animal imaging. However, these large rotating cameras are subject to mechanical irregularities, which may have deleterious effects on spatial resolution because of the magnifying effect of pinhole collimation. Earlier work using pinhole SPECT for small animal imaging was based on simple calibration methods that only estimated a few parameters, such as the center of rotation, the focal length, and the radius of rotation (3). More accurate calibration techniques have been developed and submillimetric spatial resolution has been reported by several groups using different types of single and multiple pinhole collimators (4,5) and slit-slat collimators (6).
A new calibration method has been proposed recently (7). This method refines an initial parametric calibration (8,9) by applying to each position of the camera a rigid body transformation that is determined to improve the fit between the measured and the calculated projections of the calibration sources. A stable estimate of this transformation can be obtained with only three calibration sources by linearizing the equations around the position estimated by the initial parametric calibration.
In this study, this new method was used for imaging the thyroid in mice using 99mTc pertechnetate. We analyzed the spatial distribution of 99mTc pertechnetate uptake and its dynamics in the thyroid, the salivary glands, and the stomach. We also studied 99mTc pertechnetate discharge following excess administration of perchlorate and iodide.
Methods
Animals and study protocol
Male, wild-type mice (C57 BL6/6J) were purchased from Charles River (L'arbresle, France). At the time of the experiments, the mice were between 6 and 8 weeks old (25–30 g). Animals were fed a standard diet. The study protocol was approved by the Committee for Animal Studies and the National Institutes of Health Principles of Animal Laboratory Care (NIH publication 86–23, revised 1995).
About 250–300 MBq of 99mTc pertechnetate (99mTcO4) was injected intraperitoneally. After 10 minutes, animals were anesthetized and kept asleep during the complete imaging protocol using isoflurane gas (1.5 vol% in air). Pinhole SPECT imaging of the neck (nSPECT) began 20 minutes after 99mTcO4 injection (nSPECT 1, Fig. 1) and was followed by whole-body planar imaging (wbPLANAR). Animals were then injected intraperitoneally with sodium chloride (2 mg NaCl), sodium perchlorate (2 mg NaClO4), or sodium iodide (2 mg NaI). Three animals were used for each experimental condition. Pinhole SPECT of the neck followed by wbPLANAR was repeated 10 minutes (nSPECT 2, wbPLANAR 2) and 40 minutes later (nSPECT 3, wbPLANAR 3).
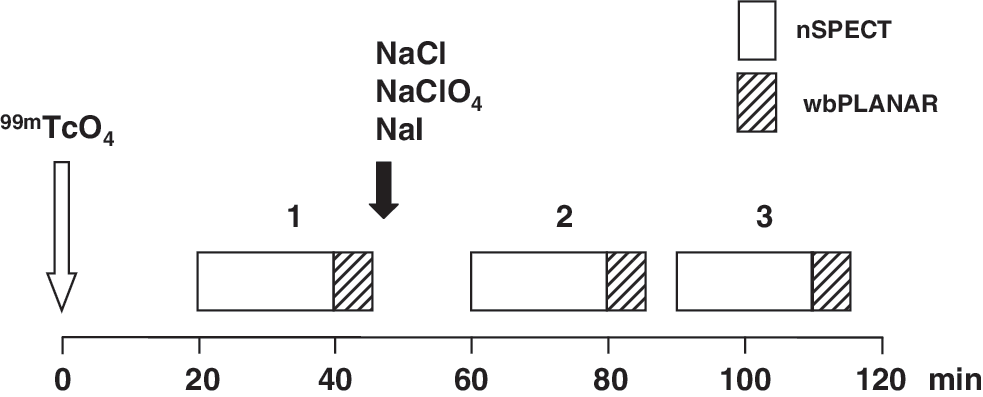
Study protocol. After 99mTc pertechnetate injection, neck single-photon emission computed tomography imaging (nSPECT) followed by whole-body planar imaging (wbPLANAR) were performed three times. Animals were then injected intraperitoneally with sodium chloride (NaCl), sodium perchlorate (NaClO4), or sodium iodide (NaI), immediately after the first total body planar imaging.
Neck SPECT imaging
SPECT projection images of the mouse neck were obtained using a large field-of-view rotating gamma camera (Sopha DSX; Sopha Medical System, General Electric, Buc, France) equipped with a pinhole collimator with a 1 mm aperture. The acquisition parameters were 64 projections over 360°, circular orbit, and a 21 mm radius of rotation. The photopeak window was set at 126–154 keV. Data were collected in 128 × 128 pixel matrix with an acquisition zoom 2 × , resulting in a 2.26 mm detector pixel size. The total acquisition time was 20 minutes (15 seconds for each projection).
The tomographic images were reconstructed by an iterative reconstruction algorithm based on the ordered subset expectation maximization scheme using three iterations in combination with eight subsets. The reconstruction algorithm incorporated (i) the pinhole geometry, (ii) the collimator response and (iii) the angular variation of the detector sensitivity (10).
The pinhole geometry was determined using the calibration method presented by Beque et al. (8,9) and recently refined by Defrise et al. (7). The technique first acquired circular orbit projection data of a three-point source phantom, which forms a triangle with known dimensions. The phantom was composed of three cylindrical holes, filled with 100 μCi/μL 99mTc pertechnetate, of 1 mm diameter and 1 mm depth, drilled into a 4-mm-thick plexiglas plaque. The locations of the three sources on each projection image were then determined using simple segmentation techniques. The focal length of the pinhole collimator, the radius of rotation, the mechanical and electronic shifts, as well as the tilt and the twist of the detector were then determined for each projection by fitting iteratively the analytically calculated locations to the measured locations (8,9). The fit was further refined by applying a rigid body transformation to each position of the camera, as recently proposed by Defrise et al. (7). The collimator response was corrected using a multiray method (11), which models the finite dimension of the pinhole opening by calculating each data sample as the average of seven rays in the forward and backward projector of the reconstruction algorithm. The angular variation of the sensitivity due to the pinhole collimator was corrected by acquiring a 99mTc pertechnetate flood source, which was positioned directly on the pinhole collimator surface. The measured sensitivity map was incorporated into the reconstruction process. There was no correction for partial volume, scatter, or attenuation.
The reconstructed data were stored in a 0.2-mm pixel-size matrix and postfiltered with a three-dimensional (3D) Gauss filter with a full-width at half maximum of 0.4 mm. Postreconstruction spatial resolution measured on the Ultra-Micro Hot Spot Phantom (Data Spectrum Corporation, Chapel Hill, NC) using these acquisition and processing parameters was 1 mm.
wbPLANAR
Planar whole-body images of the mice in the anterior view were obtained with the pinhole opening located 10 cm from the body surface. Data were recorded during 300 seconds into a 128 × 128 matrix with 2.26 mm pixel size and corrected for the angular variation of the sensitivity of the detector using the measured sensitivity map described earlier.
Image analysis
SPECT image viewing and quantification were performed using AMIDE software (A Medical Image Data Examiner) (12). Images of the three SPECT studies obtained for each animal were analyzed side by side. 3D regions of interest (ROIs) were automatically drawn around the thyroid and the salivary glands of the first SPECT (nSPECT 1) by thresholding the image of each organ at 25% of the maximum pixel value in each organ. These ROIs were then used to measure 99mTc pertechnetate uptake in the thyroid and the salivary glands on the three nSPECT acquisitions, respectively. Uptake was calculated as counts in the tissue divided by the injected activity after decay correction. A pinhole SPECT acquisition of a 2-mL syringe containing 37 MBq/mL of 99mTc pertechnetate was performed as a reference for the conversion of injected activity into measured counts in the image.
The planar, whole-body image was used to quantify the uptake of 99mTc pertechnetate in the stomach. A ROI was drawn on the stomach using a threshold of 25% of the maximal activity. For each of the three acquisitions, counts in the stomach were normalized to the total body activity measured on the first acquisition (wbPLANAR 1) after decay correction.
Statistical analysis
Results are presented as mean ± standard error of the mean. A two-tail paired t-test was used to determine the significance of changes in 99mTc pertechnetate uptake in organs.
Results
Spatial distribution of 99mTc pertechnetate uptake in living mice
According to our study protocol (Fig. 1), whole-body images of mice in the anterior view were first obtained 40–45 minutes (5 minutes acquisition) after intraperitoneal injection of 99mTc pertechnetate (Fig. 2A). Activities were predominantly located in the stomach, the bladder, and the neck region, but in these whole-body planar images the thyroid could not be clearly distinguished from the large salivary glands. Resolution of the thyroid in planar imaging was significantly improved if the pinhole was positioned as close as possible to the thyroid. This can be illustrated by the first projection image (15 seconds/acquisition) of each SPECT acquisition, which corresponds to anterior views (Fig. 2B–D). The thyroid was then clearly observed with the acquisition that was performed almost immediately after 99mTc pertechnetate injection (20 minutes). The distinction between the thyroid and the salivary glands decreased progressively with time (nSPECT 1–3), because of increased accumulation in the salivary glands (compare Fig. 2B, C, and D). This effect was more important with whole-body images (wbPLANAR 1–3) (data not illustrated; only wbPLANAR 1 is shown in Fig. 2A).
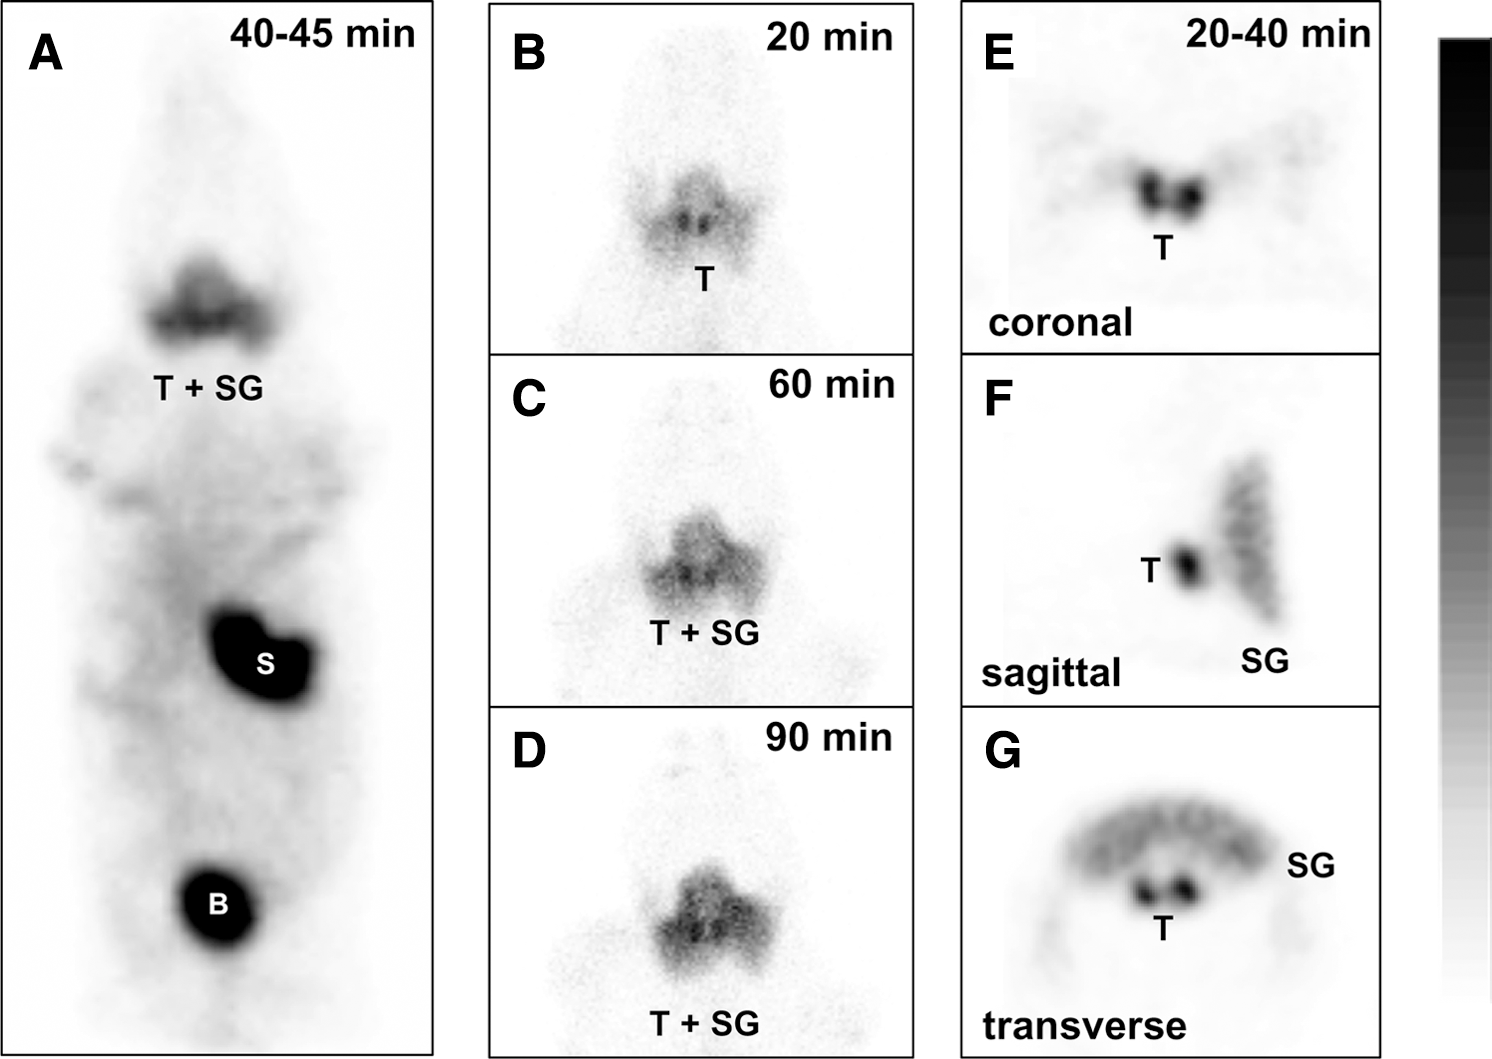
Left panel: Whole body imaging (
In contrast, using tomographic images of the neck (nSPECT), easier distinction of the thyroid from the salivary glands was expected, especially using our refined calibration method. The two thyroid lobes were clearly visualized in coronal (Fig. 2E), sagittal (Fig. 2F), and transverse (Fig. 2G) slices from nSPECT 1 (20–40 minutes).
Dynamics of 99mTc pertechnetate uptake
From each nSPECT image, 3D ROIs were drawn around the thyroid and the salivary glands and 99mTcO4 uptake was calculated for each organ. The 99mTc pertechnetate uptake in the thyroid averaged 1.87% ± 0.67% of the initial dose (% ID) 20–40 minutes after 99mTc pertechnetate injection (nSPECT 1), 1.97% ± 0.74% ID 60–80 minutes after 99mTc pertechnetate injection (nSPECT 2), and 1.86% ± 0.75% ID 90–110 minutes after 99mTc pertechnetate injection (nSPECT 3) (Fig. 3A). This result indicates that 99mTcO4 uptake in the thyroid quickly reaches a maximal value. As illustrated in Figure 3B, where the values are expressed as a percentage of the final 99mTc pertechnetate uptake, no increase was observed between nSPECT 1 and nSPECT 2 or 3 (Fig. 3B).
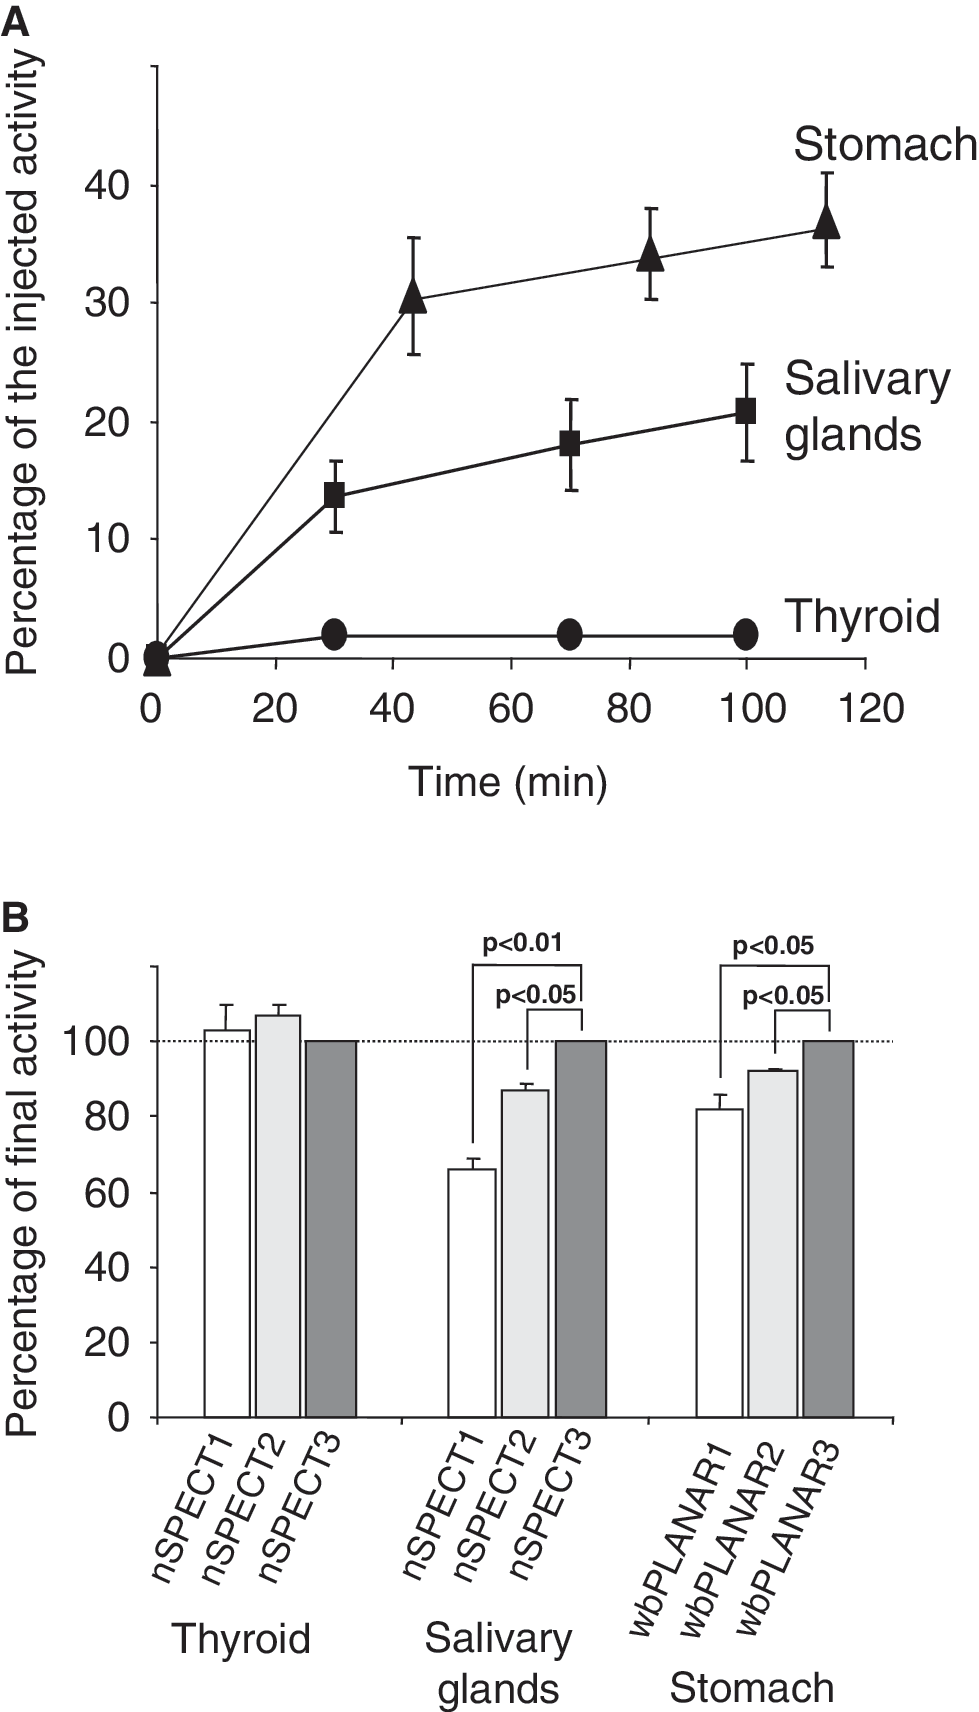
Comparison of 99mTc pertechnetate uptake dynamics in the thyroid, the salivary glands, and the stomach. The values were calculated from nSPECT (for the thyroid and the salivary glands) or whole-body imaging (for the stomach). The values are shown as a percentage of the injected activity (
In contrast, 99mTc pertechnetate uptake in the salivary glands increased slightly, but significantly (p < 0.05), from 13.65% ± 5.1% ID 20–40 minutes after 99mTc pertechnetate injection (nSPECT 1) to 18% ± 6.5% ID 60–80 minutes after 99mTc pertechnetate injection (nSPECT 2) and further increased to 20.8% ± 7.3% ID 90–110 minutes after 99mTc pertechnetate injection (nSPECT 3) (Fig. 3). These results indicate that the maximal value in 99mTc pertechnetate uptake is attained more gradually in the salivary glands (Fig. 3B).
The uptake of 99mTc pertechnetate in the stomach, measured on the whole-body planar images obtained immediately after SPECT imaging, averaged 30.6% ± 8.5% ID 45–50 minutes after 99mTc pertechnetate injection (wbPLANAR 1). Activity increased to 34% ± 6.6% ID 80–85 minutes after 99mTc pertechnetate injection (wbPLANAR 2) and to 37% ± 7% ID 110–115 minutes after 99mTc pertechnetate injection (wbPLANAR 3) (p < 0.05, Fig. 3). This indicates that 99mTc pertechnetate uptake is slower in the stomach than in the thyroid.
Effect of sodium perchlorate and sodium iodide on 99mTc pertechnetate uptake in the thyroid, the salivary glands, and the stomach
We also analyzed the effects of competitive inhibitors on 99mTc pertechnetate uptake. Two inhibitors were used—perchlorate (ClO4 −) and iodide (I−)—which are both NIS substrates and are known to block 99mTc pertechnetate uptake. As illustrated in Figure 4, a rapid inhibition of 99mTc pertechnetate uptake in the thyroid and, to a lesser extent, in the salivary glands was observed in nSPECT 2 and 3. For the thyroid, 99mTc pertechnetate uptake decreased from the value obtained in nSPECT 1 (20–40 minutes) (set to 100%) to 35% ± 12% (nSPECT 2, 60–80 minutes) and 22% ± 9% (nSPECT 3, 90–110 minutes) after NaClO4 injection or to 31% ± 7% (nSPECT 2, 60–80 minutes) and 21% ± 5% (nSPECT 3, 90–110 minutes) after NaI injection (Fig. 5, upper panel). For the salivary glands, 99mTc pertechnetate uptake decreased from the value obtained in nSPECT 1 (20–40 minutes) (set to 100%) to 64% ± 8% (nSPECT 2, 60–80 minutes) and 45% ± 8% (nSPECT 3, 90–110 minutes) after NaClO4 injection or to 89% ± 4% (nSPECT 2, 60–80 minutes) and 75% ± 4% (nSPECT 3, 90–110 minutes) after NaI injection (Fig. 5, middle panel). The reason for the discrepancy between NaClO4 and NaI is unknown. For the stomach, 99mTc pertechnetate uptake decreased from the value obtained in wbPLANAR 1 (40–45 minutes) (set to 100%) to 73% ± 10% (wbPLANAR 2, 80–85 minutes) and 61% ± 13% (wbPLANAR 3, 110–115 minutes) after NaClO4 injection or to 77% ± 11% (wbPLANAR 2, 80–85 minutes) and 70% ± 16% (wbPLANAR 3, 110–115 minutes) after NaI injection (Fig. 5, lower panel).
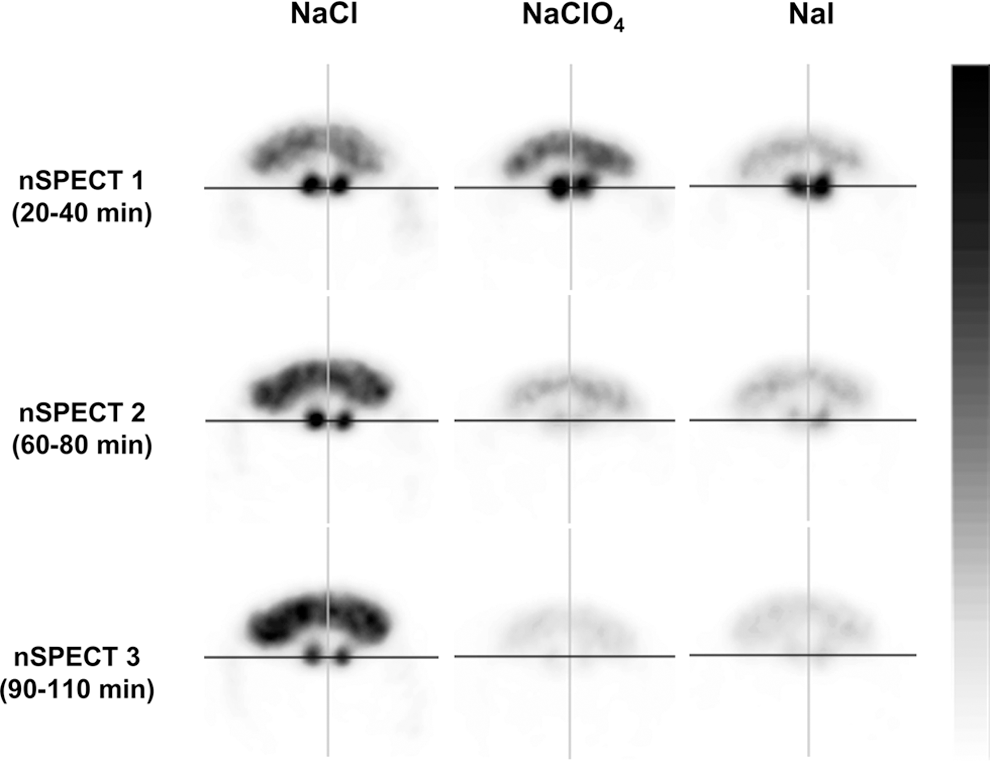
Effect of NaClO4 or NaI on the uptake of 99mTc pertechnetate in the thyroid and the salivary glands. Transverse slices of the thyroid and the salivary glands are shown before (nSPECT 1) and after (nSPECT 2 and nSPECT 3) injection of NaClO4 or NaI. NaCl was used as the control (left slices). The images were calibrated to the maximal value in the thyroid at baseline, before injections (nSPECT 1).
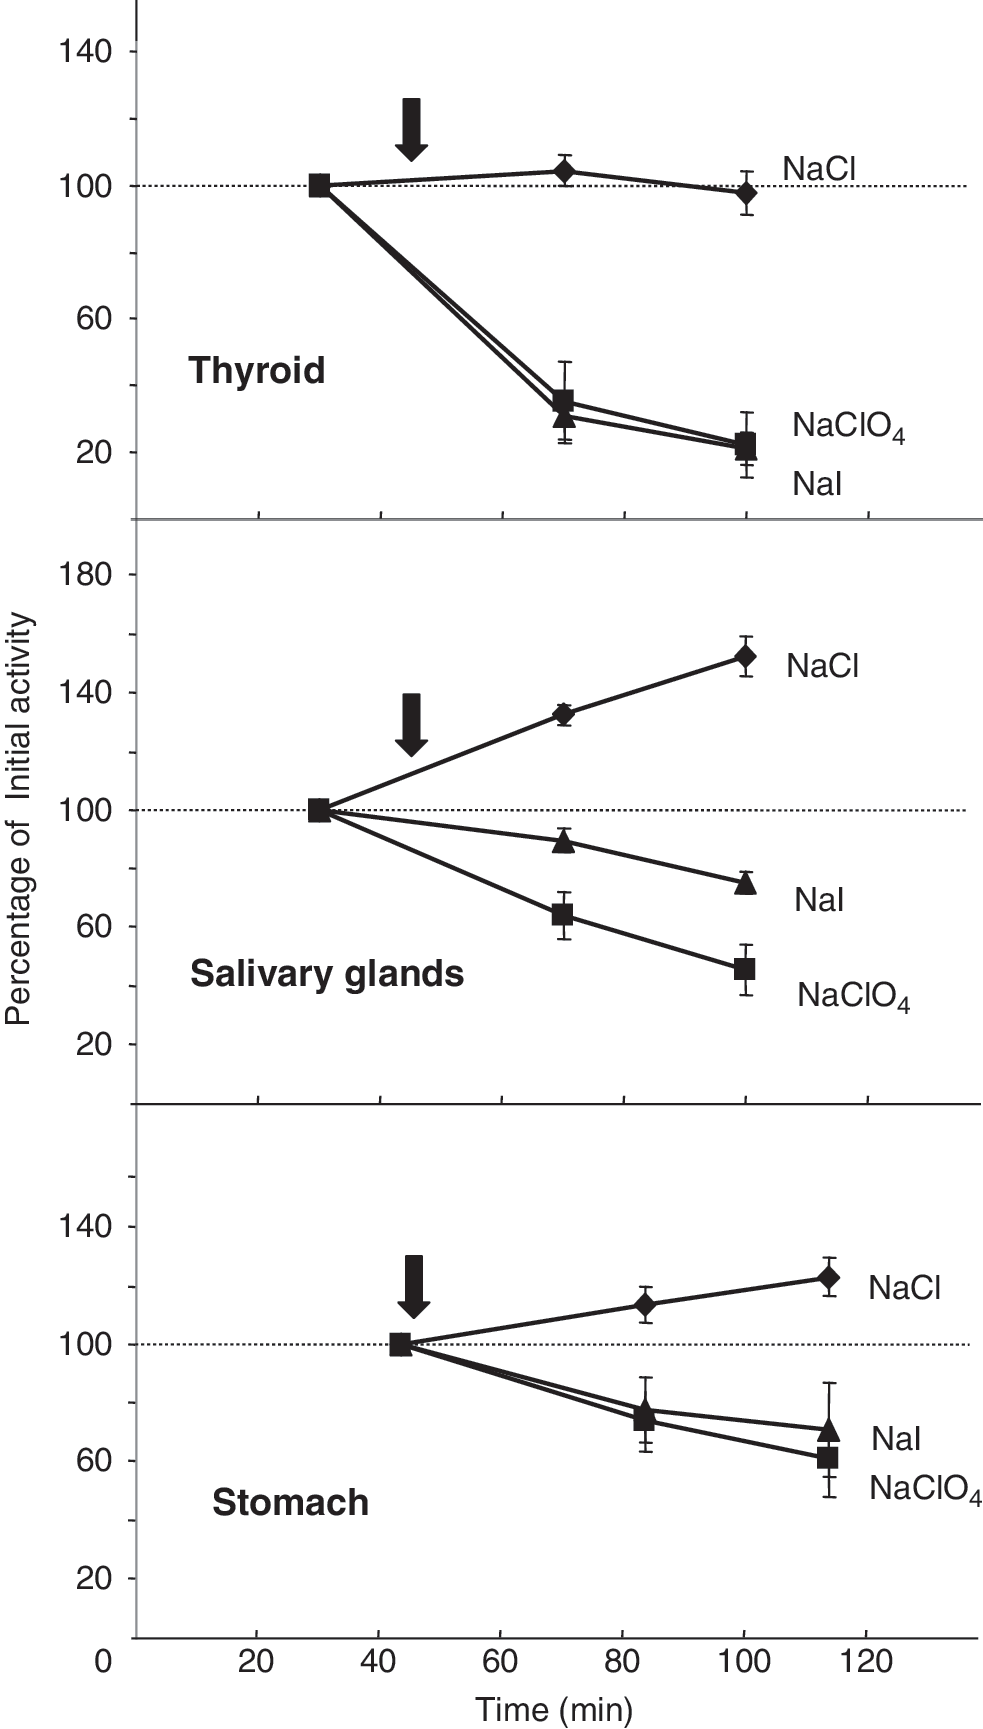
Comparison of the effect of NaClO4 or NaI on 99mTc pertechnetate uptake in the thyroid, the salivary glands, and the stomach. The values were calculated from SPECT (for the thyroid and the salivary glands) or whole-body imaging (for the stomach). The values are shown as a percentage of the initial activity accumulated in each organ, calculated from nSPECT 1 or wbPLANAR 1. The time of each measurement corresponds to the middle of the acquisition. The black arrows correspond to NaClO4, NaI, or NaCl injections. Each value was calculated from three independent experiments.
Discussion
Our study indicates that NIS activity in different mouse organs can be studied in vivo using SPECT imaging and 99mTc pertechnetate. Tomography was required to distinguish between 99mTc pertechnetate uptake in the thyroid and its uptake in the salivary glands. 3D visualization, at high resolution, of the thyroid was obtained with a SPECT camera originally dedicated to clinical applications. One millimeter spatial resolution was achieved with a custom-made pinhole collimator after geometric calibration of the camera. 99mTc pertechnetate uptake into the thyroid, the salivary glands, and the stomach of mice was analyzed. We found that 99mTc pertechnetate accumulation was slower in the salivary glands and the stomach compared with the thyroid. We also found that 99mTc pertechnetate efflux after iodide or perchlorate injection was slower in the salivary glands and the stomach compared with the thyroid. As the masses of the salivary gland and the stomach are larger than the mass of the thyroid, the percentages of the injected dose that accumulated are higher.
As has been well established in both humans and mice, three main tissue types accumulate 99mTc pertechnetate: the thyroid, the stomach, and the salivary glands. High NIS gene expression levels have been detected in these three organs (13,14), and this has been corroborated with immunohistochemical analyses (2,15). With respect to 99mTc pertechnetate uptake, it is important to point out that, besides NIS expression, tissue organization may play an important role. In the thyroid, the stomach, and the salivary glands, high NIS expression levels were found in epithelial cell-delimiting compartments: thyroid colloid, gastric lumen, and salivary acini and duct lumens, respectively. Consequently, 99mTc pertechnetate uptake in these organs is not only related to the radiotracer accumulation in NIS-expressing cells but also to the radiotracer accumulation into the corresponding compartments. We assume that the slower uptake and efflux rates in the salivary gland and the stomach are linked to compartments that are proportionally larger. These differences in the kinetics are independent of the mass of the tissue. If we compare the percentage of the injected dose in each organ, this is related to the mass of the organ, but also to several other parameters, such as (i) the capacity of the NIS-expressing cells to mediate an iodide accumulation that results from dissimilar NIS expression in the tissues; (ii) the diffusion of accumulated iodide into intraorgan compartments (e.g., much larger in the stomach than in the thyroid); (iii) the passive diffusion of the iodide through the epithelia delimiting the compartments; (iv) the intake and output of the compartment (e.g., salivary secretion).
As shown in this work, our SPECT imaging procedure can distinguish between 99mTc pertechnetate uptake in the thyroid and the salivary glands. Many reports have described scintigraphic analyses of radioactive NIS substrates (123iodide, 125iodide, or 131iodide, 99mTc pertechnetate, 211astatine, or 188Re perrhenate) in rodents. Most of these experiments were performed with a nontomographic gamma camera. Zuckier et al. reported an interesting and detailed ex vivo kinetic analysis of the tissue distribution of 123iodide, 99mTc pertechnetate, and 188Re perrhenate by directly counting the accumulated radioactivity after organ removal (16). This analysis clearly showed the uptake activity of the salivary glands. These authors also studied the tissue distribution of the isotopes using in vivo imaging. It seems that the radiotracer detected in the neck region was attributed to thyroid uptake without considering the salivary glands. In other studies that did not focus on thyroid uptake, the authors have also considered radioactive accumulation in the mouse neck region to correspond to thyroid uptake [see examples with 99mTc pertechnetate (17) or 211astatine (18)].
In other studies, the salivary glands were not correctly localized on the in vivo gamma images. Isotope accumulation in the region of the animal's muzzle was related to the salivary glands (19,20). Using SPECT imaging, Cho et al. showed that signals obtained in this region could rather be attributed to isotope accumulation in the nasal mucosa (21).
This problem does not occur in rats because rat salivary glands do not accumulate iodide (22) and probably do not express NIS. Consequently, radioactive NIS substrate uptake in the rat neck region can be associated exclusively with thyroid uptake [see example in (23,24)].
Our data demonstrate that the kinetics of 99mTc pertechnetate uptake into the salivary glands and the stomach are slower than those of uptake into the thyroid. This difference could result from a higher transport activity of the thyroid compared with these two other tissues. In addition, the ratio between the number of NIS-expressing cells and the volume of the apical compartment differs between these organs. The fundamental functioning unit of the thyroid is the colloid-containing follicle. Colloid volume is much smaller than the gastric lumen and, therefore, should be more rapidly filled with isotope, although the bordering epithelial cells may show a similar transport activity. As mentioned earlier, 99mTc pertechnetate uptake into the salivary glands is also relatively slower. In this tissue, only duct cells express NIS, and after uptake, the isotope then spreads first into the ducts and finally into the acini and the tubule system before the maximal, steady-state level of organ uptake is reached.
We also observed that the decrease in 99mTc pertechnetate uptake is faster in the thyroid than in the salivary glands or the stomach after injection of an excess of iodide or perchlorate. Both anions are competitive inhibitors of NIS and will block the active, NIS-mediated isotope accumulation. Differences in the kinetics of the decrease of the 99mTc pertechnetate uptake of these organs should result from differences in the isotope efflux rates, and again, the basic structure of each organ may play an important role. As expected, the passive efflux of 99mTc pertechnetate from the large gastric lumen is much slower than that from the thyroid's small follicles.
To compare this work with other in vivo imaging studies using radioactive iodide, it is important to take into account that radioactive iodide, in contrast with other NIS substrates, can be oxidized and bound to proteins and lipids. This incorporation of iodide into organic molecules is especially active in the thyroid, where it is a key process in hormone production. During this process, which takes place in the colloid, iodide is rapidly bound to the hormone precursor, thyroglobulin. Consequently, the quantity of accumulated iodide is not only correlated to its uptake equilibrium but rapidly corresponds to the amount of iodide that has been bound to thyroglobulin. Thus, in the thyroid, the kinetics of accumulated radioactivity will be different for 99mTc pertechnetate and 123iodine. Although organification of iodine has been described for the salivary glands, the process is not very efficient, and it can be ignored in comparison with the efficient organification in the thyroid. The effect of iodine organification has been illustrated by Zuckier et al. (16). These authors found that uptake kinetics in the salivary glands were similar for 123 iodide, 99mTc pertechnetate, and 188Re perrhenate. In the thyroid, however, the accumulation of 123iodine increased continuously, and 19 hours after injection, nearly the entire injected dose was found in this organ. The authors also confirmed this result by in vivo imaging.
Rocchi et al. attributed the radioactive iodide accumulation found in the neck region of mice to the unique uptake activity of the thyroid (25). Their approach may undoubtedly have no major consequences on the given results. As discussed earlier, several hours after injection of the radiotracer the portion of the radioactivity detected in the neck region, which is due to the uptake activity of the salivary glands, can be disregarded (20,26).
The mouse thyroid was distinguished from the salivary glands with a newly developed, small-animal-dedicated SPECT camera (27). However, as reported in this work, geometric calibration of a clinically dedicated camera with a pinhole collimator also allows the acquisition of SPECT images with the high resolution required for mouse imaging. We have shown that such high resolution is an important issue, not only for research on the thyroid but also for all studies using a gamma emitter as a signal for in vivo imaging. The cloning of the NIS cDNA now allows the targeting of NIS expression into any cell type using gene therapy. This enables the targeted cells to accumulate iodide (via NIS) and they may then selectively be destroyed using radioiodide therapy. In addition, NIS can be used as a reporter gene in scintigraphic imaging for preclinical experiments. The use of our geometric calibration system of SPECT imaging will allow a more detailed and precise analysis of the NIS-expressing cell distribution in preclinical trials.
Footnotes
Acknowledgments
The authors thank Dr. Sabine Lindenthal and Dr. Patrick Chang for critical reading of the manuscript. This work was supported by grants from Electricité de France and “Conseil Général 06.”
Disclosure Statement
The authors have no conflict of interest.