
Abstract
Background:
We have demonstrated that the administration of δ-iodolactone (i.e., 5-iodo-delta lactone) of arachidonic acid (IL-δ), a mediator in thyroid autoregulation, prevents goiter induction by methylmercaptoimidazol (MMI) in rats. Other studies have shown that transforming growth factor beta-1 (TGF-β1) mimics some of the actions of excess iodide, but its participation in autoregulation is disputed. The present studies were performed to test the hypotheses that IL-δ decreases thyroid growth by inhibition of cell proliferation and/or by stimulation of apoptosis due to oxidative stress, that TGF-β is stimulated by an excess of iodide and by IL-δ, and that c-Myc and c-Fos expression are upregulated during goiter induction and downregulated during goiter inhibition.
Methods:
Rats were treated with MMI alone or together with iodide or IL-δ. Thyroid weight, cell number, cell proliferation, apoptosis, and oxidative stress were determined. Proliferating cell nuclear antigen (PCNA), TGF-β1, TGF-β3, c-Myc, and c-Fos were measured by Western blot.
Results:
MMI caused a progressive increase in thyroid weight accompanied by an increase in cell number, asymmetry of the ploidy histograms, and PCNA, c-Fos, and c-Myc expression. In addition, an early increase of apoptosis was observed. Peroxides as well as glutathione peroxidase and catalase activities were also increased in goitrous animals. The inhibitory action of IL-δ on goiter formation was accompanied by the inhibition of cell proliferation evidenced by a significant decrease in cell number, PCNA expression, and asymmetry of the ploidy histograms. A transient stimulation of apoptosis after 7 days of treatment was also observed. MMI administration stimulated TGF-β1 but not TGF-β3 synthesis. IL-δ alone caused a slight increase of TGF-β3 but not TGF-β1, whereas potassium iodide (KI) stimulated both isoforms and MMI reversed KI effect on TGF-β1 expression but not on TGF-β3.
Conclusions:
The goiter inhibitory action of IL-δ is due to the inhibition of cell proliferation and the transient stimulation of apoptosis. This latter action does not involve oxidative stress. TGF-β1 does not play a role in the autoregulatory pathway mediated by IL-δ. Iodide stimulates TGF-β3 without the need of being organified. These results suggest that there may be more than one pathway involved in the autoregulatory mechanism.
Introduction
Some of the inhibitory effects of iodide excess are reproduced by transforming growth factor beta-1 (TGF-β1) on several parameters, such as iodide uptake, cell proliferation, and cAMP accumulation (19). In vitro studies demonstrated that the effect of iodide on DNA synthesis is reversed by anti-TGF-β1 antiserum (19), and that iodide stimulates TGF-β1 mRNA and protein synthesis (20,21). In normal human thyroid cells, iodide increases the synthesis of TGF-β1, whereas this response was decreased in cells obtained from thyroid nodules. This result led the authors to propose that this decrease of the response to iodide might in part explain the pathophysiology of thyroid nodules (21). In accordance, Eszlinger et al. (22) demonstrated that in cold and hot nodules, TGFβ1 concentration is slightly decreased compared with surrounding normal tissue.
In addition, these results led to the hypothesis that TGF-β1 might participate in thyroid autoregulation. In thyroid pig follicles, neither iodide nor IL-δ alone caused a change in TGF-β1 expression (23). Therefore, it may be that several compounds participate in the autoregulatory mechanism; the relationship between IL-δ and TGF-β1 requires further studies. On the other hand, c-Myc and c-Fos are transcription factors that play a role in cell proliferation and apoptosis. Depending on the experimental model, these factors may be increased or decreased by TGF-β (24,25).
Therefore, we formulated the following hypotheses: (a) IL-δ prevents MMI-induced thyroid growth by inhibition of cell proliferation and/or by stimulation of apoptosis due to oxidative stress, (b) TGF-β is an intermediate in the effect of excess iodide and of IL-δ, and (c) c-Myc and c-Fos expression are upregulated during goiter induction and downregulated during goiter inhibition. To evaluate these hypotheses we analyzed the effects of administration of potassium iodide (KI) and IL-δ on cell proliferation, ploidy patterns, and apoptosis, as well as on the free radical metabolism in rats. We also studied changes in the expression of TGF-β1 and TGF-β3 during the first days of goiter induction (MMI) and inhibition (MMI + IL-δ) in rats, as well as the expression patterns of c-Myc and c-Fos.
Materials and Methods
Animals and treatments
Female Wistar rats (80–120 g) were used for our studies. They were housed in a light- and temperature-controlled room and had free access to food and water. The animals were distributed into the following groups: control; MMI 5 mg/day intraperitoneally (i.p.); KI 10 μg/day i.p.; IL-δ 10 μg/day i.p.; MMI + KI; and MMI + IL-δ. Treatments were administered for 3, 7, or 14 days. At the end of these times the animals were sacrificed by pentobarbital administration (120 mg/kg) followed by cervical dislocation. Blood was obtained by cardiac puncture, placed in a tube, and allowed to clot. The serum was separated by centrifugation at 4°C and was kept at −18°C until used for biochemical determinations. Each thyroid gland was carefully dissected, weighed, and the ratio of thyroid weight (g)/body weight (g) was determined (tw/bw × 105). Animals were handled according to the National Institutes of Health (NIH) guide for the use of experimental animals.
Histometry
A part of the thyroid glands was fixed with 10% neutral-buffered formalin, embedded in paraffin, and cut into 5-μm sections for histochemical studies. Another part of the gland was frozen at −80°C for biochemical studies. The number of epithelial cells was determined on sections crossing the center of the lobe, considered to be representative of the entire gland (26), and values are expressed as number of cells per surface unit.
Terminal transferase dUTP nick end labeling assay
Thyroid glands were dissected, fixed in 10% neutral-buffered formalin, and embedded in paraffin. Apoptotic cells were detected in 5-μm sections with an ApopTag Plus Peroxidase In Situ Apoptosis Detection Kit (ApopTag Chemicon S7100; Chemicon International). The color development was monitored by microscopic examination of the slides. After washing with phosphate-buffered saline (PBS), the slides were stained with methyl green in 0.1 M sodium acetate (pH 4.0). A rat breast section with obvious apoptotic cells was used as a positive control. Negative control results were performed under the same conditions without the addition of the enzyme, according to the manufacturer's instructions. Positively stained cells were counted in four fields (200 ×) for each lobe, and the ratio of apoptotic cells was expressed as the number of apoptotic cells per 1000 thyrocytes. To avoid counting false-positive cells, no counting was performed close to necrotic or autolysis areas. The person who was doing the counting was not aware that the rat whose thyroid was being examined had received the treatment.
Microspectrophotometric analysis
Computer-assisted cell image analysis was performed on Feulgen-stained thyroid. DNA content was evaluated by employing a microspectrophotometer (MPM 800; Carl Zeiss) and IBAS image analyzer (Kontron Electronic), connected to a Sony SPT-M108CE camera control. The images were obtained with a Zeiss × 40 and an NA 0.75 objective. The control diploid value was obtained for each section by measuring 20 lymphocytes present in the trachea. Over 100 nuclei were measured in each case by employing the DNA IBAS-Kontron software. The software yields the values of total optical density and the nuclear area in pixels of each nucleus (1 pixel2 =0.026 μm2). Two different types of ploidy histograms were categorized: type I (if the histogram presented a single peak 2c in the G0-G1 area) and type II (two distinct peaks in 2c and 4c showing normal cell growing G1-S-G2 with the amount of DNA doubled. Type I histograms do not present asymmetry and have a peak close to the diploid region, and type II histograms present an increased asymmetry of the ploidy histograms, indicating active proliferation. The type II histograms are not symmetric and have an increased number of cells with DNA content between 2c and 4c, indicating increased proliferation.
TSH assay
Serum TSH was determined in duplicate by RIA using the kit provided by the National Institute of Diabetes, Digestive, and Kidney Diseases (NIH). Results are expressed in terms of rat TSH Reference Preparation 3. Intra- and interassay coefficients of variation for TSH were 8.7% and 13.4%, respectively.
Western blot analysis
The thyroid glands were washed with cold PBS and lysed in cell lysis buffer (50 mM Tris-HCl [pH 7.4], 150 mM NaCl, 1% Nonidet P40, 0.1% sodium dodecyl sulfate, 0.5% deoxycholate) plus 0.5 mM phenylmethylsulfonylfluoride (PMSF), 2.5 mM benzamidine, 10 μg/mL aprotinin, 1 μg/mL leupeptin, and 1 μg/mL pepstatin.
Equal amounts of protein (50 μg) were electrophoresed on 10% polyacrylamide gels and transferred to nitrocellulose membranes. Immunoblotting was carried out on the same membrane with monoclonal anti c-Fos antibodies (dilution 1:200; Calbiochem), polyclonal anti c-Myc antibodies (dilution 1:200; Santa Cruz Biotechnology), and anti–proliferating cell nuclear antigen (PCNA) antibodies (dilution 1:500; Santa Cruz Biotechnology) in PBS with 0.2% Tween 20 (Sigma-Aldrich) and 5% bovine serum albumin. Immunochemical detection of c-Myc, c-Fos, and PCNA levels were performed using a specific antibody and anti–rabbit immunoglobulin G antibody conjugated with peroxidase. Proteins were visualized using the enhanced chemiluminescence method (Amersham Pharmacia Biotech). Densitometric analysis was performed using the NIH ImageJ analysis Software (1.40g; Wayne Rasband, NIH) and results were corrected for protein loading by normalization for β-actin (Sigma-Aldrich) expression.
Immunoprecipitation
Thyroid glands were washed with cold PBS and homogenized with a Teflon-glass homogenizer in ice-cold lysis buffer containing 0.2 M sucrose (pH 7.6), 10 mM HEPES, 15 mM KCl, 2 mM ethylenediaminetetraacetic acid, 0.5 mM dithiothreitol, 0.5 mM PMSF, 2.5 mM benzamidine, 10 μg/mL aprotinin, 1 μg/mL leupeptin, and 1 μg/mL pepstatin and centrifuged at 12,000 g for 20 minutes at 4°C. The resulting supernatant was collected and centrifuged at 35,000 g for 60 minutes. Equivalent amounts of each sample were immunoprecipitated with anti-TGFβ1 (kindly provided by Dr. Katheen Flandres, NIH) or anti-TGFβ3 antibody (Calbiochem) in 0.5 M NaCl, 100 mM Tris (pH 7.4), 50 mM ethylenediaminetetraacetic acid, 1% Triton X-100, and 0.5% tert-octylphenoxy poly(oxyethylene)ethanol (IGEPAL), with protease inhibitors and A-G Plus agarose protein. Negative control during for immunoprecipitation was prepared by substitution of primary antibody for nonimmune serum. The immunoprecipitates were electrophoretically separated in 12% polyacrylamide gel and transferred to nitrocellulose membrane. Polyclonal anti-TGFβ1 and TGFβ3 antibodies (Calbiochem) were used according to the manufacturer's protocol. The results were visualized by enhanced chemiluminescence (Amersham Pharmacia Biotech). The quantification of protein levels was made by density scanning of the immunoblots using ImageJ (1.40g; Wayne Rasband, NIH).
Caspase-3 activity
Caspase-3 activity was determined with the caspase-3 assay kit, according to the manufacturer's instructions (Sigma CASP-3-C; Sigma-Aldrich). This assay is based on the spectrophotometric detection of the Ac-DEVD-p-nitroaniline (pNA) substrate after cleavage. Thyroid glands were harvested in lysis buffer (50 mM HEPES, 5 mM dithiothreitol, 5 mM CHAPS, 10 μg/mL pepstatin, 2.5 mM benzamidine, 10 μg/mL aprotinina, 1 μg/mL pepstatin, 0.5 mM PMSF, pH 7.4) and homogenized with a Teflon-glass homogenizer. Lysates were clarified by centrifugation at 10,000 g for 5 minutes at 4°C, and clear lysates containing 100 μg proteins were incubated with caspase-3 substrate at 37°C for 3 hours. The concentration of pNA released from the substrate is calculated from the absorbance values at 405 nm. The activity, expressed as micromoles of pNA per minute per milliliter, was calculated with a pNA calibration curve. A positive control of caspase-3 and an inhibitor of caspase-3 (200 mM inhibitor Acetyl-Asp-Glu-Val-Asp-al [Ac-DEVD-CHO]) were added to the plate.
Thyroid peroxide level determination
Peroxide content was determined with the Peroxi-Detect Kit (Sigma-Aldrich). This kit is based on the fact that peroxides will convert Fe2+ ion to Fe3+ ion at acidic pH. The Fe3+ ion will form a colored adduct with xylenol orange, which is determined at 560 nm.
Catalase and glutathione peroxidase activities
For enzymatic determinations, thyroid glands were washed with cold PBS and lysed with a Teflon-glass homogenizer in ice-cold buffer containing 50 mM potassium phosphate buffer (pH 7). Glutathione peroxidase (GPx) activity was determined with the Glutathione Peroxidase Cellular Activity Assay Kit (Sigma CGP-1; Sigma-Aldrich).This kit uses an indirect determination method. It is based on the oxidation of glutathione (GSH) to oxidized glutathione (GSSG) catalyzed by GPx, which is then coupled to the recycling of GSSG back to GSH utilizing glutathione reductase and NADPH. The decrease in NADPH absorbance measured at 340 nm during the oxidation of NADPH to NADP is indicative of GPx activity. The concentration of the enzyme was calculated as units/mL ( = μmol/[min · mL]).
Catalase activity was measured by monitoring the disappearance of H2O2 at 240 nm. The reaction mixture contained 30 μg protein, 50 mM potassium phosphate buffer (pH 7.8), and 15 mM H2O2. Changes in absorbance were measured for 100 seconds. The specific activity was calculated as units/mL (= μmol/[min · mL]). All proteins were determined according to Lowry et al. (27). All reagents were purchased from Sigma Chemical Co.
Statistical analysis
Each group comprised four to five rats and the experiments were repeated four to five times. Results are expressed as mean ± standard error of the mean. Statistical analysis of the results was made by one-way analysis of variance followed by Student–Newman–Keuls test and the nonparametric Kruskal–Wallis test for the terminal transferase dUTP nick end labeling (TUNEL) assay. Differences were considered significant at p < 0.05.
Results
Thyroid weight
Treatment with MMI caused an increase in the thyroid weight/body weight ratio of 32% above control values after 3 days, 53% after 7 days (p < 0.01), and 94% after 14 days (p < 0.01). Simultaneous administration of MMI + IL-δ decreased thyroid growth by 63% at 7 days (p < 0.05) and by 43% at 14 days (p < 0.05). The treatment with MMI + KI failed to alter MMI stimulation of thyroid weight. No significant changes were observed when IL-δ or KI was injected alone (Fig. 1). These results confirm previous data indicating that iodide must be organified to inhibit thyroid growth and that IL-δ inhibits this parameter.
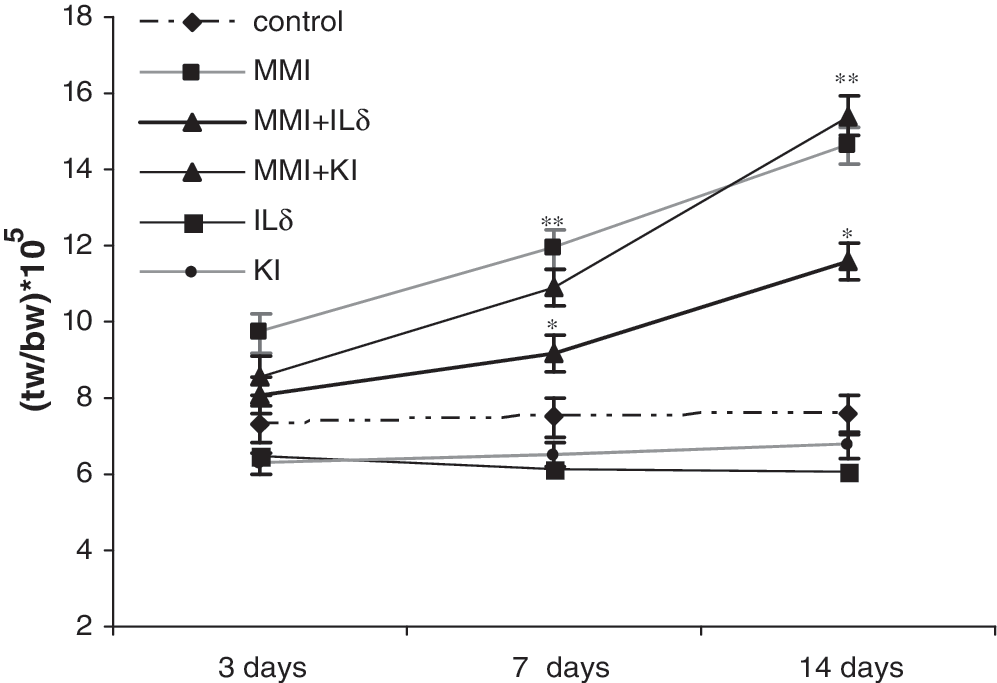
Effect of IL-δ on thyroid weight. Rats were treated with methylmercaptoimidazol (MMI) 5 mg/day i.p., KI 10 μg/day i.p., or IL-δ 10 μg/day i.p., for 3, 7, and 14 days. Values represent the ratio of thyroid weight (g)/body weight (g) (tw/bw × 105), and data are expressed as the mean ± SEM of six independent experiments with four to five rats per group. **p < 0.01 (MMI and MMI + KI vs. control) at 7 and 14 days of treatment; *p < 0.05 (MMI + IL-δ vs. MMI) at 7 and 14 days of treatment. IL-δ, δ-iodolactone (i.e., 5-iodo-delta lactone) of arachidonic acid; MMI, methylmercaptoimidazol; i.p., intraperitoneally; SEM, standard error of the mean; KI, potassium iodide.
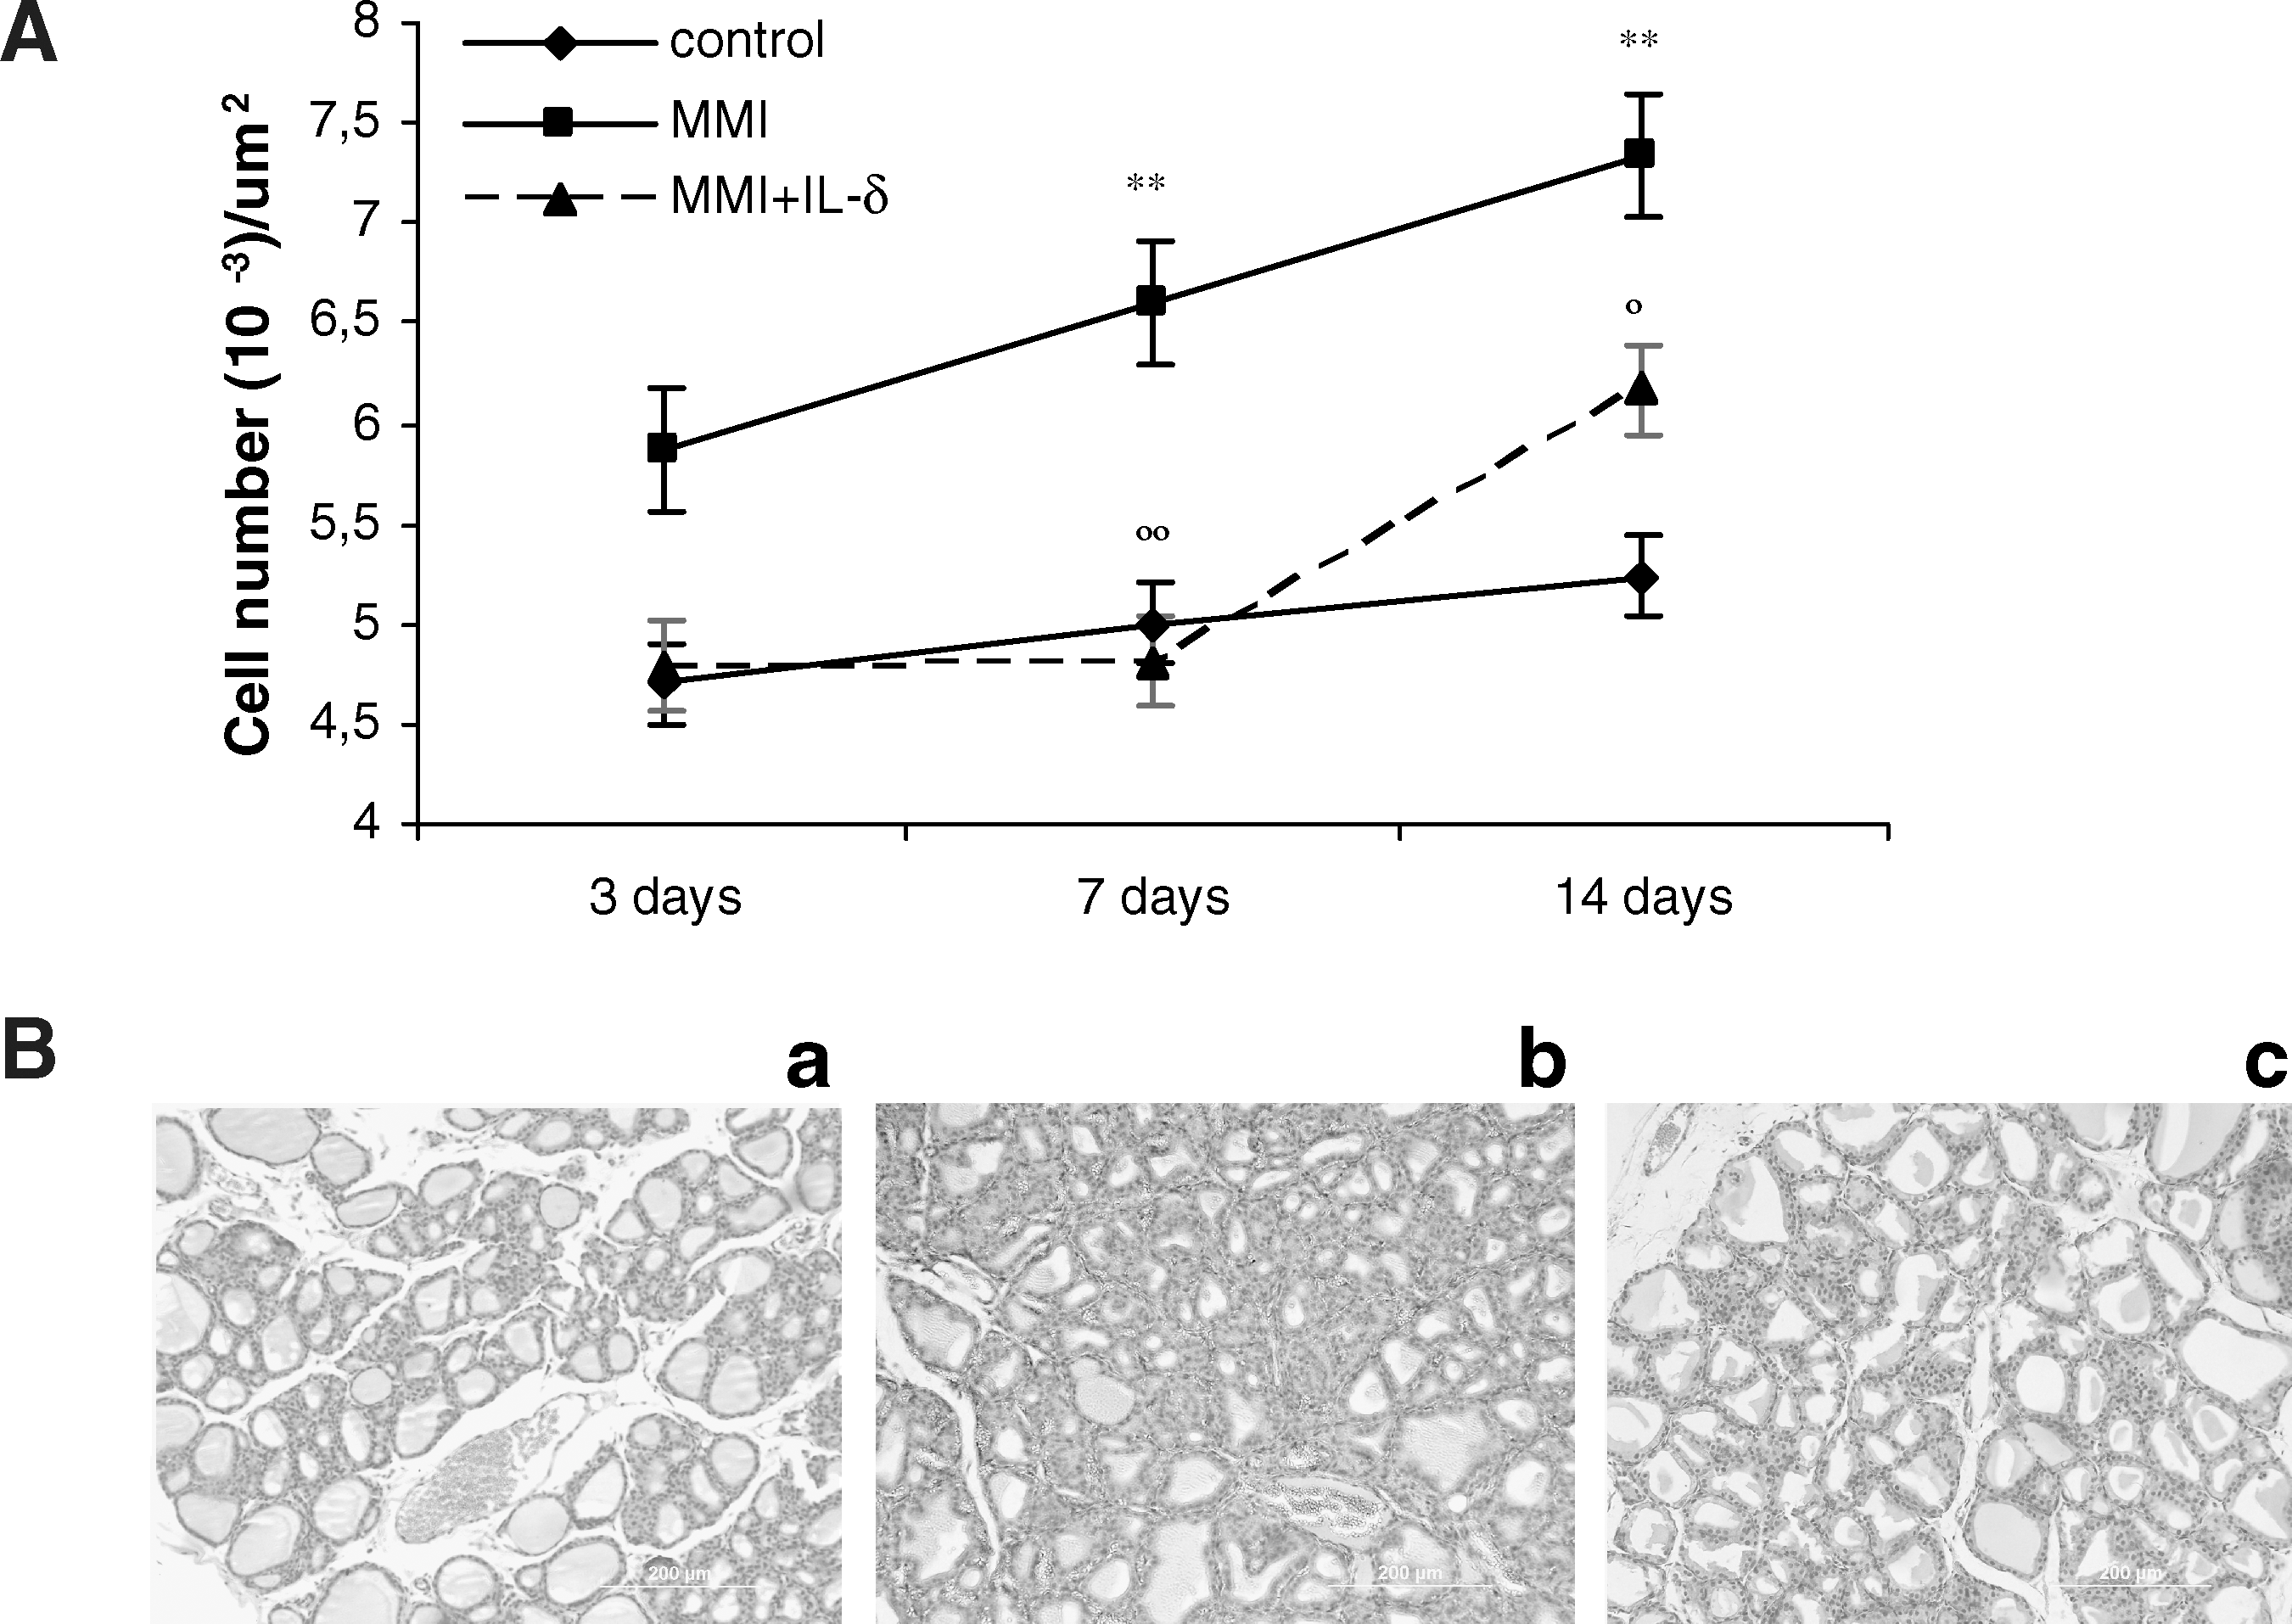
Cell number
To clarify the hypothesis stating that IL-δ decreases thyroid growth by inhibition of cell proliferation and/or by stimulation of apoptosis involving oxidative stress, a number of studies were performed. The first of these related to cell number and demonstrated that after 3, 7, and 14 days of MMI treatment there was increased gland weight in hematoxylin–eosin-stained sections that were associated with an increase in cell number and cellular hypertrophy, typical of a hyperplastic goiter (Fig. 2). Epithelial cell number was significantly increased by 23% (p < 0.01) at 7 days and by 39% (p < 0.01) at 14 days. When inhibition was induced by the simultaneous administration of MMI + IL-δ, the number of cells was decreased by 100% at 7 days (p < 0.01) and by 56% at 14 days (p < 0.05) (Fig. 2). Serum TSH levels were 2.4 ± 0.3 ng/mL in control rats, whereas MMI caused a significant elevation to 7.6 ± 1.0 ng/mL at 3 days, 10.2 ± 1.1 ng/mL at 7 days, and 19 ± 3 ng/mL at 14 days.
(
Proliferating cell nuclear antigen
PCNA expression was measured as an index of cell proliferation (Fig. 3). The 3-day MMI treatment was associated with a slight but not significant increase in PCNA. After 7 and 14 days of MMI treatment, PCNA was significantly higher than that in the controls (p < 0.01). Administration of MMI + IL-δ for 7 days caused a significant decrease of 15% (p < 0.05), whereas injection of MMI + KI for 7 days did not change the MMI effect (Fig. 3).
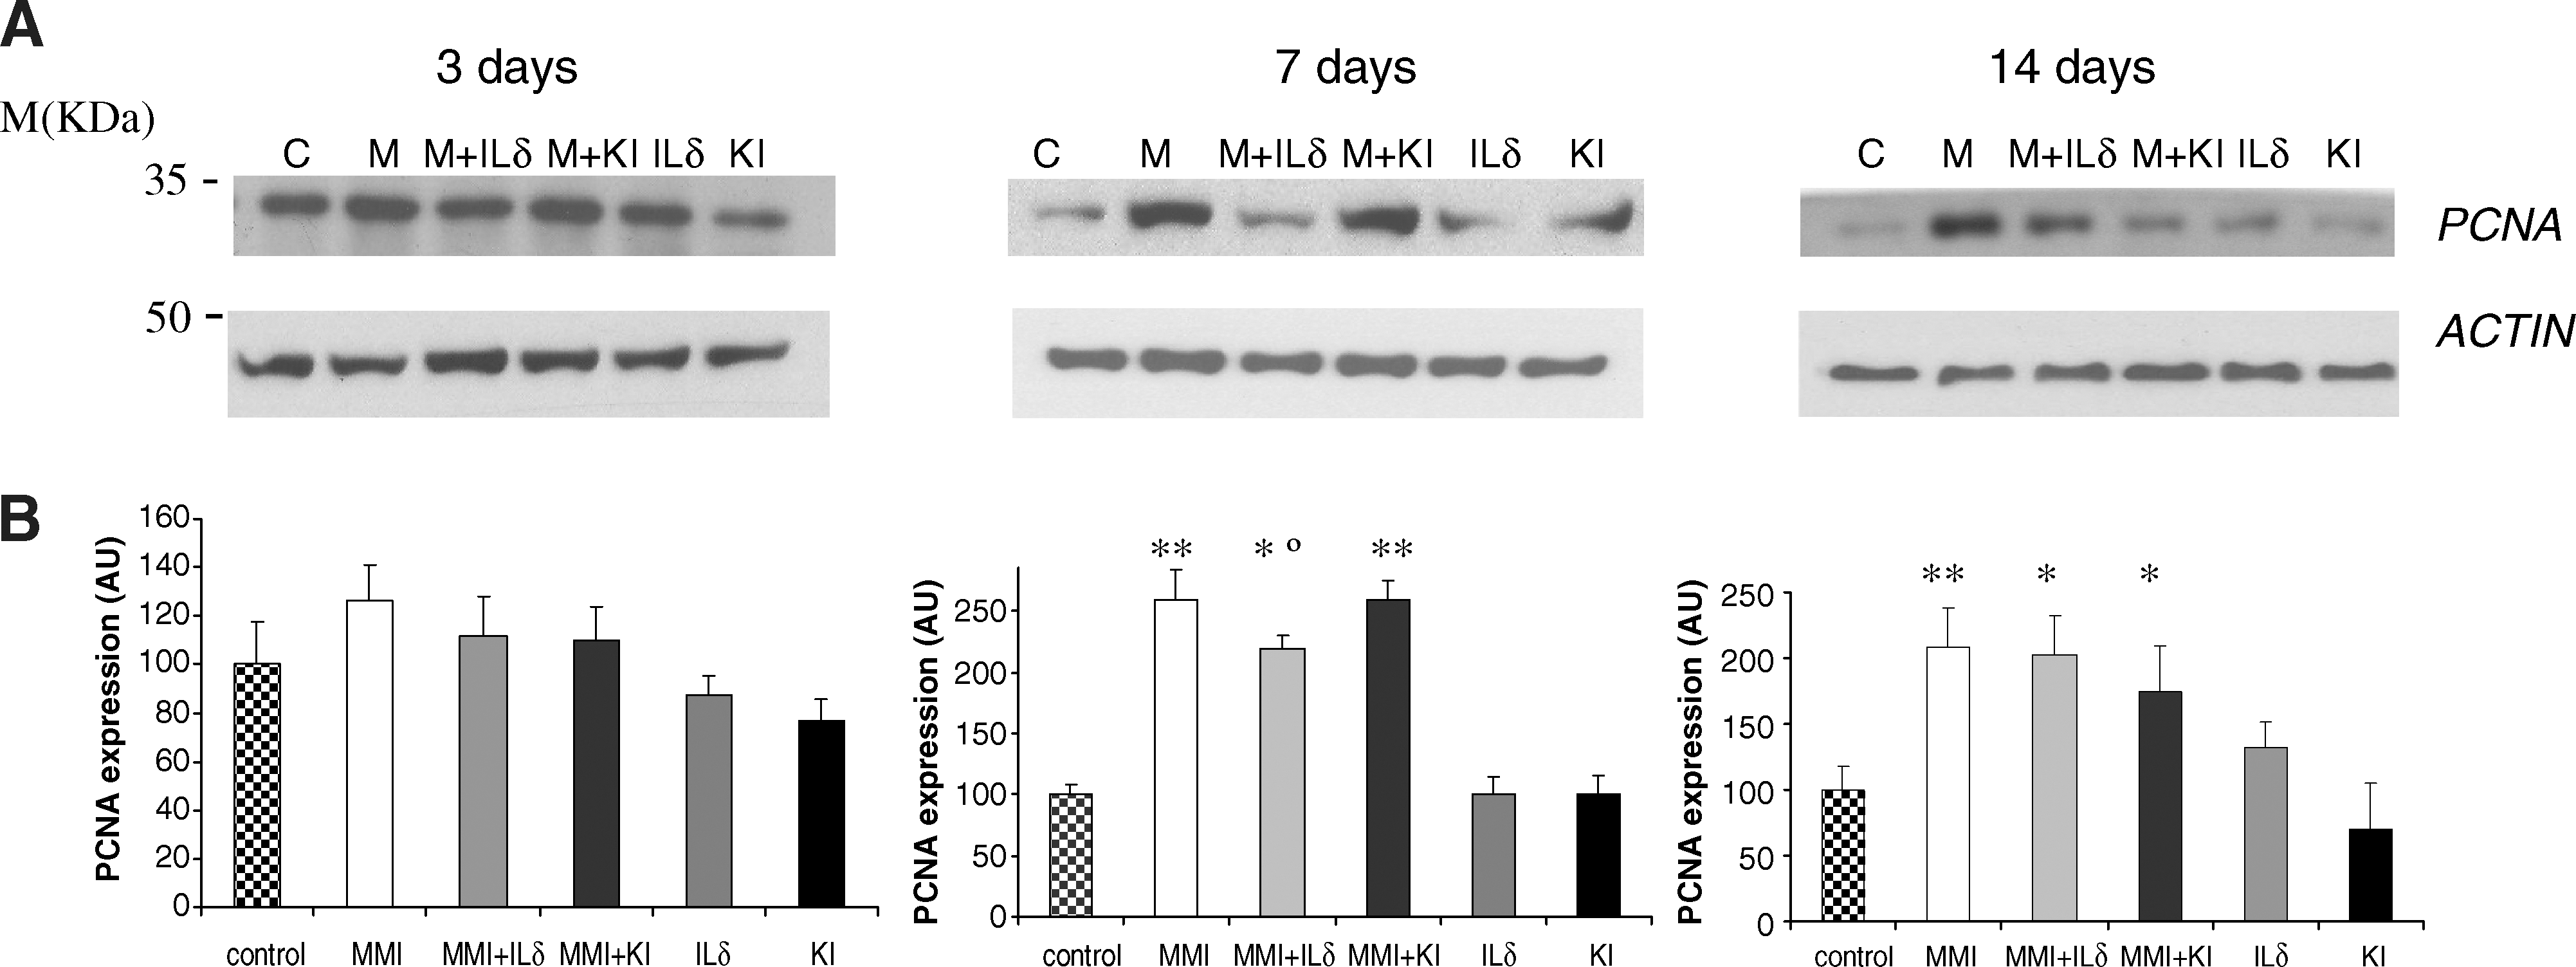
Western blot analysis of PCNA expression. Treatments were carried out for 3, 7, and 14 days. (
Microspectrophotometric analysis
The distribution of DNA ploidy pattern was different among the treatment groups. The asymmetry of the ploidy histogram was significantly higher in the MMI-treated group compared with the control group, being 5-, 5.7-, and 2.3-fold higher than the control group, respectively, after 3, 7, and 14 days of treatment. The apparent effect of MMI was not noted in the MMI + IL-δ groups after 3 and 7 days of this treatment and the asymmetry of the ploidy histogram of the MMI + IL-δ group was not significantly higher than the control group. After 14 days, no effect of IL-δ on MMI action was observed. The asymmetries of the DNA ploidy histograms were similar in the IL-δ, KI, and control groups (Table 1). The nuclear areas in the MMI, MMI + IL-δ, and MMI + KI groups were significantly higher than that in the control group after 3, 7, and 14 days of treatment. In contrast, the nuclear areas of the IL-δ and KI groups were similar to the control group (Table 1).
Nuclear area, ploidy, and asymmetry of the ploidy histograms are given. The ploidy values are expressed in relation to the DNA values (2c) of the respective internal control cells. Treatments were carried out for 3, 7, and 14 days. The results are expressed as mean ± SEM of five independent experiments.
p < 0.01 versus control.
p < 0.01 versus MMI.
MMI, methylmercaptoimidazol; IL-δ, 5-iodo-delta lactone of arachidonic acid; SEM, standard error of the mean; KI, potassium iodide.
Detection of apoptotic cells
Caspase-3 activity, an indicator of apoptosis, was significantly higher by about three- to fivefold in the MMI treatment groups compared with the control group at all treatment times. Caspase-3 activity was even higher in the MMI + IL-δ groups compared with the control being more than twofold greater than the MMI group after 7 days of treatment (p < 0.01) (Fig. 4). Caspase-3 activity was similar in the MMI and MMI + KI groups.
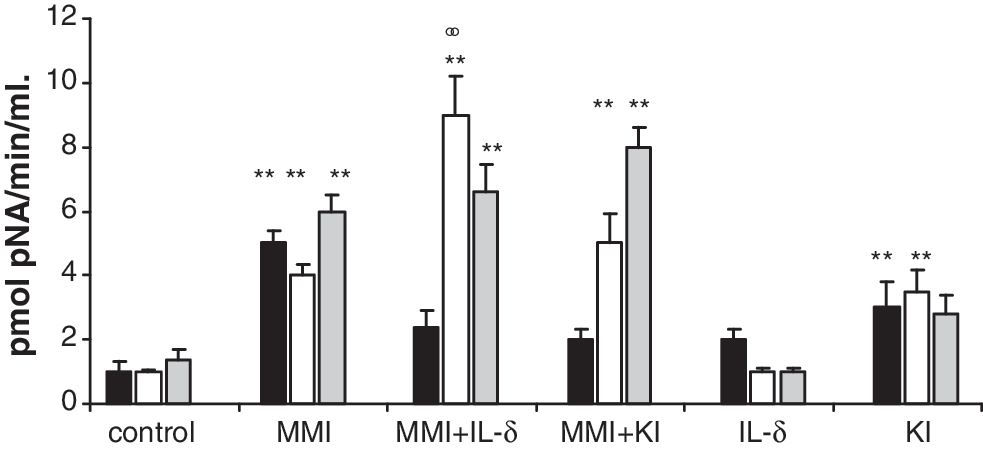
Caspase-3 activity measured as picomoles of pNA released per minute per milliliter. Treatments were carried out for 3 (black bars), 7 (white bars), and 14 days (gray bars). Caspase-3 activity shows a significant difference between the control and MMI (goiter) groups (**p < 0.01) and between the MMI and MMI + IL-δ groups at 7 days (°°p < 0.01). Data are expressed as mean ± SEM of five independent experiments with four to five rats per group. pNA, p-nitroaniline.
Only a few TUNEL-positive cells were present in the control thyroid glands. TUNEL-positive cells were increased by 169% in the MMI group compared with the control after 3 days of treatment, by 350% after 7 days of treatment, and by 224% after 14 days of treatment (Fig. 5). In the MMI + IL-δ group, there was a 72% increase in TUNEL-positive cells compared with the MMI group after 7 days of treatment (p < 0.05).

(
Oxidative stress
Peroxides were 2- and 2.5-fold higher in the MMI treatment groups compared with the control after 7 and 14 days of treatment, respectively. The values were similar for the MMI + IL-δ and MMI + KI groups compared with the MMI groups at all treatment times. Peroxide values were similar in the IL-δ and KI groups compared with the control (Table 2).
Values given are amounts of peroxides generated during the MMI, IL-δ, and KI treatments. Peroxide content was determined with the PeroxiDetect Kit (Sigma) and data are expressed as nmol peroxides/mg protein. The results are expressed as mean ± SEM of four separate experiments.
p < 0.01 versus control.
Catalase activity was 190% higher in the MMI group compared with the control group after 7 days of treatment, and the values for the MMI + IL-δ and MMI + KI groups were similar to the MMI group. The catalase activities of the IL-δ and KI groups were 130% and 56%, respectively, higher than the control groups (Table 3). GPx activity was significantly higher in the MMI group than in the control group after 7 days of treatment. Similar values to the MMI group were obtained for the MMI + IL-δ and MMI + KI groups (p < 0.01 compared with the control) (Table 3).
CAT and GPx activities during the MMI, IL-δ, and KI treatments are given. The enzymatic activity is expressed as EU/mg protein and the results are expressed as the mean ± SEM of five independent experiments.
p < 0.001 versus control.
p < 0.01 versus control.
p < 0.05 versus control.
EU, enzymatic units; CAT, catalase; GPx, glutathione peroxidase.
TGF-β1 and TGF-β3 expression
To clarify the hypothesis that TGF-β is an intermediate in the actions of excess iodide or IL-δ, the following studies were performed. TGF-β1 expression was slightly higher in the MMI than in the control group after 3 days of treatment, whereas TGF-β3 expression was similar in these groups. TGF-β1 expression was similar in the MMI and MMI + IL-δ groups. TGF-β3 but not TGF-β1 expression was higher in the IL-δ group by 55% than the control group. In contrast, both TGF-β1 and TGF-β3 were higher in the KI group by 100% and 78%, respectively, than in the control group (Fig. 6). The effect of KI on TGF-β1 expression, but not on TGF-β3, was reversed by MMI.

Immunoprecipitation and Western blot analysis of TGF-β1 and TGF-β3 expression in thyroid glands after 3 days of treatment. Equivalent amounts of cytosol sample were immunoprecipitated with anti-TGFβ1 or anti-TGFβ3 antibody. C: control; M: MMI. (
c-Fos and c-Myc expression
To answer the hypothesis that c-Myc and c-Fos expression might be up- or downregulated depending on the time and experimental conditions, a number of studies were performed.
MMI caused an induction of c-Fos expression after 3, 7, and 14 days of treatment (p < 0.01) and these effects were not modified by the simultaneous administration of either KI or IL-δ (Fig. 7). The expression of c-Myc was increased by IL-δ and KI after 3 days of treatment. Conversely, after 7 days of treatment with MMI, MMI + IL-δ, MMI + KI, IL-δ, and KI, the mean cMyc expression was slightly higher but not significant than the control. After 14 days of the respective treatments, cMyc expression in these groups was significantly higher than the control group (p < 0.05) (Fig. 7).

Western blot analysis of c-Fos and c-Myc expression. (
Discussion
Although TSH is the main regulator of the thyroid, various other factors have also been shown to participate in certain processes of this gland. Excess iodide (above a serum concentration of ∼10−5 M in rat) inhibits several thyroid parameters, such as iodide uptake and hormone biosynthesis, H2O2 formation, hormone secretion, uptake of glucose and amino acids, cell proliferation, and effects on the expression of certain genes within the thyroid. These effects are exerted directly on the thyroid rather than through alteration of pituitary TSH secretion. Conversely, iodide depletion makes the thyroid hypersensitive to the action of external factors such as TSH, epidermal growth factor, insulin-like growth factor 1, and so on. The ability of iodide excess and depletion to regulate thyroid function parameters, such as iodide uptake and organification, thyroglobulin synthesis, cAMP accumulation, thyroid cell proliferation, H2O2 formation, and so on, has been termed thyroid autoregulation (7,8). As these effects are relieved by propylthiouracil and MMI, it was proposed that the inhibitory effects of iodide excess are mediated by an organic iodocompound (7,8).
Certain iodolipids such as IL-δ and 2-IHDA are synthesized by thyroid. In addition, these iodolipids have similar effects as that of excess iodide on thyroid cell proliferation (11,12) and thyroid function, and so their participation in thyroid autoregulation has been suggested.
The first hypothesis
IL-δ prevents MMI-induced thyroid growth by inhibition of cell proliferation and/or by stimulation of apoptosis due to oxidative stress. MMI caused a slight nonsignificant increase in thyroid weight after 3 days of treatment, and this parameter rose progressively till 14 days (p < 0.01). These changes were accompanied by an increase in cell number, PCNA expression, and asymmetry of ploidy patterns, indicating an active proliferation. Treatment with IL-δ caused a significant inhibition of goiter induction by MMI, whereas KI did not change MMI action, in agreement with our previous results (13). The decrease of thyroid weight was parallel to the decrease in the number of proliferating follicular cells due to IL-δ treatment. This was accompanied by a significant decrease in PCNA expression and the asymmetry of the ploidy histograms after 7 days.
We observed that MMI administration causes an early increase in apoptotic markers such as caspase-3 activity, as evidenced by the TUNEL assay. Our data are in agreement with the results of Tamura et al. (28), who have shown an increase of apoptotic cells during goiter development at 7 and 21 days of low-iodide diet. These results suggest that the increase in apoptosis may be interpreted as a reaction that tries to limit overgrowth, but, at the same time, the stimulation of proliferation overcomes this intent. The early effect on apoptosis may explain the finding that thyroid weight was not significantly increased at 3 days of MMI treatment. IL-δ caused a transient stimulation of apoptosis, as evidenced by the significant increase of both caspase-3 and TUNEL values.
Peroxides were elevated after MMI treatment. It is possible that the increased oxidative stress observed in goitrous thyrocytes is in part due to the accumulation of H2O2 when thyroid peroxidase is inhibited (29) and that the increase in lipid peroxides may be also related to the stimulation of apoptosis. Thyrocytes possess various enzymatic systems, such as catalase and GPx, which contribute to limit cellular injuries when H2O2 or other reactive oxygen species are produced in excess (30 –32). Under the present experimental condition, catalase and GPx activities were increased in goitrous glands, suggesting that these enzymatic systems protect the gland from cellular injuries and regulate its peroxides levels. Maier et al. (33) suggested that the strikingly high spontaneous mutation rate in thyroid is much higher than in other tissues and this could be due to thyroid hormone synthesis, which involves generation of free radicals and reactive oxygen species. Iodide deficiency is known to develop goiter, oxidative stress, increased mRNA of antioxidative enzymes, DNA modification, and somatic mutations (34).
The regression induced by IL-δ in this case would not be related to oxidative stress because of the fact that there were no significant differences in the levels of peroxides and in the activity of catalase and GPx between the groups treated with MMI alone and MMI + IL-δ.
The second hypothesis
TGF-β is an intermediate in the effect of excess iodide and of IL-δ. MMI administration for 3 days stimulated TGF-β1 synthesis but not TGF-β3. Treatment of rats with goitrogens, which stimulate endogenous TSH, causes an increase in thyroid weight until it reaches a plateau, despite the persistent administration of these drugs (35). A stimulation of TGF-β1 expression was observed during goitrogenesis in rats treated with either TSH for 1 week, or drugs that stimulate endogenous TSH secretion (36). Besides, TGF-β1 stimulates apoptosis, suggesting that the increase in TGF-β1 observed during goiter induction might be a mechanism to counteract the goitrogenic effect of endogenous TSH (37). In a similar study, Logan et al. (38) demonstrated an increase in TGF-β1 mRNA during goiter progression, whereas a decrease with goiter involution. Kimura et al. (39) analyzed the expression of the three isoforms of TGFβ in multinodular goiter and in differentiated thyroid carcinomas. They observed that the three isoforms were barely detected in normal thyroid tissues but were clearly expressed in cancer and goiter samples. Therefore, it may be concluded that the stimulation of thyroid-cell proliferation causes at the same time a counter-balanced response with an early increase in TGF-β1, known to induce apoptosis.
In our rats, IL-δ alone caused a slight increase of TGF-β3 (p < 0.05) but not of TGF-β1, whereas KI alone stimulated both isoforms (p < 0.05). These results agree with previous data that demonstrated that iodide increases TGF-β1 mRNA expression (40) and TGF-β1 protein (20) and that anti-TGFβ1 serum reverses the action of excess iodide (19). Using pig thyroid follicles culture suspension, Gärtner et al. (23) reported that neither iodide nor IL-δ alone caused a change in TGF-β1. However, they observed that TSH decreased TGF-β1 and that this effect was partially reversed by the addition of KI. This is not the first time of observation that IL-δ cannot reproduce all the effects of iodide (41).
Concerning the possible mechanisms involved in thyroid autoregulation, our results may suggest that the inhibitory effects of iodide include different pathways. One of them would comprise iodide organification into IL-δ, which could not be mediated by TGF-β1, but perhaps it would include TGF-β3. It was also observed that iodide stimulated TGF-β3 in the presence of MMI, and therefore, it would suggest that there exists a second pathway in the inhibitory effect of this halogen, which does not require iodide organification.
The third hypothesis
c-Myc and c-Fos expression are upregulated during goiter induction and downregulated during goiter inhibition. MMI administration also stimulated the expression of both c-Myc and c-Fos, which were related to the stimulation of cell proliferation and apoptosis. The expression of c-Myc is insignificant in quiescent cells or during terminal differentiation. A transient increase of the oncoprotein takes place when the cells are stimulated by growth factors to enter into G1 phase (42).
After 7 and 14 days of treatment, IL-δ did not alter MMI stimulation of the expression of c-Myc and c-Fos. Therefore, it may be concluded that, under the present experimental conditions and times of treatment, IL-δ impairs thyroid growth by a mechanism that does not involve these genes. However, when either IL-δ or KI was administered alone, an increase in c-Myc accumulation was observed, without effect on c-Fos. The role of these genes under the present conditions requires further studies.
From the present results the following points may be concluded concerning the proposed hypotheses:
(a) The goiter inhibitory action of IL-δ is due to the inhibition of cell proliferation and the transient stimulation of apoptosis. This latter action does not involve oxidative stress.
(b) Excess iodide stimulates both isoforms of TGF-β. The action of IL-δ may be related to the stimulation of TGF-β3 but not TGF-β1. It is suggested that there may be more than one autoregulatory pathway in the thyroid.
(c) c-Fos expression is related to cell proliferation at all times analyzed, whereas c-Myc is only increased at later times. KI and IL-δ did not modify both proteins.
Further studies are required to clarify the postulated role of IL-δ in the biochemical mechanisms involved in thyroid autoregulation.
Footnotes
Acknowledgments
This study was supported by grants from the National Research Council of Argentina (CONICET), the State Secretary of Science and Technology (SECYT-FONCYT), and the University of Buenos Aires. L.T. and R.O. are research fellows at the Atomic Energy Commission and FONCYT, respectively. A.S.R., G.J.J., M.A.D., and M.A.P. are established researchers at CONICET.
Disclosure Statement
All authors have no commercial associations that might create a conflict of interests in relation to this study.