
Abstract
Background:
Recombinant human thyrotropin (rhTSH) stimulation is frequently used to assess the disease status of patients treated for differentiated thyroid cancer (DTC) when basal (unstimulated) thyroglobulin (b-Tg) is below the assay sensitivity limit. The objective of this study was to determine relationships between the b-Tg and the 72-hour rhTSH-stimulated Tg (rhTSH-Tg) using a second-generation immunochemiluminometric assay with a functional sensitivity of 0.05 ng/mL (μg/L).
Methods:
Serum Tg was measured in paired b-Tg and rhTSH-Tg specimens from 1029 rhTSH tests performed on 849 TgAb-negative patients during long-term monitoring for DTC.
Results:
Basal Tg correlated with rhTSH-Tg across b-Tg concentrations ranging from 0.05 to 1000 ng/mL (μg/L) (r = 0.85, p < 0.0001). The b-Tg concentration was unrelated to age, sex, basal TSH, 72-hour TSH, or the Tg fold response (rhTSH-Tg/b-Tg). Further, only 2/655 (0.3%) tests with b-Tg below 0.1 ng/mL (μg/L) had rhTSH-Tg above 2.0 ng/mL (μg/L) (2.9 and 3.8 ng/mL [μg/L], respectively). Thirty-three patients with three or more rhTSH tests performed over a 2- to 5-year period displayed high indexes of individuality for both the 72-hour TSH and the Tg fold response (indexes of individuality = 0.30 and 0.38, respectively). Basal Tg measured using a first-generation assay with a functional sensitivity of 0.9 ng/mL (μg/L) failed to reliably detect an rhTSH-Tg response above 2.0 ng/mL (μg/L).
Conclusions:
An rhTSH-Tg response above 2.0 ng/mL (μg/L) was highly unlikely when b-Tg was below 0.1 ng/mL (μg/L). Second-generation b-Tg measurements correlated with the degree of rhTSH-Tg stimulation and thus the likelihood of having rhTSH-Tg above the customary cut-off of 2.0 ng/mL (μg/L), whereas b-Tg measured by a first-generation assay did not. Correlations between four different assays showed that the use of a fixed Tg cut-off was influenced by assay selection. Patients receiving repetitive rhTSH tests had highly reproducible rhTSH-Tg/b-Tg fold responses, suggesting that repetitive testing is unnecessary and that second-generation measurement of b-Tg trends without rhTSH stimulation would be satisfactory for the long-term monitoring of most patients with DTC.
Introduction
Previous studies have indicated that assessing serum Tg during thyrotropin (TSH) stimulation may increase the clinical utility of Tg measurement as compared to the measurement of the basal Tg (b-Tg) levels alone (b-Tg being defined as the serum Tg concentration observed while receiving levothyroxine suppression therapy) (8 –12). During the last decade, recombinant human TSH (rhTSH) has replaced thyroid hormone withdrawal as the method of choice for elevating serum TSH for this purpose (8,9,12,13). Currently, an rhTSH-stimulated Tg (rhTSH-Tg) above 2 ng/mL (μg/L) when measured 72-hours after the second daily dose of rhTSH is considered to represent a significant risk factor for recurrent/persistent disease after near-total thyroidectomy (8,9,12,13).
However, comparison studies of current Tg assays reveal an array of technical problems that may compromise accurate Tg measurement and impact the use of fixed Tg cut-off values (14 –16). These studies report that absolute Tg values can vary as much as threefold, and that functional sensitivity limits may differ as much as 10-fold when using different Tg methods (14,15). In recent years, more sensitive second-generation Tg assays (functional sensitivity 0.05–0.10 ng/mL [μg/L]) have been developed and introduced into clinical practice (15,17,18). Because such assays frequently detect Tg levels in the 0.1–1.0 ng/mL (μg/L) range in apparently disease-free patients, their clinical relevance has remained somewhat controversial (15,18,19). In addition, confusion concerning the definition of what constitutes a “sensitive” assay further complicates the issue (16,20). Some published studies have failed to determine functional sensitivity according to current guidelines (21,22). In other studies assays have not been directly standardized against the certified reference material (CRM-457), making comparison of assay performance characteristics very difficult (23,24).
Second-generation Tg assays that offer a 10-fold improvement in functional sensitivity (0.05–0.10 ng/mL [μg/L]) have now become readily available for clinical use, thereby allowing comparative studies to be undertaken (15,25,26). The current study had four goals. The first was to compare relative response patterns between b-Tg and the 72-hour rhTSH-Tg values especially for subjects with b-Tg concentrations in the range below 1.0 ng/mL (μg/L) that could only be reliably detected using a second-generation assay. The second goal was to compare the ability of b-Tg measured with the second-generation versus a first-generation assay for predicting an rhTSH-Tg above 2.0 ng/mL (μg/L). The third goal was to determine the reproducibility of the Tg fold response (rhTSH-Tg/b-Tg) in individual patients receiving repetitive rhTSH testing. The fourth goal was to determine whether the customary fixed rhTSH-Tg cut-off of 2.0 ng/mL (μg/L) could be universally applied to different Tg methods.
Materials and Methods
Assays
Tg assays
All Tg assays employed 1:1 standardization against the certified reference material CRM-457 (23). The present study adopted a generational approach to Tg assay nomenclature, based on assay functional sensitivity analogous to that previously established for TSH methods (20,22,27 –29). Employing such criteria, most Tg immunometric assays (IMA) only display first-generation functional sensitivity (0.5–1.0 ng/mL [μg/L]) when directly standardized against CRM-457 (23). This level of sensitivity is merely comparable to that seen with early radioimmunoassay (RIA) methods (14,15,27). In contrast, Tg assays can be considered second-generation when they have an order of magnitude greater functional sensitivity (0.05–0.1 ng/mL [μg/L]).
Tg RIA was the first-generation RIA method that was developed by the USC Endocrine Laboratories, Keck School of Medicine, University of Southern California, Los Angeles, and has been previously described (12,28,30). Functional sensitivity was 0.5 ng/mL (μg/L), and between-run precision assessed over a 3-year period was 17.8%, 8.3%, 9.7%, and 11.9% for serum Tg concentrations of 0.78, 2.0, 11.1, and 31.7 ng/mL (μg/L), respectively. Within-run precision was 7.1%, 1.5%, and 5.3% at concentrations of 2.0, 16.1 and 31.6 ng/mL (μg/L), respectively. This Tg RIA was used as the reference method for the 1999 rhTSH trial that established the recommended rhTSH-Tg cut-off of 2.0 ng/mL (μg/L) (8 –10).
IMA-1 was the second-generation Access® immunochemiluminometric method (Beckman Coulter, Fullerton, CA). Functional sensitivity established using the NACB protocol was 0.05 ng/mL (μg/L). Between-run precision assessed over a 14-month period was 11.1%, 5.1%, 4.9%, and 4.3% for serum Tg concentrations of 0.16, 0.58, 7.0 and 348 ng/mL (μg/L), respectively. Within-run precision was 4.1%, 3.2%, 1.7%, and 1.9% at concentrations of 0.15, 0.76, 7.0, and 106 ng/mL (μg/L), respectively.
Tg IMA-2 was the first-generation Immulite® immunochemiluminometric method (Siemens, Los Angeles, CA). Functional sensitivity was determined to be 0.9 ng/mL (μg/L), which was in agreement with the manufacturer's estimate. Between-run precision assessed over a 9-month period was 28.1%, 5.7%, and 6.2% for serum Tg concentrations of 0.46, 8.0, and 122 ng/mL (μg/L), respectively. Within-run precision was 20.2%, 3.6%, and 2.8% at concentrations of 0.47, 7.6, and 117 ng/mL (μg/L), respectively.
IMA-3 was the Nichols Advantage® immunochemiluminometric method (Nichols Institute Diagnostics, San Juan Capistrano, CA) (12). Data were generated with this assay before 2006 when the method was withdrawn. Functional sensitivity was intermediate between first and second generation (0.3 ng/mL [μg/L]). Between-run precision assessed over a 1-year period was 10.8%, 5.8%, and 9.1% for serum Tg concentrations of 0.58, 11.6, and 200 ng/mL (μg/L), respectively. Within-run precision was 7.4%, 2.2%, and 5.3% at concentrations of 0.44, 2.2, and 151 ng/mL (μg/L), respectively.
Tg autoantibody (TgAb) radioassay
Each serum was screened for the presence of TgAb using the Kronus radioassay method (Boise, Idaho, USA). Between-run precision assessed over a 12-month period was 9.2%, 6.6%, and 14.7% for concentrations of 2.4, 6.6, and 14.7 kU/L, respectively. Within-run precision was 3.9%, 1.9%, and 2.2% at concentrations of 2.3, 5.9, and 20.9 kU/L, respectively. Tests having serum TgAb ≤0.5 kU/L were eliminated from the study.
TSH
TSH was measured using the third-generation Elecsys 2010 electrochemiluminescent method (Roche Diagnostics, Indianapolis, ID) with a functional sensitivity of 0.01 mIU/L (19). Between-run precision assessed over a 2-year period was 5.0%, 1.9%, 2.4%, and 2.1% for serum TSH concentrations of 0.05, 1.6, 6.6 and 34.0 mIU/L, respectively. Within-run precision was 4.0%, 0.9%, 0.9%, and 0.8% at concentrations of 0.05, 1.6, 6.6, and 74 mIU/L, respectively.
Human anti-mouse antibodies/heterophilic antibodies
Human anti-mouse antibodies (HAMA) interference was suspected in 32/1034 (3.1%) of the tests in which the b-Tg measured by IMA-1 was above 0.05 ng/mL (μg/L) and the rhTSH-Tg response appeared blunted (<1.5-fold b-Tg) (31 –33). Tests suspected of having HAMA interference had b-Tg remeasured in the Scantibodies blocker tube (Santee, CA, USA). In three cases the b-Tg specimen was insufficient and an archived b-Tg specimen from the patient drawn within 1 year of the rhTSH test was checked for HAMA. Five of 1034 (0.48%) tests were eliminated from the study because serum Tg was reduced by more than 20% when rerun in the blocker tube, indicating likely HAMA interference. The b-Tg values of the HAMA-positive tests were 8.2, 0.08, 7.7, 1.1 and 3.6 ng/mL (μg/L) before treatment and 0.09, 0.01, 1.1, 0.29, and 0.38 ng/mL (μg/L), respectively, after blocker tube treatment. Note that in two cases two treatments were necessary to reduce the false-positive values (8.2→1.8→0.10 and 3.6→1.7→0.38 ng/mL [μg/L]).
Specimens
Paired serum specimens for Tg testing from 1029 consecutive rhTSH tests (a baseline plus a 72-hour post-rhTSH serum) received by the laboratory between 2000 and 2008 were evaluated. Only TgAb-negative tests with a basal TSH below 4.5 mIU/L were included in the study. The serum Tg concentrations from each test were initially measured using the laboratory's current method (IMA-3 during 2000–2006 and IMA-1 for 2006-current). As this laboratory routinely archives (−20°C) all residual specimen remaining after Tg testing, it was possible to remeasure all archived specimens using the IMA-1 method after it was adopted in 2006. Previous studies had established that Tg and TgAb measurements made on frozen specimens stored for over 10 years were stable (14,34).
Statistical analyses
Basic statistical functions were performed using Xlstat software and Wilcoxan tests. An analysis of index of individuality (IoI) was performed using a Cochran test for within-subject variances on log-transformed data using the Reed criterion to identify outliers among within-patient means (35).
Results
Second-generation b-Tg versus rhTSH-Tg correlations
Figure 1 shows that linear correlations between b-Tg and rhTSH-Tg values were seen with both the IMA-1 and IMA-3 methods for b-Tg concentrations ranging up to 1000 ng/mL (μg/L) (IMA-1, r = 0.85, p < 0.001; IMA-3, r = 0.82, p < 0.001) when measured within the reportable ranges for the respective assays. No significant correlations were observed between b-Tg values obtained by either of these assays as related to age (p = 0.10), sex (p = 0.85), basal TSH (p = 0.74), or stimulated TSH levels (p = 0.58). There was also no relationship seen between b-Tg and the Tg fold response (rhTSH-Tg/b-Tg) that averaged 8.3 ± 0.5 (standard error) (p = 0.36). Table 1 grouped the 1029 rhTSH test results according to the IMA-1 b-Tg levels, whereas Figure 2 displays corresponding individual data for these tests. Note that only 2/494 (0.4%) of tests with a b-Tg below the functional sensitivity limit of 0.05 ng/mL (μg/L) produced rhTSH-Tg responses between 1.0 and 2.0 ng/mL (μg/L), and no test subject with b-Tg below 0.05 ng/mL (μg/L) had rhTSH-Tg response above 2.0 ng/mL (μg/L). When b-Tg ranged between 0.05 and 0.10 ng/mL (μg/L), 8/161 (5.0%) had rhTSH-Tg results between 1.0 and 2.0 ng/mL (μg/L) and only 2/161 (1.2%) was above 2 ng/mL (2.9 and 3.8 ng/mL [μg/L], respectively). Thus, overall only 2/655 (0.3%) tests with b-Tg below 0.1 ng/mL (μg/L) had positive rhTSH-Tg test results above the cut-off of 2.0 ng/mL (μg/L)—the threshold that is considered to be of clinical relevance regarding risk for persistent/recurrent disease (7 –9). The percentage of patients with positive rhTSH responses rose with increasing b-Tg levels, until all tests with a b-Tg above 1.0 ng/mL (μg/L) produced responses above 2.0 ng/mL (Table 1 and Figure 2).

(
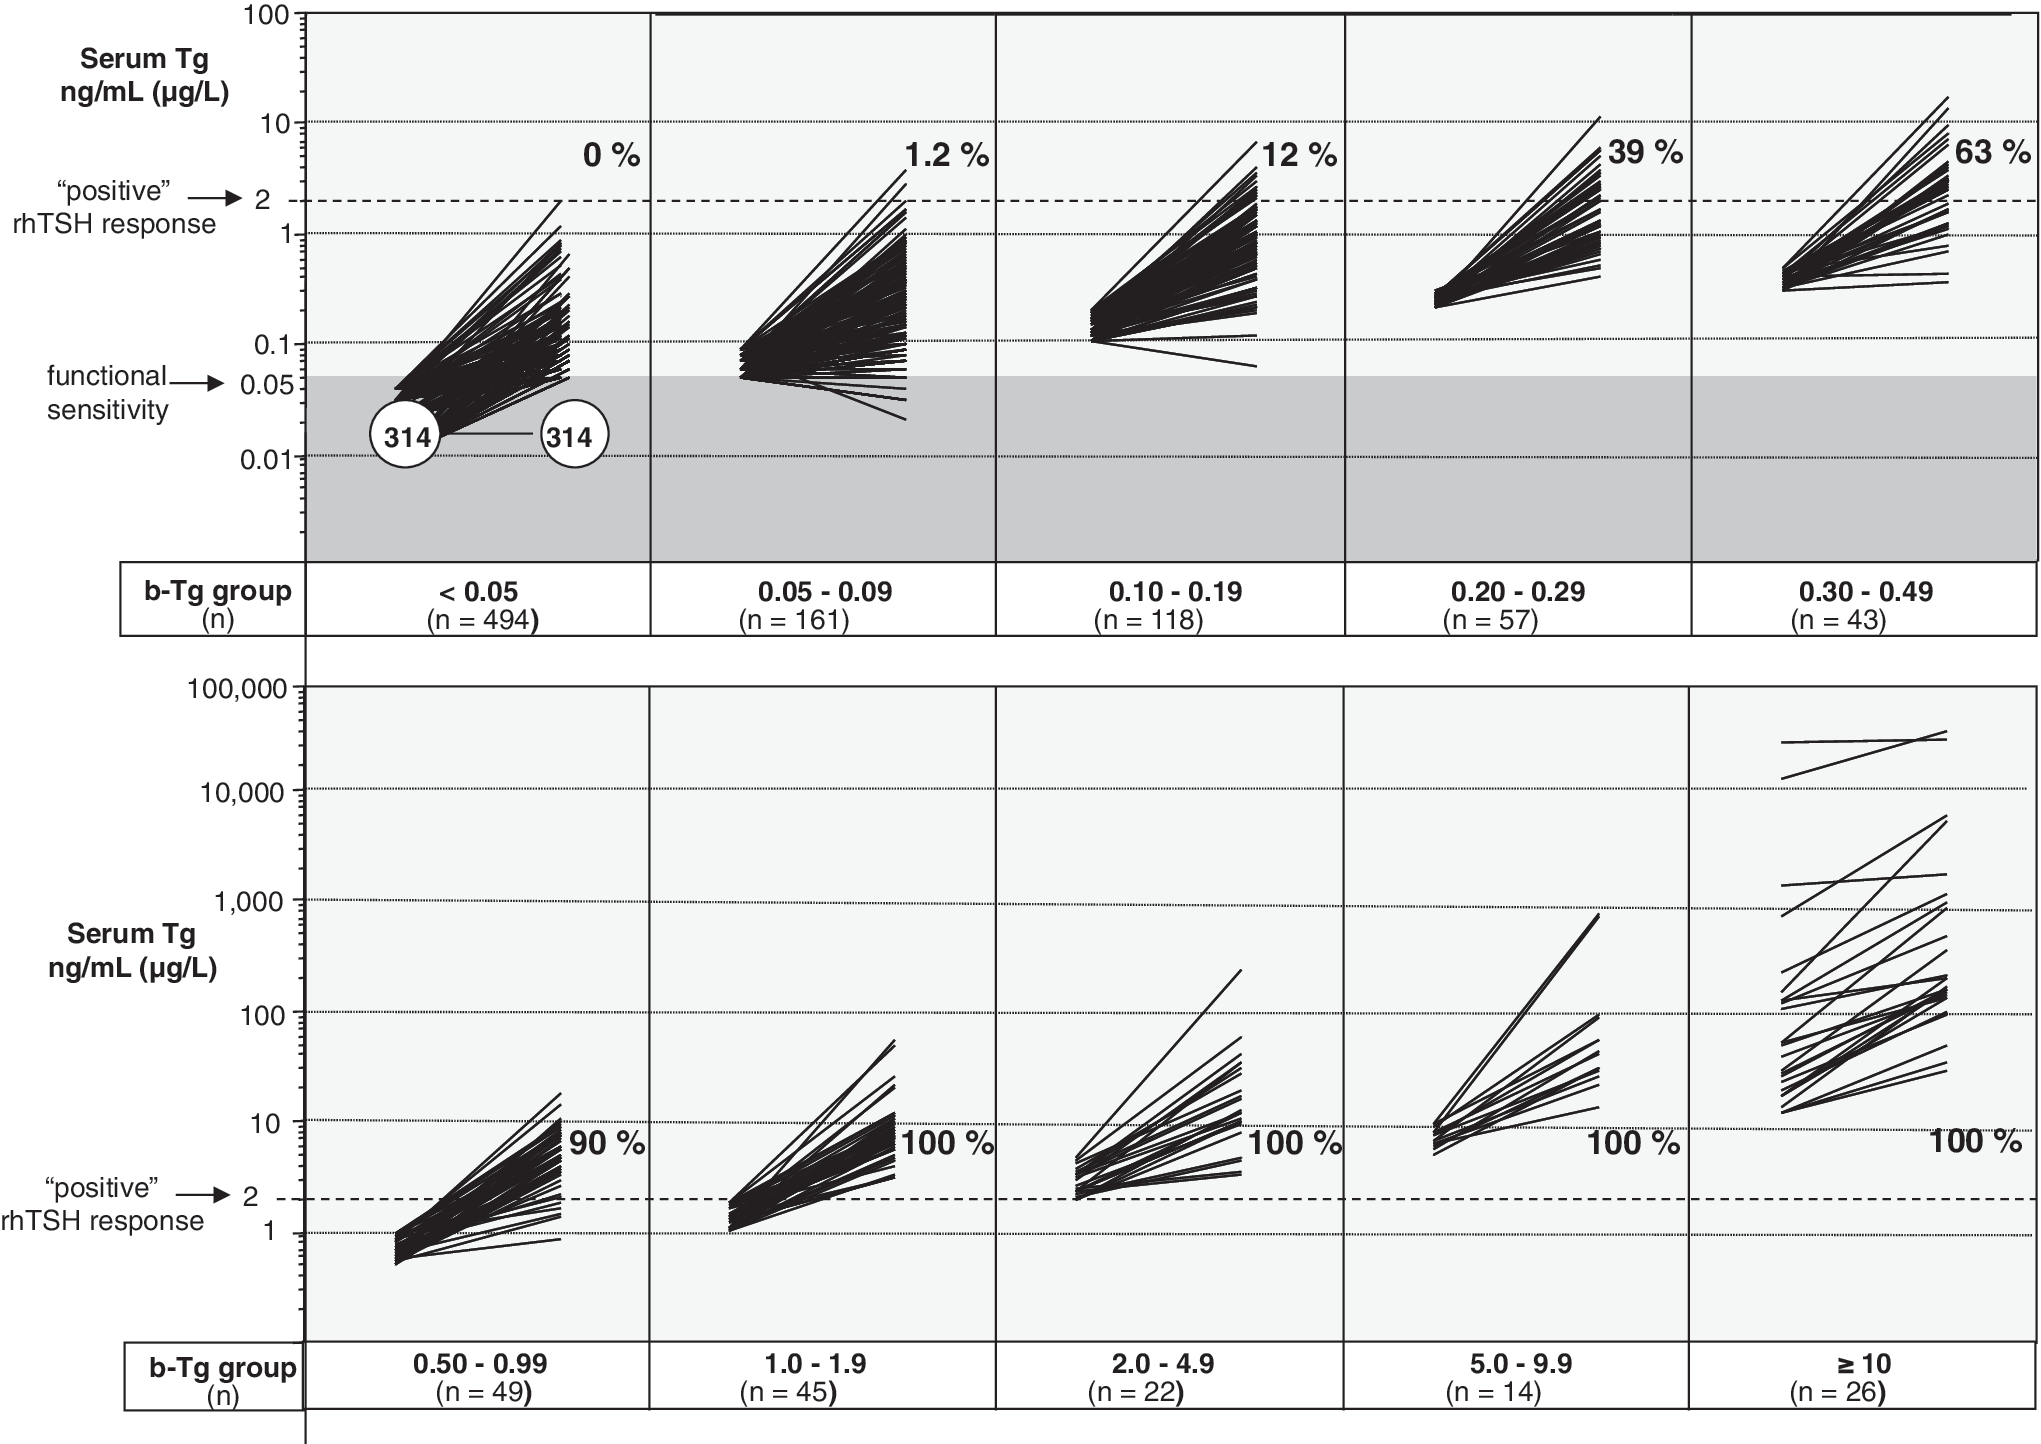
b-Tg versus rhTSH-Tg values for the 1029 individual rhTSH tests measured by the second-generation method (IMA-1), grouped according to the b-Tg concentration shown in Table 1. The dark shading indicates measurements that were below the assay functional sensitivity limit of 0.05 ng/mL (μg/L). Each group shows the percent of tests that had rhTSH-Tg above the customary cut-off of 2.0 ng/mL (μg/L).
Second-generation versus first-generation assay b-Tg measurements
Overall, there was a close correlation seen between rhTSH-Tg values measured by the second-generation (IMA-1) versus the first-generation (IMA-2) methods when rhTSH-Tg was detectable by both assays (>0.9 ng/mL [μg/L]) (r = 0.97, p = 0.001). This is graphically portrayed in Figure 3, which contrasts IMA-1 with IMA-2 measurements made on 104 negative and 87 positive rhTSH tests (when tests were classified using IMA-1 and an rhTSH-Tg cutoff of 2.0 ng/mL [μg/L]). However, b-Tg measured by IMA-2 did not reliably predict the rhTSH-Tg response because of sensitivity limitations. Specifically, Figure 3a shows that when using the first-generation IMA-2, 17/104 (16%) had an undetectable b-Tg (below 0.9 ng/mL [μg/L]) yet a positive rhTSH-Tg response. Conversely, as shown in Figure 3b, 60/87 (69%) of positive tests had an undetectable first-generation b-Tg, 30% of which had an rhTSH-Tg signal even below the instrumentation limit of 0.2 ng/mL (μg/L).
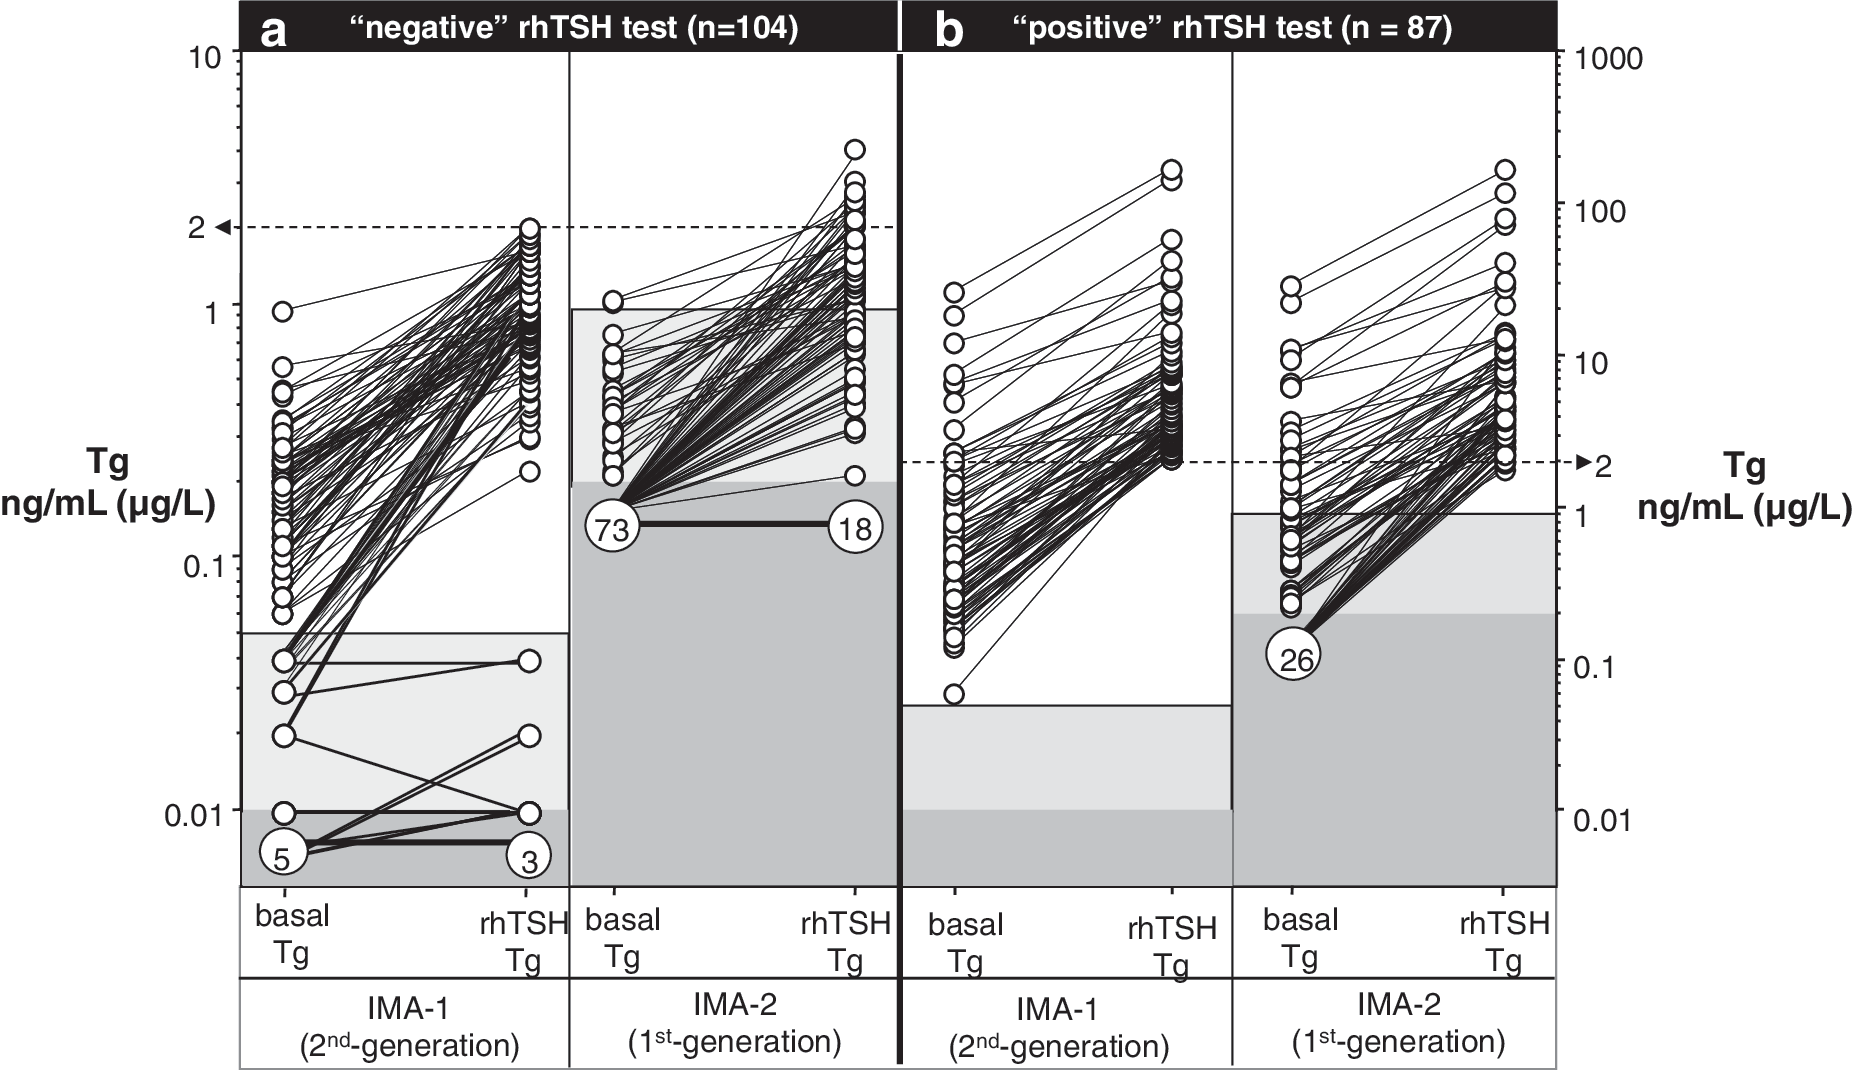
rhTSH test responses measured by the second-generation IMA-1 versus the first-generation IMA-2 methods. Tests were classified as negative (
Reproducibility of the Tg fold response (rhTSH-Tg/b-Tg) with repetitive testing
The results of repetitive rhTSH-Tg-Tg testing are shown in Figure 4. Thirty-three patients had three or more tests measured by IMA-1 over a time span that averaged 4.2 ± 1.7 (standard deviation) years. All of these tests had b-Tg above 0.05 ng/mL (μg/L). Twenty-two patients had three tests, seven patients had four tests, three patients had five tests, and one patient had seven tests. An analysis of these data revealed a high IoI for both the stimulated (72-hour) TSH concentration (IoI = 0.30) and the Tg fold response (rhTSH-Tg/b-Tg) measured using either the IMA-1 (IoI = 0.38; Fig. 3) or the IMA-3 method (IoI = 0.48; data not shown). This characteristic of individuality (IoI) was most dramatically illustrated by an remarkable case in which the b-Tg fell from 243 to 1.3 ng/mL (μg/L) between two tests performed 8 months apart with no change in the Tg fold response (5.5 vs. 5.2, respectively).
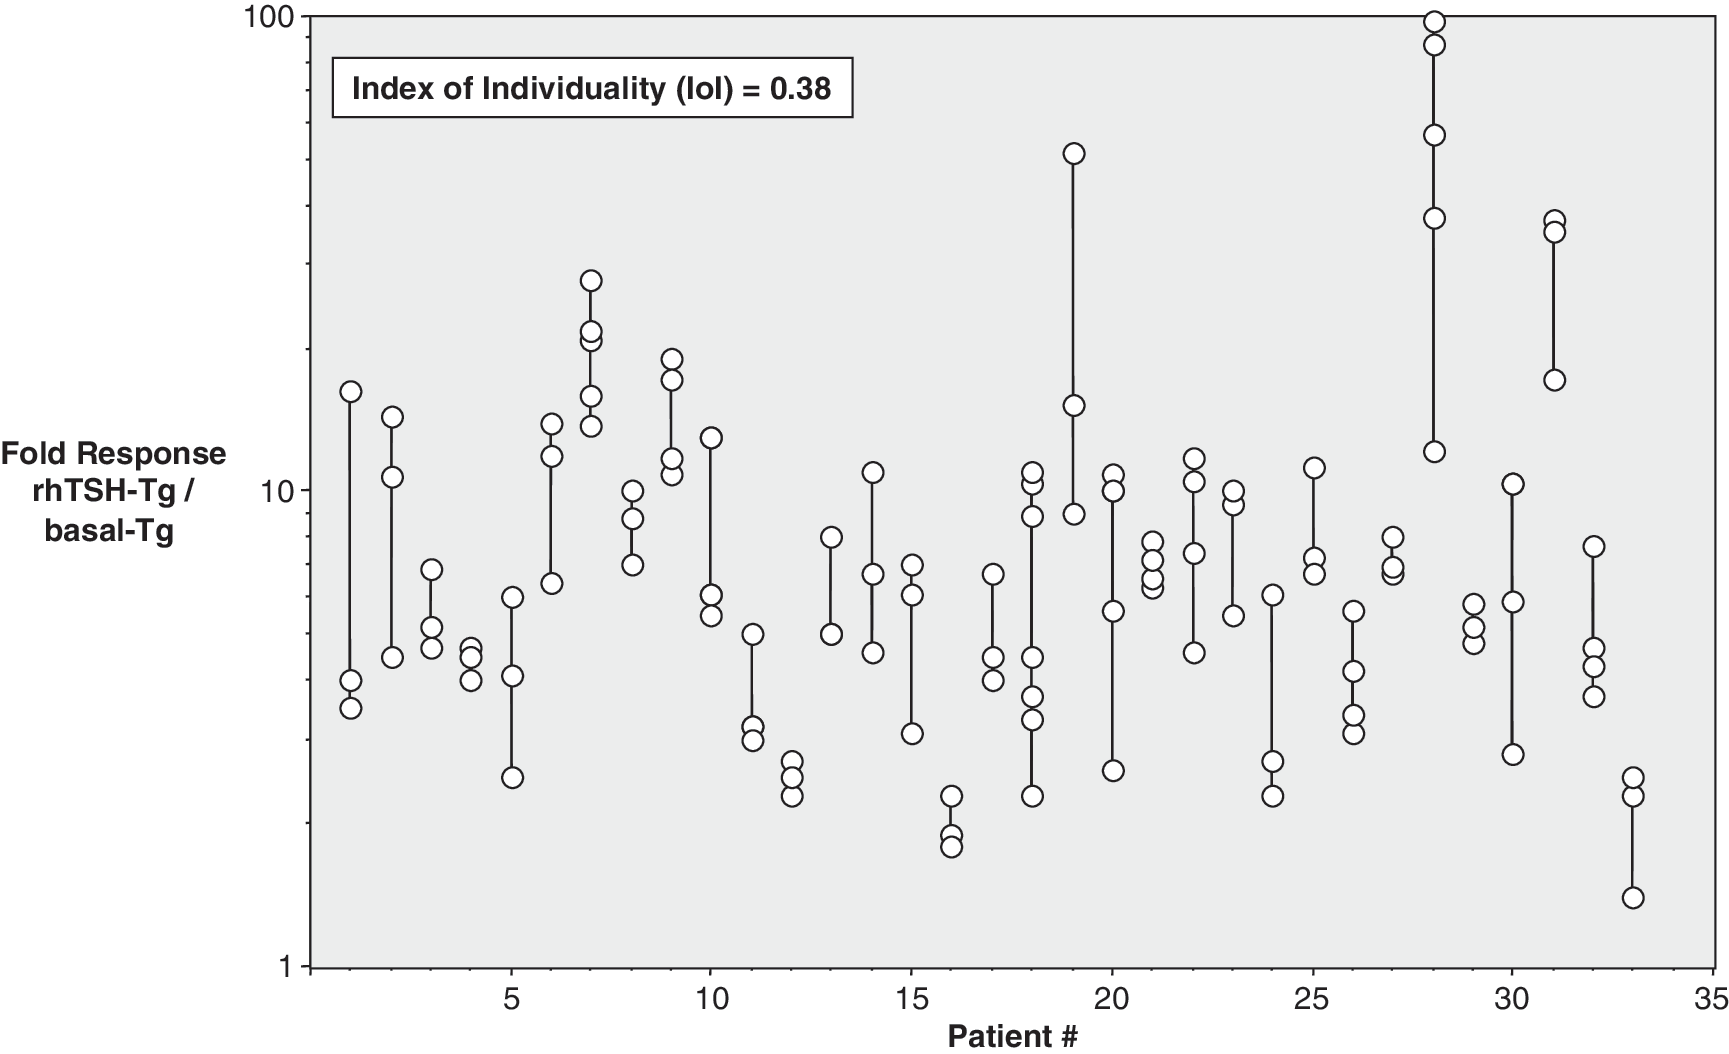
The log Tg fold responses (rhTSH-Tg/b-Tg) measured by the second-generation IMA-1 method for repetitive tests made on 33 patients.
Applying the rhTSH-Tg fixed cut-off of 2.0 ng/mL (μg/L) to different methods
The USC RIA method had originally been used in establishing the rhTSH-Tg cut-off of 2.0 ng/mL (μg/L) as a risk factor for disease (10). This cut-off value has subsequently been widely adopted in the management of DTC (7
–9,11,12). To determine whether the same cut-off should be applied to other methods, correlations were made between Tg measured by the RIA versus three IMA methods using more than 80 DTC specimens having Tg RIA values between 1 and 40 ng/mL (μg/L). Excellent correlations were found between the RIA and all three IMA methods: IMA-1 Tg = 0.86 × RIA Tg + 0.21; r = 0.96 IMA-2 Tg = 1.41 × RIA Tg − 1.3, r = 0.89 IMA-3 Tg = 1.59 × RIA Tg + 0.04, r = 0.97
From the regression equations it was determined that a Tg RIA value of 2.0 ng/mL (μg/L) was equivalent to 1.93 ng/mL (μg/L) when using IMA-1; 1.52 ng/mL (μg/L) when using IMA-2, but 3.22 ng/mL (μg/L) when using IMA-3.
Discussion
The use of a second-generation Tg assay to measure rhTSH-Tg concentrations revealed a number of important new insights regarding employing this procedure for monitoring the clinical status of patients with a history of DTC. The rhTSH-Tg response appears to be remarkably predictable when related to b-Tg concentrations extending down to 0.05 ng/mL (μg/L). In other words, the rhTSH-Tg response appears to form a continuum of predictable results when considered in terms of the b-Tg observed before rhTSH administration. It is also important to note that despite the improved assay sensitivity afforded by the second-generation Tg assay, 64% of the tests had b-Tg values below 0.1 ng/mL (μg/L) and yet only 2/655 (0.3%) of such tests had an rhTSH-Tg response above 2.0 ng/mL (μg/L) These findings are in accordance with previous reports that an undetectable second-generation b-Tg predicts an rhTSH response below 2.0 ng/mL (μg/L) with a high degree of confidence and a high negative predictive value (∼95%) for the absence of persistent/recurrent disease (15,17 –19,36,37). Further, the observation that 12% of the tests with b-Tg in the 0.10–0.19 ng/mL (μg/L) range had rhTSH-Tg above 2.0 ng/mL (μg/L) indicates that second-generation functional sensitivity is the minimum requirement for predicting a negative rhTSH response from an undetectable b-Tg. This was emphasized by this study showing that an undetectable b-Tg measured by a first-generation assay (IMA-2) did not reliably predict a negative rhTSH response. In summary, it thus appears that the employment of a second-generation Tg assay clearly improves the reliability of b-Tg measurement and the detection of rhTSH-Tg stimulated Tg responses.
The fold Tg response to rhTSH stimulation (rhTSH-Tg/b-Tg) was independent of b-Tg. No blunting of the Tg fold response at high b-Tg concentrations was seen, suggesting that most tumors were well differentiated. The Tg fold response also demonstrated high within-person reproducibility in patients who received repetitive testing. This was not an unexpected finding in view of previous studies showing that the magnitude of the TSH response relates to a variety of tumor characteristics (38 –40). It also strongly implies that repetitive rhTSH testing during long-term monitoring of DTC patients may be unnecessary in that it provides little additional information beyond that provided by the initial test result (37,38,41,42). The within-person reproducibility of the Tg fold response also suggests that TSH-stimulated Tg is determined by patient-specific factors such as the TSH responsiveness of Tg-producing tissue. This conclusion is supported by studies showing that the magnitude of the Tg fold response appears to be influenced by tumor histology (papillary > follicular > Hurthle > poorly differentiated) (40,43). Despite these previous observations, further studies will most likely be needed to determine whether the magnitude of the Tg fold response has any important diagnostic or prognostic value. Hopefully, the employment of a second-generation Tg assay under carefully controlled conditions may afford such an opportunity.
In the present study, the magnitude of the rhTSH-Tg test response was found to be unrelated to patient sex, age, basal TSH, and the 72-hour TSH level. It is likely that the standard rhTSH test protocol (two 0.9 mg rhTSH doses on consecutive days) saturates TSH receptors and elicits a maximal Tg fold response (rhTSH-Tg/b-Tg) that relates to the TSH sensitivity of any normal remnant and/or tumor tissue (40). This analysis is consistent with a previous rhTSH dosing study that reported that a single 0.9 mg rhTSH dose when administered to normal euthyroid subjects produced a maximal Tg response that approximated a 10-fold rise, which is remarkably similar to the mean of 8.3 seen with the current study (44). Basal Tg concentrations reflect the mass of Tg producing tissue, any thyroid injury, and the degree of TSH receptor stimulation (22). It follows that in the absence of TSH stimulation or thyroid injury secondary to surgery, biopsy, or radioiodine therapy, the trend in serial b-Tg measurements would be expected to provide the most direct indicator of changes in tumor mass. The superior between-run precision afforded by second-generation measurement would be expected to optimize the value of using b-Tg trend for monitoring changes in tumor mass, especially when tumors secrete low levels of Tg and/or are poorly responsive to TSH (40,45). Further, monitoring trends in b-Tg would overcome the method dependence of using fixed cut-off criteria, as revealed by this and other studies (14,15).
There are several aspects of the present study concerning both strengths and weaknesses in study design that should be mentioned. First, this investigation was not undertaken as a prospective study but rather represented an analysis of a large collection of test results performed by over 200 different physicians practicing throughout the United States in primarily community-based practices obtained over a 10-year period. On one hand, this limits the amount of specific clinical information that was available for analysis; on the other hand, it provides representative rhTSH-Tg testing data that would be typically encountered in clinical practice. Although the majority (∼80%) of these patients displayed a suppressed serum TSH (<0.3 mIU/L) before rhTSH administration, a minority of this population did not. Again, this is representative of the vagaries commonly encountered in clinical practice. However it was not possible to determine how the degree and chronicity of basal TSH suppression influenced b-Tg or rhTSH-Tg responsiveness. The optimal degree of TSH suppression required to achieve reproducible b-Tg levels in patients during long-term follow-up after near-total thyroidectomy for DTC is a focus of current studies.
In conclusion, a strong linear correlation was found between b-Tg and rhTSH-Tg values extending down to 0.05 (μg/L). When b-Tg was below 0.1 ng/mL (μg/L) a positive rhTSH-Tg above 2.0 ng/mL (μg/L) was very unlikely (0.3%). These findings suggest that the routine use of rhTSH-Tg testing appears not to provide any additional diagnostic or prognostic benefit above that of measuring b-Tg levels alone in patients with DTC, especially given the reproducibility of the Tg fold response (rhTSH-Tg/b-Tg) in individual patients receiving repetitive testing. It should be particularly noted that if routine rhTSH-Tg testing were eliminated based on this rationale, it would significantly reduce both the cost and inconvenience experienced by DTC patients as well as greatly simplify the monitoring process required by the attending physician. The enhanced sensitivity of second-generation Tg measurements not only optimizes the use of serum b-Tg trends for long-term monitoring of DTC patients but also overcomes the assay dependence of using a fixed Tg cut-off value as a risk factor for disease.
Footnotes
Acknowledgments
The authors wish to thank Maggi Kazarosyan, Ivana Petrovic, and Livia Wei for excellent technical support and Colleen Azen for performing the statistical analyses.
Disclosure Statement
None of the authors report any potential conflicts of interest with entities directly related to the material being published.