
Abstract
Background:
Thyrotropin (TSH) changes in extreme primary hypothyroidism include increased secretion, slowed degradation, and diminished or absent TSH circadian rhythms. Diminished rhythms are also observed in central hypothyroid patients and have been speculated to be a cause of central hypothyroidism. We examined whether TSH secretion saturation, previously suggested in extreme primary hypothyroidism, might explain diminished circadian rhythms in both disorders.
Methods:
We augmented and extended the range of our published feedback control system model to reflect nonlinear changes in extreme primary hypothyroidism, including putative TSH secretion saturation, and quantified and validated it using multiple clinical datasets ranging from euthyroid to extreme hypothyroid (postthyroidectomy). We simulated central hypothyroidism by reducing overall TSH secretion and also simulated normal TSH secretion without circadian oscillation, maintaining plasma TSH at constant normal levels. We also utilized the validated model to explore thyroid hormone withdrawal protocols used to prepare remnant ablation in thyroid cancer patients postthyroidectomy.
Results:
Both central and extreme primary hypothyroidism simulations yielded low thyroid hormone levels and reduced circadian rhythms, with simulated daytime TSH levels low-to-normal for central hypothyroidism and increased in primary hypothyroidism. Simulated plasma TSH showed a rapid rise immediately following triiodothyronine (T3) withdrawal postthyroidectomy, compared with a slower rise after thyroxine withdrawal or postthyroidectomy without replacement.
Conclusions:
Diminished circadian rhythms in central and extreme primary hypothyroidism can both be explained by pituitary TSH secretion reaching maximum capacity. In simulated remnant ablation protocols using the extended model, TSH shows a more rapid rise after T3 withdrawal than after thyroxine withdrawal postthyroidectomy, supporting the use of replacement with T3 prior to 131I treatment.
Introduction
We address these issues here by augmenting and extending a human TH feedback control system simulation model (13,14) into the extreme hypothyroid range, supported by human data in this range. We examine whether saturation of TSH secretion, previously suggested in extreme primary hypothyroidism (6), might explain diminished circadian rhythms in both disorders. We also explore potential effects of these putative changes in TSH secretion and elimination mechanisms on TH remnant ablation protocols used in thyroid cancer patients, again with the aid of the extended simulator. After thyroidectomy for differentiated thyroid cancer, patients are typically given levothyroxine (
Methods
Brain submodel refinements in extreme primary hypothyroidism
The original model (13,14) (equations given in Appendix 1) was developed and quantified from human data reflecting mild to moderate hyper- and hypothyroid as well as normal states. It includes nonlinearities depicting enzymatic and protein-binding changes over the spectrum of normal and abnormal thyroid ranges. The brain submodels, however, were not developed for more extreme dynamic ranges. We augment and extend the model here to incorporate altered TSH dynamics in extreme hypothyroidism, including D2 upregulation and type 3 deiodinase (D3) downregulation in brain, nonlinear TSH degradation, and TSH saturation-based changes in circadian rhythms. Some model rate “constant” parameters have different values at the extremes of hormone level ranges. We represent these parameters over their entire dynamic range by defining nonlinear functions that match values at the extremes and transition smoothly between them. This approach maintains the form of the original model equations, with minimal additional model complexity, consistent with conventional receptor dynamical changes (e.g., receptor saturation) anticipated under abnormal conditions. We validate the expanded model in this broader range using additional clinical data.
Brain D2 upregulation
D2 expression in brain is upregulated in hypothyroidism (2,19,20). To accommodate this, we adjusted k 4, the constant rate parameter representing combined effects of plasma T4 transport into brain and conversion to T3 inside brain cells. With D2 upregulated, we expect k 4 to increase in hypothyroidism. We show in Appendix 2 that k 4 goes from k 4 ≈ k 3 in euthyroids (where k 3 is the T3 transport rate into the brain) to k 4 ≈ 6k 3 in extreme hypothyroidism, based on data in rats and humans (3 –5,21 –25). To bridge these two ranges, we replaced the parameter k 4 with a smooth sigmoid transition function, designated f 4(T 3B) in Eq. [3] below, between the euthyroid/normal range of brain T 3 (denoted T 3B) and the extreme hypothyroid/thyroidectomized range. The relationship for f 4 varying with T 3B is derived in Appendix 2 and shown in Figure A2.
Brain D3 downregulation and TSH secretion
D3 is expressed in brain, with an inverse relationship between D3 activity and T 3 content demonstrated in various human cerebral regions (26). D3 is known to be downregulated in hypothyroidism, yielding slower brain T3 degradation in extreme hypothyroidism (19). It has been also suggested that, in extreme hypothyroidism, the pool of TSH in the anterior pituitary available for secretion is drained more rapidly, so that TSH becomes less able to respond to rapid stimulation (3). The combined effects of both processes are represented as a “lag” in T 3B effects,† denoted T 3BLAG(t), depicted in Eqs. [2] and [3] below. We quantified the lag time for this modified brain submodel in extreme hypothyroidism from human data in extreme hypothyroid patients (15), as described below.
Extreme-hypothyroid data
Hilts et al. (15) tested 13 patients 1–12 years after they were thyroidectomized and treated with 131I for remnant ablation, following a T3-only replacement protocol. Patients were switched from their usual T4 replacement to 75–100 μg T3 daily for 4 weeks, at which point T3 therapy was discontinued. TSH was sampled over various intervals for each patient over the following 35 days, although sufficient samples for quantitative analysis were reported only for the first 15 days (15).
The new TSH secretion portion of the brain submodel, modified to include the above changes in D2 and D3, is given by the following three equations (Eq. [2] here is new):
All variables SRTSH, T 3BLAG, T 4P, T 3B, and T 3P are functions of time t, that is, T 3BLAG ≡ T 3BLAG(t), etc. The new function f CIRC in Eq. [1] represents alternative hypotheses about diminished circadian rhythms in extreme hypothyroidism. These are described in detail in the next section and Appendix 1. SRTSH in Eq. [1] represents the secretion rate of TSH, including both basal and circadian components, damped by T 3BLAG · T 3BLAG in Eqs. [1] and [2] is the lagged version of T 3B(t), and f LAG is the function controlling the lag time, with values dependent on T 3B(t). We estimated the value of f LAG in the extreme-hypothyroid range by optimally fitting it to the corresponding extreme-hypothyroid data (15) [using the program SAAM II (27), as in refs. (13,14)]. We assumed the fraction of normal TH secretion remaining after thyroidectomy and remnant ablation (15) to be zero. To support this assumption, we also tested a range of residual secretions fractions up to 1%, with no significant changes in results. To represent the transition from little to no lag in euthyroidism to significant lag in extreme hypothyroidism, we use a smooth nonlinear sigmoid function for f LAG (T 3B) in Eq. [2], with details described in the Results section and Appendix 1.
Similarly, D2 effects on brain T4-to-T3 conversion in the extreme-hypothyroid range are represented by the coefficient f 4 ≡ f 4(T 3B) in the first term of Eq. [3], a sigmoidal function of T 3B derived in Appendix 2 and shown in Figure A2. This new function is used to shift smoothly between normal ( f 4 ≈ k 3) and extreme hypothyroid values ( f 4 ≈ 6k 3) of f 4.
Reduced TSH circadian rhythms: pituitary TSH saturation
TSH in normal human subjects shows a significant daily circadian rhythm, with a maximum near 2 a.m., and a daytime nadir. Normal circadian rhythm amplitude is ≥50% of daily mean TSH (7,28,29). In profound primary hypothyroidism, circadian rhythms are diminished (6 –8), although the mechanistic cause remains speculative.
One possibility is that circadian rhythm magnitude saturates (reaches a maximum), whereas basal TSH secretion continues to increase as TH levels fall. Thus the relative magnitude of the circadian variation compared with mean daily TSH would diminish until it becomes difficult to detect circadian variation compared with the larger magnitude of basal TSH. We denote this hypothesis as the saturating circadian rhythm (SCR) model, shown in purple in Figure 1.
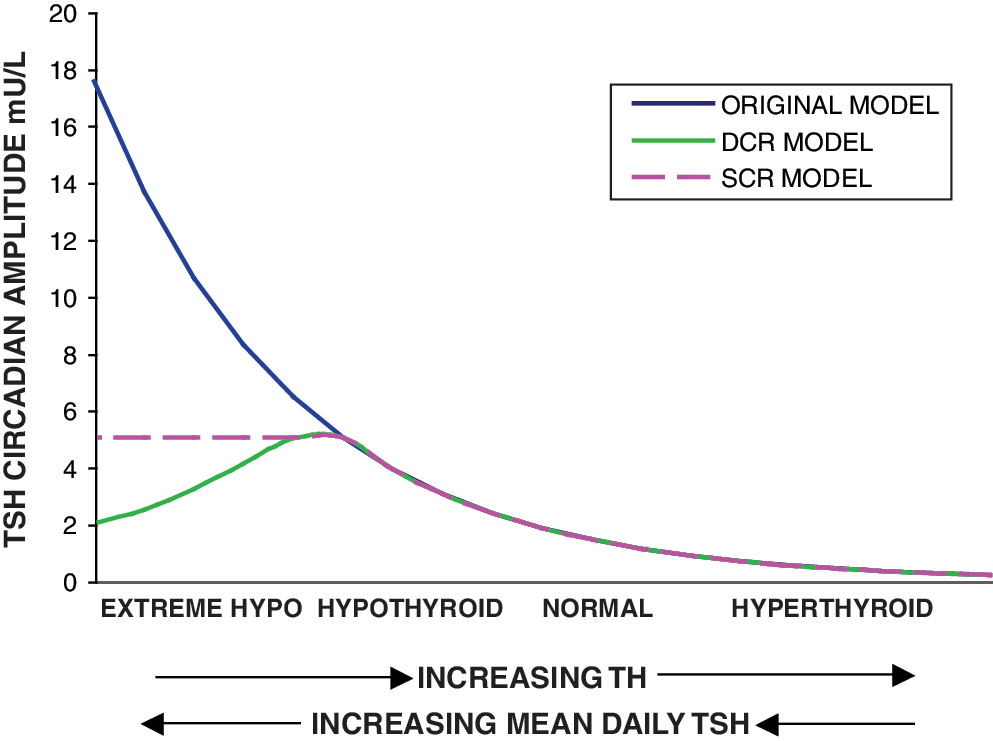
Three possible relationships between brain triiodothyronine (T3) and thyrotropin (TSH). Blue: original simulation model in which TSH circadian rhythms grow as thyroid hormone (TH) falls. Purple dashes: SCR model—TSH circadian rhythms saturate as TH falls/mean plasma TSH increases. Green: diminishing circadian rhythm (DCR) model—TSH circadian rhythms saturate around and then fall as TH falls. X-axis arrows indicate direction of increasing hormone concentration. Color images available online at
Alternatively, the magnitude of circadian oscillation may increase initially as TH levels fall (and basal TSH increases) in hypothyroidism and then fall with more extreme low TH values (high TSH values). A possible mechanism for explaining this phenomenon might be as follows. As TH levels fall, TSH secretion increases, until basal TSH secretion reaches maximum capacity, with all available TSH immediately secreted. Thus, signals to increase secretion for the nightly surge become ineffective, as TSH secretion is already saturated (has reached its maximum). This is supported by studies showing attenuation of the TSH response to TRH in hypothyroidism (30). This hypothesis is denoted the diminishing circadian rhythm (DCR) model, shown as dashed green curve in Figure 1. A similar hypothesis was suggested in ref. (6), with TSH circadian amplitude limited because the pituitary was “unable to increase the TSH production beyond its capacity.”
We define the TSH daily circadian range by the nighttime maximum TSH value minus the daytime nadir TSH value, and the TSH circadian rhythm amplitude by (daily circadian range)/2. We also use an alternative measure of circadian oscillation magnitude, average nighttime minus average daytime TSH, denoted the mean circadian difference (ΔTSH).
SCR model
To quantify the maximum TSH circadian amplitude (see purple curve in Fig. 1), we used two human clinical datasets. Weeke and Laurberg (8) studied six patients with severe hypothyroidism (basal TSH levels ranging from 35 to 96 mU/L), three with mild hypothyroidism, and five with treated severe hypothyroidism; Hirshberg et al. (7) studied 10 thyroidectomized patients preparing for radiotherapy, with basal TSH levels ranging from 42 to 156 mU/L. Hirshberg et al. measured a circadian range (max–min) of ≤10% of the daily mean/basal TSH level in extremely hypothyroid (thyroidectomized) patients. Average basal TSH among these 10 patients was 93.9 mU/L, suggesting a maximum TSH circadian range of ∼9.4 mU/L (daily fluctuation at most ± 4.7 mU/L about the basal value). This is consistent with Weeke and Laurberg's results, in which both severe and mildly hypothyroid patients stayed within this range and were also consistent with normal circadian amplitudes, typically ∼1–2 mU/L above/below the mean (daily circadian range of 2–4 mU/L). Based on these results, we implemented a maximum circadian amplitude of 5 mU/L, yielding a daily circadian range of 10 mU/L.
DCR model
This hypothesis is depicted by a green curve, which falls below the dashed purple curve in Figure 1. The literature is equivocal on the degree of circadian amplitude reduction. Some studies in hypothyroids report circadian rhythms in all patients (31), whereas others report mixed results, with some exhibiting no apparent rhythm (6 –8). This suggests that the decrease shown in Figure 1 probably varies from patient to patient. We model only population average behavior, based on this clinical data. Additionally, the SCR model incorporates a maximum TSH amplitude based on the same clinical data (6 –8) and acts as an upper bound for actual TSH circadian amplitude. Thus, alternative models of circadian rhythm decrease can be bounded by the SCR model.
Data for quantification
Adriaanse et al. (6) studied the difference between average day and nighttime TSH levels (mean circadian difference) in human subjects with varying degrees of hypothyroidism (Fig. 2). For normal controls they found mean TSH = 1.7 ± 0.7 (SD) mU/L with mean circadian difference of 1.0 ± 0.6 mU/L, and for subclinical hypothyroid patients, mean TSH = 10.5 ± 6.5 mU/L with mean circadian difference = 4.1 ± 2.5 mU/L (averages across 16 normals and 7 subclinical hypothyroids). Of the nine hypothyroid patients studied, only three demonstrated a detectable rhythm. Daily mean TSH among hypothyroids with detectable circadian rhythm was 73 ± 51 mU/L, and 266 ± 139 mU/L among patients with insignificant rhythm. The mean circadian difference for all nine hypothyroid patients was 3.9 ± 19 mU/L. Mean circadian differences for the two hypothyroid subgroups were not reported. If the mean circadian difference among the six patients with undetectable rhythm was less than 3 mU/L, then mean circadian difference among the three patients with detectable circadian rhythm must be at least 5.7 mU/L.‡
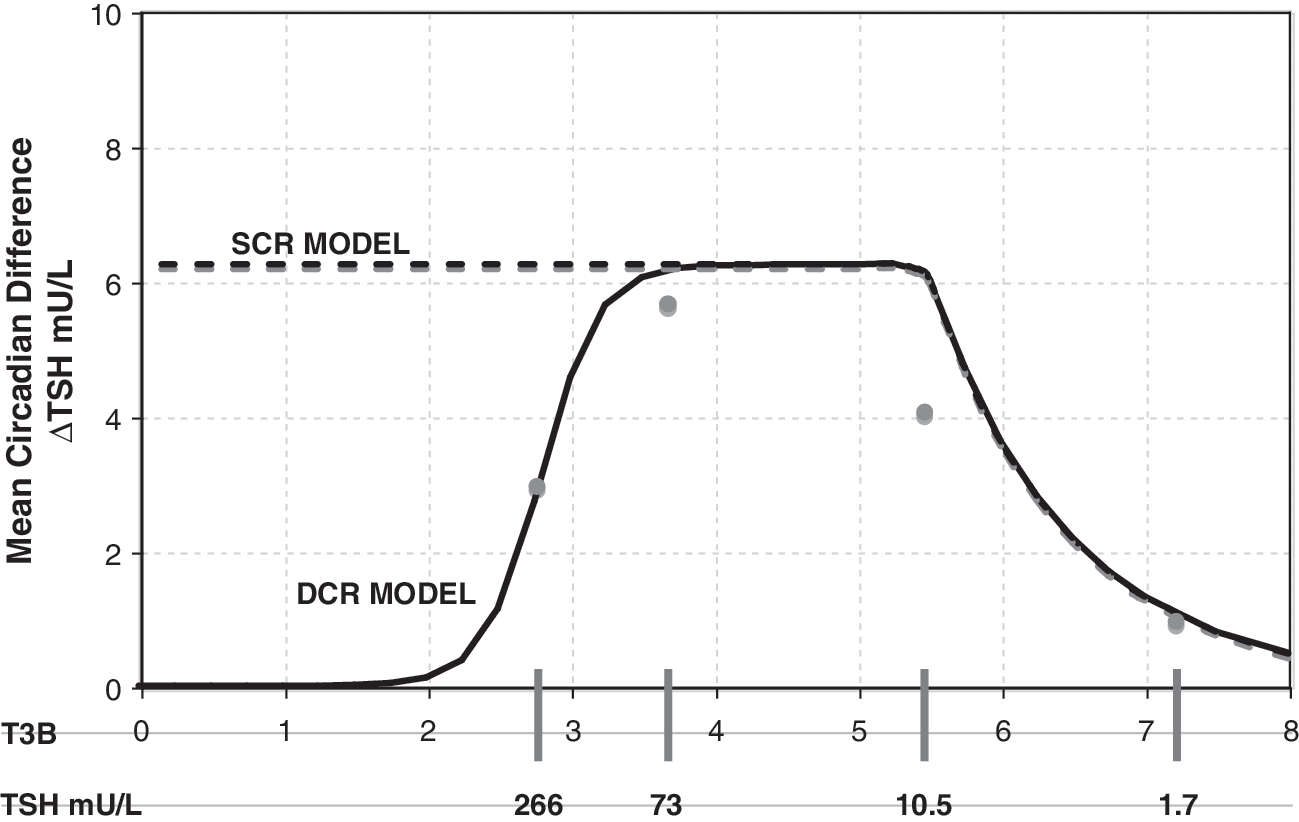
Mean circadian difference as a function of T 3B and plasma TSH. Circles represent clinical data (6). Solid line represents simulations using the DCR and dashed line the SCR model. DCR circadian amplitude reaches a limit of zero in complete saturation.
Using the maximum TSH amplitude determined in the SCR model above, we chose a diminishing function of T 3B, which approximately matched the data shown in Figure 2, that is, saturating at a maximal circadian amplitude of 5 (7,8), then decreasing to a mean circadian difference of ∼3 at 266 mU/L mean TSH. Derivations for the SCR and DCR models are given in Appendix 1.
TSH distribution and elimination
Under normal conditions, TSH disappearance from human plasma is well approximated as a single exponential with a half-life of ∼55 minutes (1,14,32), yielding
The V
maxTSH and
%CV = 100 × SD/mean.
TSH, thyrotropin; T3, triiodothyronine.
where we have abbreviated the function f degTSH in [5] as f degTSH(TSHP) ≡ f degTSH.
Simulation studies
Euthyroid range model verification
The brain submodel extensions described above were incorporated into the hypothalamic–pituitary–thyroid (HPT) axis model (13,14), including effects of D2 upregulation, D3 downregulation, and changes in TSH kinetics (distribution and elimination submodel). We validated its fidelity with these updated components by comparing model simulations with normal plasma TSH, T3, and T4 data and the pharmacokinetic (PK)
Primary hypothyroidism
We simulated primary hypothyroidism, with TH secretion rates ranging from 50% down to 0.01% of normal.
Pisa protocol simulations: model validation and predictions
Thyroidectomy of patients with differentiated thyroid cancer is typically followed by oral TH treatment, withdrawal, and 131I treatment to ablate thyroid remnants. A standard protocol is to withdraw normalizing oral

Pisa protocol for remnant ablation following thyroidectomy for differentiated thyroid cancer. A T3 kinetic study was superimposed on this protocol beginning on day 67.
Thyroidectomized patients scheduled for radionuclide imaging with 131I are switched from
Using the new HPT axis model, we fitted the simulated T3 and T4 remnant fractions, F
3 and F
4, to this kinetic study data, that is, the fractions of normal T
3 and T
4 secretion rates (SR3 and SR4) remaining postthyroidectomy, expressed as
Central hypothyroidism hypothesis testing
We simulated central hypothyroidism using both the updated model as well as the original HPT axis model (14), by setting overall TSH secretion rates to a range of values from 50% down to 0.01% of normal. To test the hypothesis that loss of circadian rhythmicity may cause hypothyroidism, we also simulated plasma TSH, T 3, and T 4 dynamics in response to a constant (nonoscillatory) TSH secretion rate, equal to the average rate of normal daily TSH secretion.
Results
Brain submodel refinements
The new brain submodel equations and quantified parameters are given in Appendix 1 and Table 1, along with data sources. They extend the model domain and range to extreme hypothyroidism.**
Brain D3 downregulation and TSH secretion
The simulated TSH(t) response, using the extreme hypothyroid TSH secretion equations [1]–[4], is shown fitted to human data from Hilts et al. (15) in Figure 4. This yielded extreme hypothyroid
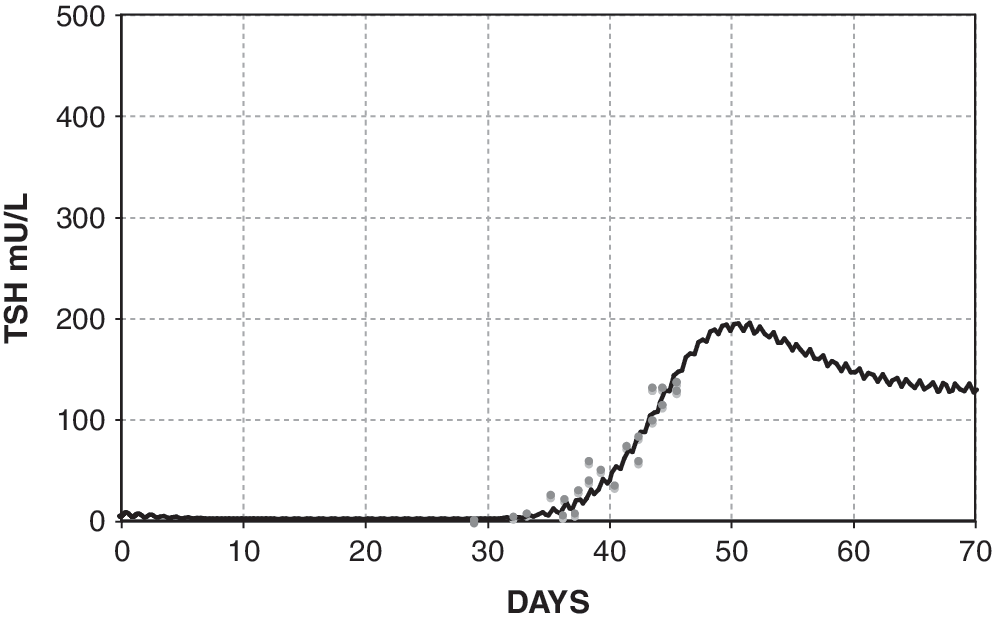
Fit to human data by Hilts et al. (15), yielding extreme hypothyroid
Reduced TSH circadian rhythms in extreme hypothyroidism
Parameters and equations for the SCR and DCR models are given in Table 1 and Appendix 1. Figure 5 shows a comparison of the SCR, DCR, and original brain submodel simulations of TSH in primary hypothyroidism, with TH secretion set to 0.2% of normal.

Simulated extreme hypothyroidism postthyroidectomy with 0.2% remaining TH secretion using the original model (top) (14), and SCR (middle) and DCR (bottom) models extended to the extreme-hypothyroid range. Original model shows exaggerated circadian rhythms, whereas circadian variation in the new models is restricted to at most ∼10 mU/L (SCR model) and further diminished with the DCR model.
Simulation studies
Model validation simulations with both SCR and DCR models were indistinguishable from our previous results in the euthyroid range (13,14). Euthyroid-range simulations of the PK
Primary hypothyroidism
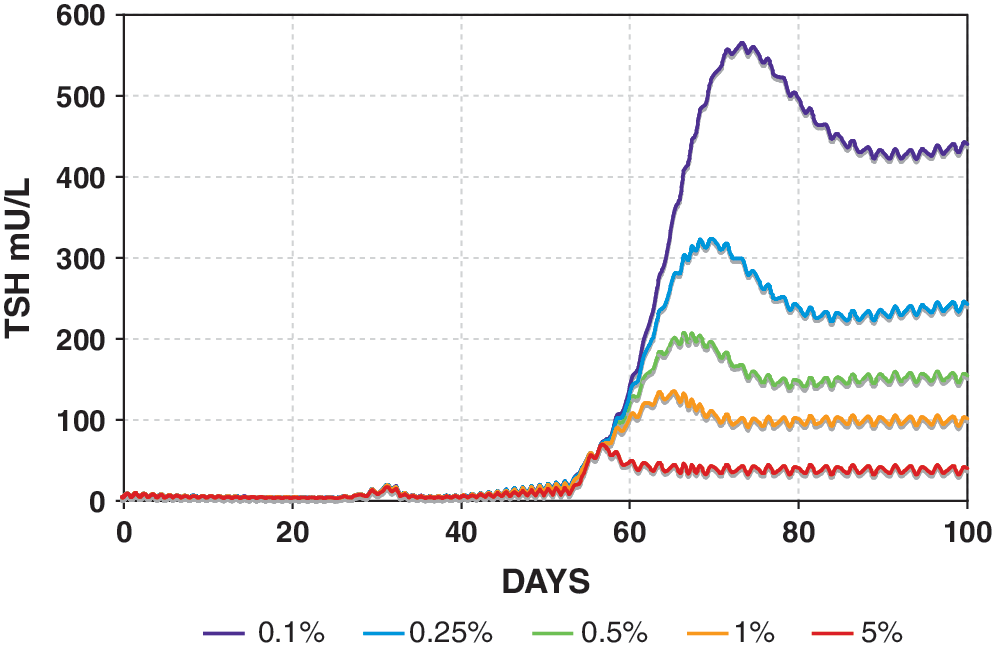
Simulated TSH dynamics in hypothyroidism postthyroidectomy is shown in graded fashion using the SCR model in Figure 6, with TH secretion rates (both SR3 and SR4) ranging from 100% down to 0.1% of normal. DCR model simulations were similar (not shown), but with somewhat further reduced circadian rhythms, for example, as in Figure 5.
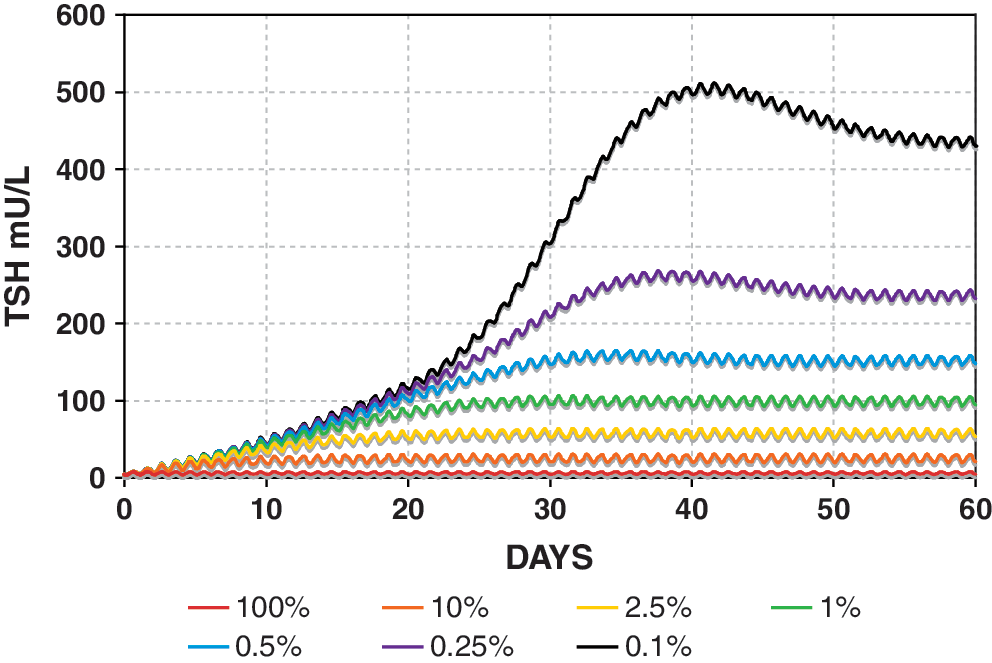
Range of simulated primary hypothyroidism postthyroidectomy using the SCR model. TH secretion rates (SR3 and SR4) range from 100% (red) down to 0.1% of normal (black). Color images available online at
Pisa protocol simulations
Our simulated results fit our human plasma T 3 kinetics data and (sparsely measured) TSH data values well, with patient data shown as circles and simulations shown as curves in Figure 7. Simulated plasma TSH(t) shows a rapid surge immediately following cessation of T3 replacement. Fitted T 3 and T 4 remnant fractions were F 3 = 0.0251 and F 4 = 0.0165 (Table 1). Additional Pisa protocol simulations with varying remnant fractions and lag parameter f LAG are shown in Figures 8 and 9, illustrating the interdependence of these two parameters.

Curves show simulated TSH(t), T3(t), and thyroxine(t) [T4(t)] in the Pisa protocol using the SCR model, with individual remnant fractions fitted to the data, yielding F 3 = 0.0251 and F 4 = 0.0165. Patient data from kinetic study are shown as circles. Inset graphs show detail of simulation versus pharmacokinetic study data following an oral dose of 20 μg T3 given on day 67. Remnant fraction is set to 0.02 (TH secretion rate is set to 2% of normal).

Varying
Remnant fraction determines simulated steady-state TSH level in the Pisa protocol (Fig. 3). Remnant fractions are set from 0.1% to 5%. Color images available online at
Central hypothyroidism
SCR model results are shown in Figure 10. Results with the DCR model were similar (not shown). Note that both absolute TSH circadian amplitudes and relative TSH circadian amplitudes (circadian amplitude as a percentage of mean daily TSH) decrease with the degree of central hypothyroidism, eventually disappearing in most severe cases. In contrast, using the original brain submodel (14), relative TSH circadian amplitudes did not decrease, remaining ∼50% of daily mean TSH for all levels. Using constant (nonoscillatory) normal mean daily TSH secretion, simulated plasma TSH, T 3, and T 4 reached constant, nonoscillatory, steady-state values in normal ranges: TSHP = 3.86 mU/L, T 3P = 1.34 ng/mL, T 4P = 6.68 μg/dL.
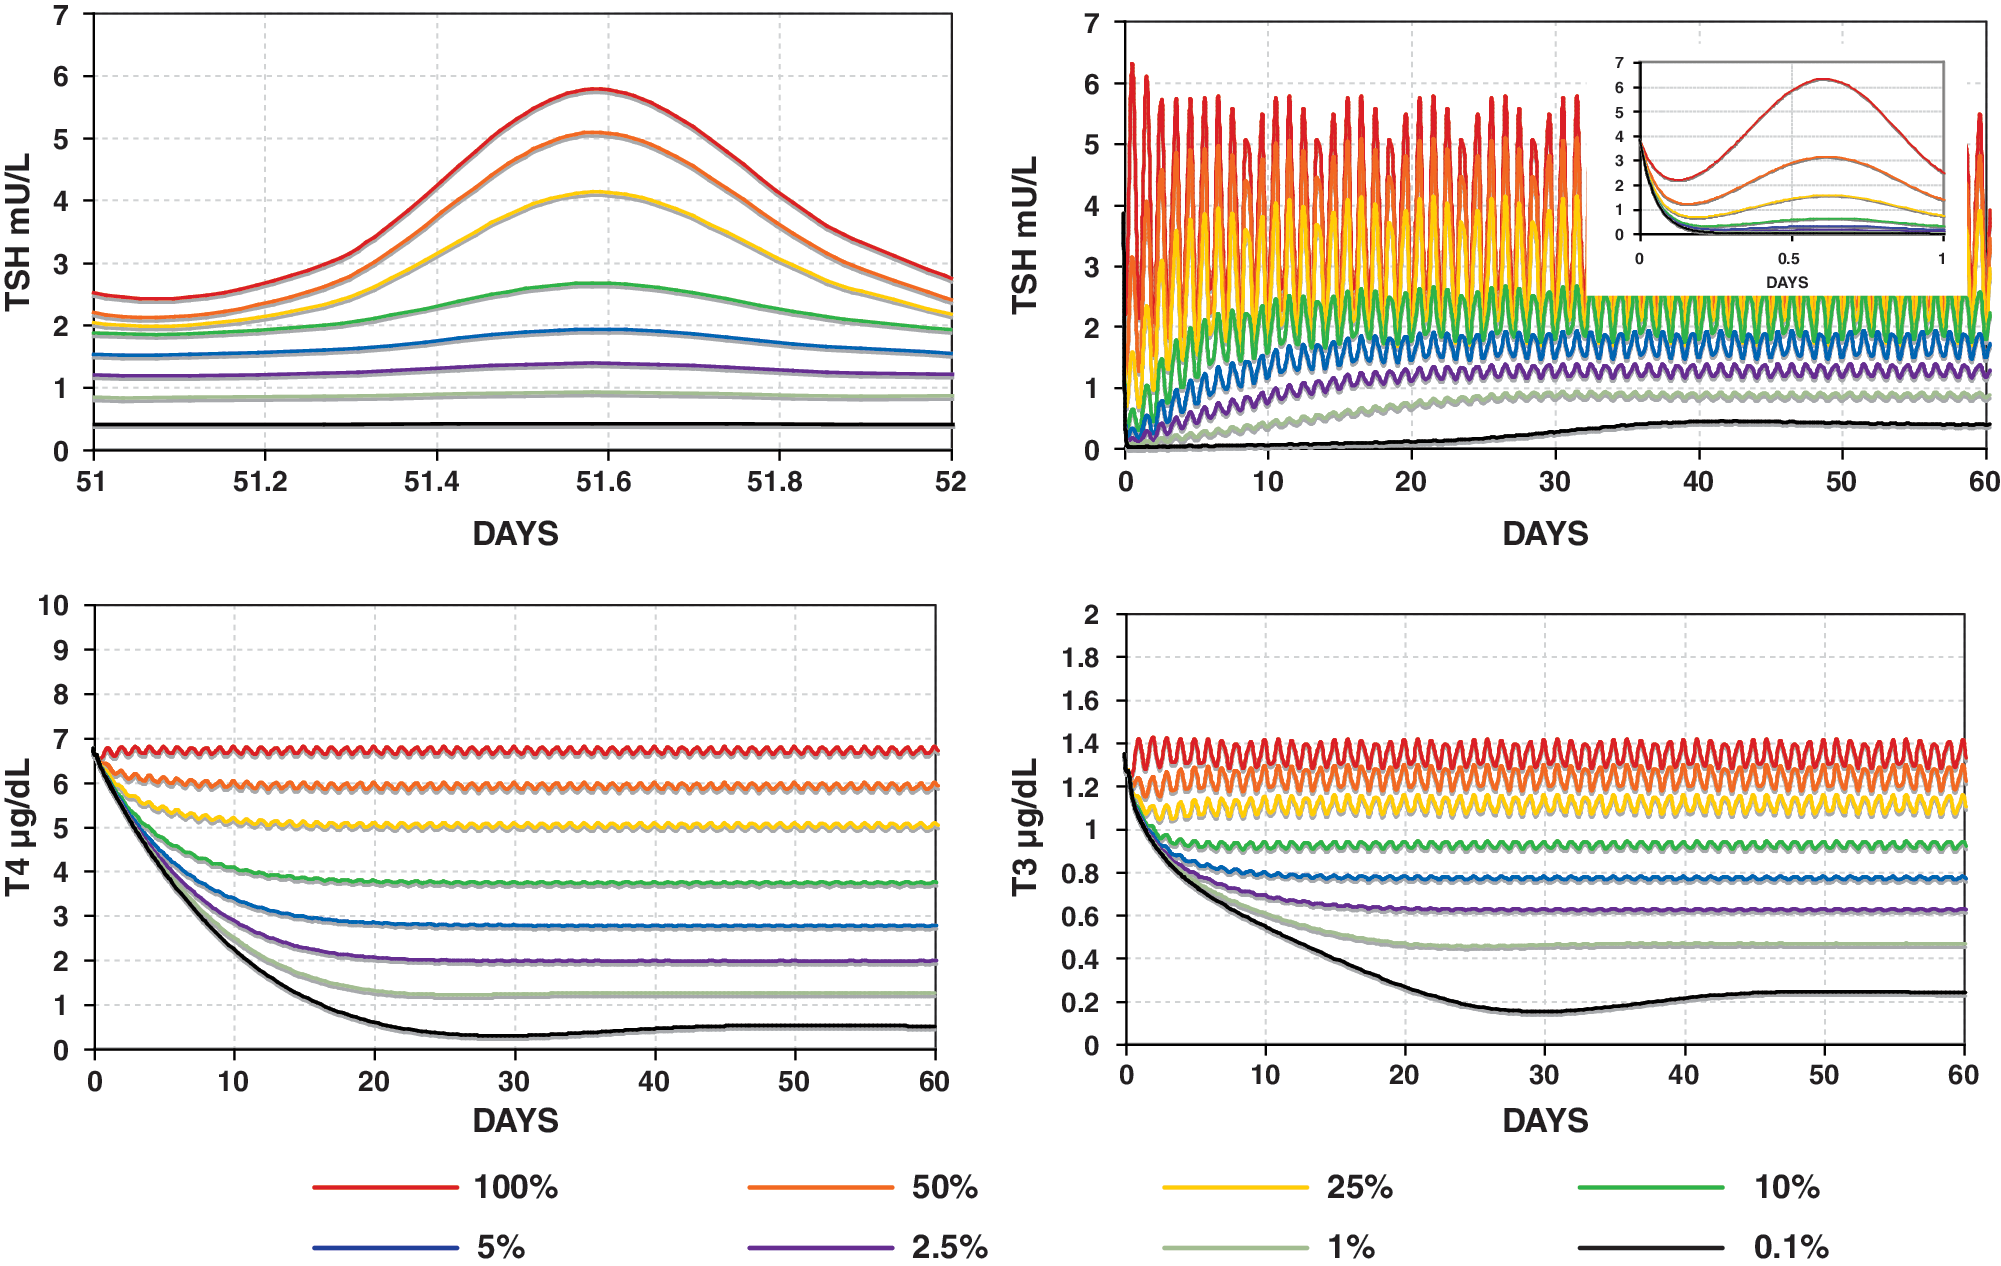
Varying levels of central hypothyroidism (onset at t = 0) simulated using the SCR model with TSH secretion rates (SRTSH) ranging from 100% down to 0.1% of normal. Top left: TSH circadian oscillation over 1 day in steady state. Top right: TSH in central hypothyroidism over 60 days. Inset graph: first day of simulated TSH, showing a rapid decline in TSH, followed by a slow rise to steady-state levels (shown top left). Bottom: T3 and T4 in central hypothyroidism over 60 days. Color images available online at
Discussion
Brain submodel extensions and new HPT axis model
We extended the functional range of the brain submodels to include extreme hypothyroid conditions. The changes were accomplished primarily by incorporating D2 upregulation and D3 downregulation in brain, nonlinear TSH degradation, and changes in TSH circadian rhythms resulting from pituitary TSH secretion saturation. Figure 4 and Appendix 1 illustrate a lag in TSH response to brain T3 as hypothyroidism becomes more severe. The lag parameter k LAG (hour−1) represents brain D3 downregulation as well as potentially depleted pituitary TSH (6). We quantified the overall model with these changes using published data from human clinical data sources (with only one exception) (1,5,6,15,19,32). All model equations and parameter results are given in Appendix 1 and Table 1.
We implemented two alternative TSH secretion-saturation–based hypotheses, to account for attenuated circadian rhythms observed in extreme primary hypothyroidism, based on data ranging from euthyroid to extreme hypothyroid (6 –8). The SCR and DCR hypothesis models (Figs. 1 and 2) were incorporated into the extended range HPT-axis model. Simulated circadian oscillation amplitudes in extreme hypothyroidism decreased significantly compared with oscillatory behavior of the original, limited-range model (Fig. 5) (14). The full extended-range model is now consistent with the clinical data (6 –8).
We validated the extended-range HPT axis model using additional human data from the euthyroid to extreme hypothyroid ranges. Simulated mean euthyroid plasma T3, T4, and TSH levels as well as responses to
We also validated the extended range of the model against independent data not used in its development. The data are from a PK study superimposed on a T4-followed-by-T3-replacement protocol (Fig. 3) in preparation for remnant ablation following thyroidectomy. Fitting T3 and T4 secretion fractions matched plasma T3 and TSH data well (Fig. 7). The fitted T3 secretion fraction was greater than the T4 fraction (F 3 = 0.0251 vs. F 4 = 0.0165), both within reported remnant ranges postthyroidectomy (41). This is consistent with studies showing that T3 is preferentially secreted in hypothyroidism (42,43).
Extreme primary hypothyroidism and replacement protocol simulations
For the T4 + T3 Pisa protocol (Figs. 3 and 7), simulated TSH increased rapidly after T3 withdrawal. TSH rose more slowly for no replacement following thyroidectomy (Fig. 6) and also in a T4-only withdrawal protocol (results not shown, similar to Fig. 6). For remnants up to 5% [range based on data in ref. (41)], we found that the simulated TSH response with no replacement reached 30 mU/L in ∼1–2 weeks, consistent with earlier clinical observations (16,44 –46).
Our results support the following hypothetical mechanism for this phenomenon, similar to that suggested in ref. (15). T4 has an ∼7-day half-life, so it lingers after thyroidectomy or after stopping
The steepness of the simulated TSH rise after T3 withdrawal was dependent on f
LAG (Fig. 8), the parameter representing effects of D3 downregulation, and secretion delays in the pituitary because of rapid draining of the intrapituitary TSH pool in times of high secretion. Hilts et al. (15) found that the rate of TSH rise after a similar T3 withdrawal protocol varied from patient to patient (doubling times ranging from 1.5 to 3.6 days), suggesting that the extreme hypothyroid lag-time (
Hilts and others (15,17,18) have recommended using T3-only replacement to achieve rapidly increased TSH levels postthyroidectomy, while minimizing hypothyroid symptoms. Recently, LeBoeuf and colleagues (16,47) challenged T3 replacement protocols, suggesting that an
Central hypothyroidism simulations
The SCR and DCR hypothesis models were designed specifically for attenuated circadian rhythms in primary hypothyroidism. Surprisingly, these refinements to the brain submodels also yielded decreased rhythms in central hypothyroidism simulations—an emergent property of the model. With the new HPT axis model, simulated steady-state TSH, T4, and T3 levels in simulated central hypothyroidism (Fig. 10) ranged from low to normal [normal ranges: 0.5–5 mU/L TSH, 5–12 μg/dL T4, 0.8–1.9 ng/mL T3 (37)]. These results match reports in the literature (9,49,50). Simulated TSH dropped rapidly at onset of reduced TSH secretion (Fig. 10, top right), followed by a slow rise to steady state (Fig. 10, top left). TSH circadian amplitude decreased significantly as TSH secretion was reduced for either SCR or DCR hypothesis implemented in the new simulator. Simulated TSH was roughly constant and likely undetectable for TSH secretion <5% of normal (Fig. 10, middle). By contrast, circadian amplitude with the original model without any adjustment for extreme primary hypothyroidism did not decrease, contrary to clinical data (7,9,50), remaining ∼50% of mean TSH for all levels of central hypothyroidism.
Thus, our predictive model results support the hypothesis that reduced/absent circadian variation in extreme primary and central hypothyroidism may have the same underlying cause. Normally, as TSH secretion falls (Fig. 10, top right), decreasing TH stimulates the pituitary to increase TSH secretion. However, TSH secretion is impaired in central hypothyroidism, so maximum TSH secretion is lower than in euthyroids. As TSH reaches maximum secretory capacity, the pituitary may become unable to produce an additional nighttime surge, leading to diminished circadian rhythms (Fig. 10).
Alterations in TSH glycosylation and bioactivity also have been observed in both primary and central hypothyroidism (33 –36,51 –53). Higher sialylation of TSH resulting in lower intrinsic bioactivity of TSH may provide a mechanism contributing to TSH secretion saturation predicted by the model; alternatively, it may represent a compensatory effect of TSH secretion saturation, as highly sialylated TSH has a longer half-life (33,34), thereby extending its bioactive effects. The overall effects of TSH sialylation in humans are not entirely clear, as highly sialylated TSH has lower in vitro bioactivity but has been described to have higher in vivo bioactivity because of longer half-life (33,36).
It has been also suggested that decreased circadian rhythms may be a cause of central hypothyroidism (6,7,9). We tested this hypothesis by simulating normal TSH secretion without a circadian component, that is, constant TSH at the 24-hour mean value. Corresponding simulated T3 and T4 levels remained in the normal range, a result supported by evidence in humans with altered sleep schedules, yielding a loss of TSH rhythm, but normal plasma T3 and T4 levels (54). Thus, loss of rhythmicity alone is not likely sufficient to cause central hypothyroidism.
Conclusions
We extended and updated the HPT axis model for TH regulation to include mechanistically based regulatory changes in extreme hypothyroidism. These include slowed TH and TSH degradation, increased T4-to-T3 conversion, and diminished circadian rhythms. Simulation studies with the extended model support the hypothesis that diminished circadian rhythms in central and extreme primary hypothyroidism can both be explained by pituitary TSH secretion reaching maximal capacity. We also applied the new model to thyroid cancer. In simulated remnant ablation protocols using T3 or T4 or no-replacement therapy prior to 131I treatment, TSH shows a more rapid rise after T3 withdrawal than after T4 withdrawal postthyroidectomy. This is due to residual T4 slowing the rise of TSH. To reduce the time to achieve ∼30 mU/L TSH levels, replacement with T3 prior to 131I treatment is suggested by these results.
Footnotes
Acknowledgments
The authors thank Dr. Reed Larsen (Harvard) for his helpful advice and insight regarding mechanisms of TSH secretion, and Dr. Mary Samuels (Oregon Health Sciences University) for providing us with circadian rhythm data and advice. This project was supported in part by a National Institutes of Health National Research Service Award (T32-GM008185) from the National Institute of General Medical Sciences, as well as the National Science Foundation under Agreement No. 0635561.
Disclosure Statement
The authors declare that no competing financial interests exist.
Appendix 1. Original and Extended Brain Submodel Equations
Appendix 2. Type 2 Deiodinase–Upregulated k4 Computations
We previously found k 4 ≈ k 3 (14), based on available rat (3 –5,22,23) and human (21,24),25) data. With type 2 deiodinase upregulated, we expect k 4 > k 3 in hypothyroidism. We derive an approximate relationship showing that type 2 deiodinase–upregulated k 4 is about six times greater than k 3 in extreme hypothyroidism, based on pituitary nuclear T3 data by Larsen and coworkers in thyroidectomized rats (4,5),22,23)). Silva and Larsen (5) gave single intravenous (i.v.) injections (approximate impulses) of radiolabeled T3 or T4 to thyroidectomized rats and measured nuclear pituitary T3 and plasma TSH. TSH response was strongly correlated with nuclear pituitary T3, which suggests that nuclear pituitary T3 dynamics may be approximately representative of our lumped variable T3B. They also found that “800 ng T4/100 g body weight (BW) gave the same degree of acute inhibition of TSH release, as rapidly as did 70 ng T3/100 g” and yielded matching pituitary T3 levels.
Suppose the same T4/T3 dose equivalence holds in humans (in our model equations above) and let
where we let
where the last equation is a rearrangement of the previous one.
If we let
with
where Dose4 and Dose3 are the T4 and T3 doses. Substituting yields
Substituting for the dose and euthyroid steady-state plasma hormone levels T
4PEU = 0.2978 μmol and T
3PEU = 0.005158 μmol, we have
*
Alternatively, dosing with recombinant-human TSH (rhTSH) may be used to increase TSH levels prior to 131I treatment. This protocol is not addressed in this work.
†
This is equivalent to a low-pass filter in engineering signal analysis, suppressing the higher-frequency components of the TSH signal.
‡
If the mean circadian difference among the six patients was <3 mU/L, the sum of all six patients' mean circadian differences must be less than 6 × 3. As
§
T3: Ti-Tre® 20 μg tablets (Teopharma, Italy).