
Abstract
Background:
The accurate diagnosis of thyroid tumors is challenging. Proteomics has emerged as a promising approach for the discovery of molecular diagnostic markers as a potential complement to routine diagnostics.
Methods:
Protein fractions from 29 frozen thyroid tumor tissue samples (10 papillary carcinomas, 9 follicular carcinomas, and 10 follicular adenomas) as well as from normal thyroid tissue were analyzed by surface enhanced laser desorption/ionization time-of-flight mass spectrometry followed by validation by Western blotting and immunohistochemistry.
Results:
A Ca2+-binding protein belonging to the S100 family, S100A6, was differentially expressed between papillary and follicular thyroid tumors. Moreover, two posttranslationally modified forms of S100A6 were observed and verified by liquid chromatography-coupled tandem mass spectrometry. Validation by Western blotting displayed a significantly higher expression of S100A6 in papillary thyroid carcinoma (PTC) in comparison with the other tumor groups or normal tissue (p < 0.05). Immunohistochemical analysis on 98 tumors showed that PTC cases had a significantly stronger cytosolic staining and a larger proportion of stained nuclei than follicular tumors. BRAF gene mutation was not significantly associated with S100A6 protein levels.
Conclusion:
This study supports a role of S100A6 in thyroid tumorigenesis and as a potential aid in the discrimination between follicular thyroid tumors and PTC.
Introduction
Proteomics, that is, the study of the proteome, is an increasingly used approach in cancer research. With the use of gel-based techniques (two-dimensional electrophoresis) and mass spectrometric applications, tumor protein profiles can be produced and compared in search of distinguishing features between different tumor groups. Krause et al. have recently reviewed the relatively limited number of thyroid proteomics studies concluding that revealing potential molecular players in thyroid tumorigenesis was the “easy task” compared with fitting these results into a meaningful concept of molecular pathogenesis and developing a clinical perspective (5).
The first member of the S100 protein family was identified in 1965 by Moore, who was studying a subcellular fraction from bovine brain (6). Since then, a number of S100 proteins has been identified, and their expression has been demonstrated in a wide range of tissues (7). Moreover, a previously complex nomenclature was simplified by Schäfer et al. (8).
The family of S100 proteins consists of 20 small, acidic proteins of 10–12 kDa (9). They belong to the superfamily of EF-hand (alpha helix-loop-alpha helix) Ca2+-binding proteins and have a wide range of intracellular and extracellular functions. The S100A6 was purified from Ehrlich ascites tumor cells more than 20 years ago (10), and since then it has been included in a number of studies investigating its relation to human cancers (11 –15).
In the present study, we profiled thyroid tumors and normal tissue using top-down proteomics approach. We were able to demonstrate differential expression patterns of S100A6, which were further investigated, indicating its particular importance in PTC. We also identified and verified the existence of two posttranslational modifications of S100A6. Moreover, expression patterns of S100A6 were particularly examined on PTC cases with a history of irradiation with or without the presence of inflammation. Additionally, we sought potential correlation between S100A6 expression in PTC and the presence of the BRAF (v-raf murine sarcoma viral oncogene homolog B1) mutation V600E, a mutation present in about 45% of PTC cases (16).
Materials and Methods
Thyroid tissue samples
Fresh frozen thyroid tissue samples were obtained from patients who were surgically treated at the Karolinska University Hospital in Stockholm, Sweden (Supplementary Table S1; Supplementary Data are available online at
Additionally, formalin-fixed and paraffin-embedded PTC tissue samples (PTC with irradiation history [irPTC]11–80) were collected at the Kyiv City Teaching Endocrinological Centre, Ukraine, from 70 patients who had undergone thyroidectomy between 2004 and 2008. All patients were 18 years of age or younger at the time of the nuclear accident at the Chornobyl nuclear power station and lived in nearby areas that were contaminated (Kyiv, Chernihiv, and Zhitomyr regions). These samples were collected and used under approval from the local ethics committee.
Antibodies
The primary antibodies used in this study include a monoclonal anti-Lamin A/C antibody (clone 636; Santa Cruz biotechnology, Santa Cruz, CA) that detects a nuclear membrane protein; a monoclonal anti-Prohibitin antibody (clone II-14–10; NeoMarkers, Fremont, CA), which is specific for a protein of the inner mitochondrial membrane; a monoclonal anti-S100A6 antibody (clone CACY-100; Sigma-Aldrich, St. Louis, MO); a polyclonal, affinity-purified anti-S100A6 antibody (Prestige Antibodies by Sigma-Aldrich); an affinity-purified IgY anti-S100A6 (GenWay Biotech Inc., San Diego, CA); an IgY anti-chicken; a monoclonal anti-β-actin antibody (clone CA-15; Sigma-Aldrich); and a monoclonal antitubulin antibody (LabVision, Fremont, CA).
Protein prefractionation
Protein fractions enriched for cytosolic and nuclear proteins were extracted according to our previously published protocol (17), and protein concentrations were measured by a Bradford assay (18). The accuracy of the prefractionation has been previously demonstrated for a subset of the samples including Western blot and SELDI-TOF-MS analyses (17).
MS-based protein profiling
SELDI-TOF-MS was carried out for 29 thyroid tumors (FTA1–10, FTC1–9, PTC1–10) and 8 normal thyroid samples (N1-5, 7, 9, 10). Cytosolic and nuclear protein fractions were separately profiled by a SELDI-TOF Protein Biology System IIC (Bio-Rad, Hercules, CA). Strong anionic exchange ProteinChip array (Q10, pH 7.5) was used following the manufacturer's standard protocol for sample incubation and washing. The matrix used was 50% saturated sinapinic acid in 50% acetonitrile/0.5% trifluoroacetic acid. Spectra collection was carried out using Ciphergen ProteinChip Software 3.2.1.1216 (Bio-Rad). Each spot on the ProteinChip array was analyzed with two separate settings of laser intensity, detector sensitivity, and time lag focusing allowing optimal detection of spectral regions between 3–10 and 10–30 kDa, respectively. All spectra were baseline corrected, normalized (according to total ion current), and then analyzed using CE Software package 3.0 (Bio-Rad) to reveal peak clusters in the spectra of the different study groups (First pass: S/N ratio >5.0, valley depth <2.0, minimum threshold 10% of all spectra–Second pass: S/N ratio >3.0, valley depth <1.0, cluster mass window 1.0%). A p-value was calculated (Mann-Whitney nonparametric test) for each group, testing the null hypothesis that the medians of peak intensities between the study groups were equal. A further selection was done by manual inspection of all clusters following certain criteria (low standard deviation of intensity values within each group, p < 0.05).
Immunocapture experiment
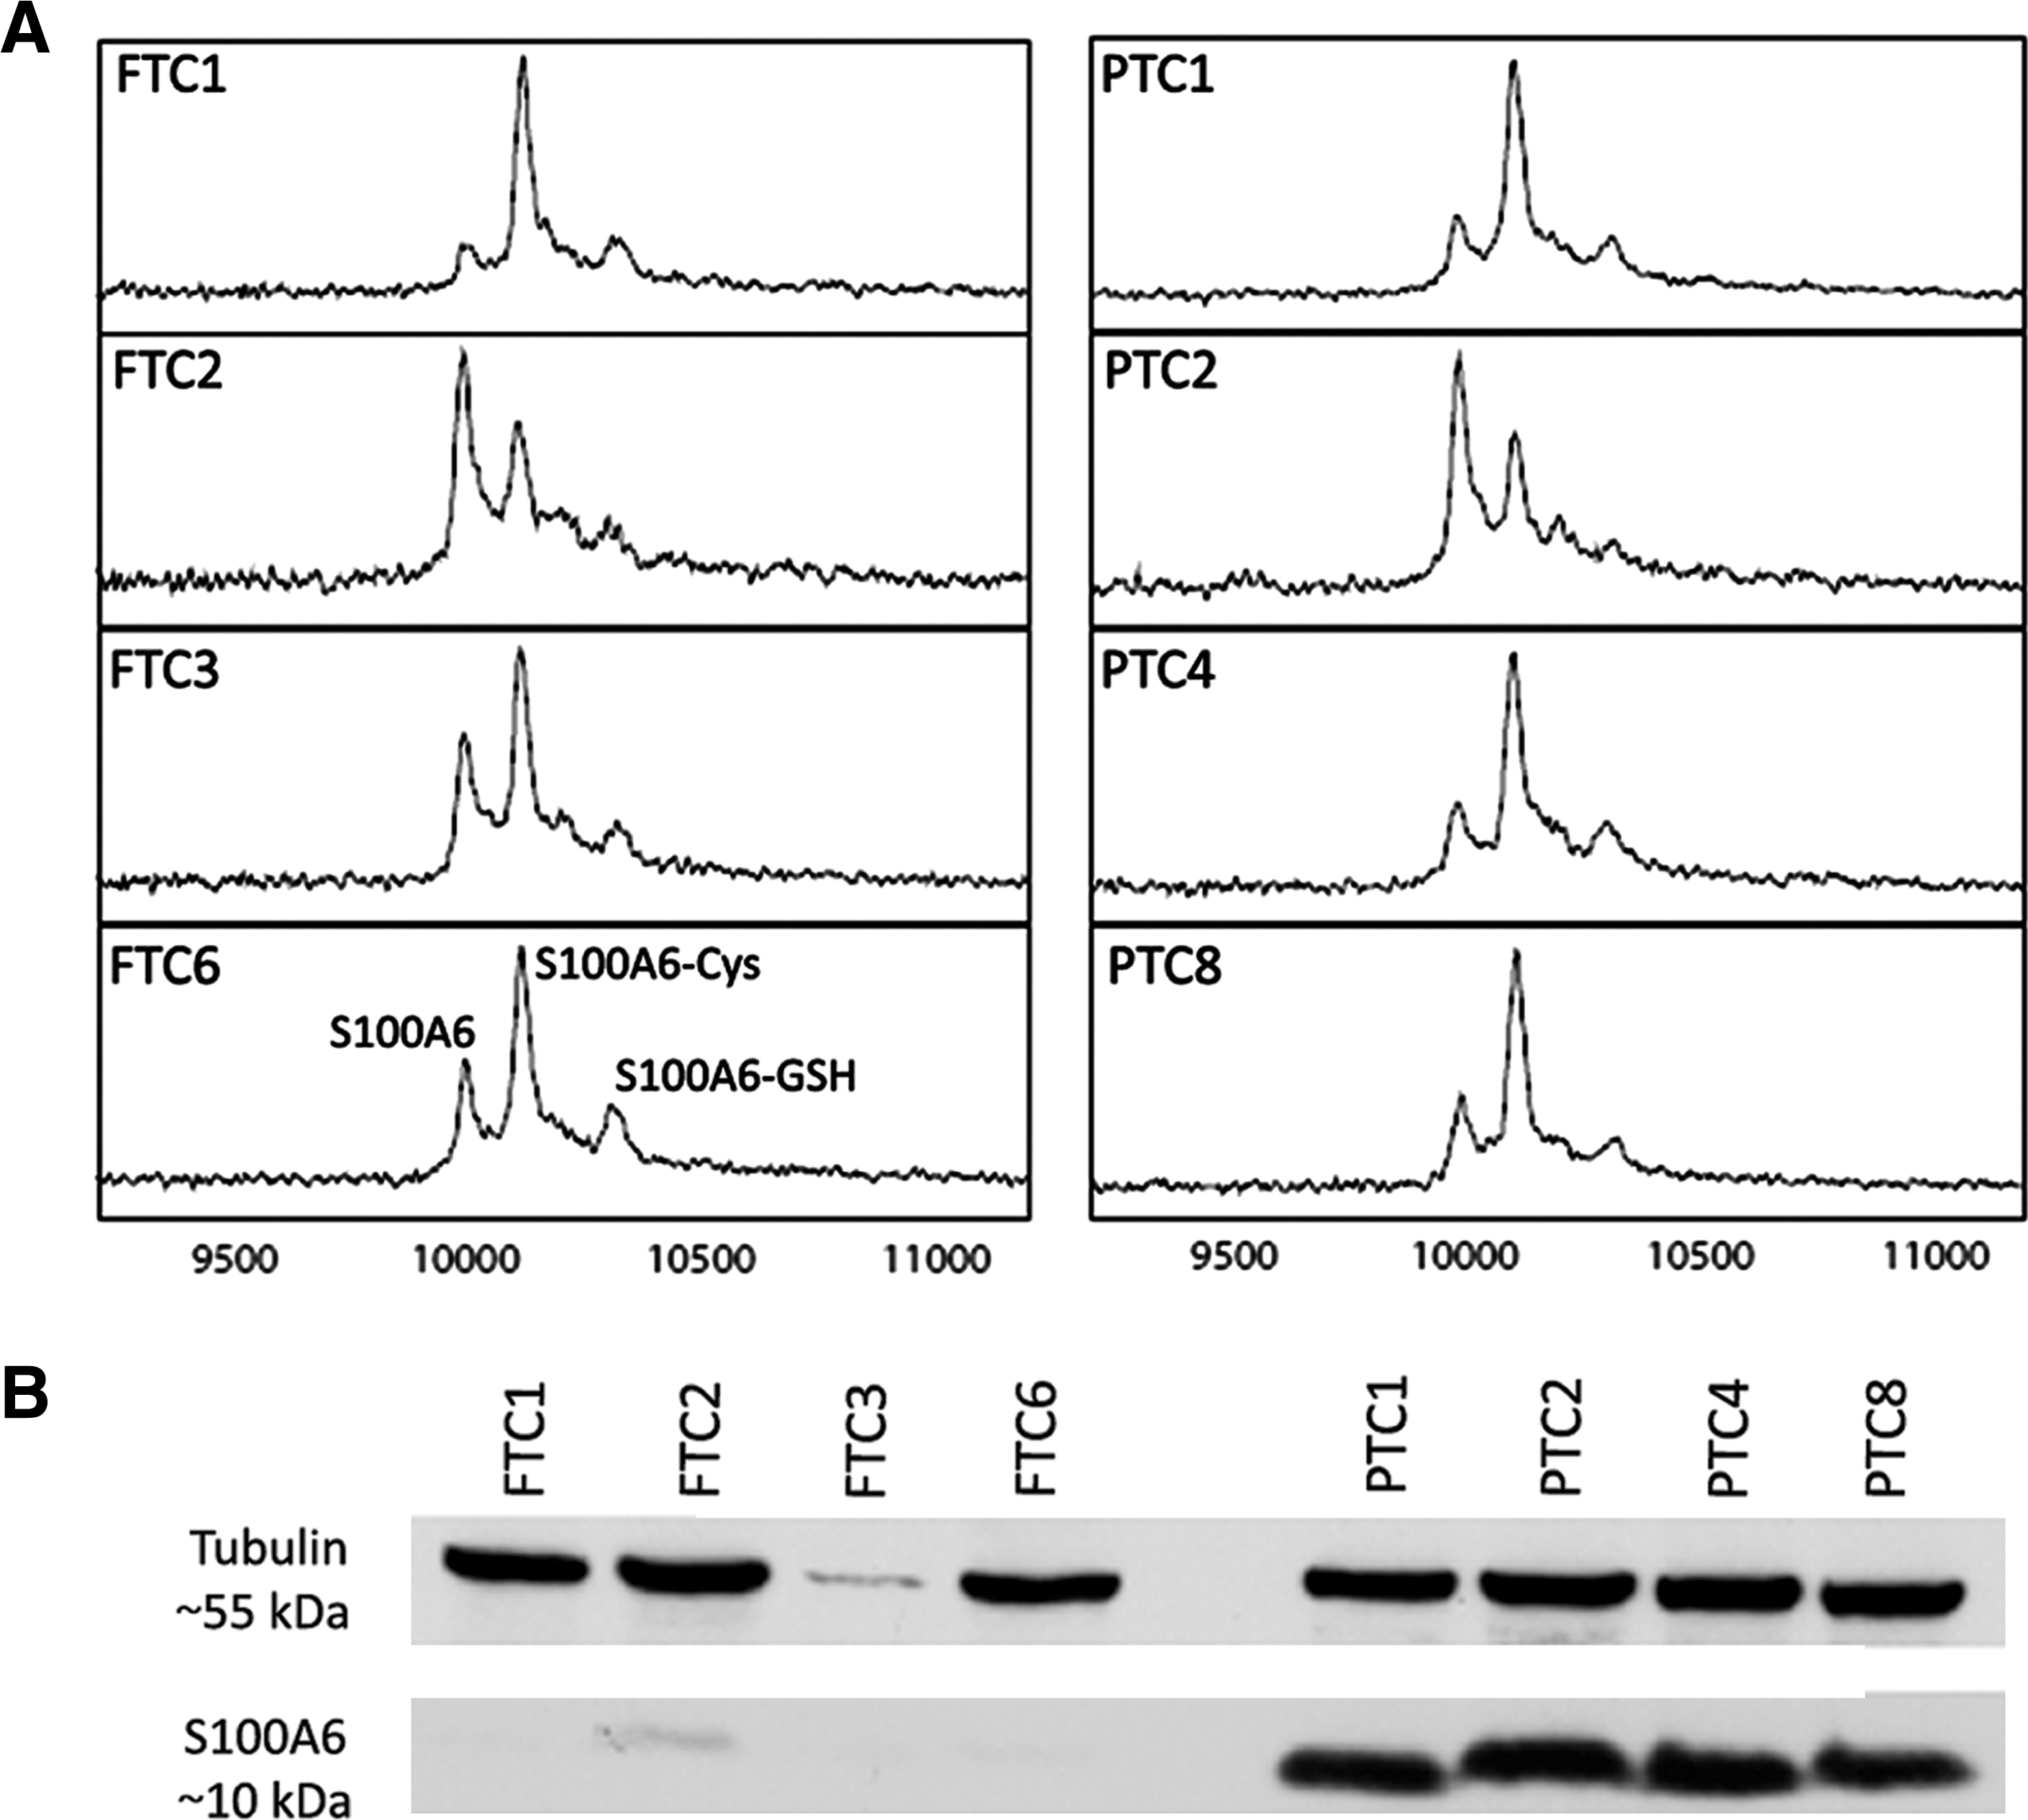
The monoclonal anti-S100A6 antibody coupled to an RS100 ProteinChip array (Bio-Rad) was preliminarily used to capture S100A6 from the cytosolic fractions of four PTC (PTC1, 2, 4, 8) and four FTC (FTC1, 2, 3, 6) samples according to the standard protocol provided by the manufacturer. Antibody and sample incubation were followed by SELDI-TOF-MS spectra collection as described in the previous section. Finally, a Western blot analysis using the same anti-S100A6 antibody, and antitubulin as loading control, was carried out to reveal quantitative differences between the two groups.
Western blot analysis
Protein fractions were resolved by sodium dodecyl sulphate–polyacrylamide gel electrophoresis in a 10% Tricine gel and blotted onto a 0.2 μm nitrocellulose membrane (Invitrogen, Carlsbad, CA). Blocking with 5% nonfat milk was followed by overnight probing of the membranes at 4°C with the monoclonal anti-S100A6 antibody at a dilution of 1/1000. A horseradish peroxidase-conjugated (HRP-conjugated) secondary antibody (goat anti-mouse, dilution 1/10,000) was then applied for 1 hour followed by incubation with Amersham ECL Western Blotting detection reagents (GE Healthcare Limited, Buckinghamshire, United Kingdom) for 1 minute. A separate set of membranes was probed with the polyclonal, affinity-purified anti-S100A6 antibody at a dilution of 1/10,000 followed by another HRP-conjugated secondary antibody (goat anti-rabbit, dilution 1/12,500). Amersham Hyperfilm ECL film (GE Healthcare Limited) was then exposed to each membrane for an appropriate time. Anti-β-actin antibody was used as loading control in this analysis. Total protein extract from the lung cancer cell line A549 was used as positive control for the expression of S100A6. The films were scanned on a flatbed GS-710 scanner (Bio-Rad). Densitometry was carried out for monoclonal anti-S100A6 and anti-β-actin by using Quantity One 4.6 (Bio-Rad).
Immunohistochemistry
Immunohistochemical staining was performed on 98 tumor cases (FTA1–9, FTC1–9, PTC1–10, irPTC11–80) and 2 normal thyroid samples (N8, 10) by using the monoclonal anti-S100A6 antibody. Laboratory conditions were optimized after experimenting with different antibody dilutions, presence or absence of citrate, and incubation solely with secondary antibody or avidin-biotin complex. Four-micrometer paraffin sections were deparaffinized, rehydrated, and heated in a microwave oven in citrate buffer (pH 6) for 20 minutes. Endogenous hyperoxidase activity and biotin were blocked by incubating the sections with 0.3% hydrogen peroxide in water (room temperature [RT] for 30 minutes) and avidin (RT, 1 hour), respectively. The sections were then blocked in 1% bovine serum albumin (RT, 20 minutes) followed by incubation with the primary antibody overnight at a dilution of 1/1000 (moist chamber at 4°C). Another series of sections was stained at an antibody dilution of 1/250. Antigen-antibody binding was visualized using the avidin-biotin complex method (Vectastain Elite kit; Vector Laboratories, Burlingame, CA) for 30 minutes, incubating with diaminobenzedine tetrahydrochloride for 6 minutes, and using hematoxylin as counterstaining. Incubation without a primary antibody was used as negative control for each case, whereas sections from liver, pancreas, spleen, and stomach were used as positive controls according to staining patterns provided by the Swedish Human Protein Atlas (
Evaluation of immunohistochemistry staining and scoring systems
Slides were scored by an experienced endocrine pathologist (A.H.) and four more coauthors (C.L., C.J., A.S., A.D.). The intensity of cytosolic and nuclear staining was separately scored as 0 (absent), 1 (weak), 2 (moderate), or 3 (strong) following the scoring system developed and validated in pancreatic cancer where S100A6 has been more extensively studied (19). Regardless of the intensity, we observed a homogenous cytosolic staining pattern for each individual case. This was, however, not observed for the nuclear staining; and, therefore, we introduced a separate scoring system to describe the percentage of nuclei stained in each case (<25% or ∼50% or >75%).
Immunoprecipitation
To isolate and detect S100A6 and its posttranslational modifications, 650 μg of cytosolic protein fraction from PTC8 were used for immunoprecipitation using Seize® Primary Mammalian Immunoprecipitation Kit (Pierce Biotechnology, Rockford, IL). In brief, 50 μg of the affinity-purified IgY anti-S100A6 or isotype-matched control antibody were coupled to 200 μL of suspended coupling gel. Incubation, washing, and blocking with quenching buffer (1 M Tris-HCl) were followed by the addition of the protein lysate to the antibody-coupled gel. After incubating and washing according to the manufacturer's protocol, the precipitated proteins were eluted by using 0.3 M acetic acid.
High resolution liquid chromatography-coupled tandem mass spectrometry
Liquid chromatography-coupled tandem mass spectrometry (LC-MS/MS) was performed on a hybrid Orbitrap Velos high resolution mass spectrometer (Thermo Fischer Scientific, San Jose, CA). The eluates from the immunoprecipitation experiment were dried in a Savant SPD111V speedvac (Thermo Fischer Scientific) and resuspended in 50 μL of 25 mM ammonium bicarbonate (ambic) buffer, to which 0.2 μg of trypsin (seq. grade; Promega, Madison, WI) was added. Protein digestion proceeded for 20h at 37°C. The digest was then dried in speedvac and ressuspended in 20 μL of solvent A (97% water, 3% acetonitrile, 0.1% formic acid). An HPLC 1200 system (Agilent Technologies, Santa Clara, CA) provided the gradient for online reversed-phase nano-LC at a flow of 0.4 μL/minute using solvent B (5% water, 95% acetonitrile, 0.1% formic acid). The curved gradient went from 2% B up to 40% B in 45 minutes, followed by a steep increase to 100% B in 5 minutes. Two microliters of sample was injected into a C18 guard desalting column (Agilent), which was used before a 15 cm long C18 picofrit column (100 μm internal diameter, 5 μm bead size; Nikkyo Technos Co., Tokyo, Japan) installed onto the nano electrospray ionization source of the Orbitrap Velos instrument. Acquisition proceeded in approximately 3.5 seconds scan cycles, starting by a single full scan MS at 30,000 resolution, followed by two stages of data-dependent tandem MS: The top five ions from the full scan MS were selected first for collision-induced dissociation (at 35% energy) with MS2 detection in the ion trap and finally for higher-energy collision dissociation (at 45% energy) with MS2 detection in the orbitrap. Dynamic exclusion was used with 90 seconds duration.
MS/MS data analysis
The MS/MS data for both eluates were first analyzed in de novo sequencing mode by the program Peaks Studio 5.1 (Bioinformatics Solutions, Inc., Waterloo, Canada). The de novo sequencing discoveries were then confirmed by using the Sequest (Thermo Fischer Scientific) algorithm within the software platform Proteome Discoverer 1.1 (Thermo Fischer Scientific) against the IPI-human fasta database (20091222). Search parameters included a 10 ppm precursor mass tolerance, a 0.02 Da fragment mass tolerance, and the dynamic modifications: N-terminal methionine loss and acetylation (−89.030 Da), oxidation of methionine (+15.995 Da), cysteinylation of cysteine (+119.004 Da), and glutathionylation of cysteine (+305.068 Da).
DNA extraction and BRAF mutation detection
Fresh frozen tissue samples from the 10 PTC cases (PTC1–10) were used for genomic DNA extraction, applying the gDNA mini kit (Invitrogen) and the manufacturer's protocol for frozen tissue. Exons 11 and 15 of the BRAF gene were amplified by polymerase chain reaction and sequenced essentially according to previously published protocols (20,21). Amplifications were performed using HotStar DNA polymerase kit (Qiagen, Valencia, CA) and the conditions: 95°C for 15 seconds and 40 cycles of 94°C for 30 seconds, 60°C for 30 seconds, and 72°C for 1 minute. Products were visualized in 1.7% agarose gels stained with RedGel (Biotium, Hayward, CA) (20,21), and they were purified using ExoSap (Exonuclease I, E.coli [Exo]) and shrimp alkaline phosphatase (Sap) (Fermentas, Burlington, Canada). One microliter of each purified product was then elongated and cleaned with 2.5 μL EDTA 150 mM and 95% ethanol. Sequencing was performed with BigDye terminator v3.1 on an automated 3700 Applied Biosystems sequencer (Applied Biosystems, Foster City, CA). The sequencing results were obtained and evaluated with Sequence Scanner v1.0 (Applied Biosystems).
Statistical analyses
The results of the Western blot analysis between the study groups (normal thyroid, FTA, FTC, and PTC) were evaluated by applying the nonparametric Kruskal-Wallis test using Statistica 8.0 (StatSoft Scandinavia AB, Uppsala, Sweden). The same procedure was carried out for the immunohistochemistry (IHC) scoring results, but an additional evaluation was done by applying the Mann-Whitney U-test comparing PTC to follicular tumors.
Results
SELDI-TOF-MS analysis–Identification of S100A6 and its posttranslationally modified forms
Spectra collection from the cytosolic extracts for the spectral regions 3–10 and 10–30 kDa was followed by peak detection, normalization, and peak-clusters identification. A total of 155 peak clusters were detected with 64 of them having a significant p-value. After manual inspection, 13 clusters were distinguishing between PTC and follicular tumors (Supplementary Fig. S1). A distinct peak cluster with a statistically significant p-value between the compared protein lysate groups at an m/z (mass to charge) ratio of 10,200 was hypothesized to correspond to the Ca2+-binding protein S100A6 based on molecular mass, protein array binding specificity, and previous experience (22) (Fig. 1). The protein indicated by this cluster displayed a statistically significant higher expression in PTC than in FTA, FTC, or normal tissue (p < 0.001) (Fig. 2). The presence of S100A6 was confirmed by immunocapturing with anti-S100A6 using the same tumor lysates. As illustrated in Figure 3A, three peaks were visible on the RS100 ProteinChip array corresponding to the expected masses of S100A6 (∼10.1 kDa) and two S100A6 modifications by cysteinylation (∼10.2 kDa) and glutathionylation (∼10.4 kDa) as previously described in cell line samples (22). Western blot analysis of cytosolic extracts from the same cases further confirmed the identification of S100A6 and validated the quantitative differences between FTC and PTC discovered in MS profiling (Fig. 3B).
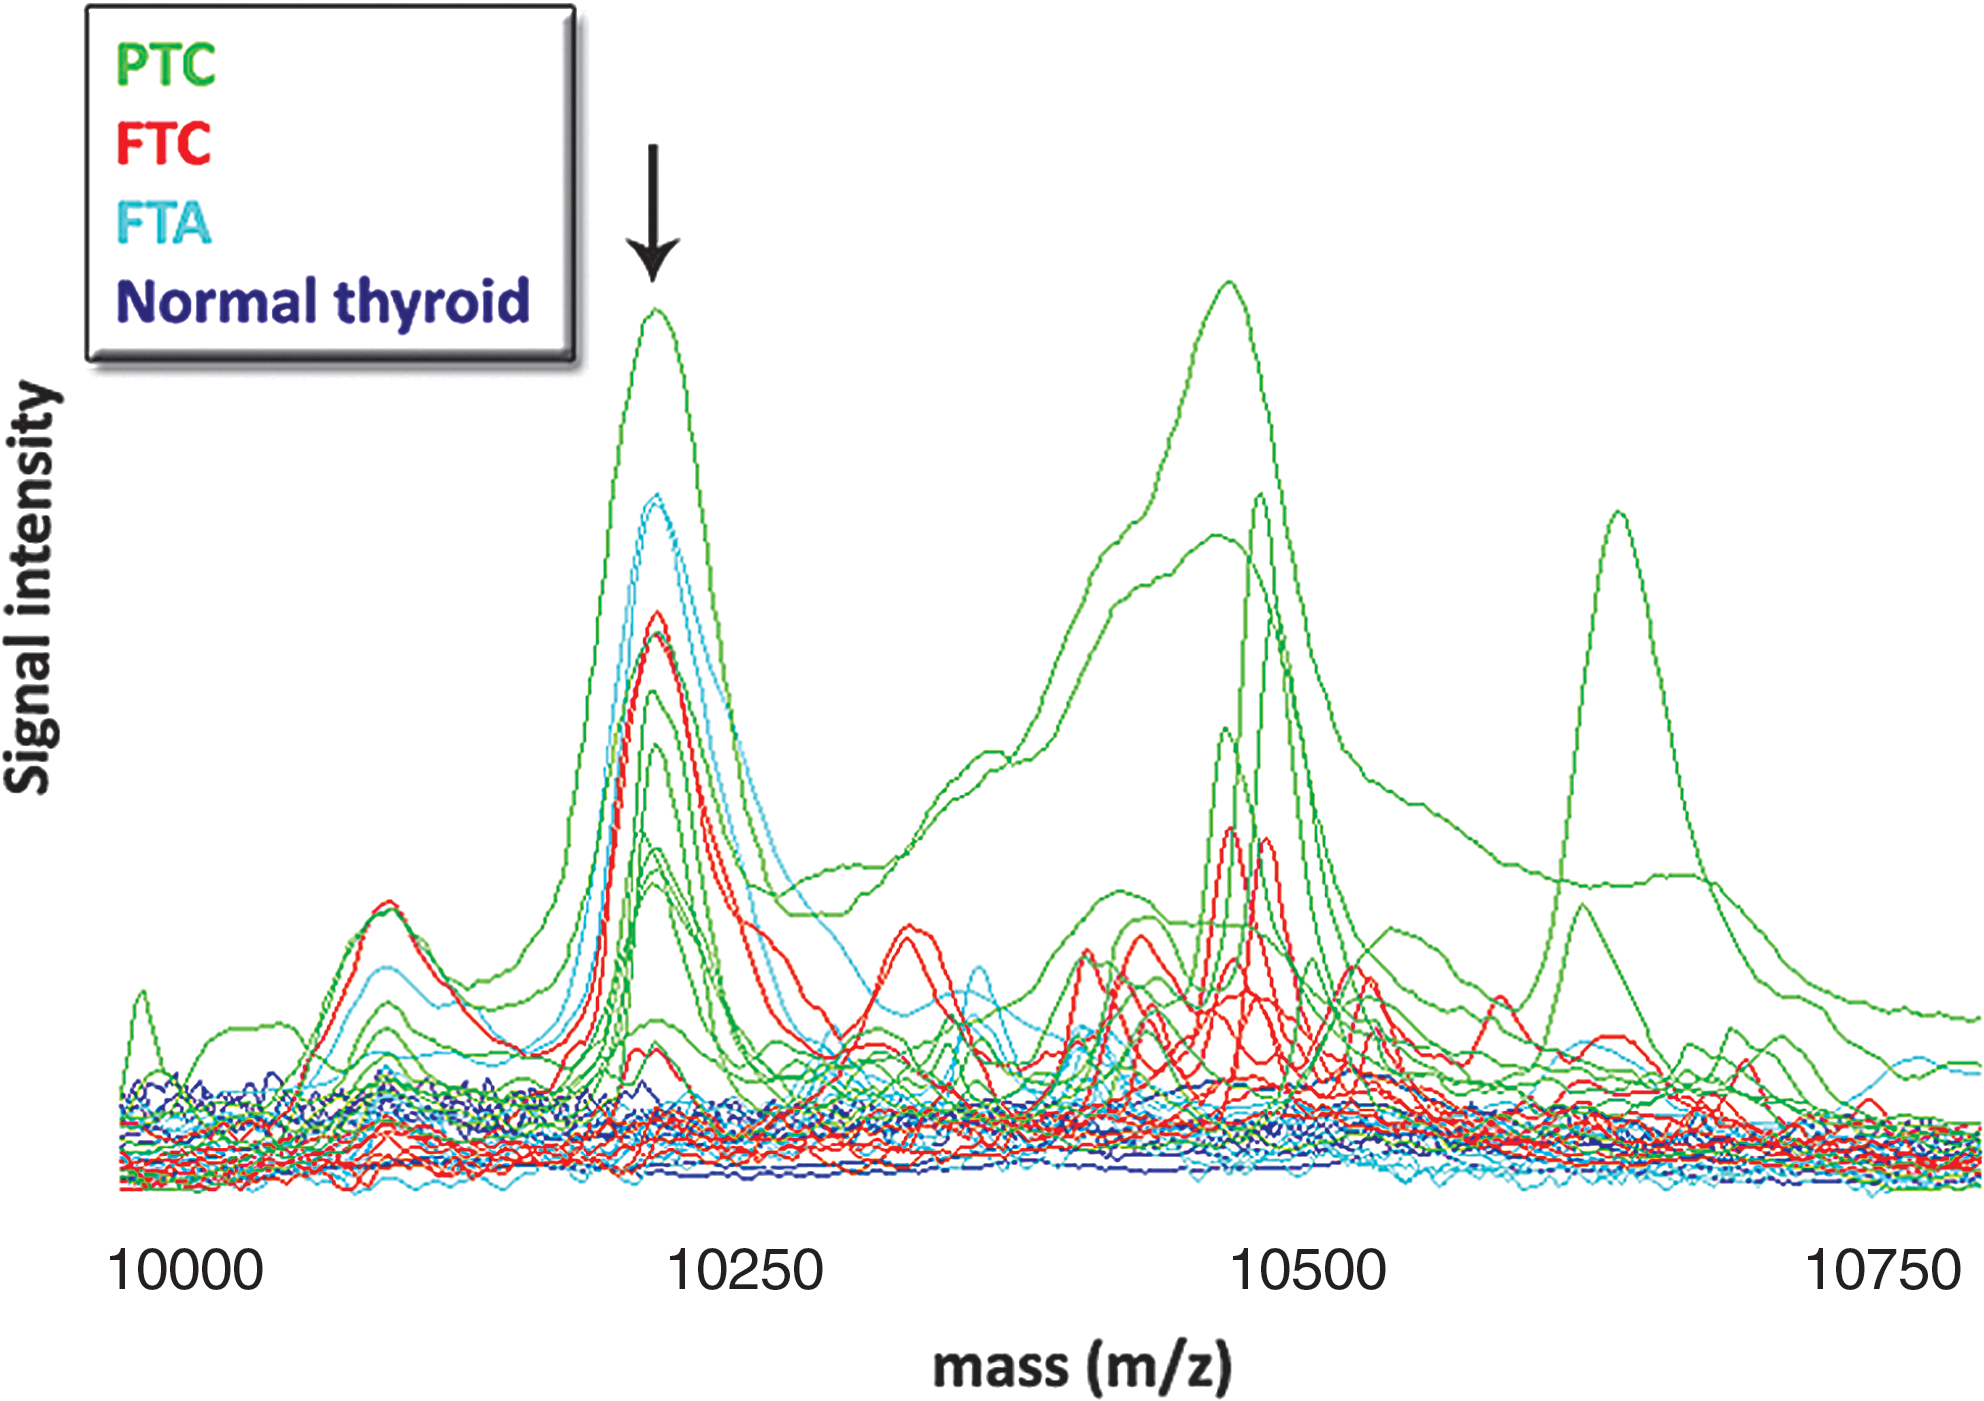
Overlaid surface enhanced laser desorption/ionization time-of-flight mass spectra for all 37 thyroid samples within the mass window between 9.5 and 11 kDa. The arrow indicates a prominent group of peaks at about 10.2 kDa, the expected mass for S100A6. FTA, follicular thyroid adenoma; FTC, follicular thyroid carcinoma; PTC, papillary thyroid carcinoma. Color images available online at
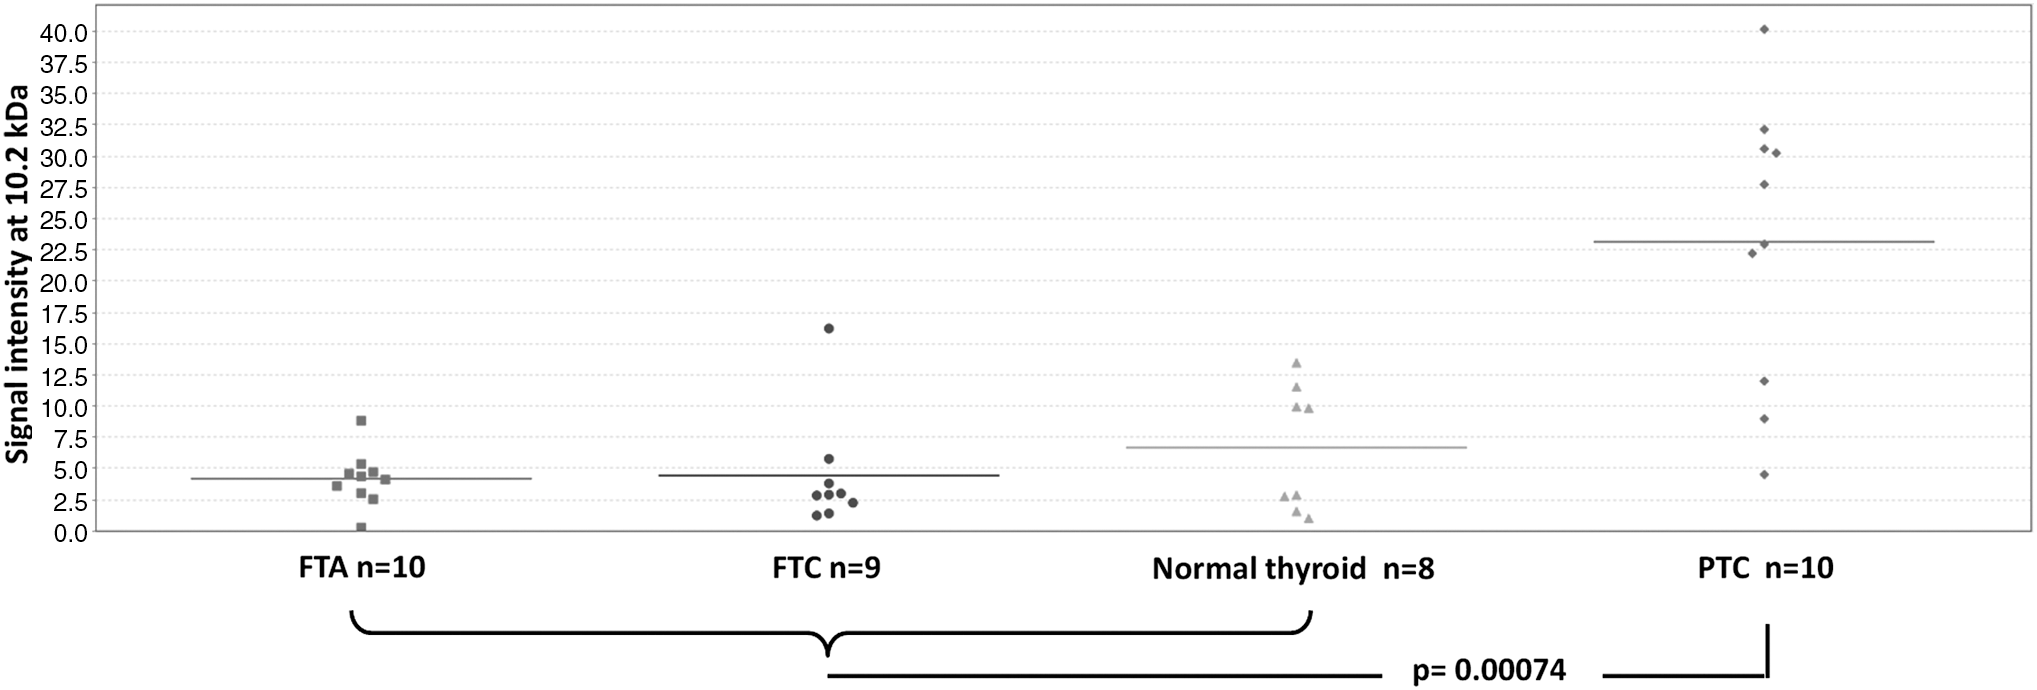
Scatter plot of the intensities of the peaks shown in Figure 1 revealing a significant over-expression of the 10.2 kDa protein in PTC as compared with FTA, FTC, and normal thyroid.
(
Further evidence on the presence of the above-mentioned posttranslational modifications was provided by LC-MS/MS. The higher-energy collision dissociation high resolution mass spectra in Figure 4 correspond to the cysteinylated (denoted as cc) and glutathionylated (denoted as cg) N-terminal peptide of S100A6, respectively. Most of the b and y ions (N-terminal and C-terminal derived fragment ions, respectively) found show a negligible matching error (down to sub-ppm levels in some cases). Of particular importance are the b ions that define the cysteinylated cysteine (114.0550 and 336.0683) within the peptide amino acid sequence, which present a very low matching error and, thus, a high confidence in the modification. The same considerations hold true for the glutathionylated version of the same peptide. In addition, we have found that the precursor ion corresponding to the cysteinylated peptide has about 100 times more intensity than the glutathionylated one (not shown), which should reflect the relative abundance of the two peptides and is indeed in agreement with the low-resolution SELDI-MS data. Two more versions of the peptide with an apparent carbamidomethylated (+57.021464) and glucuronylated (+176.032088) cysteine were found. One might speculate that the carbamidomethylated form corresponds to an originally free cysteine version of S100A6, which got modified during sample preparation procedures.
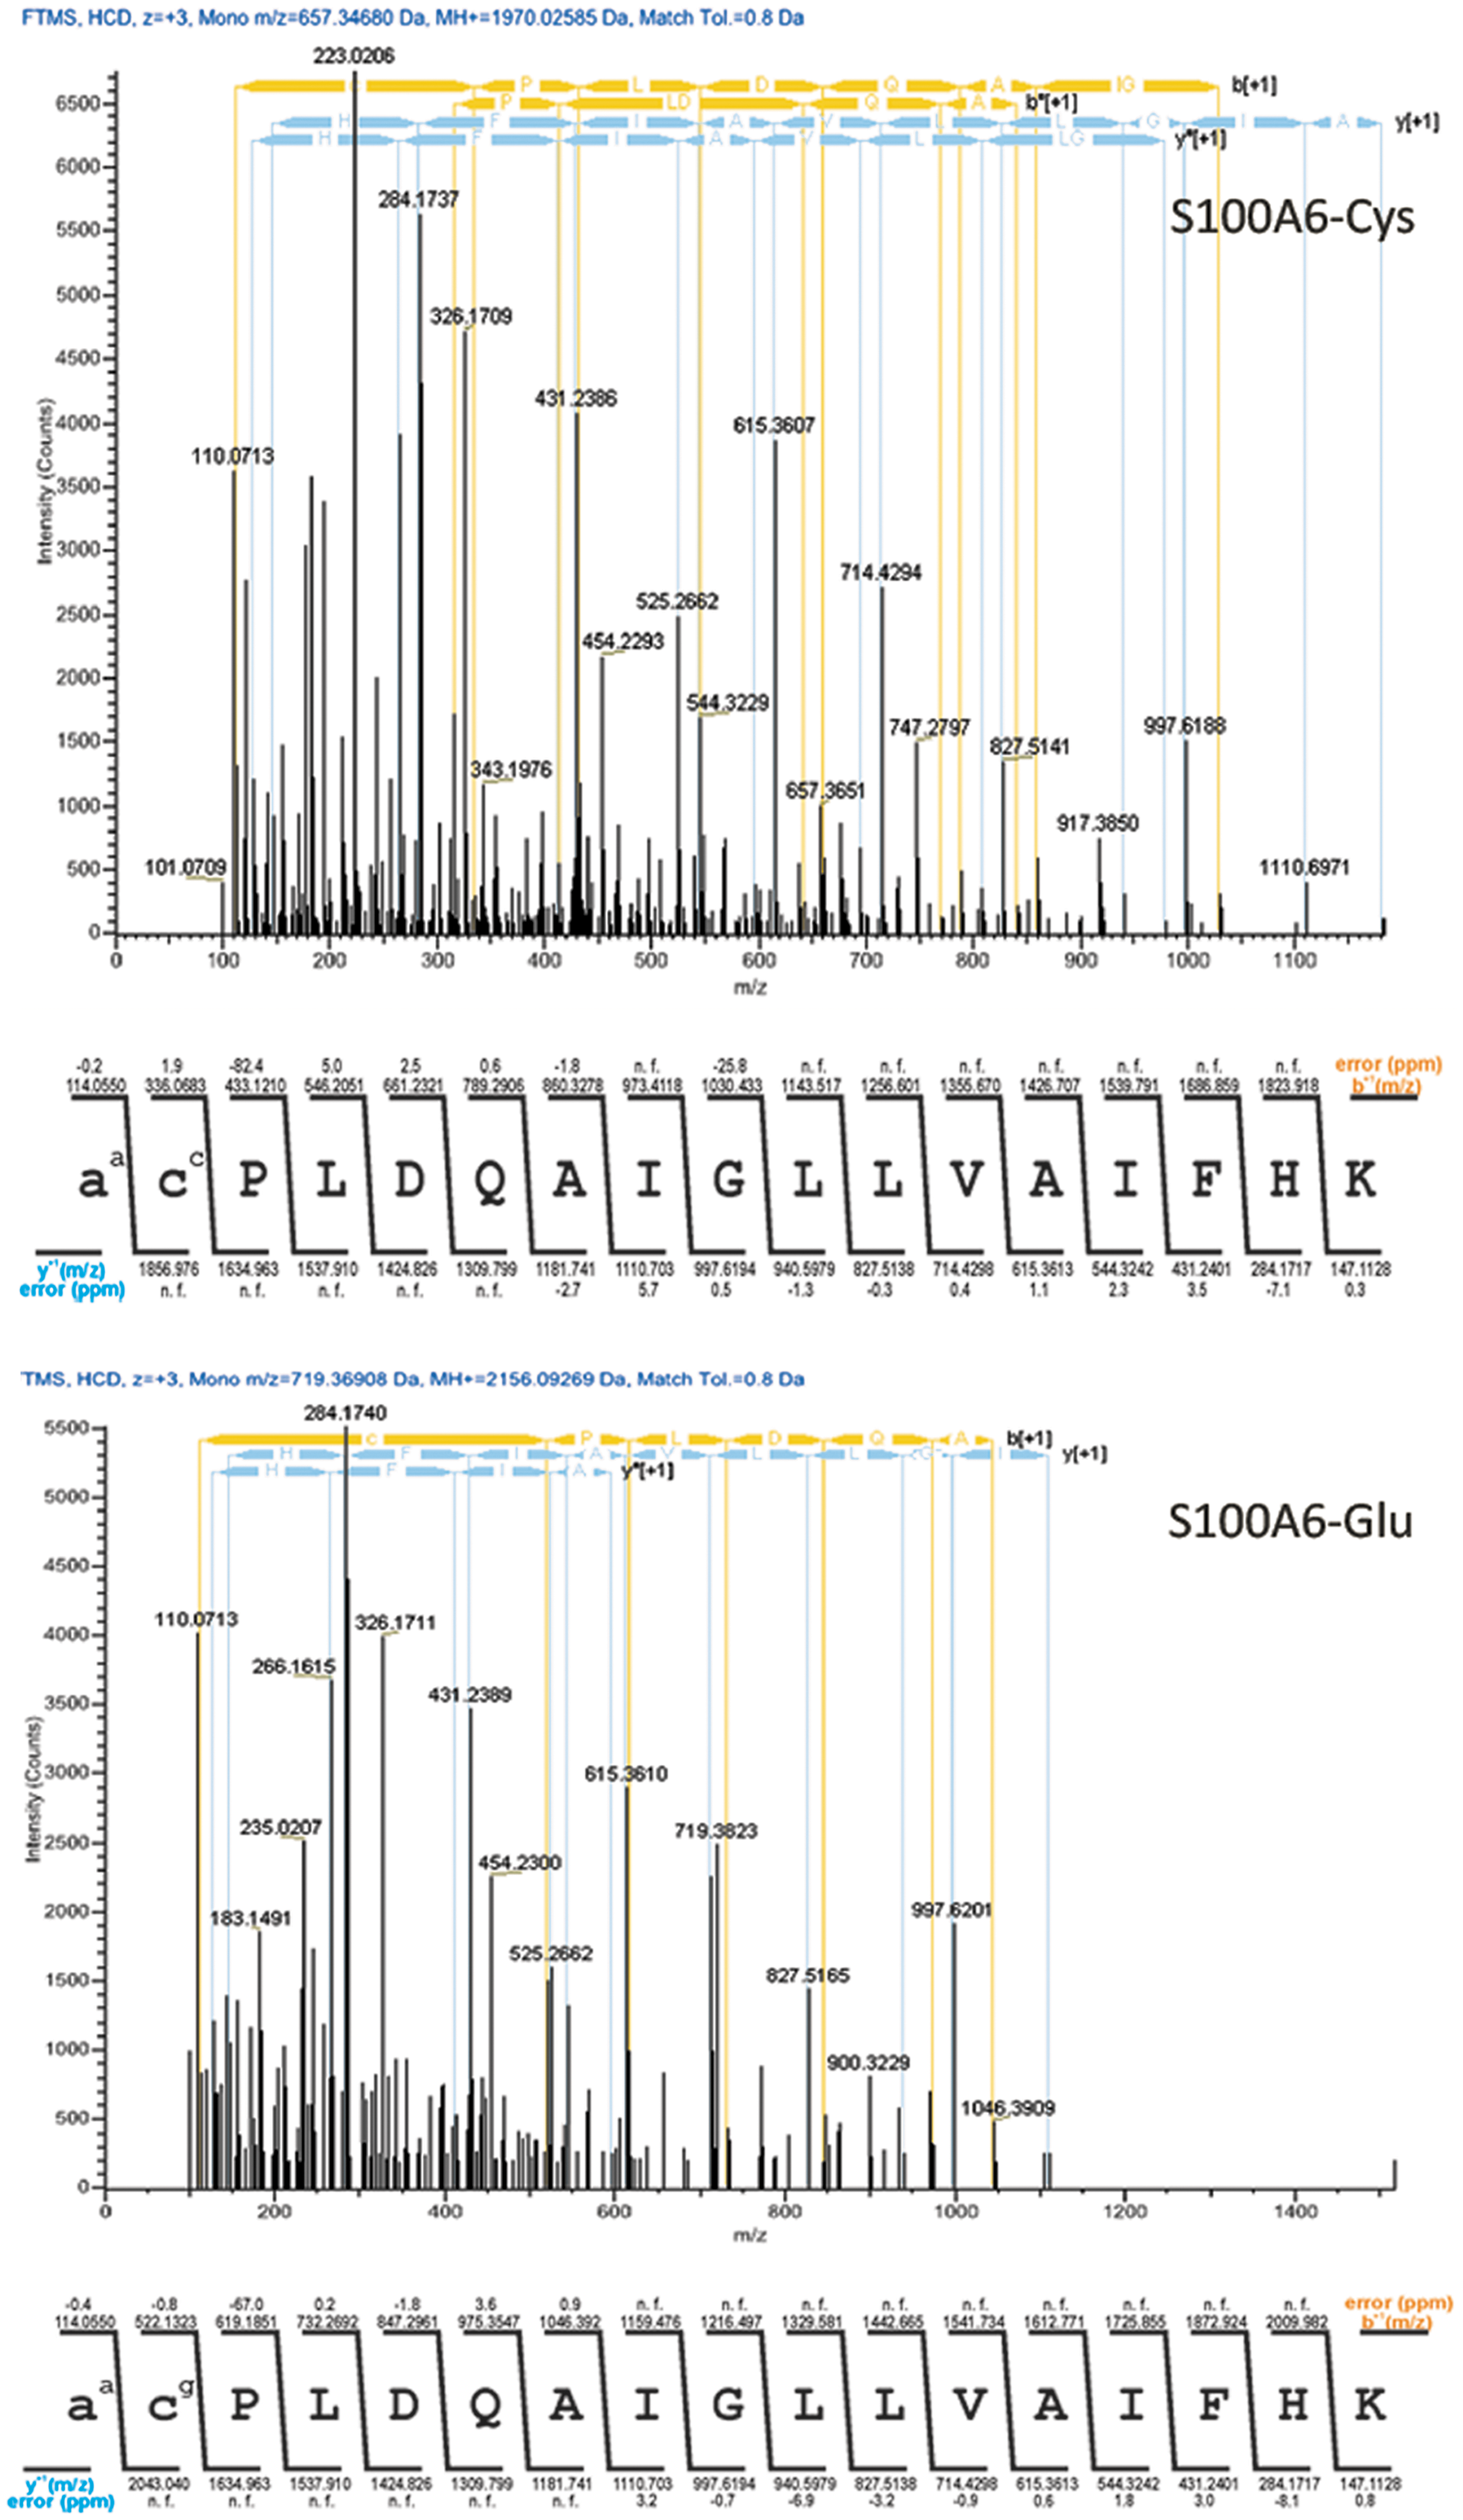
High-resolution tandem mass spectra of the cysteinylated and glutathionylated S100A6 peptide (triply charged ions m/z = 657.34680 and 719.36908, respectively). Tables of theoretical fragment ions are presented under the respective spectrum. The notations represent aa, acetylated alanine residue; cc, cysteinylated cysteine residue; cg, glutathionylated cysteine residue; b[+1], singly charged b ions; bo[+1], singly charged b ions with water loss; y[+1], singly charged y ions; yo[+1], singly charged y ions with water loss; n.f., fragment ion not found; and error (ppm), difference between the theoretical fragment m/z and the observed one in ppm. The peptide sequence coverage was complete, with the N-terminal spanned by the b-ions and the C-terminal by the y ions. Color images available online at
Finally, high-resolution mass spectrometry clearly showed that the N-terminal side of S100A6 is, in all cases, deprived of the initiator methionine residue and instead presents an acetylated alanine at its N-terminus, which corresponds to the posttranslation modification met-loss+acetyl (−89.029920) typical of eukaryotes (23).
Over-expression of S100A6 in PTC by Western blot analysis
To further validate our results from mass spectrometry, eight samples from each study group were subjected to Western blot analysis using two different anti-S100A6 antibodies. The results for the monoclonal anti-S100A6 are illustrated in Figure 5. A single product at about 10 kDa was detected in all samples as well as in the positive control (total protein extract from A549 cells). The quantification of band intensities by densitometry (Supplementary Table S1) was followed by pair-wise comparisons between the study groups that revealed a significant over-expression of S100A6 in PTC as compared with normal thyroid (p = 0.001), FTA (p = 0.019), and FTC (p = 0.012). No other statistically significant differences were observed. Similar results were obtained by using polyclonal anti-S100A6 antibody revealing again a single product at approximately 10 kDa, with a relatively higher expression in PTC samples.
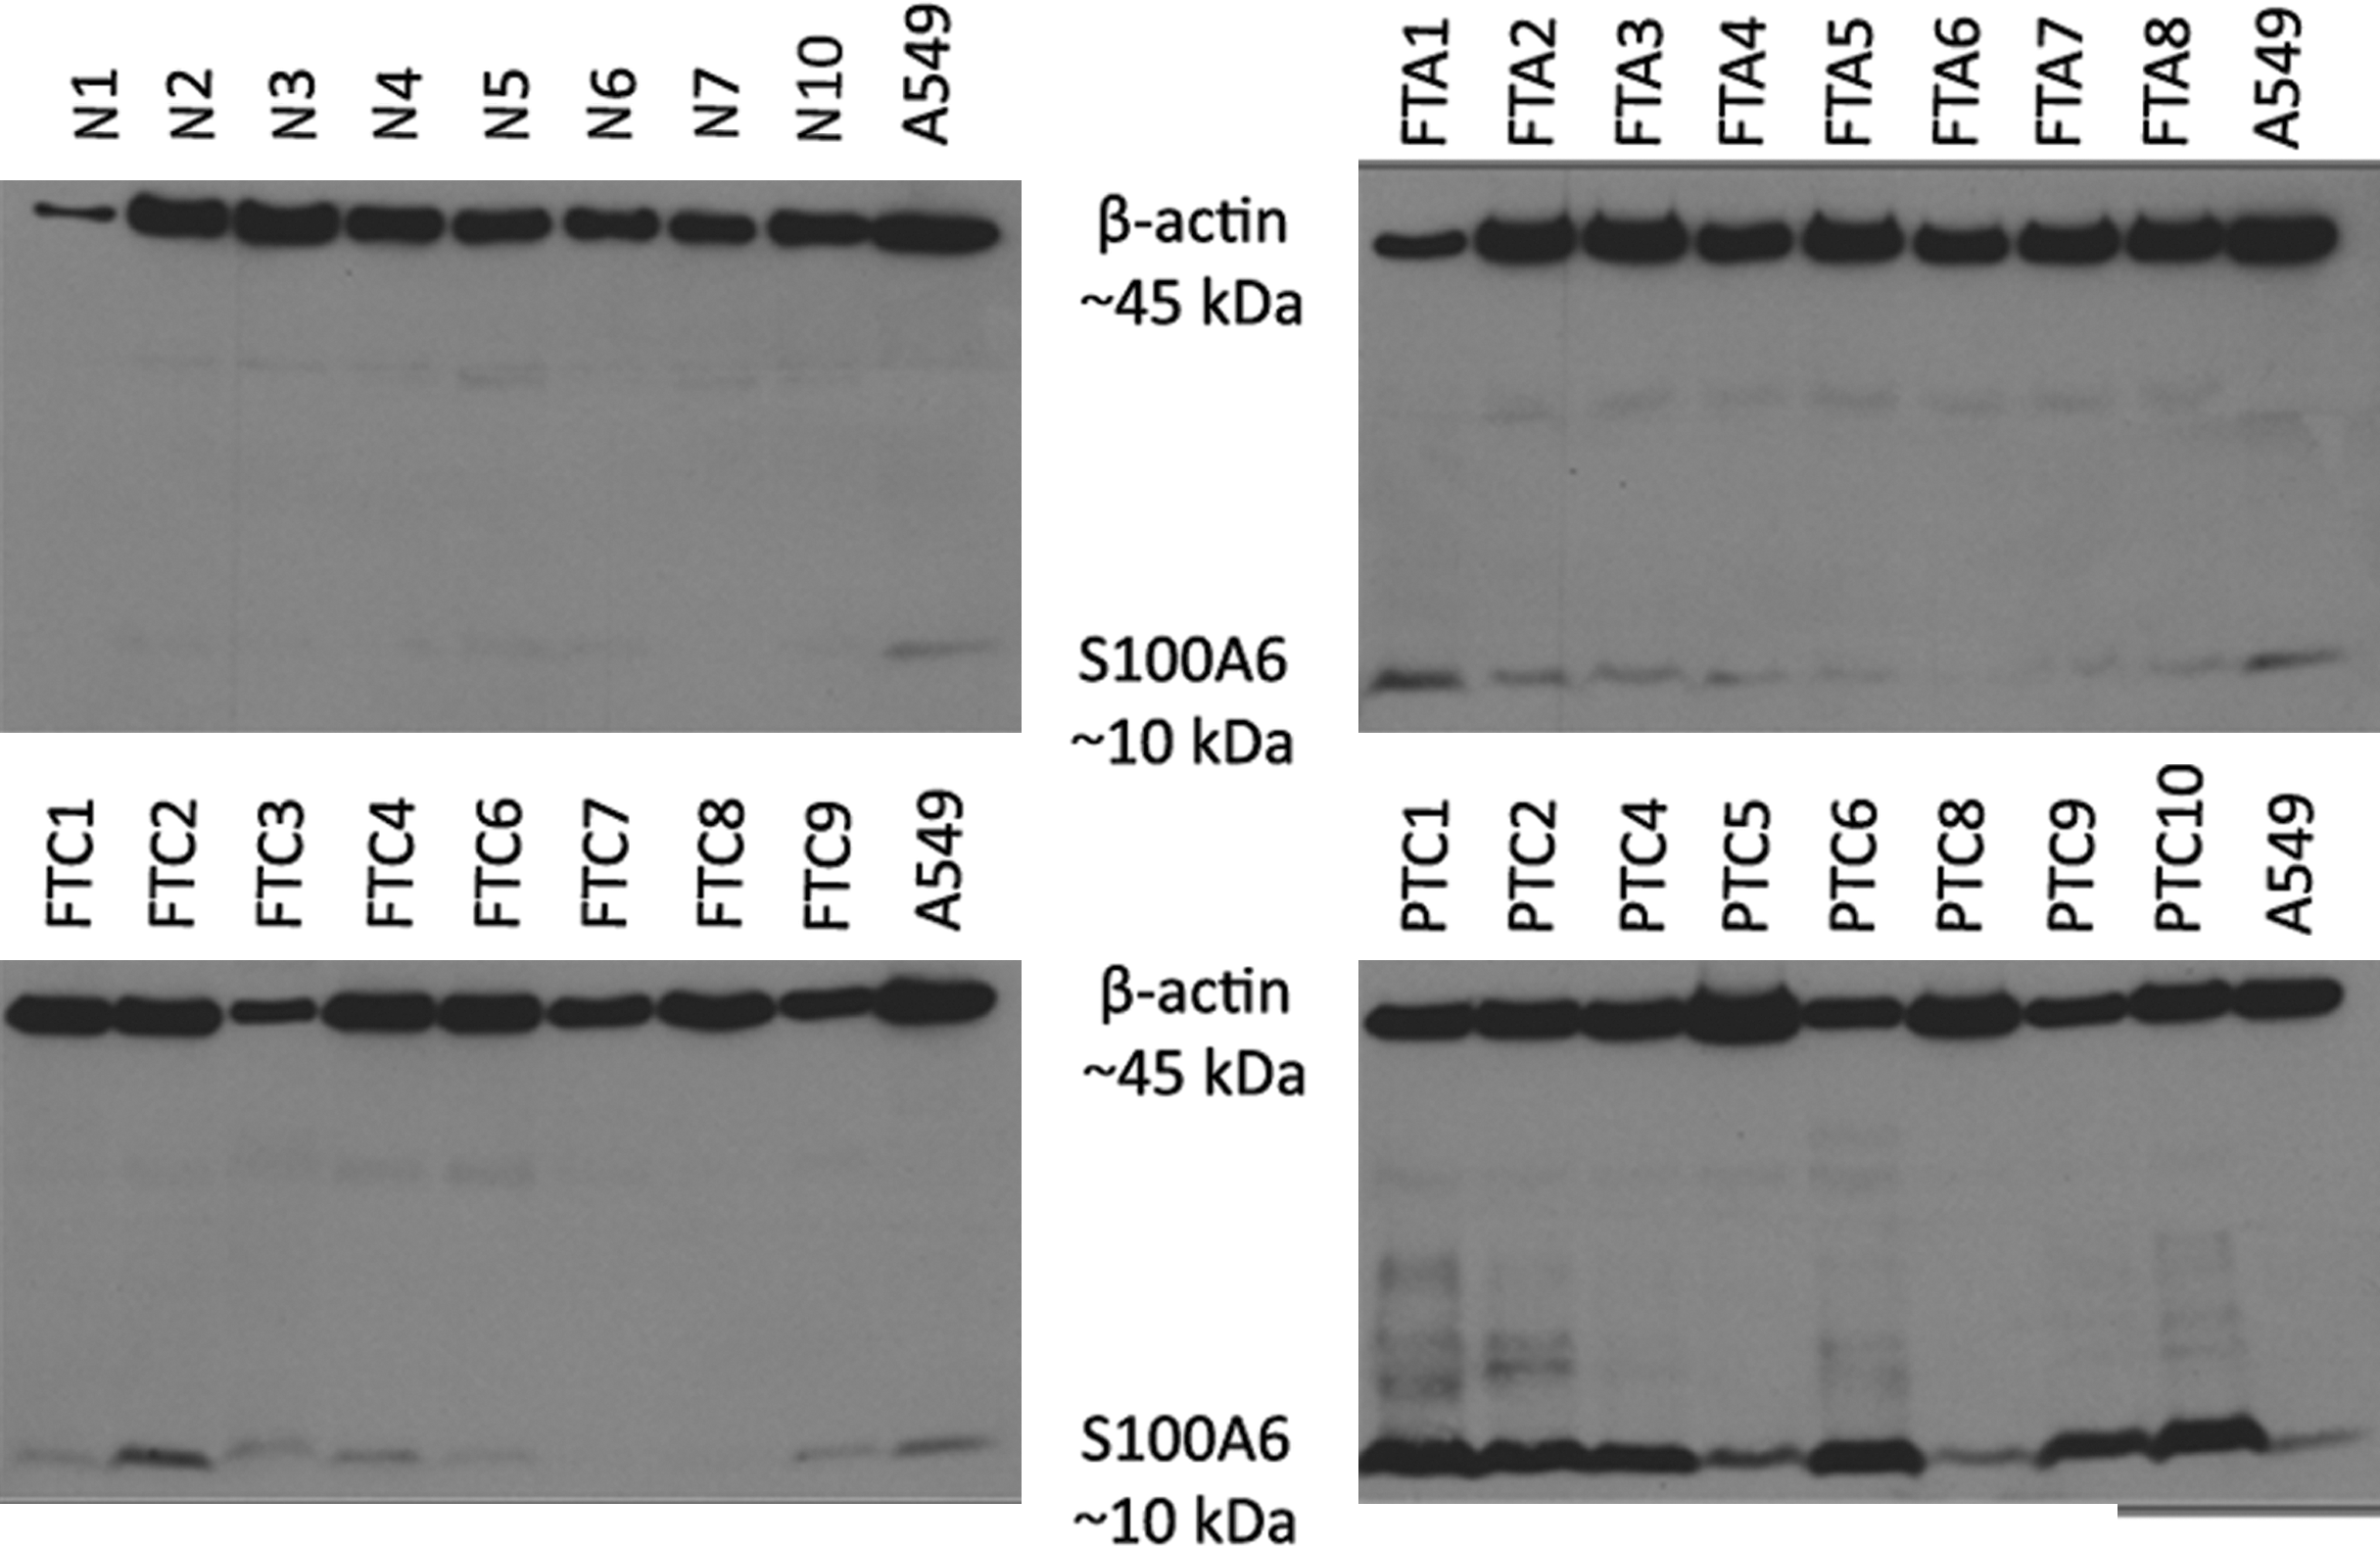
Western blots for all study groups illustrating the over-expression of S100A6 in PTC. β-actin was used as loading control, and total protein extract from the lung cancer cell line A549 was used as a positive control for S100A6 expression.
Immunohistochemical analysis of S100A6
To further verify the S100A6 expression observed in SELDI-TOF-MS and Western blot analysis, IHC was performed on paraffin sections from the same sample series. The results of the IHC evaluation are summarized in Table 1. Figure 6A exemplifies samples with absent, weak, moderate, and strong cytosolic or nuclear staining intensities. With very few exceptions, all studied tumors presented a uniform cytosolic immunoreactivity in all cells, however at varying intensities (Supplementary Table S1). Nuclear immunoreactivity varied both in terms of intensity and proportion of positive nuclei. With regard to cytosolic staining, three out of nine FTAs and four out of nine FTCs displayed moderate or strong staining, whereas this was the case for the majority of PTCs (9 out of 10). A significantly stronger cytosolic staining was seen in PTC than in follicular tumors (p = 0.004). The PTC also displayed a larger proportion of stained nuclei in comparison with follicular tumors (p = 0.01).

(
FTA, follicular thyroid adenoma; FTC, follicular thyroid carcinoma; PTC, papillary thyroid carcinoma; irPTC, PTC with irradiation history.
Based on the previous finding, we decided to expand our study by carrying out IHC analysis on 70 cases of PTC with a history of irradiation. For the majority of samples within this cohort (90%), S100A6 staining was scored as strong both in the cytoplasm and in the nucleus. Moreover, the proportion of positively stained nuclei was greater than 75% in all cases (Fig. 6B).
BRAF mutation screening in PTC cases
Transversion of T to A in position 1799 (T1799A) of exon 15 is the most common point mutation in the BRAF gene leading to a missense substitution of valine to glutamate in position 600 (V600E) (24). This mutation is particularly correlated with PTC, and we wanted to investigate any possible connection between BRAF pathway activity alterations and S100A6 expression levels. The T1799A point mutation was identified in five PTC cases (50%). There was, however, no significant correlation (p = 0.05) between this and S100A6 expression levels with the latter being expressed either as peak intensity values (SELDI-TOF-MS) or densitometry values (Western blot) (Supplementary Table S1). No mutation in exon 11 was found.
Discussion
This study has revealed a significant over-expression of S100A6 in PTC, in comparison with follicular tumors and thyroid normal tissue, by using a series of different methodologies. Moreover, the existence of different forms of S100A6 in thyroid tumors was demonstrated and proved by LC-MS/MS, something that was previously shown in lung tumors and cell lines only (11,22). We also investigated the relation between S100A6 expression levels and BRAF mutation in PTC, without being able to prove any correlation.
The S100 proteins seem to be involved in thyroid tumorigenesis. Cabala et al. investigated the expression pattern of S100A11 (S100C) in thyroid tumor tissue as part of a larger proteomics study. The IHC showed that this particular protein was distinctly localized in the nucleus in normal tissue and follicular tumors (both FTA and FTC), whereas in PTC it was predominantly localized in the cytoplasm (25). Ito et al. carried out an IHC study, providing evidence that expression of S100A4 can be an early event in PTC formation, but it could not be related to tumor characteristics such as size, lymph node metastasis, tumor multifocality, or extrathyroidal invasion (26). Another IHC investigation using PTC along with matched normal tissue and lymph node metastasis showed that S100A4 expression was significantly higher at the tumor-invading front and in the corresponding metastatic tumor than in the primary tumor (27). Recently, Ito et al. provided evidence that S100A8 along with S100A9 are elevated almost exclusively in undifferentiated thyroid carcinoma (28).
The S100A6 has been connected to a wide range of tumor diseases, such as colorectal cancer (13,15,29), lung cancer (11), gastric cancer (30), malignant melanoma (14), cutaneous tumors (31), and hepatocellular carcinoma (12). The S100A6 in relation to thyroid tumors has, until now, been the object of only two studies. The IHC analysis of 141 tissue specimens from all kinds of thyroid tumors showed that PTC displays a higher S100A6 expression level than anaplastic thyroid carcinoma, FTC, or FTA (32). A proteomics study performed on total protein extracts identified S100A6 to be over-expressed in PTC when compared with matched normal tissue. Validation of the results by IHC showed that S100A6 significantly identified malignant thyroid neoplasms (33).
The primary objective of our study was to identify protein markers distinguishing thyroid tumors, potentially facilitating FNAB diagnosis. This study is unique in the sense that quantitative methods were used, namely SELDI-TOF-MS and Western blot, comparing normal thyroid tissue and well-differentiated thyroid tumors by using prefractionated protein extracts. Prefractionation is advantageous, as the sample quality is improved in terms of plasma contamination removal; and the additional fractionation step increases information content in the proteomics experiment when compared with total protein extracts (17). Moreover, using LC-MS/MS analysis, we could demonstrate that S100A6 is present in thyroid tissue in different forms: nonmodified, cysteinylated, glutathionylated, carbamidomethylated, and glucuronylated.
The initial approach of this study by SELDI-TOF-MS showed an indisputable over-expression of S100A6 in PTC. Even if the signal intensities in this group display a relatively large variance (Fig. 2), they still remain significantly higher than in normal thyroid or follicular tumors. The latter present with signal clusters on a level consistently lower than or equal to the weakest PTC signal. Western blot results strongly validate these first findings. Protein bands corresponding to S100A6 are significantly stronger in PTC than in the rest of the groups. By using IHC, the differences are less obvious than expected, but this can probably be attributed to methodological differences per se (antigen retrieval in IHC performs differently than protein denaturation/epitope exposure in Western blot). The strong S100A6 expression pattern in PTC was also verified in a larger sample series.
The way these quantitative differences of S100A6 reflect on the protein's intracellular behavior and interactions with its molecular partners is yet another point that needs to be further elucidated. Matsuzawa and Reed displayed a potential involvement of Siah-1 interacting protein—the human ortholog of mouse calcyclin (S100A6)-binding protein (CacyBP)—in the degradation of β-catenin through a nonphosphorylation-dependent pathway (34). More recently, it was shown that S100A6 itself binds to p53, thus affecting its role as a tumor suppressor (35,36). In addition, Joo et al. provided evidence that S100A6 can function as an enhancer of apoptosis through the upregulation of caspase-3 activity in Hep3B cells (37). The strong up-regulation of S100A6 in connection to anticancer therapy (irradiation) suggesting a role in tumor cell response to treatment is also of potential interest (22).
Even if the molecular mechanism of function of S100A6 remains somehow unclear, we postulate that its role as a PTC marker is of interest in a clinical setting. A prospective FNAB study would, therefore, be suitable for providing evidence of the possible use of S100A6 as a diagnostic marker.
Footnotes
Acknowledgments
The authors thank Lisa Ånfalk for the technical assistance with tissue samples as well as Hanna Eriksson, Maria Pernemalm, and Sara Ståhl for the invaluable help and guidance in using Ciphergen ProteinChip Software to analyze SELDI-TOF-MS spectra. This study was financially supported by the Swedish Cancer Society, the Swedish Research Council, the Cancer Society in Stockholm, the Stockholm County Council, and the Göran Gustafsson Foundation for Research in Natural Sciences and Medicine.
Disclosure Statement
The authors declare that no competing financial interests exist.