
Abstract
Background:
RET/PTC1 rearrangement is the most common genetic alteration identified to date in papillary thyroid carcinomas (PTC) and represents an interesting target for small interfering RNA (siRNA) strategies because it is present only in the tumor cells and not in the normal cells. Our aims were (i) to target the RET/PTC1 oncogene by siRNAs, (ii) to assess the knockdown effects on cell growth and cell cycle regulation, and (iii) to identify genes affected by the RET/PTC1 silencing.
Methods:
Three efficient siRNAs previously designed in our laboratory in a model of murine PTC (RP-1 cells) were used to knockdown RET/PTC1 in the TPC-1 cells. By reverse transcriptase-polymerase chain reaction (RT-PCR) and quantitative RT-PCR (Q-RT-PCR) they were found unable to silence RET/PTC1. After sequencing, we redesigned an siRNA against RET/PTC1 (siRNARET/PTC1) and compared it for its efficiency and specificity with an siRNA against RET (siRNARET) in the TPC-1 cells, in human cell lines that expressed RET (MCF-7 and BT-474 cells), and in the murine RP-1 cells. The effects on cell cycle growth (MTT tests), cell cycle (flow cytometry), and apoptosis (TUNEL method) were studied. Genes affected by the RET/PTC1 knockdown were identified by microarray analysis followed by Q-RT-PCR validation.
Results:
A mutation was found by sequencing within the H4 part of the RET/PTC1 junction leading to a 297T→G substitution. The redesigned siRNARET/PTC1 inhibits about 85% of the oncogene expression in the human TCP-1 cells. The specificity of the siRNARET/PTC1 was confirmed by the absence of a silencing effect on the human breast MCF-7 and BT-474 cells without RET/PTC1 and the murine RP-1 with 297G→T mutation. The downregulation of RET/PTC1 modified the cell cycle and induced an apoptotic response. Microarray analysis revealed an inhibition of E2F2 transcription factor known to be involved in the cell cycle regulation.
Conclusions:
This study shows the impact of a point mutation within a junction oncogene on the siRNA design. In the case of a therapeutic approach by siRNA, the junction oncogene must be systematically sequenced. The E2F2 gene regulation would have a biological significance and seems to be directly mediated by RET/PTC1.
Introduction
The prognosis of PTC is generally good, depending on the biological behavior of the tumor and on receiving appropriate initial treatment (13,15), which includes total thyroidectomy and functional lymph node dissection, followed by radioiodine therapy, and rarely, radiotherapy or chemotherapy. However, a considerable number of patients, ∼30%, as shown after 30 years of follow-up, have recurrent disease. This constitutes an area of important research on emerging therapies such as using small interfering RNA (siRNA) to target the RET/PTC1 fusion oncogene because it is present only in the tumor cells and not in the surrounding normal cells.
We have previously shown the efficacy of siRNA against RET/PTC1 junction in a murine model NIH/3T3/RP-1 cell line (16). Here, we prove the importance of the junction sequence for the siRNA design in the human PTC cell line (TPC-1). We also identified genes affected by the RET/PTC1 knockdown and studied the RET/PTC1 silencing effect on apoptosis and cell cycle regulation.
Materials and Methods
Cell lines
The human TPC-1 cell line that harbors the RET/PTC1 rearrangement was kindly provided by Dr. Dupuy (FRE2939 CNRS, IGR, Villejuif, France). RET-expressing human breast cancer cell lines BT-474 (ATCC® HTB-20™) and MCF-7 (ATCC® HTB-22™) were kindly provided by Dr. Cappellen (UMR8126 CNRS, IGR, Villejuif, France). The murine NIH/3T3 stably transfected by the RET/PTC1 expression plasmid giving the RP-1 cell line was selected and continuously cultured in the presence of 5 μg/mL puromycine (16). These cell lines were maintained at 37°C, 5% CO2 in Dulbecco's modified Eagle's medium (Invitrogen) for TPC-1 and MCF-7 cell lines and RPMI-1640 for BT-474 cell line. Media were supplemented with 10% fetal bovine serum, 100 U/mL penicillin, and 100 μg/mL streptomycin (Invitrogen). The volume of cell culture media used during experiments was 2 mL/well for cells cultured in six-well plates.
siRNA design
Sequences used for designing siRNA were Homo sapiens H4/RET fusion mRNA, partial sequence (AF395885.1) blasted with Homo sapiens coiled-coil domain containing 6, mRNA (NM_005436.3), and Homo sapiens RET proto-oncogene, transcript variant 4 (NM_020630.4). siRNAs were chemically synthesized by Sigma-Aldrich Chimie S.a.r.l.
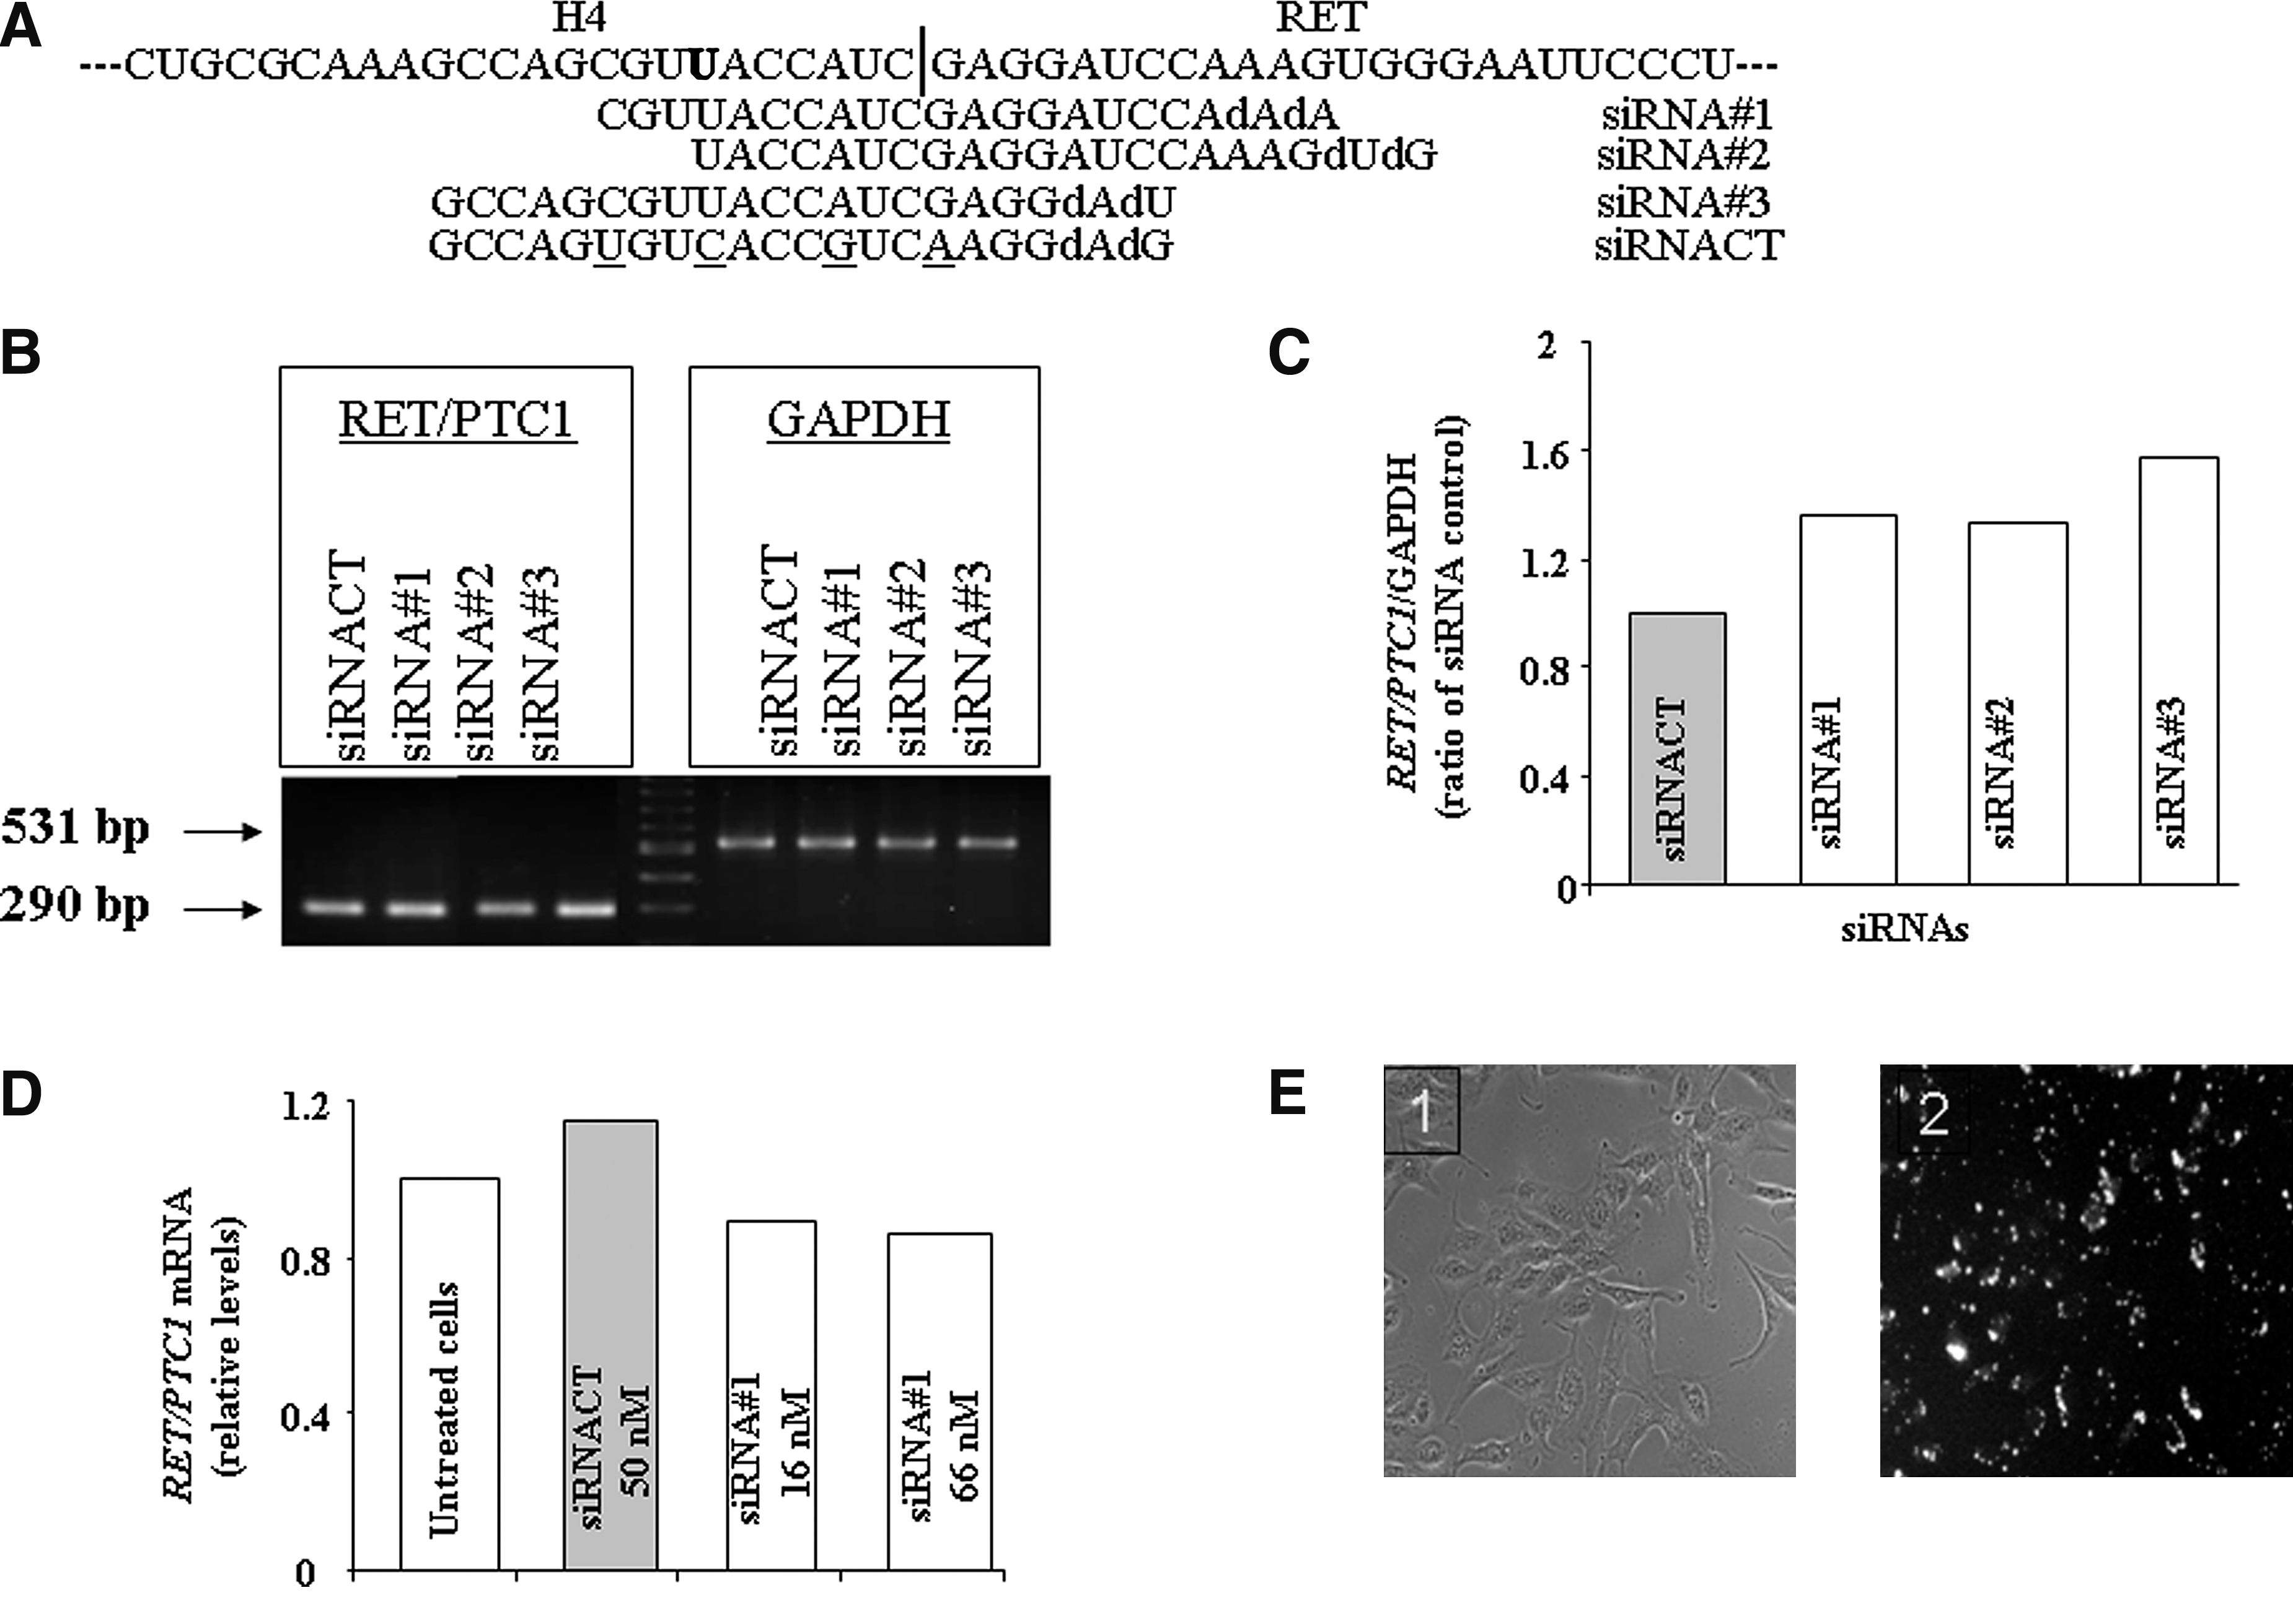
We used three of the five siRNAs targeted to H4/RET junction (here named siRNA#1, siRNA#2, and siRNA#3) already designed (16) and screened in the TPC-1 cells (Fig. 1A). After sequencing (described further) of the RET/PTC1 junction in TPC-1 cells, we designed (i) an siRNA targeted to H4/RET (position in mRNA: 293–313 bases; 10 bases in the H4 mRNA part and 11 bases in the RET mRNA part) termed siRNARET/PTC1, and (ii) an siRNA designed by Dr. S. Chevillard (CEA, France) targeted against the RET mRNA (1091–1112 bases in the RET mRNA part) named siRNARET. The irrelevant siRNA scrambled sequence used as a control (siRNACT) in the experiments was prepared from the RNA sequences given in Figure 1A and was also described by de Martimprey et al. (16).
Small interfering RNA #1 (siRNA#1), #2, and #3 were inefficient in TPC-1 cells. (
siRNA transfection
Transient transfection of siRNAs was carried out using Lipofectamine 2000 transfection reagent (Invitrogen) according to manufacturer's instructions. Briefly, 24°hours before transfection, 3 × 10⁵ TPC-1 cells or 4 × 10⁵ BT-474, MCF-7, and RP-1 cells were seeded in six-well plates. Transfections were performed in serum-free OPTI-MEM using different siRNA concentrations and 6 μL Lipofectamine. Cells were incubated for 24 hours to allow time for Ret knockdown. Then, RNA was extracted for polymerase chain reaction (PCR) analysis. Rhodamine-labeled siRNA#1 was used to monitor the efficiency of siRNA transfection.
RNA extraction and semiquantitative reverse-transcriptase polymerase chain reaction analyses
Total RNA was extracted from TPC-1 cells and breast cancer cell lines using RNeasy mini-kit (Qiagen). First-strand cDNA was generated with M-MLV RT buffer pack (Promega).
On the basis of human H4/RET mRNA sequence (GenBank: AF395885.1) oligonucleotide forward 5′-AGATAGAGCTGG AGACCTAC-3′ and reverse 5′-CTGCTTCAGGACGTTGAA-3′ primers were designed to produce PCR fragments of 290 bp. GAPDH forward 5′-CATTGTCATACCAGGAAATG-3′ and reverse 5′-GACAACTCACTCAAGATTGTCAG-3′ primers that amplify 531 bp were used as an internal gene control. PCR was performed with 100 ng of DNA in 25 μL PCR containing 10 mM Tris-HCl (pH 8.3), 1.5 mM MgCl2, 200 μM dNTPs, 0.6 IU Taq polymerase, and 0.3 μM of each primer. Amplifications were performed with a 30-second denaturation step at 94°C, 30 seconds annealing at 60°C, and 1-minute extension at 74°C. The PCR products were detected and sized in an agarose gel (2%). A 100-bp ladder (OZYME) was used as a standard. For semiquantitative estimation, the signals of each cDNA were normalized using the values of the corresponding products from the GAPDH amplification, and the expression of these genes was compared at the logarithmic phase of the PCR.
Sequencing of cDNA product
PCR products obtained after amplification were sequenced in both directions based on GENOSCREEN using the Applied Biosystems Kit (BDT version 3.1) on an ABI PRISM 9700 TaqMan (Applied Biosystems, Perkin-Elmer). Purification of the sequenced reactions was performed on G50 (Sigma) according to the usual screening methods. Products were detected on a 96-capillary sequencer (3730XL; Applied Biosystems).
Real-time PCR by quantitative reverse-transcriptase PCR
Real-time PCR was carried out with the ABI PRISM 7000 Taqman (Applied Biosystems, Perkin-Elmer) using SYBR GreenER qPCR Supermix for ABI PRISM (Invitrogen) according to manufacturer's instructions. All PCRs were performed in duplicate. Gene regulation was determined by the 2−ΔΔCt method (17,18) and normalized to RPL13A levels for human cell lines (19) and mouse Ef1α for RP-1 cell line (20). The results are given as relative fold compared with untreated cells.
Protein extraction and Western blot analysis
For Western blot analysis, total protein extracts were prepared at 24, 48, and 72 hours after siRNA transfection for TPC-1 cells and at 24 hours after siRNA transfection for BT-474 and MCF-7 cell lines. Total protein extracts were obtained using M-PER reagent (Pierce) with protease inhibitors cocktail (Roche). Proteins were titrated by the BCA method using the BCA protein assay (Thermo Scientific/Pierce). Thirty micrograms of cell extracts were boiled in Laemmli loading buffer and separated on 10% sodium dodecyl sulfate–polyacrylamide gel electrophoresis gel. Proteins were transferred using the iBlot™ Dry Blotting System (Invitrogen) on precut nitrocellulose membranes and then blocked with 0.2% casein (I-Block reagent; Tropix) in phosphate-buffered saline (PBS) with 0.1% Tween-20. The membranes were incubated overnight at 4°C with the primary antibodies specific for RET (C-19: sc-167; Santa Cruz Biotechnology 1:200) or β-actin (rabbit polyclonal, 1:1000; Sigma-Aldrich Chimie S.a.r.l.) used as an internal control. Blots were washed and incubated with anti-rabbit antibody conjugated to alkaline phosphatase (1:20,000; Tropix) for 1 hour at room temperature and subsequently washed and revealed using CDP Star chemoluminescence reagent (Perkin Elmer).
MTT assay and cell cycle analysis
TPC-1 cells were plated in 12-well plates (2 × 10⁴ cells/well). Cells were transfected after 24 hours, with 50 nM siRNAs (lipofectamine only in control group) and maintained for 48, 72, and 96 hours. One hundred microliters of MTT reagent (5 mg/mL; Sigma-Aldrich Chimie S.a.r.l.) was added to each well. After 2 hours at 37°C, 1 mL of lysis buffer (HCl 10 mM and sodium dodecyl sulfate 10%) was added and incubated overnight at 37°C. The absorbance of each well was measured in 96-well plates with an MRXII photometer (Dynex Technologies) at 570 nm wavelength.
For cell cycle analysis, TPC-1 cells were seeded at 3 × 10⁵ in medium and transfected with 50 nM siRNAs. Cells were incubated for 48, 72, and 96 hours, trypsinized, and fixed in 70% ice-cold ethanol overnight at −20°C and then labeled with 20 mg/mL propidium iodide for 1 hour at 37°C. Cell cycle progression was analyzed using a Calibur BD Biosciences Flow Cytometer (BD Biosciences).
Apoptosis determination
Apoptosis was evaluated with an in situ TUNEL method using terminal deoxynucleotidyl transferase (Promega). TPC-1 cells (2 × 10⁵) were cultured on six-well plates with coverslip and transfected as previously described using 50 nM siRNAs. After 24 and 48 hours of incubation, cells were fixed in 4% paraformaldehyde (PFA) for 20 minutes, washed with PBS, permeabilized with 0.1% Triton X-100 in 0.1% sodium citrate for 2 minutes on ice, incubated with 1 μg/mL 4′,6-diamidino-2-planolindole (DAPI) for 1 minute at room temperature, and then incubated with TUNEL reaction mixture for 1 hour at 37°C in a dark humidified chamber. After PBS washing, cells were fixed on slides. For positive controls, TUNEL method was performed on 8 Gy-irradiated TPC-1 cells; for negative controls, cells were permeabilized in 50 μL/well label solution of terminal deoxynucleotidyl transferase only instead of TUNEL reaction mixture. Fluorescein labels incorporated in nucleotide polymers were detected by fluorescence microscopy (Leica Leitz DMRB; Leica Microsystems GmbH). To determine the apoptotic index, 1000 were counted on each slide and the average number of apoptotic cells was established.
Whole-genome microarray analysis
Three independent transfections were performed with 50 nM siRNARET/PTC1, siRNARET, or siRNACT on TPC-1 cells. Total RNAs of untreated cells and transfected cells were extracted using RNeasy mini-kit (Qiagen) and gathered in four pools. Protocol is detailed in ArrayExpress (Accession Number: E-TABM-746). The mRNA pools were labeled using fluorescent low-input linear amplification kit (Agilent®). Briefly, reverse transcription was performed using M-MLV reverse transcriptase. Then, cyanine 3- or 5-labeled cDNAs were generated using T7 RNA polymerase. Hybridizations were carried out for 17 hours at 60°C with 1 μg of untreated cells and silenced cells on Agilent human whole genome oligo microarray 44k. Slides were scanned using an Agilent 2565 AB DNA microarray scanner. Microarray images were analyzed with Feature extraction software version A.8.5.1.1. (Agilent). Raw data files were then imported into Resolver® system for gene expression data analysis (Rosetta Inpharmatics LLC). We defined up- or downregulation as ratios greater than twofold between treated TPC-1 with siRNAs (siRNARET/PTC1, siRNARET, or irrelevant siRNA sequence) and untreated cells, acquired with a p-value ≤10−5 and a minimum intensity >100.
Data availability
All data obtained from the microarray analysis were submitted to Array Express at the European Bioinformatics Institute (
Validation of microarray analysis by quantitative reverse-transcriptase PCR
Reverse transcription and quantitative real-time PCR were performed as previously described, using the specific primers detailed in Table 1. Gene-specific primers were designed using the Oligo Explorer 1.1.0 and Oligo Analyzer 1.0.2 programs (Kuopio University, Kuopio, Finland). Whenever possible, primers were selected with a 60°C melting temperature and an amplicon size of 100–200 bases (Table 1). Samples were run in duplicate with primer sets of the gene of interest and the RPL 13A control gene.
Primers designed for RET were described in the siRNA design subsection (under the Materials and Methods section).
F, forward primer, R, reverse primer; PCR, polymerase chain reaction.
Statistical analysis
Means of treatment groups were compared with one-way analysis of variance (ANOVA). When ANOVA showed that there were significant differences between the groups, Dunnett's test or Bonferroni's test was used to identify the sources of these differences. A p-value of ≤0.05 was considered statistically significant.
Results
siRNA#1, #2, and #3 were inefficient in TPC-1 cells
We first tested siRNA#1, siRNA#2, and siRNA#3 in the human TPC-1 cell line (Fig. 1A). As shown in Figure 1B, none of the siRNAs tested at 50 nM concentration was able to reduce the RET/PTC1 expression in the TPC-1 (Fig. 1C, quantification results). The siRNA#1, found to be the most efficient in RP-1 cells (16), was tested by quantitative RT-PCR (Q-RT-PCR) in TPC-1 cells at 16 and 66 nM concentrations and no silencing was found (Fig. 1D). We therefore examined the transfection efficiency in the TPC-1 cells using rhodamine-labeled siRNA#1. As shown in Figure 1E, a characteristic spotty distribution of fluorescence around and within the nuclei was detected and the transfection efficiency was estimated to be ∼90%.
Detection of a mutation in the TPC-1 cells
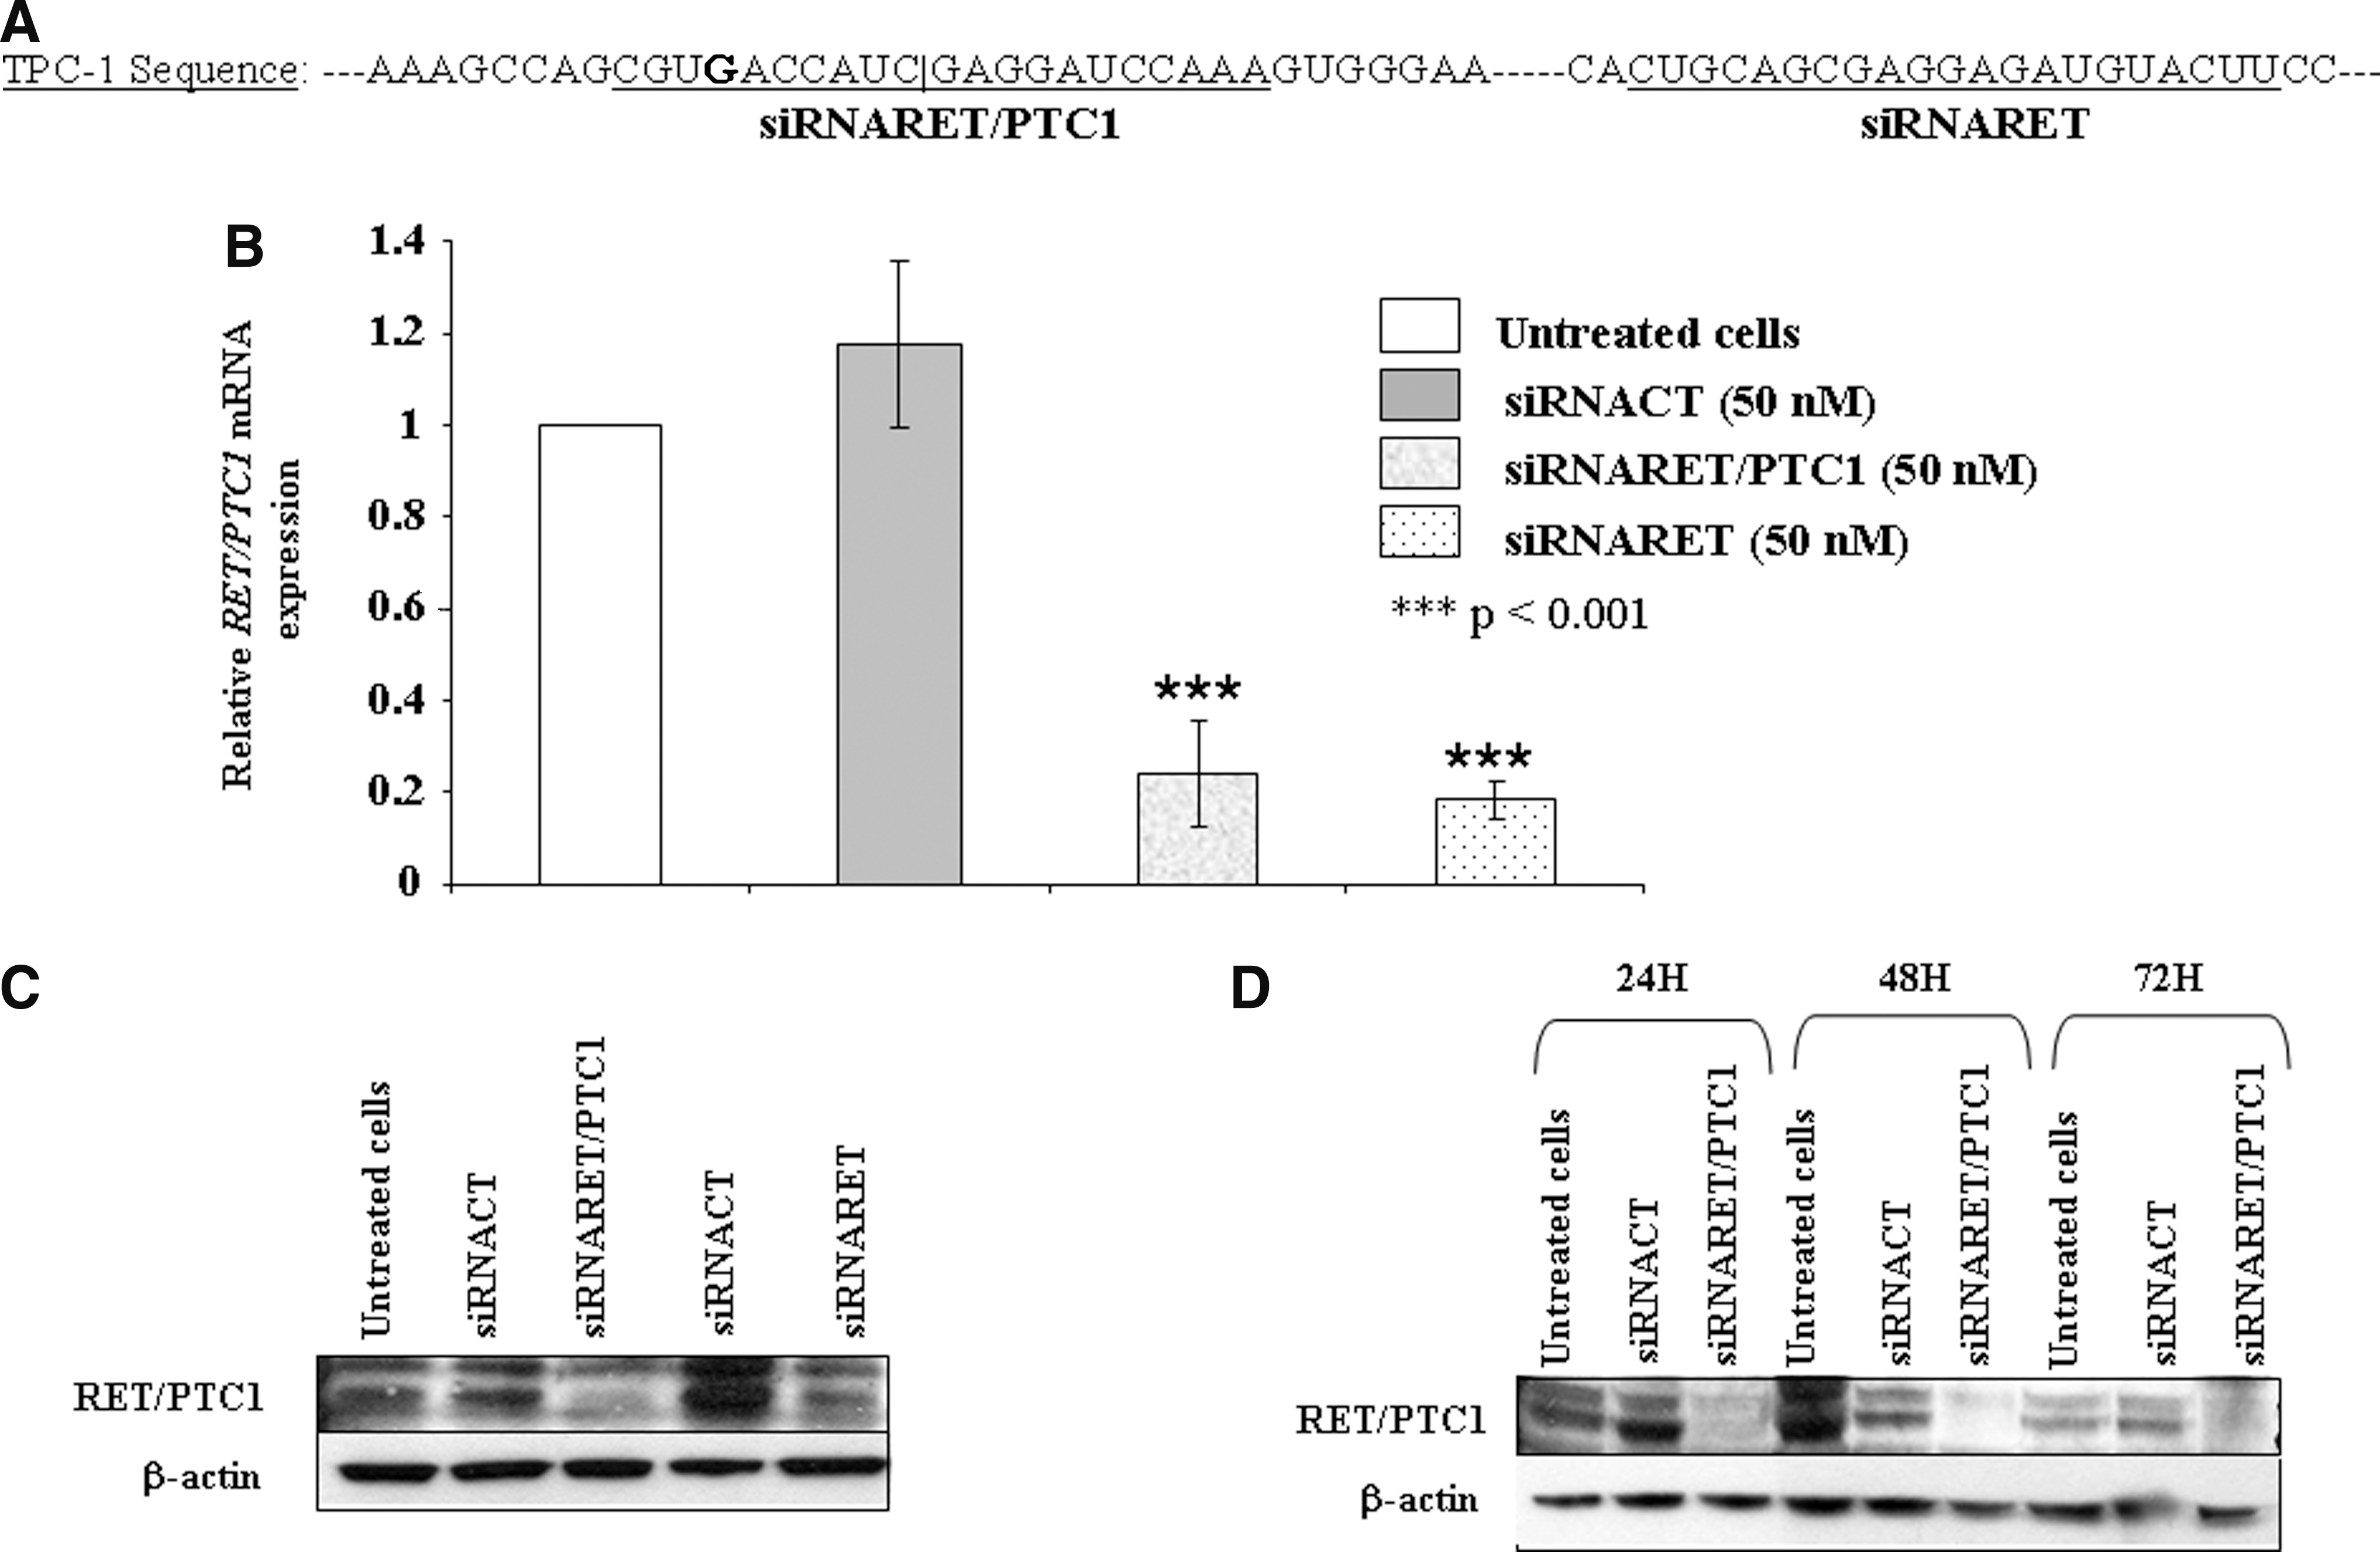
The RET/PTC1 junction was analyzed by sequence analysis using RET primers that cover 83 bp of H4 part and 207 bp of RET part. A comparison between the AF395885.1 sequence and the bidirectional sequence analysis indicated a change within the H4 part with a substitution of 297T→G. This nucleotide substitution (represented in bold in Figs. 1A and 2A) did not lead to any changes in the amino acid sequence. Also we checked the secondary RNA structure by using “RNA structure software” and found no changes in the RNA conformation.
siRNARET/PTC1 and siRNARET reduce RET/PTC1 expression in TPC-1 cells. (
siRNARET/PTC1 and siRNARET reduce RET/PTC1 expression in TPC-1 cells
We redrew siRNA#1 (Fig. 2A, left) by taking into account the nucleotide change, named it siRNARET/PTC1, and transfected it in the TPC-1 at 50 nM. The siRNA targeting the RET mRNA was tested at the same concentration (Fig. 2A, right). By Q-RT-PCR we found that both siRET/PTC1 and siRET significantly reduced RET/PTC1 mRNA levels by ∼80%, whereas the siRNACT did not show any statistical difference when compared with untreated cells (Fig. 2B). The downregulation of RET/PTC1 mRNA levels by siRNARET/PTC1 and siRET was paralleled by a decrease in RET/PTC1 protein content (Fig. 2C, lanes 3 and 5 from left). We also assessed the efficacy of RET/PTC1 oncoprotein silencing by siRNARET/PTC1 during 72 hours and found that the protein content decreased up to 72 hours posttransfection (Fig. 2D).
siRNARET/PTC1 is specific against the junction
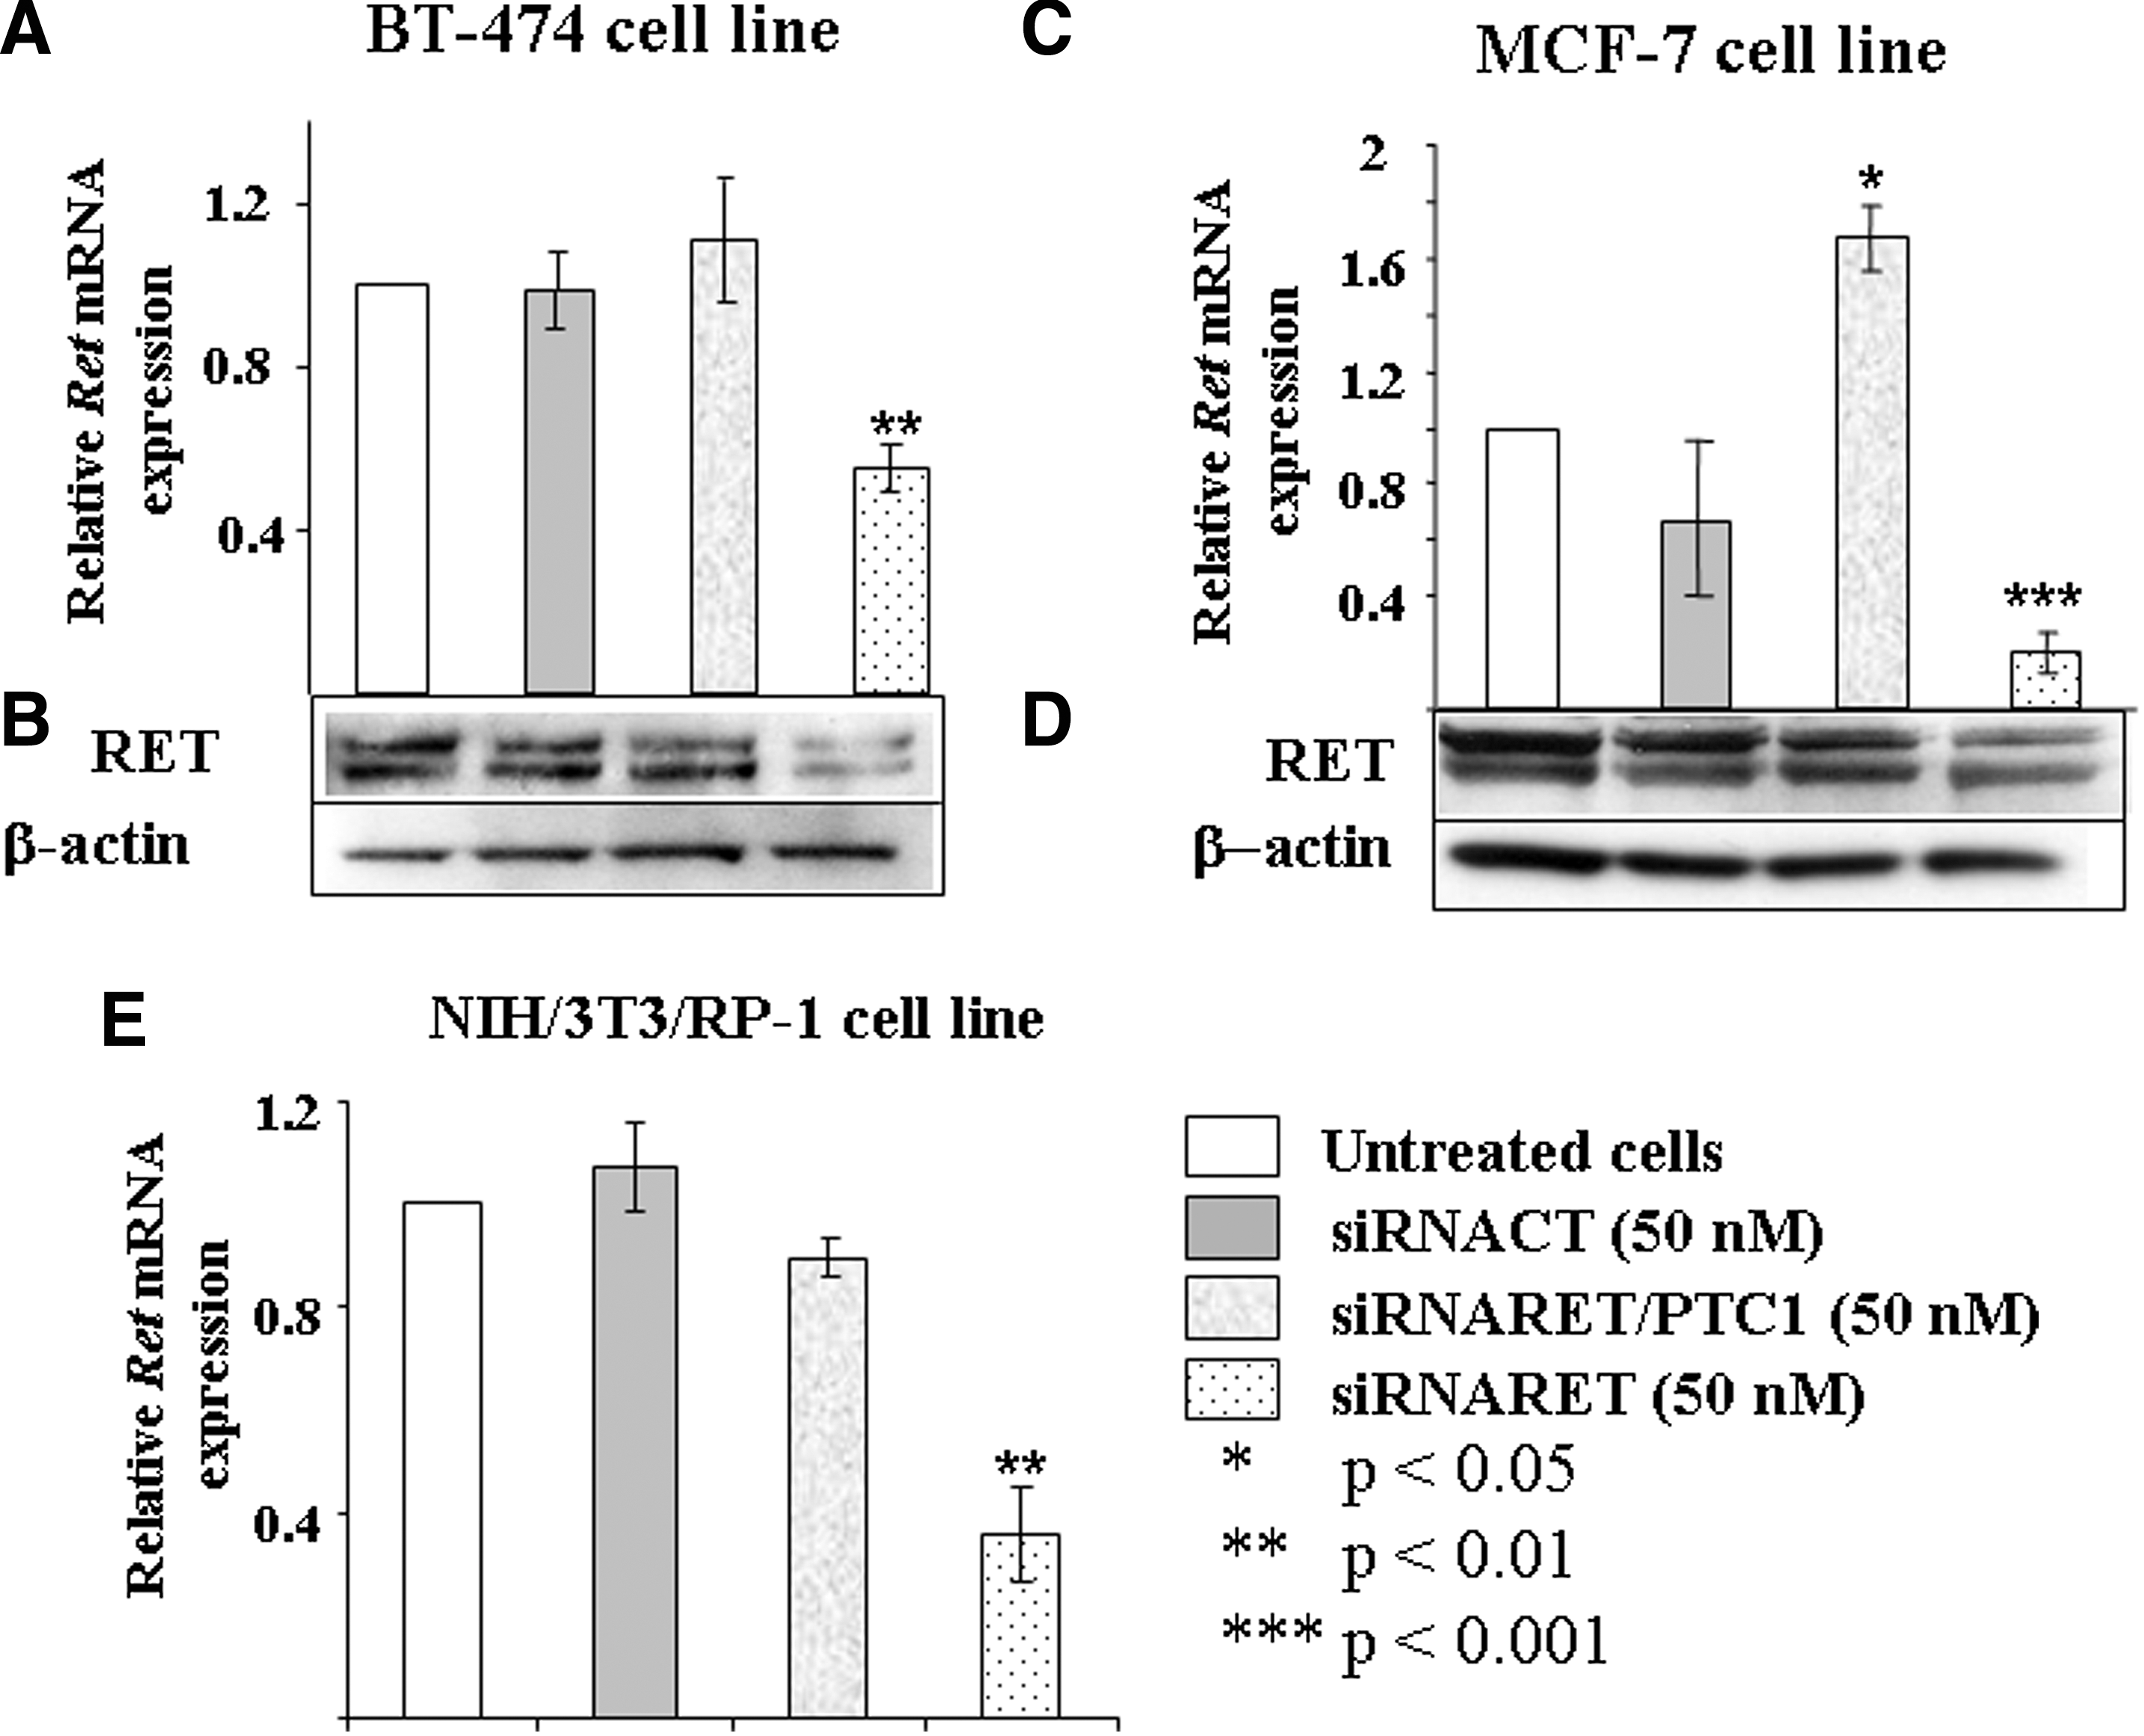
Specificity was tested in the RET-expressing human breast cancer cell lines BT-474, MCF-7 and in the murine RP-1 cells (Fig. 3). Treatment with the siRNARET/PTC1 did not affect either the RET mRNA or protein expression in BT-474 cell line (Fig. 3A and B, lane 3 from left). The RET mRNA expression increased in the MCF-7 cell line, but this upregulation did not affect the RET protein level (Fig. 3C and D, lane 3 from left). In contrast, the siRNARET decreased RET gene and protein expression in both cell lines (Fig. 3A–D, lane 4 from left). In the RP-1 cells, the siRNARET/PTC1 was also found to be inefficient, whereas the siRNARET caused a 65% decrease of the RET expression (Fig. 3E).
siRNARET/PTC1 is specific against the junction. Human breast carcinoma cell lines BT-474 (
siRNARET/PTC1 and siRNARET decrease cell proliferation and regulate the cell cycle
MTT assay showed a significant decrease at 24, 48, and 72 hours of the TPC-1 growth rate in siRNARET/PTC1-treated cells when compared with untreated cells or siRNACT (p < 0.001; Fig. 4A). The siRNARET decreased cell growth at 48 hours (p < 0.001) and the siRNACT had no effect on cell growth.

siRNARET/PTC1 and siRNARET decrease cell proliferation and alter cell cycle distribution. (
Cell cycle progression analysis showed a significant increase, 72 hours posttransfection, of the S-phase in siRNA-treated cells when compared with the siRNACT or with untreated cells (Fig. 4B).
siRNARET/PTC1 and siRNARET induce apoptosis
Apoptotic cells were detected using TUNEL staining and a fluorescence microscope (Fig. 5). Comprehensive counts showed a modest increase in apoptotic index at 24 and 48 hours for siRNARET/PTC1 and siRNARET-treated cells compared with siRNACT-treated cells or untreated controls (p < 0.01). At 24 hours, 8.4% ± 1.5% for siRNARET/PTC1, 4.1% ± 0.14% for siRNARET, and 1.7% ± 1.1% for siRNACT, and at 48 hours, 5.0% ± 2.6% for siRNARET/PTC1, 6.7% ± 0.6% for siRNARET, and 3.3% ± 1.2% for siRNACT, respectively, were found.
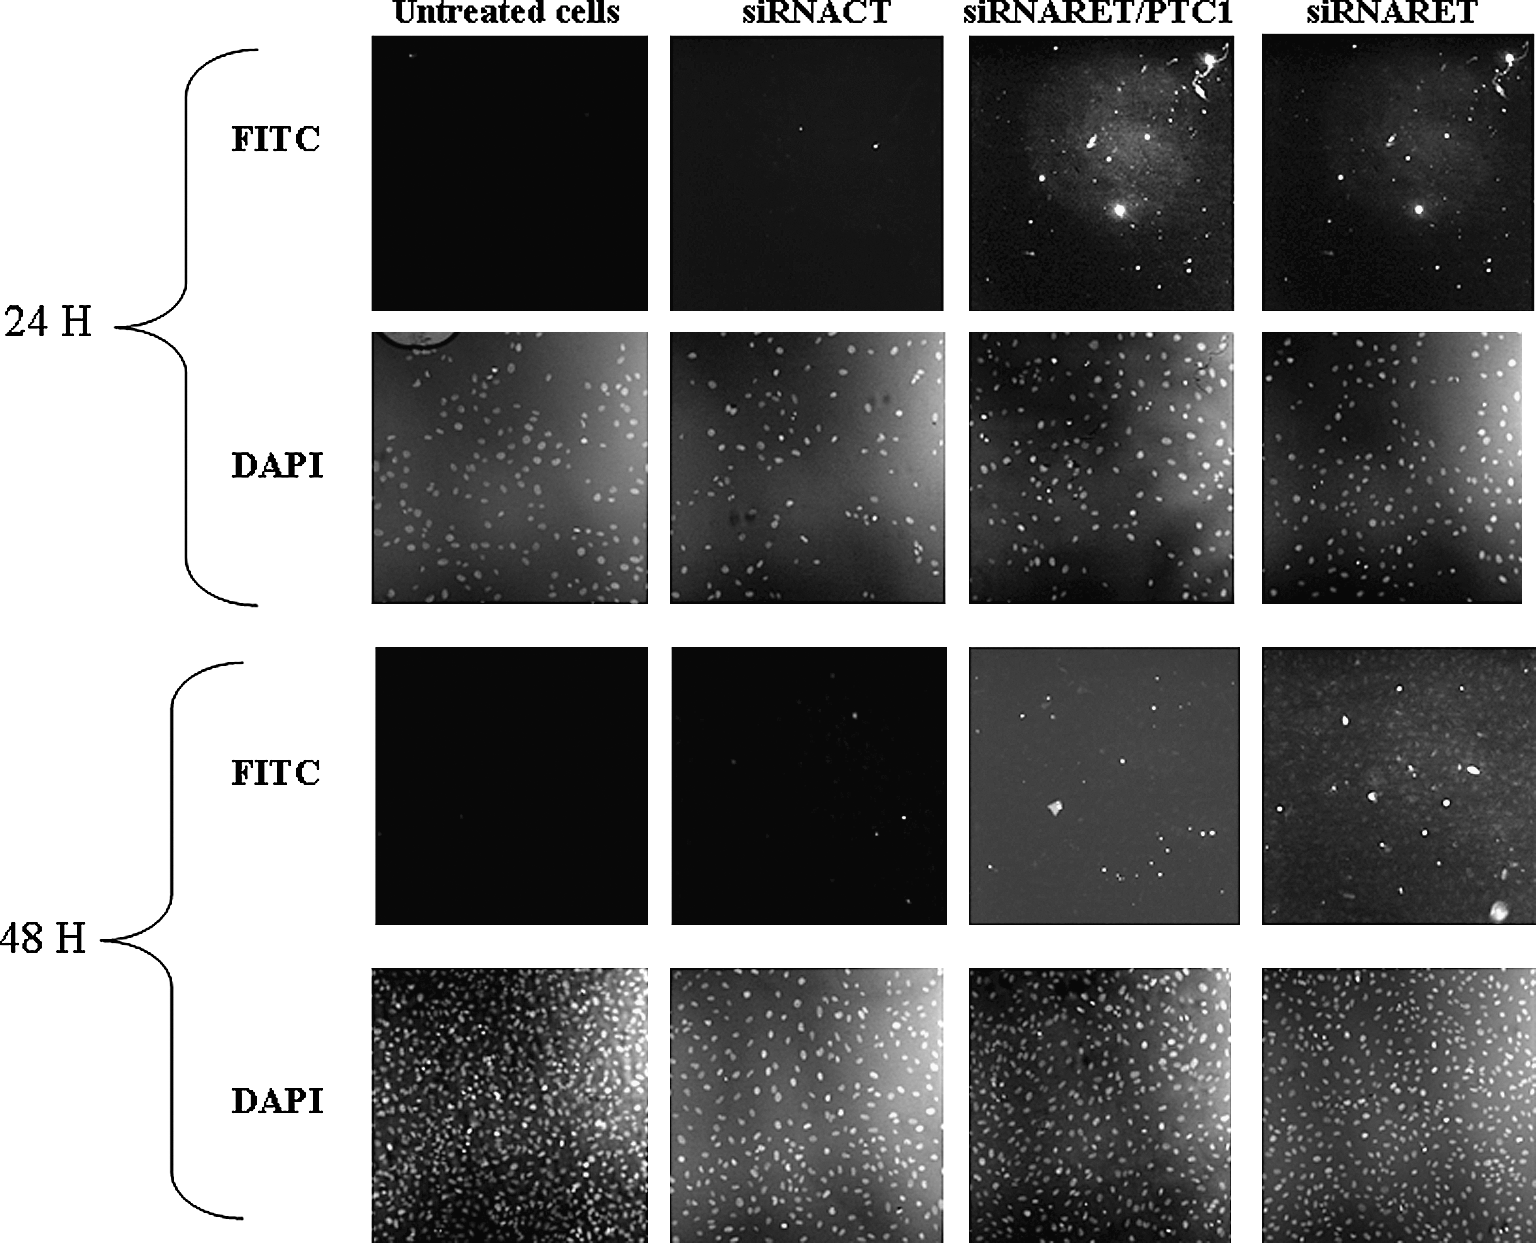
siRNARET/PTC1 and siRNARET induce apoptosis. TPC-1 cells were transfected using 50 nM siRNAs (CT, RET/PTC1, and RET). After 24 and 48 hours of incubation, cells were fixed and incubated with DAPI (unlabeled cells) and then with TUNEL reaction mixture (fluoresceine isothiocyanate or FITC). Fluorescein labels incorporated in nucleotide polymers were detected by fluorescence microscopy (bright cells). Representative images of two independent experiments are shown (magnification, ×10).
Microarray expression analysis of silenced RET/PTC1 oncogene by siRNAs
Before subjecting mRNA samples to microarray analysis, an inhibition of 80% of RET/PTC1 transcription with the siRNARET/PTC1 or with the siRNARET was checked in the same samples. To analyze the microarray results, a conservative threshold for change in gene expression was chosen (more than twofold change, p-value ≤10−5, and a minimum intensity >100). This allowed to select changes in gene expression with biological significance and to restrict the study to the most affected genes (data available on Array Express E-TABM-746; accession date: May 3, 2010).
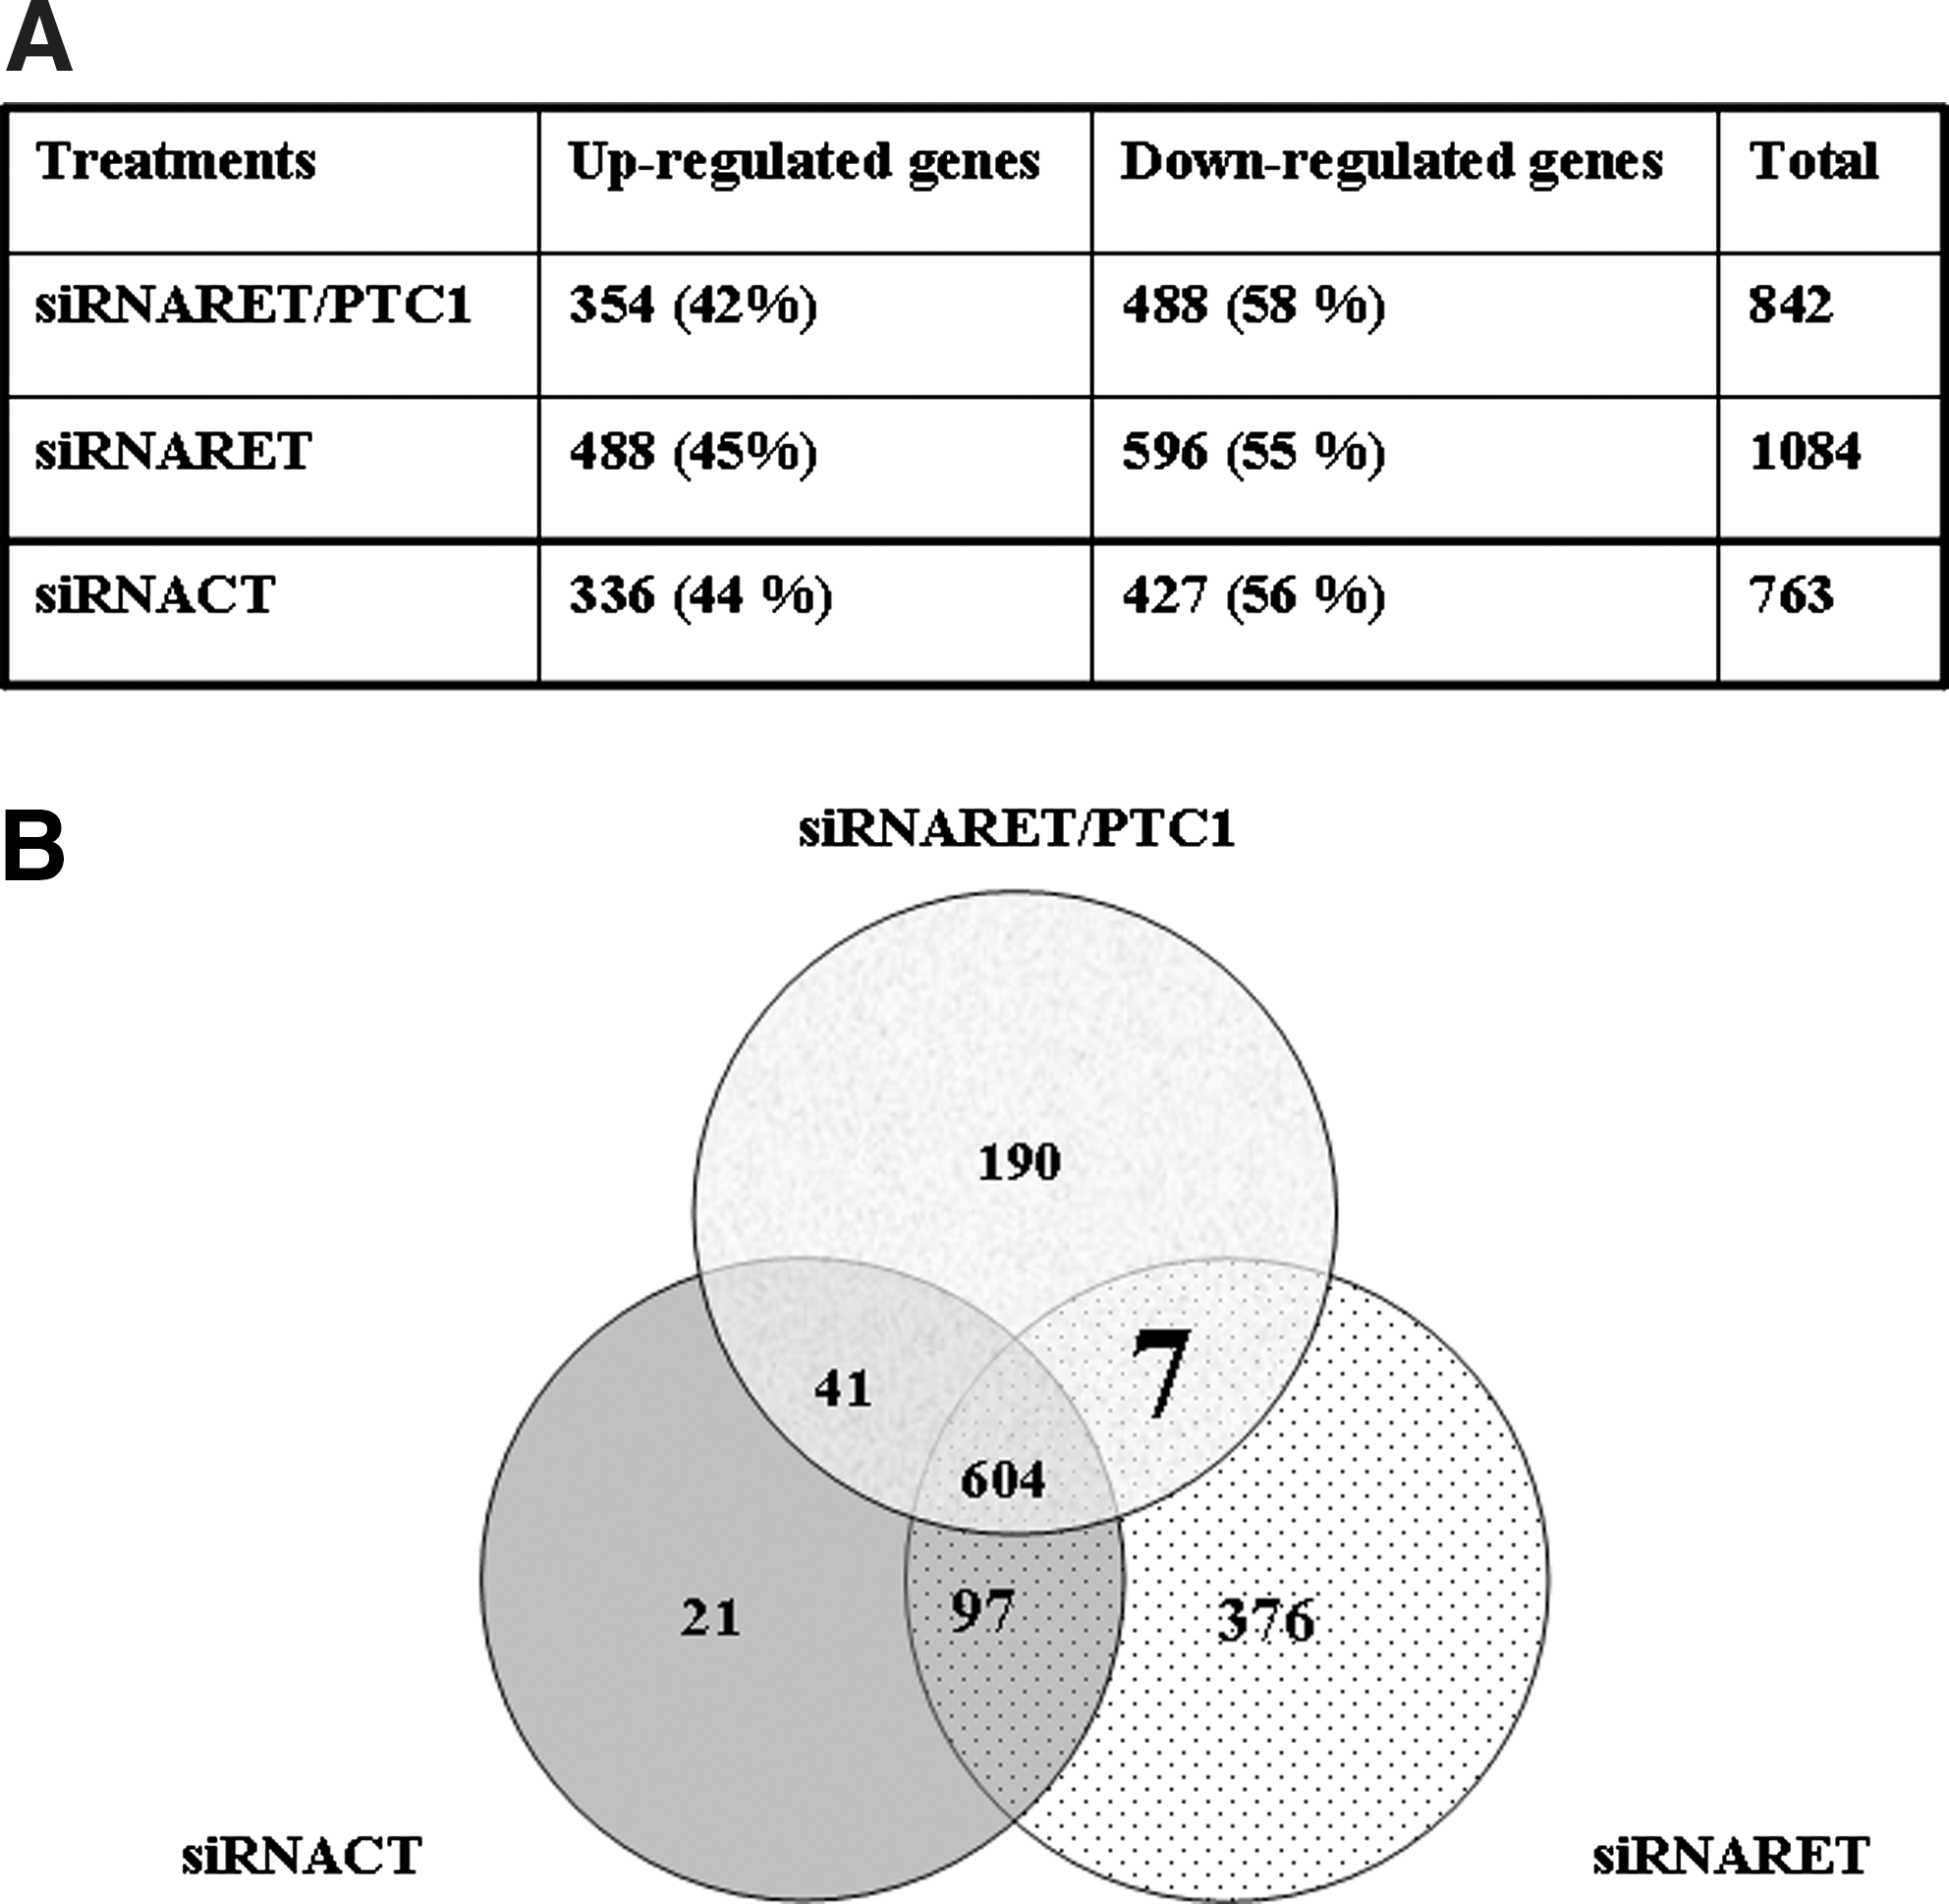
The expression profile of the three treatments detected are as follows: (i) 842 of 44,000 probe sets differentially expressed with a twofold change (up or down) when TPC-1 cells were transfected with the siRNARET/PTC1, (ii) 1084 probe sets with the siRNARET, and (iii) 763 probe sets with the siRNACT (Fig. 6A). For all treatments, downregulation of gene expression was more prevalent than upregulation (58%, 55%, and 56%, respectively, for the siRNARET/PTC1, siRNARET, and siRNACT) (Fig. 6A). Then we analyzed and compared gene distribution according to their biological function based on gene ontology. ANOVA analysis showed that up- or downregulated probes were almost equally distributed (Table 2).
Microarray analysis of genes modulated by siRNA treatments. (
The ANOVA analysis did not show any statistical difference between the biological repartition of modified genes.
ANOVA, analysis of variance; PTC, papillary thyroid carcinomas; siRNA, small interfering RNA.
We therefore crossed the data obtained for the three siRNAs (Fig. 6B, Venn diagram) and found that both the strongest regulation (+106 times for the RSAP2 gene) and the lowest one (−21 times for the NAT8 gene) belong to the genes commonly regulated by the three siRNAs (604 genes) (Table 3), whereas the coregulated genes (41 genes coregulated by siRNARET/PTC1 and siRNACT; 97 genes regulated by siRNARET and siRNACT) or the specifically regulated genes (190, 376, and 21 genes for siRNARET/PTC1, siRNARET, and siRNACT, respectively), considered as “off-target genes,” showed moderate up- or downregulations. Then, we focused the study on the seven genes regulated by the siRNARET/PTC1 and the siRNARET that represent the direct effect of the junction oncogene knockdown. Three of them were upregulated (IL1RAP spotted twice) and four downregulated (including two transcript variants of the RET proto-oncogene). We therefore looked at the specific function of these genes and found that one of the four downregulated genes is E2F2 transcription factor, and two have an unknown function (Table 4). The three upregulated genes belong to the protein-binding genes family. They play a key role in ubiquitination (OSTM1), deubiquitination (YOD1), and inflammation (IL1RAP) (Table 4).
The experiment represents the mean ± standard deviation of at least four digits.
Statistical difference found between untreated cells and cells treated by siRNARET/PTC1 or siRNARET (ANOVA followed by Bonferroni's test, p < 0.05).
Spotted twice in the “Agilent” microarray.
MA, microarray analysis; Q-RT-PCR, quantitative reverse transcription PCR.
Then, we validated the authenticity of the microarray data on these genes by Q-RT-PCR. As shown in Table 2, the downregulated genes (RET, E2F2, C6ORF165, and BC021996) depicted a similar downregulation profile as in the microarray study. The upregulated genes OSTM1 and IL1RAP exhibited a significant difference between the untreated cells and the siRNACT cells, whereas the difference found was lower than that observed by the microarray study. However, the YOD1 gene, found to be upregulated by microarray, was found to be nonregulated by Q-RT-PCR.
Discussion
RET/PTC1 oncogene is present only in tumors and not in normal tissues; therefore, siRNA strategies represent specific therapeutic approaches for PTC. Our aims were (i) to assess the efficiency and the specificity of siRNAs against the RET/PTC1 junction oncogene in the human PTC TPC-1 cells and (ii) to identify genes affected by knockdown of the RET/PTC1 junction oncogene. We based our approach on a study, previously done in the laboratory, showing an inhibition of about 89% of RET/PTC1 mRNA expression followed by a downregulation of the RET/PTC1 oncoprotein expression in the murine RP-1 cell line (16). The RP-1 model is very elegant but could be far from the reality of the human tumors. Thus, we first investigated the silencing ability of the siRNAs previously designed by de Martimprey et al. (16).
Surprisingly, these siRNAs did not show any efficient silencing of the RET/PTC1 gene in TPC-1 cells. This was not due to an inefficient transfection, checked by transfecting rhodamine-labeled siRNA, but to the presence of a mutation, found after sequencing the TPC-1 cells, within the H4 part of the junction leading to a 297T→G substitution. This mutation did not change the amino acid sequence or the secondary RNA structure (which was checked by using “RNA structure software”). The absence of RNA interference (RNAi) could be explained by the creation of a single-nucleotide mismatch between the targeting mRNAs. Thus, the siRNA or the target sequence recognized by the siRNA is shorter in the TPC-1 sequence than in the nonmutated one.
The redesigned siRNARET/PTC1 is efficient because of its ability to inhibit the junction oncogene expression in the human TCP-1 cells. This efficiency is related to its specificity in affecting the RET/PTC1 junction. This specificity was confirmed by the absence of an effect on the human breast MCF-7 and BT-474 cells without RET/PTC1 and the murine RP-1 with 297G→T base substitution. In contrast, the siRNARET has an effect on both cell lines coming from different tissues and species. This underlines the importance of a single mutation when it occurs in the H4/RET junction and the fact that it has to be taken into account when siRNA is designed. In accordance with Du et al. (21), a fusion targeted by an siRNA would require all of the siRNA bases to exert an RNAi effect; a mutation within any part of the junction could abolish the siRNA effect.
To identify genes affected by knockdown of the RET/PTC1 junction oncogene, we performed an Agilent oligonucleotide microarray assay on mRNA isolated from TPC-1 PTC cells that were treated with two different siRNAs against the RET/PTC1 junction or with the scrambled siRNACT. The effect of treatments was first investigated by comparing the biological distribution of the modulated genes. Surprisingly, the gene repartition was almost identical between the siRNACT and both siRNAs targeting the junction. This suggested a common major effect of the three treatments on the TPC-1 cells, most likely due to the transfection procedure itself by the siRNAs, reflected by the 604 genes up- and downregulated. The genes specifically regulated by the siRNARET/PTC1 (190 genes), the siRNARET (376 genes), or the siRNACT (21 genes) would represent the “off-target” effects triggered by these small molecules. The off-target genes or the coregulated genes both would represent unintended events that can have a significant impact on experimental outcomes and subsequent data interpretation. A wide variety of chemical modifications have been proposed to prevent these unwanted off-target effects (22). The most widely used siRNA modifications are on the sugar moiety on the 2′ position. The introduction of 2′-O-methyl to siRNA increases binding affinity and nuclease stability, and the resulting 2′-O-Me-RNA can be well tolerated throughout the duplex (23). The locked nucleic acids have also been included in siRNA (24). Their conformational rigidity leads to significant increases in binding affinity and helps to reduce most of the unwanted side effects. Further studies are needed to test whether chemical modifications reduce the off-target genes of siRNAs targeting RET/PTC1.
Thus, we focused on the coregulated genes by siRNARET/PTC1 and siRNARET (seven genes) that induced the RET/PTC1 silencing. First we noticed that the variation of gene expression was in the physiological range that was observed in cells after treatments, which is in contrast with the high up- or downregulated genes observed by the communally regulated genes. After validation of these seven genes, the downregulated genes showed a good relationship between microarray profile and Q-RT-PCR analysis. In contrast, the upregulated genes depicted a small variation of their expression that is insignificant compared with the downregulated genes. E2F2 decrease could have a biological significance and may represent a direct effect of the junction oncogene silencing by siRNAs. This transcription factor, a member of the E2F family is a key factor in the regulation of cell proliferation. E2F2 was established to enhance cell cycle progression (25) and to have a critical role in S-phase progression (26). By TUNEL assay and FACS analysis, we showed that the downregulation by both siRNAs induces an apoptotic response and modifies both the cell cycle and the cell proliferation. Therefore, knockdown of RET/PTC1 by RNAi inhibits TPC-1 cell proliferation in vitro and enhances cell apoptosis via increase of S-phase. Our findings are in agreement with those of (i) Zhang et al. (27), showing that the antitumor activity of an oncolytic adenovirus-delivered siRNAras leads to an accumulation of cells in S+G2-M phases, increased apoptosis, and downregulation of RAS signaling-related gene expression including E2E2, and (ii) Visone et al. (28), showing that miRNA are able to reduce p27Kip1 protein levels and thereby the cell cycle.
In conclusion, the siRNARET/PTC1 is efficient and specific to RET/PTC1 oncogene, which will open new prospects in treatments using siRNAs for PTC or Hürthle thyroid tumors with RET/PTC1 junction. Nevertheless, it should be tested in vivo to prove its ability to reduce tumor. In the case of a therapeutic approach by siRNA for a clinical application, the junction oncogene must be systematically sequenced. We also found a direct effect of RET/PTC1 silencing on the E2F2 gene expression involved in cell cycle regulation. Additional studies are needed to understand the biological effect of E2F2 inhibition in PTC progression and treatment.
Footnotes
Acknowledgments
This work was supported by the CNRS (“PEPS” grant), the University Paris 11 grant, and IGR. The authors thank Drs. Luis Mir, Karim Benihoud, Jean-Rémi Bertrand, and M. Matthieu Bauer for helpful discussions and M. Thomas Robert for technical assistance.
Disclosure Statement
The authors declare that no competing financial interests exist.