
Abstract
Background:
Sunitinib malate (Sutent®, Pfizer, Inc.; SU11248) is a selective, multitargeted inhibitor of receptor tyrosine kinases and has been shown to inhibit receptors for VEGF, PDGF, KIT, FLT3, and RET. The objective of this study was to determine the effects of sunitinib on signal transduction pathways and on gene expression of iodide-metabolizing proteins in papillary cancer cells with the RET/PTC1 rearrangement.
Methods:
We investigated the effects of sunitinib on cell growth, signal transduction pathways, and thyroid-specific gene expression in papillary thyroid cancer (PTC) cell lines that had the RET/PTC1 rearrangement.
Results:
Sunitinib inhibited proliferation of RET/PTC1 subclones in a time- and dose-related manner. The mean 50% lethal concentration in the RET/PTC1 subclones was 1.81 μM. Incubation of RET/PTC1 cells with 1 μM sunitinib inhibited their migration potential and transformed their morphology. Sunitinib inhibited RET autophosphorylation at Y1062 and the activation of signal transducer and activator of transcription 3 by blocking Y705 phosphorylation. Sunitinib caused cell cycle arrest in the G0/G1 phase and dephosphorylation of retinoblastoma protein, but did not induce apoptosis. Western blot analysis of the p38, MEK/ERK, and SAPK/JNK mitogen-activated protein kinase signal transduction pathways showed that sunitinib blocked ERK 1/2 and JNK phosphorylation in the cytoplasm. Sunitinib treatment of RET/PTC1 cell lines, in combination, with forskolin induced expression of the sodium (Na)/iodide (I) symporter (NIS) and the transcription factors that bind the NIS upstream enhancer. Mechanistically, the inhibition of both MEK/ERK and SAPK/JNK cytoplasmic pathways individually and in combination caused an increase in NIS gene expression.
Conclusion:
Sunitinib appears to target the cytosolic MEK/ERK and SAPK/JNK pathways in the RET/PTC1 cell lines, suggesting that blocking these pathways is at least part of the mechanism by which sunitinib inhibits cell proliferation and causes stimulation of NIS gene expression in RET/PTC1 cells.
Introduction
One of the more common oncogenic genomic changes observed in PTC is the RET/PTC (rearranged in transformation/papillary thyroid carcinoma) rearrangement found in thyroid papillary cancer cell line 1 (TPC-1) cells (2). This oncogenic change results in constitutively active autophosphorylation of RET Y1062 that is associated with the activation of the signal transducer and activator of transcription 3 (STAT3) by phosphorylation at tyrosine 705 and reduced NIS gene expression (3,4). The upstream enhancer of the human NIS gene (NIS upstream enhancer [NUE]) contains an active Pax-8 site and a CRE-like site that function synergistically and are required for optimal NIS gene expression (5). Recently, the NUE binding transcription factor requirement in a normal rat cell line (FRTL-5) was determined and compared to RET/PTC1 cancer cells (TPC-1 and subclones). The principal NUE binding transcription factors, CREM activator and ATF-1, are expressed in forskolin (FSK)-stimulated normal thyroid cells; in addition, CREB is phosphorylated (6). The TPC-1 cancer cell line is deficient in the transcription factors needed for NUE activation. CREM activator is absent and ATF-1 is reduced in the RET/PTC1 cells (6).
Kim et al. studied the effect of sunitinib (SU11248) on TPC cell lines containing a genetic rearrangement of the RET gene that encodes a receptor tyrosine kinase protein (7). They investigated the efficacy of sunitinib for inhibition of the oncogenic RET/PTC tyrosine kinase. They found that sunitinib strongly inhibits RET/PTC3 kinase activity and exerts a powerful growth inhibitory effect on RET/PTC1 in the TPC-1. In light of these findings, we investigated the effects of sunitinib in RET/PTC1 rearrangement cells by focusing on signal transduction pathways and gene expression of iodide metabolizing proteins. We evaluated the transcription factors that bind to the NUE and lead to endogenous NIS gene expression. We extended our RET/PTC1 studies to include sunitinib's effects on signal transduction pathways that include three major mitogen-activated protein kinase (MAPK) pathways and the PI3K/AKT pathway. We studied genes that are expressed in differentiated thyroid cells but not in RET/PTC1 cancer cells and found an increase in endogenous NIS gene expression in the RET/PTC1 cells treated with sunitinib.
Materials and Methods
Reagents
The indolinone kinase inhibitor sunitinib (Sutent®; SU11248, Lot #0001) was obtained from Pfizer, Inc. The appropriate amount was dissolved in 100% dimethylsulfoxide (DMSO) to create a 50 mM stock solution.
Cell culture
The human PTC cell lines BHP 2–7, BHP 10–3, and BHP 7–13 are subclones of the TPC-1 cell line kindly provided by Dr. Sissy Jhiang and contain the RET/PTC1 rearrangement. This is the only available RET/PTC1 rearrangement thyroid cell line (8). All cells were grown in RPMI 1640 medium (Sigma Chemicals) supplemented with 10% fetal bovine serum, 0.1 mM nonessential amino acids (Invitrogen Corporation), and 1 mM sodium pyruvate (Invitrogen Corporation) in a 5% CO2 incubator at 37°C. Trypsin–ethylenediaminetetraacetic acid 0.5% was used for cell passage.
MTS cell proliferation assay
Cell viability was determined using the MTS cell proliferation assay (Promega). Cells were grown to a confluency of ∼90% in 75 cm2 cell culture flasks and passed into 96-well plates (4.0 × 10³ cells/well). Each well contained 100 μL of the culture medium supplemented with various concentrations of sunitinib (100 nM, 1 μM, 5 μM, 10 μM, 15 μM, 25 μM, and 50 μM) or a concentration of DMSO equivalent to the highest amount of stock sunitinib solution added to serve as a control. Every 24 hours, the medium was removed and 150 μL of fresh RPMI 1640 medium containing the appropriate concentration of sunitinib or DMSO was added. After incubation with sunitinib or DMSO for either 24, 48, or 72 hours, 25 μL of the MTS reagent was added to each well, and the plate was placed in the 5% CO2 incubator at 37°C for an additional 2–4 hours. The optical density (OD) was then read at 490 nm using a microplate reader (Bio-Rad). The experiments were performed in quadruplicate, with the percentage cell survival calculated as follows: cell survival = (mean absorbance at 490 nm of sunitinib-treated cells/mean absorbance at 490 nm of DMSO control) × 100%. Values were plotted using Microsoft Excel® and used to construct best-fit curves, from which 50% lethal concentration (LC50) values were calculated.
Morphology observations
Cells undergoing treatment with sunitinib were photographed with a digital camera (Olympus) and morphology was compared to cells treated with DMSO.
Scratch assay
Scratch test was performed as previously described to assess the effect of sunitinib on cell migration (9). Cells were passed into 12-well plates and grown to ∼90% confluency, and then the monolayer was scratched with a 0.1–10 μL sterile pipette tip and incubated with the medium containing the appropriate concentration of sunitinib or DMSO. The scratched area was monitored over time, and the time needed for the cells to fill the scratched area was compared between DMSO-treated and sunitinib-treated cells.
Cell cycle analysis by propidium iodide stain
Cells were grown in 100 × 15 mm Petri dishes and incubated with the appropriate concentration of sunitinib or DMSO for the desired timeframe, then washed twice with cold phosphate-buffered saline (PBS), and transferred by trypsinization to a 15 mL tube containing 1 mL culture medium and 5 mL cold PBS. After cells (1 × 10⁶) were washed, DNA was stained with 50 μg/mL propidium iodide (PI) solution (0.02 μg/μL RNase A, 1.0 mg/mL sodium citrate-dihydrate, 0.1 μg/μL PI, and 0.3% Triton X-100) at 2°C for 30 minutes protected from light. Fluorescence-activated cell sorting (FACS) was performed using FACScan (Becton Dickinson). Cell cycle analysis was performed by ModFit LT software (Verity Software House, Inc.).
Annexin V-FITC apoptosis assay
Apoptosis was determined using the Annexin V-FITC detection kit (BD Pharminogen) (10). Cells were grown in 100 × 15 mm Petri dishes and incubated with the appropriate concentration of sunitinib or DMSO for the desired time, then washed twice with cold PBS, and transferred by trypsinization to a 15 mL tube containing 1 mL culture medium and 5 mL cold PBS. The cells were centrifuged for 10 minutes at 2000 rpm and resuspended in 1 × Annexin V binding buffer at a concentration of 1 × 10⁶ cells/mL. One hundred microliters containing 105 cells was transferred to 12 × 75 mm polystyrene tubes, and after the addition of 5 μL of Annexin V-FITC and 5 μL PI staining solution to each tube, the cells were incubated at room temperature for 15 minutes in the dark. An additional 400 μL of 1 × binding buffer was added to each tube, and the samples were analyzed by flow cytometry after being protected from light and kept on ice for 30 minutes.
Reverse transcription–polymerase chain reaction analysis
Experiments were performed as described previously (6). Briefly, total RNAs were prepared from RET/PTC1 cells cultured with or without various concentrations of sunitinib (SU11248), UO126, and SP600125, with or without 10 μM FSK at various time points and prepared using RNeasy kit (Qiagen). RNA was reversed transcribed into cDNA with Oligo(dT)20 using superscript III first-strand synthesis system (Invitrogen Corporation). Primer design was performed using Primer3 (11). For NUE binding transcription factor primers, see Fenton et al. (6); for NIS and GAPDH primers, see Kogai et al. (12). The following are thyroid-specific gene primers: thyroglobulin (Tg), forward 5′-gcctgtggcttgtctgtcattt-3′ and reverse 5′-gaggtaggaggtgtctgtgctgtt-3′; thyroid peroxidase (TPO), forward 5′-gtctggatgtctcccttacatgct-3′ and reverse 5′-ctggggtggtctctgttgttg-3′; thyroid-stimulating hormone receptor (TSHR), forward 5′-gaactgatagcaagaaacacctgg-3′ and reverse 5′-gtatcctggaacttggactttt-3′. The polymerase chain reaction (PCR) mixture contained 0.2 pmol of 5′ and 3′ primers, 1/20 of cDNA with buffers from taq DNA polymerase kit (Qiagen) and PCR amplified for 30 cycles using a PTC-200 PCR machine (MJ Research). Resulting products were run on a 1% agarose gel and observed using an imaging system (Alpha Innotech).
Western blot analysis
Cytoplasmic extracts (∼10 μg) obtained from RET/PTC1 cells treated with various concentrations of sunitinib, UO126 (CalBiochem), and SP600125 (CalBiochem) were electrophoresed on a 10% sodium dodecyl sulfate–polyacrylamide gel and transferred to a nitrocellulose membrane (Hybond-ECL; GE Healthcare). The membrane was incubated in a 3% ECL blocking buffer at least 1 hour and washed twice in Tris Buffered Saline Tween-20 (TBST). The membrane was incubated with rabbit/mouse monoclonal antibodies to ERK1/2-P, p38-P, SAPK/JNK-P, AKT-P, and retinoblastoma protein (Rb)-P (807/811) overnight. The membrane was washed twice in TBST and then incubated with horseradish-peroxidase-conjugated anti-rabbit IgG (Promega) for 45 minutes, and washed for 1 hour in Tris Buffered Saline Tween-20 (TBST). The proteins were illuminated with ECL advance Western blotting detection kit (Amersham), exposed to film, and analyzed using an imaging system (Alpha Innotech). Membranes were stripped (Pierce stripping buffer) and reblotted with rabbit monoclonal ERK 1/2, p38, SAPK/JNK, AKT, and Rb and treated the same as above. All antibodies were purchased from Cell Signaling Technology, Inc.
Results
Sunitinib causes growth inhibition in RET/PTC1 cells
Sunitinib inhibited proliferation of RET/PTC1 subclones (BHP 2–7, BHP 10–3, BHP 7–13, and TPC-1) in a time- and dose-dependent manner. Figure 1 shows inhibition of cell proliferation of sunitinib-treated BHP 2–7 cells. The assay was performed on two additional RET/PTC1 subclones with similar results. The LC50 values of sunitinib in the RET/PTC1 cells treated for 48 hours are shown in Table 1. The average LC50 in the RET/PTC1 subclones is 1.81 μM (Table 1). In RET/PTC1 cells treated for 4 hours with 1 μM of sunitinib, slight morphological changes were observed as compacted cells replaced branch-like structures (data not shown).

Growth inhibition curves for sunitinib-treated RET/PTC1 cells. Cells were treated with sunitinib at concentrations of 0.1, 1, 5, 10, 15, 25, and 50 μM for 1, 2, and 3 days; dimethylsulfoxide (DMSO) was used as the control; RET/PTC1 cells. Cell proliferation is plotted relative to the control.
Sunitinib-treated RET/PTC1 cells have reduced migration
We assessed sunitinib-treated RET/PTC1 cells for resistance to migration in vitro by a scratch test. We scratched an area in 12-well plates that contained RET/PTC1 cells at ∼90% confluency and treated them with various amounts of sunitinib. The ability of the cells to migrate across the scratch in comparison to DMSO-treated cells was assessed (Fig. 2). We treated cells with sunitinib concentrations above and below the LC50 found in Table 1. Cells were treated with 500 pM, 500 nM, 1 μM, 2.5 μM, and 5 μM of sunitinib or DMSO, and the monolayer was scratched to eliminate cells (Fig. 2, lane 1). After 24 hours, the scratch was still visible after 500 nM–5 μM sunitinib treatment (Fig. 2, lanes 3–6); the cleared area was maintained by sunitinib treatment in a dose-dependent manner. The scratch was completely grown over by the 500 pM sunitinib-treated cells and the DMSO-treated cells at 24 hours (Fig. 2, lanes 2 and 7). After 2 days the scratch was still evident in RET/PTC1 cells treated with 2.5, 5, and 10 μM sunitinib (data not shown). The data indicate that 500 nM–2.5 μM sunitinib, concentrations below and slightly above that of the LC50, reduces cell migration in RET/PTC1 cells.
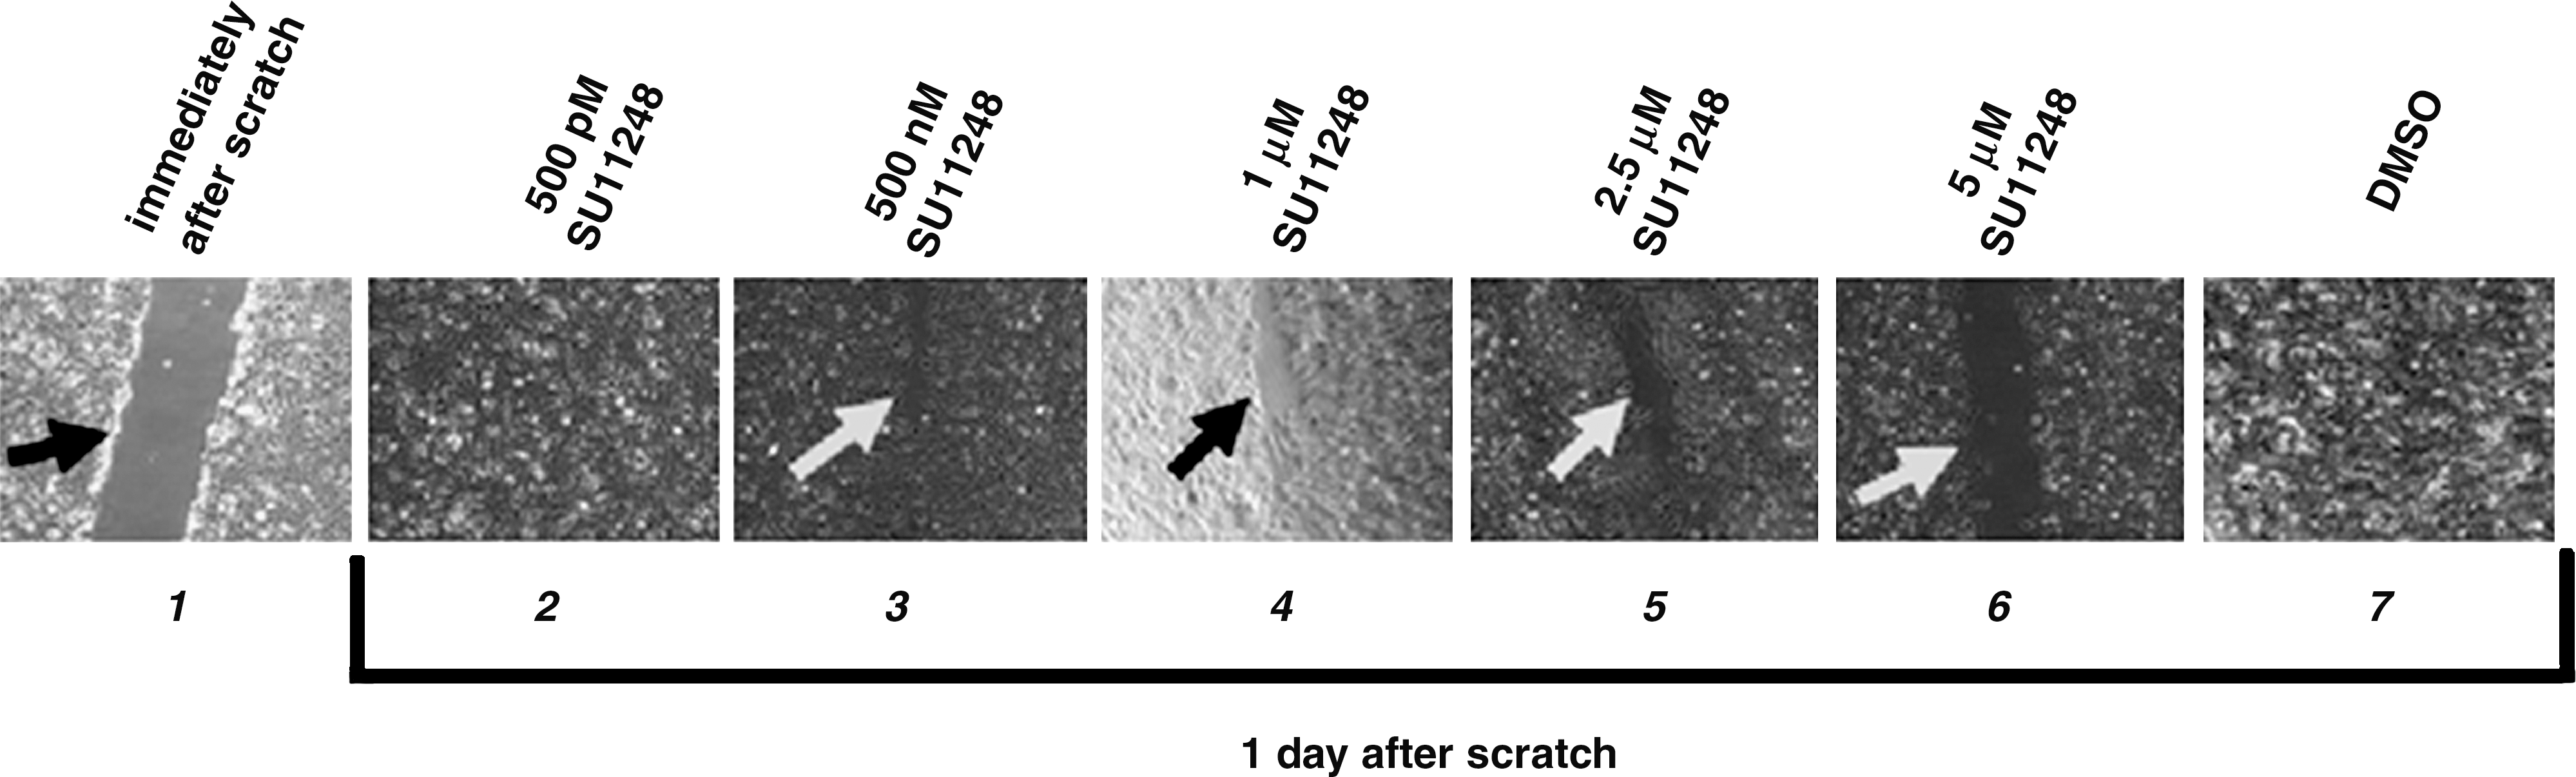
Inhibition of migration with sunitinib-treated RET/PTC1 cells. Confluent cells were scraped with a sterile pipette tip and cultured for 1 day in the presence of varying concentrations of sunitinib or the control DMSO. A picture of the left panel (lane 1) was taken immediately after the scratch. Pictures of all the other panels (lanes 2–7) were taken 1 day after the scratch. Sunitinib treatments of 500 pM, 500 nM, 1 μM, 2.5 μM, and 5 μM were chosen relative to the LC50. The arrows indicate visible scratches.
Sunitinib causes cell cycle arrest in RET/PTC1 cells
Figure 3 represents the results of the cell cycle analysis of the RET/PTC1 rearrangement cells treated with sunitinib or DMSO. When treated with DMSO only, 55.3% of the cells were found to be in the G1 phase represented by the first spike, while 44.1% were in the S phase, represented by the plateau between the G1 spike and the second, smaller G2 spike. Cells were treated with a concentration of sunitinib about half of the LC50 and at the LC50. Cells treated with 1 μM sunitinib for 24 hours did not significantly differ in G1/S phase content compared with the DMSO control (data not shown). However, when cells were treated with 2 μM sunitinib for 24 hours, there was a marked decrease in the number of cells in the S phase (44.1%–3.96%) and a marked increase in the number of cells in the G1 phase (55.3%–95.1%), suggesting cell cycle arrest in the G1 phase and inhibition of cell proliferation (Fig. 3). This is consistent with our observation that BHP 2–7 cells treated with 2 μM sunitinib for 24 hours were noticeably less confluent than the 1 μM and DMSO groups, despite the fact that both groups were around 60% confluent before the addition of sunitinib.
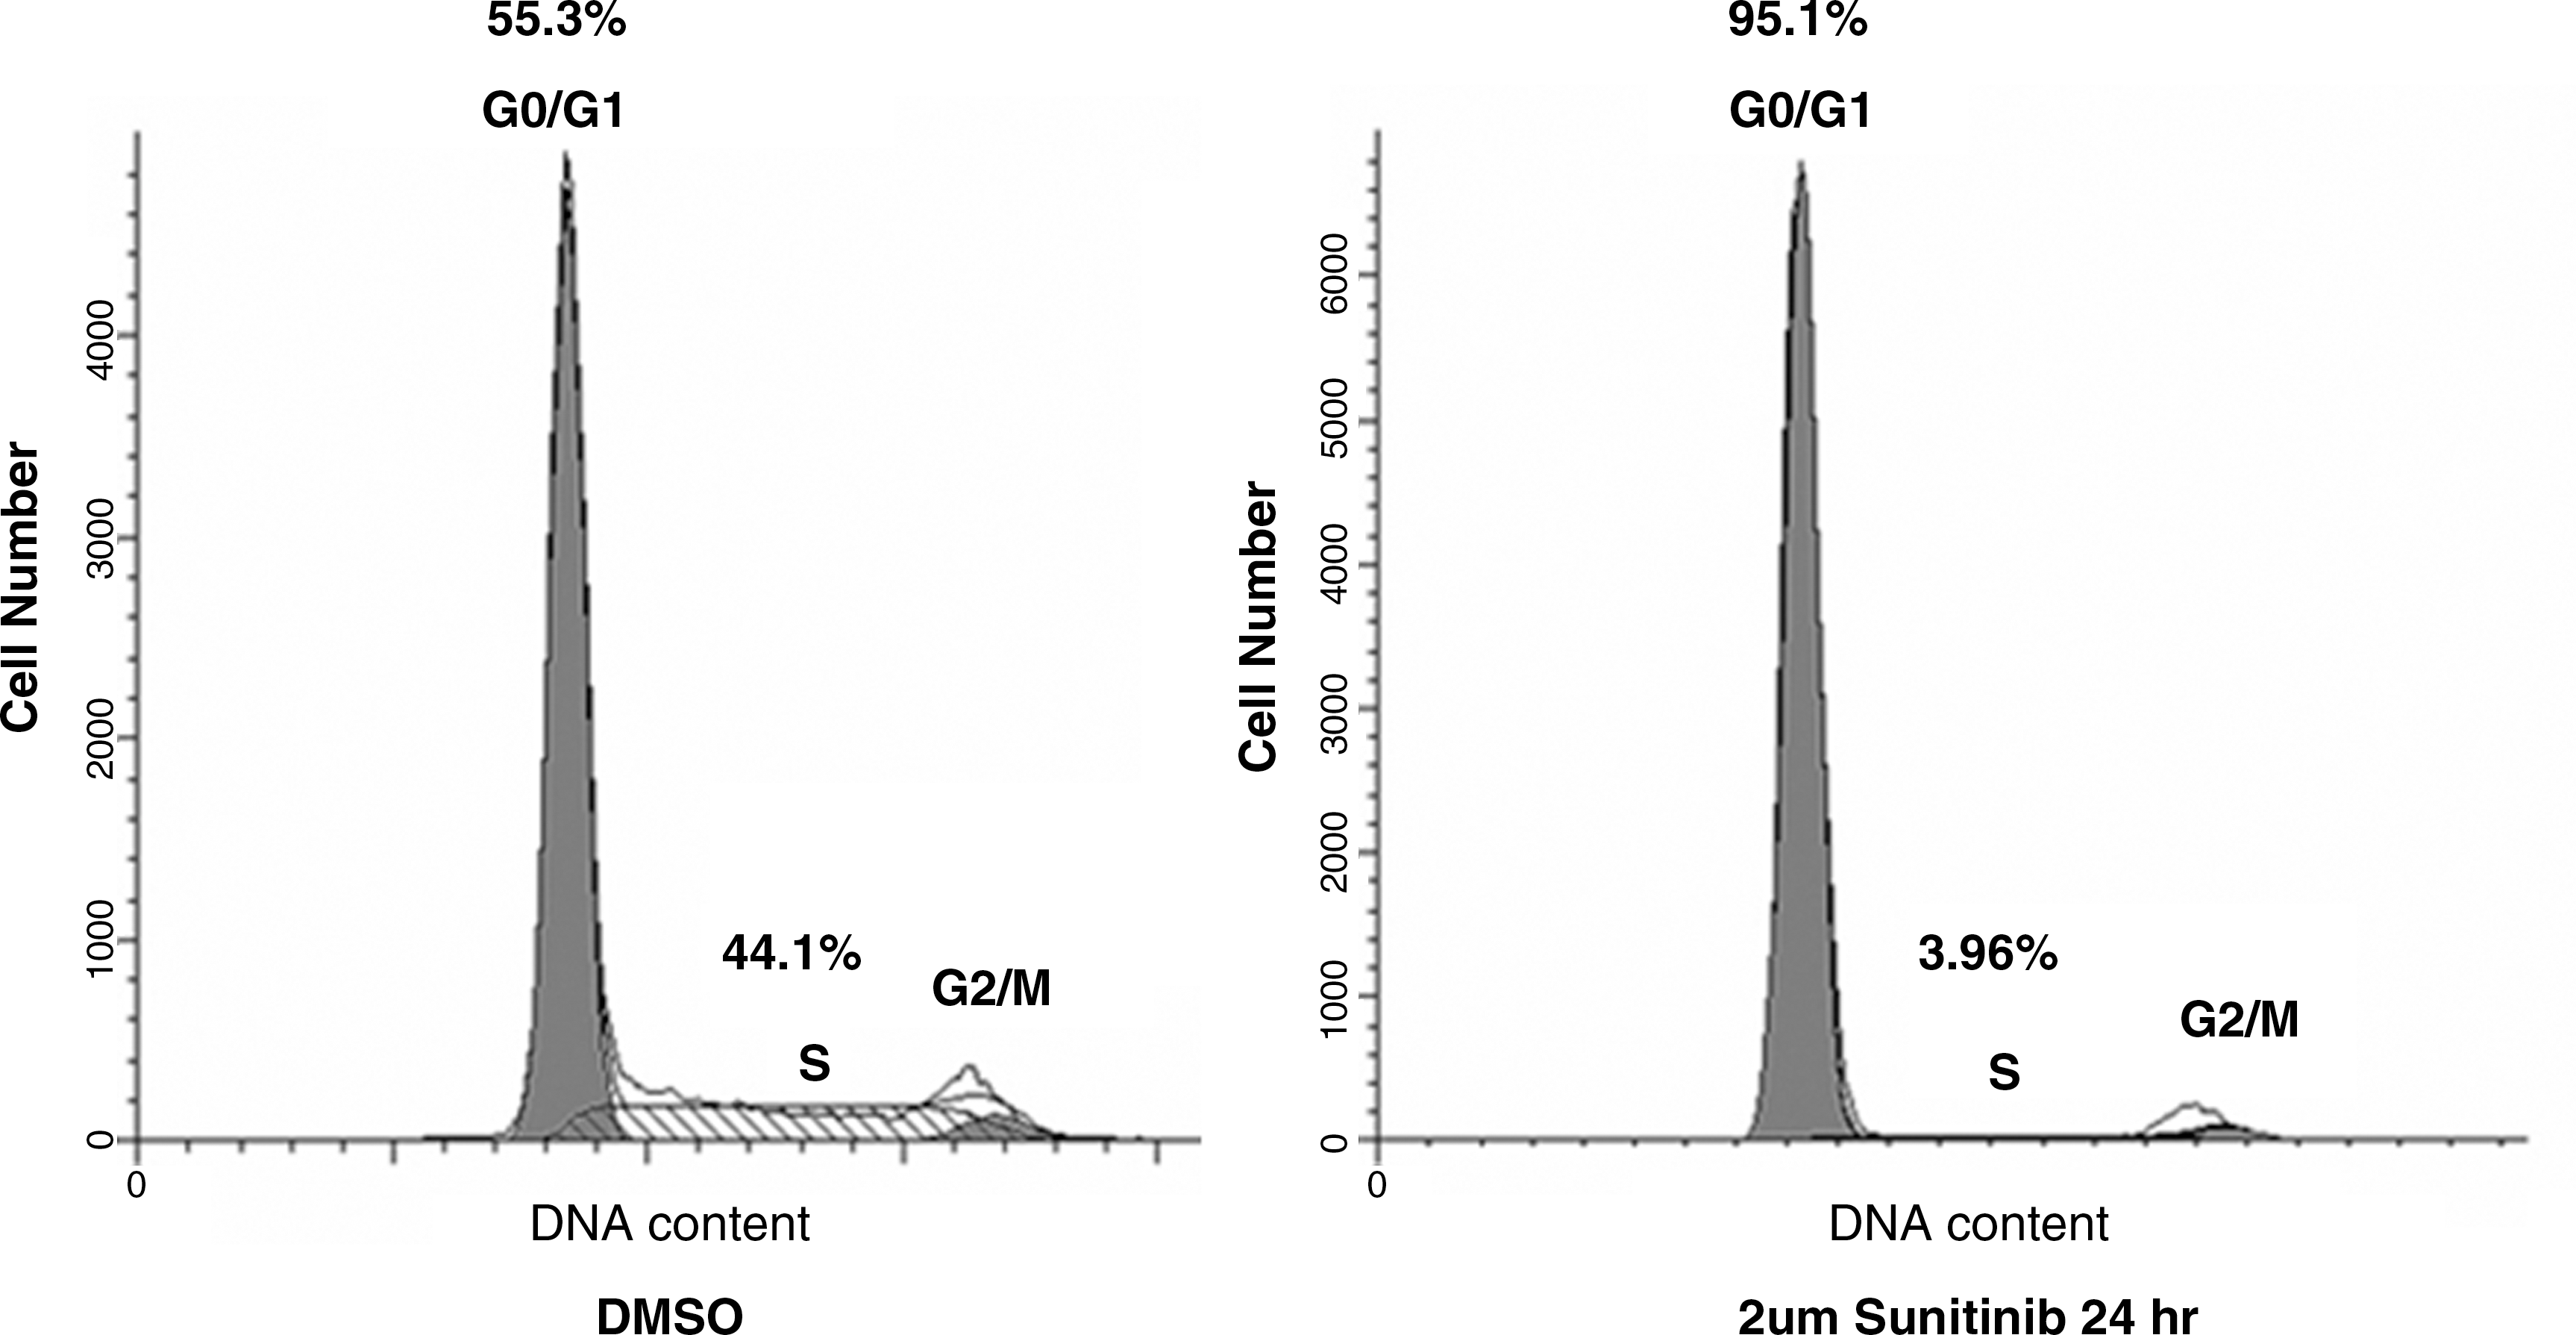
G0/G1 phase cell cycle arrest in sunitinib-treated RET/PTC1 cells. Cell number relative to the cell cycle phase in the presence of DMSO or 2 μM sunitinib for 1 day. Percentage of cells in each phase is represented above the phase.
Sunitinib-mediated dephosphorylation of Rb associated with inhibition of cell cycle progression
Sunitinib-treated RET/PTC1 cells were blocked at the G1 phase. To determine the mechanism by which sunitinib inhibits RET/PTC1 proliferation and cell cycle progression, we examined the phosphorylation of the Rb. Rb regulates cell proliferation by controlling progression through the check point of the G1 phase of the cell cycle. Cell cycle progression requires phosphorylation of Rb to release Rb from its target binding proteins. The DMSO control showed a significant amount of Rb phosphorylation in RET/PTC1 cells (Fig. 4, lane 3, upper panel). Sunitinib treatment of RET/PTC1 cells was associated with complete inhibition of Rb phosphorylation (Fig. 4, lanes 3 vs. 4, upper panel). An appropriate amount of total protein per lane is evident with both total Rb protein and α-tubulin (Fig. 4, lanes 3 and 4, middle and lower panels). We further investigated whether the sunitinib-treated RET/PTC1 cells underwent apoptosis by using the Annexin V-FITC detection kit. Apoptosis was not detected in sunitinib-treated RET/PTC1 using sunitinib concentrations of 2 μM and above (data not shown).
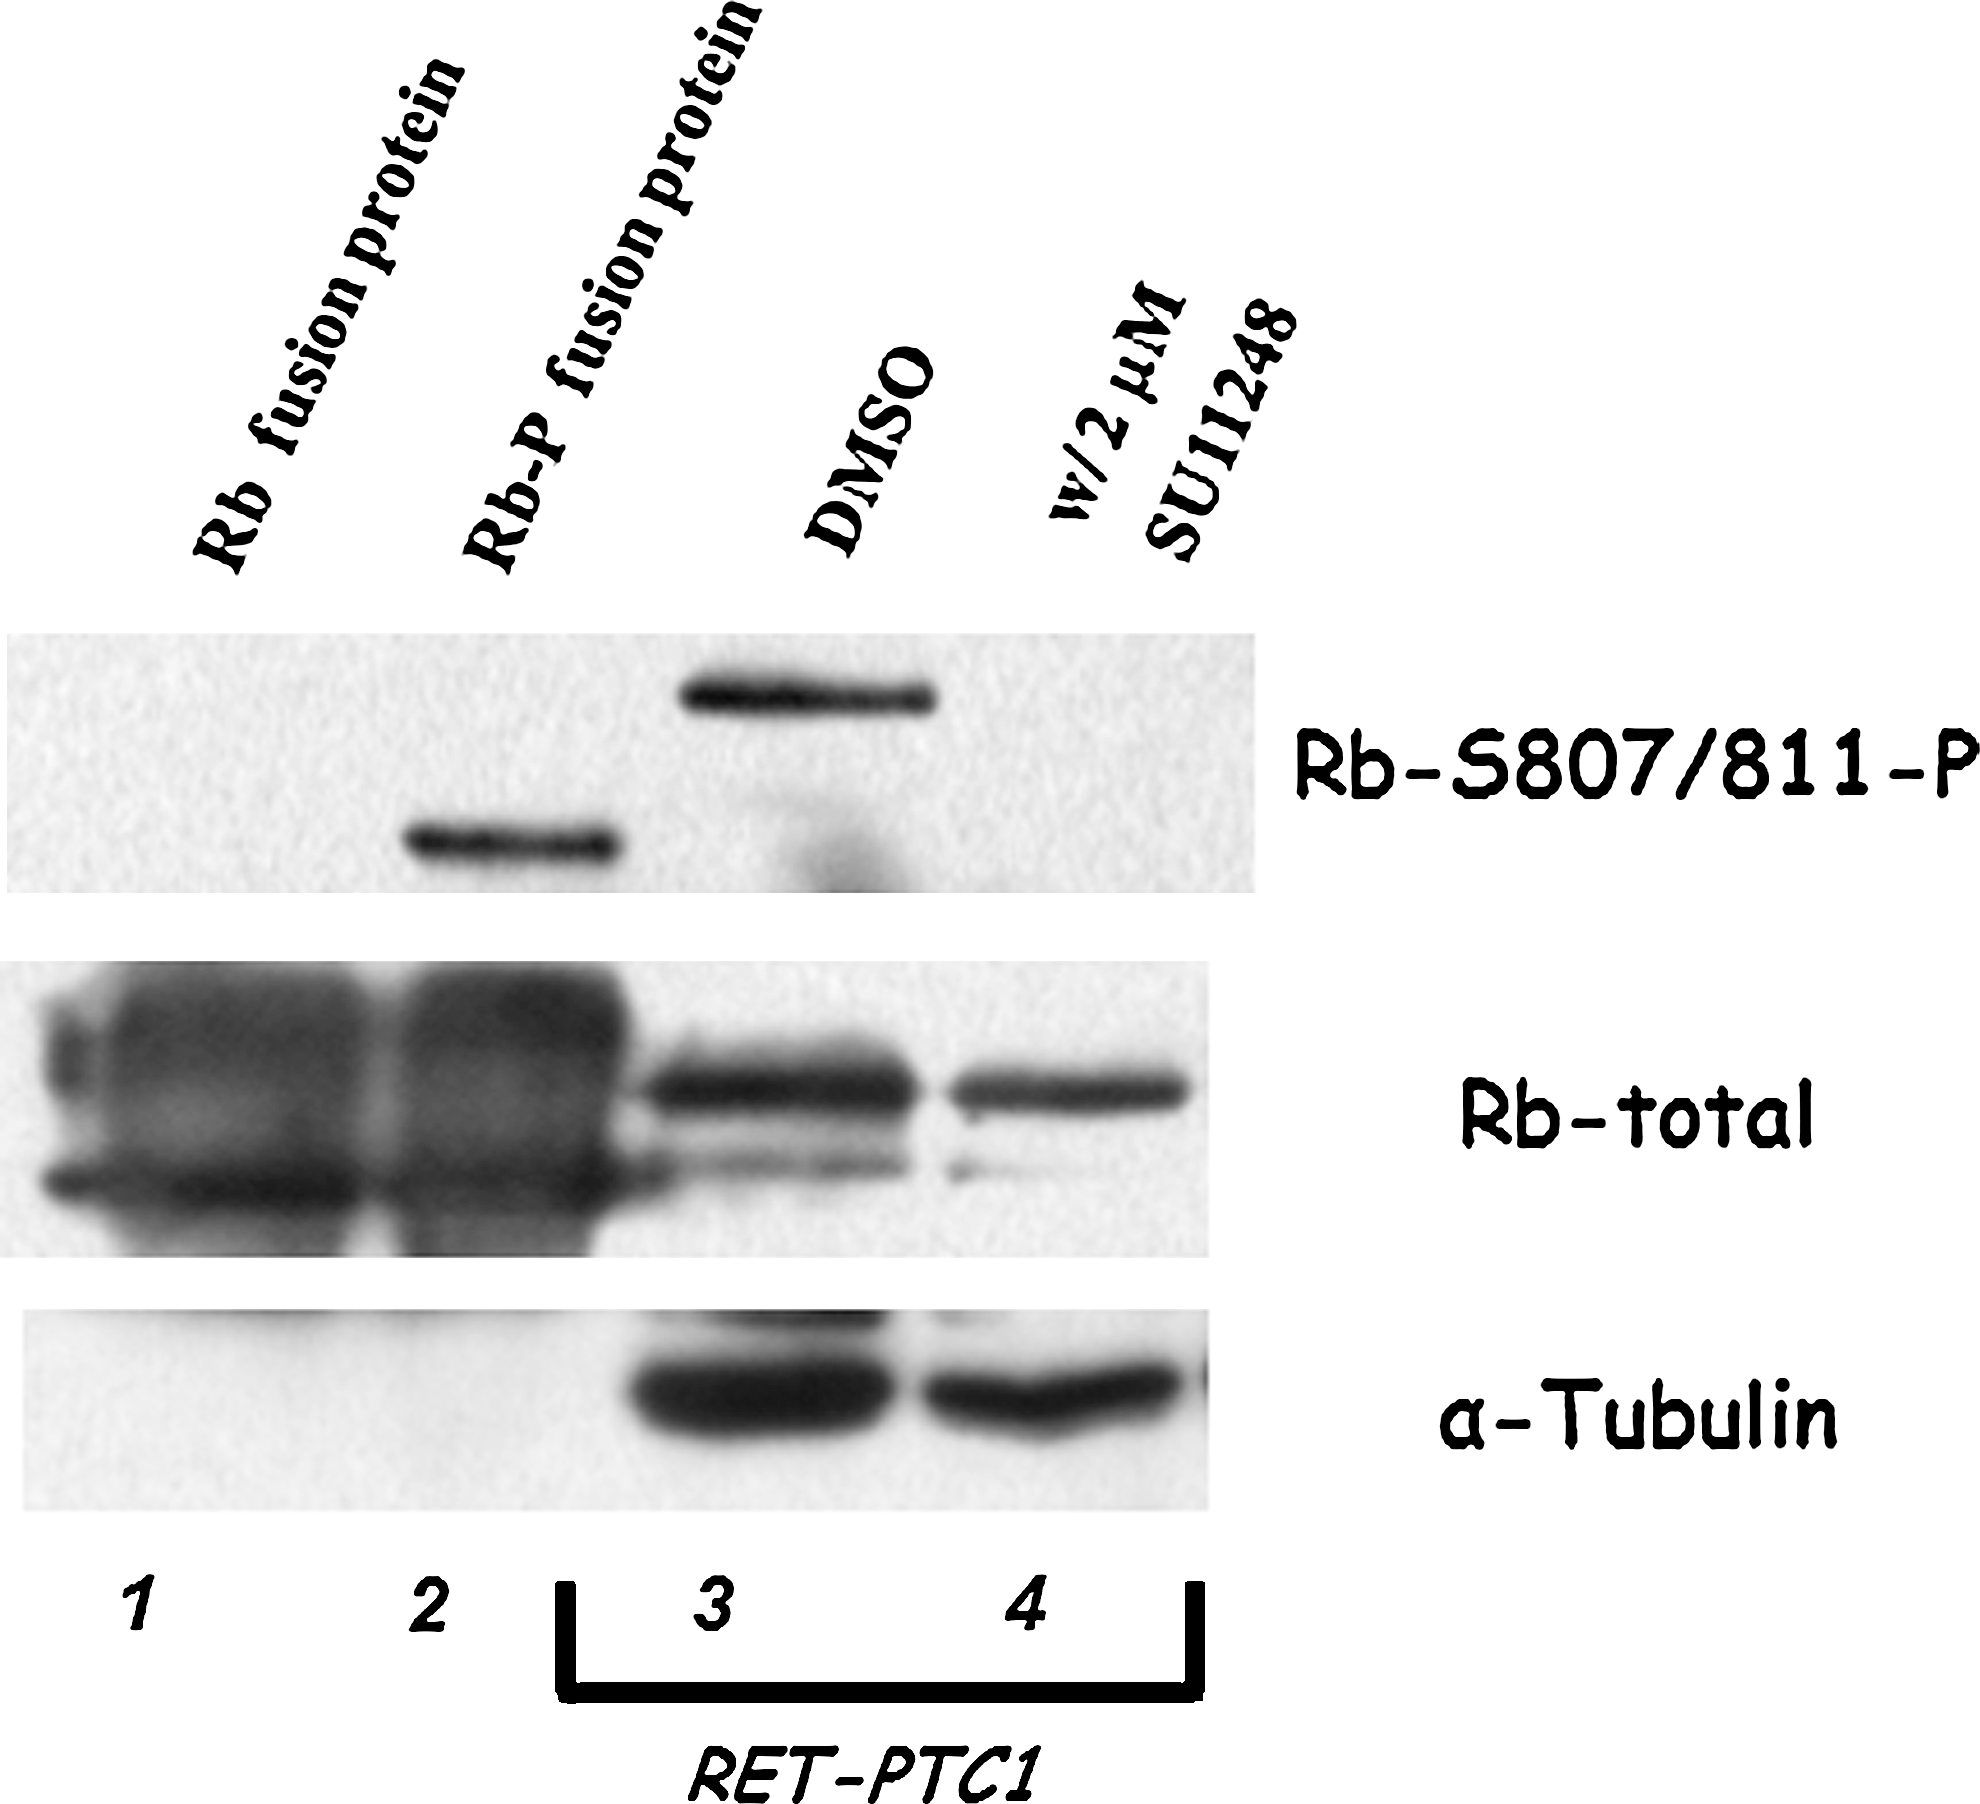
Western blots demonstrating the effects of retinoblastoma protein (Rb) phosphorylation in sunitinib-treated RET/PTC1 cells. Lanes 1 and 2 are commercially available Rb fusion protein controls that are unphosphorylated and phosphorylated. Lanes 3 and 4 are DMSO and 2 μM sunitinib-treated cytoplasmic extracts from RET/PTC1 cells. Top panel shows an antibody to detect Rb phosphorylation at S807/811 and middle panel shows an unphosphorylated Rb antibody to detect the total Rb. Bottom panel shows an antibody to α-tubulin to evaluate total protein in the extracts.
Sunitinib inhibited the cytosolic MEK/ERK and SAPK/JNK MAPK pathways in RET/PTC1 cells
To determine the signal transduction pathway targets that mediate sunitinib's inhibition of cell proliferation, we investigated the effect of sunitinib on MAPK and the PI3K/AKT signaling pathways in RET/PTC1 cells. Using cytoplasmic extracts from cells treated with various amounts of sunitinib below the LC50 for 1 day, we assayed the MAPK pathways MEK/ERK, p38, and SAPK/JNK MAPK, and the AKT pathway for phosphorylation activity. We tested the three MAPK pathways with 2 μM sunitinib, the LC50, and observed strong reductions in ERK 1/2 phosphorylation and SAPK/JNK phosphorylation (data not shown). We evaluated the dose-dependent effects using 500 pM, 500 nM, and 1 μM of sunitinib on all three MAPK pathways (Fig. 5A, lanes 2–4). Sunitinib blocks the phosphorylation of ERK 1/2 at sunitinib concentrations of 500 pM, which is well below the LC50 (Fig. 5A, upper panel, lanes 2–4). Sunitinib inhibited SAPK/JNK phosphorylation in a dose-dependent manner (Fig. 5A, lower panel, lanes 2–4). However, sunitinib had very little effect on the p38 pathway (Fig. 5A, middle panel, lanes 2–4). Sunitinib had a strong effect on the MEK/ERK and SAPK/JNK MAPK pathways well below the concentration of the LC50.

Western blot demonstrating the dose-dependent effects of sunitinib on the mitogen-activated protein kinase signaling pathways p38, MEK/ERK, and SAPK/JNK as well as the PI3K/AKT pathway in RET/PTC1 cells. (
RET/PTC1 cell lines have activation of the PI3K/AKT signaling pathways (13,14). We tested two different antibodies that detect AKT phosphorylation at serine 473 and threonine 308 for sunitinib-mediated inhibition. RET/PTC1 cells, which have active AKT phosphorylation, were not inhibited at a concentration of 2 μM sunitinib, close to the LC50 (Fig. 5B, lane 2). Because of the lack of inhibition of the AKT pathway at this concentration of sunitinib, we did not pursue testing lower concentrations. In the RET/PTC1 cells, the pathways that appear uniquely sensitive to sunitinib are the MEK/ERK and SAPK/JNK MAPK pathways. It is known that RET/PTC autophosphorylation associates with and activates the STAT3 by phosphorylating the tyrosine 705 residue (3). We observed that sunitinib concentrations near the LC50 inhibit RET autophosphorylation at Y1062 and STAT3 phosphorylation at residue Y705 (data not shown).
Sunitinib in combination with FSK stimulates NIS gene expression in RET/PTC1 cells
We evaluated four thyroid-specific gene transcripts (Tg, NIS, TPO, and TSHR) needed for the biosynthesis of thyroid hormone. Expression of these four genes is generally representative of differentiated thyroid function. We incubated cells with sunitinib concentrations of 500 pM and 500 nM that are well below the LC50 for 3 days in combination with 10 μM FSK for the last day and evaluated expression of all four thyroid-specific genes. We observed that at lower concentrations of sunitinib TSHR and TPO transcripts were increased (Fig. 6, lane 3); at higher concentrations of sunitinib, the TSHR, TPO, and NIS gene expression were stimulated (Fig. 6, lane 5). At low and high concentrations of sunitinib in combination with FSK, the TPO and NIS gene expression level is elevated (Fig. 6, lanes 4 and 6). Thus, in sunitinib-treated RET/PTC1 cells, we observe enhanced expression of TSHR and TPO, and with the addition of FSK, there was increased gene expression of TPO and NIS.
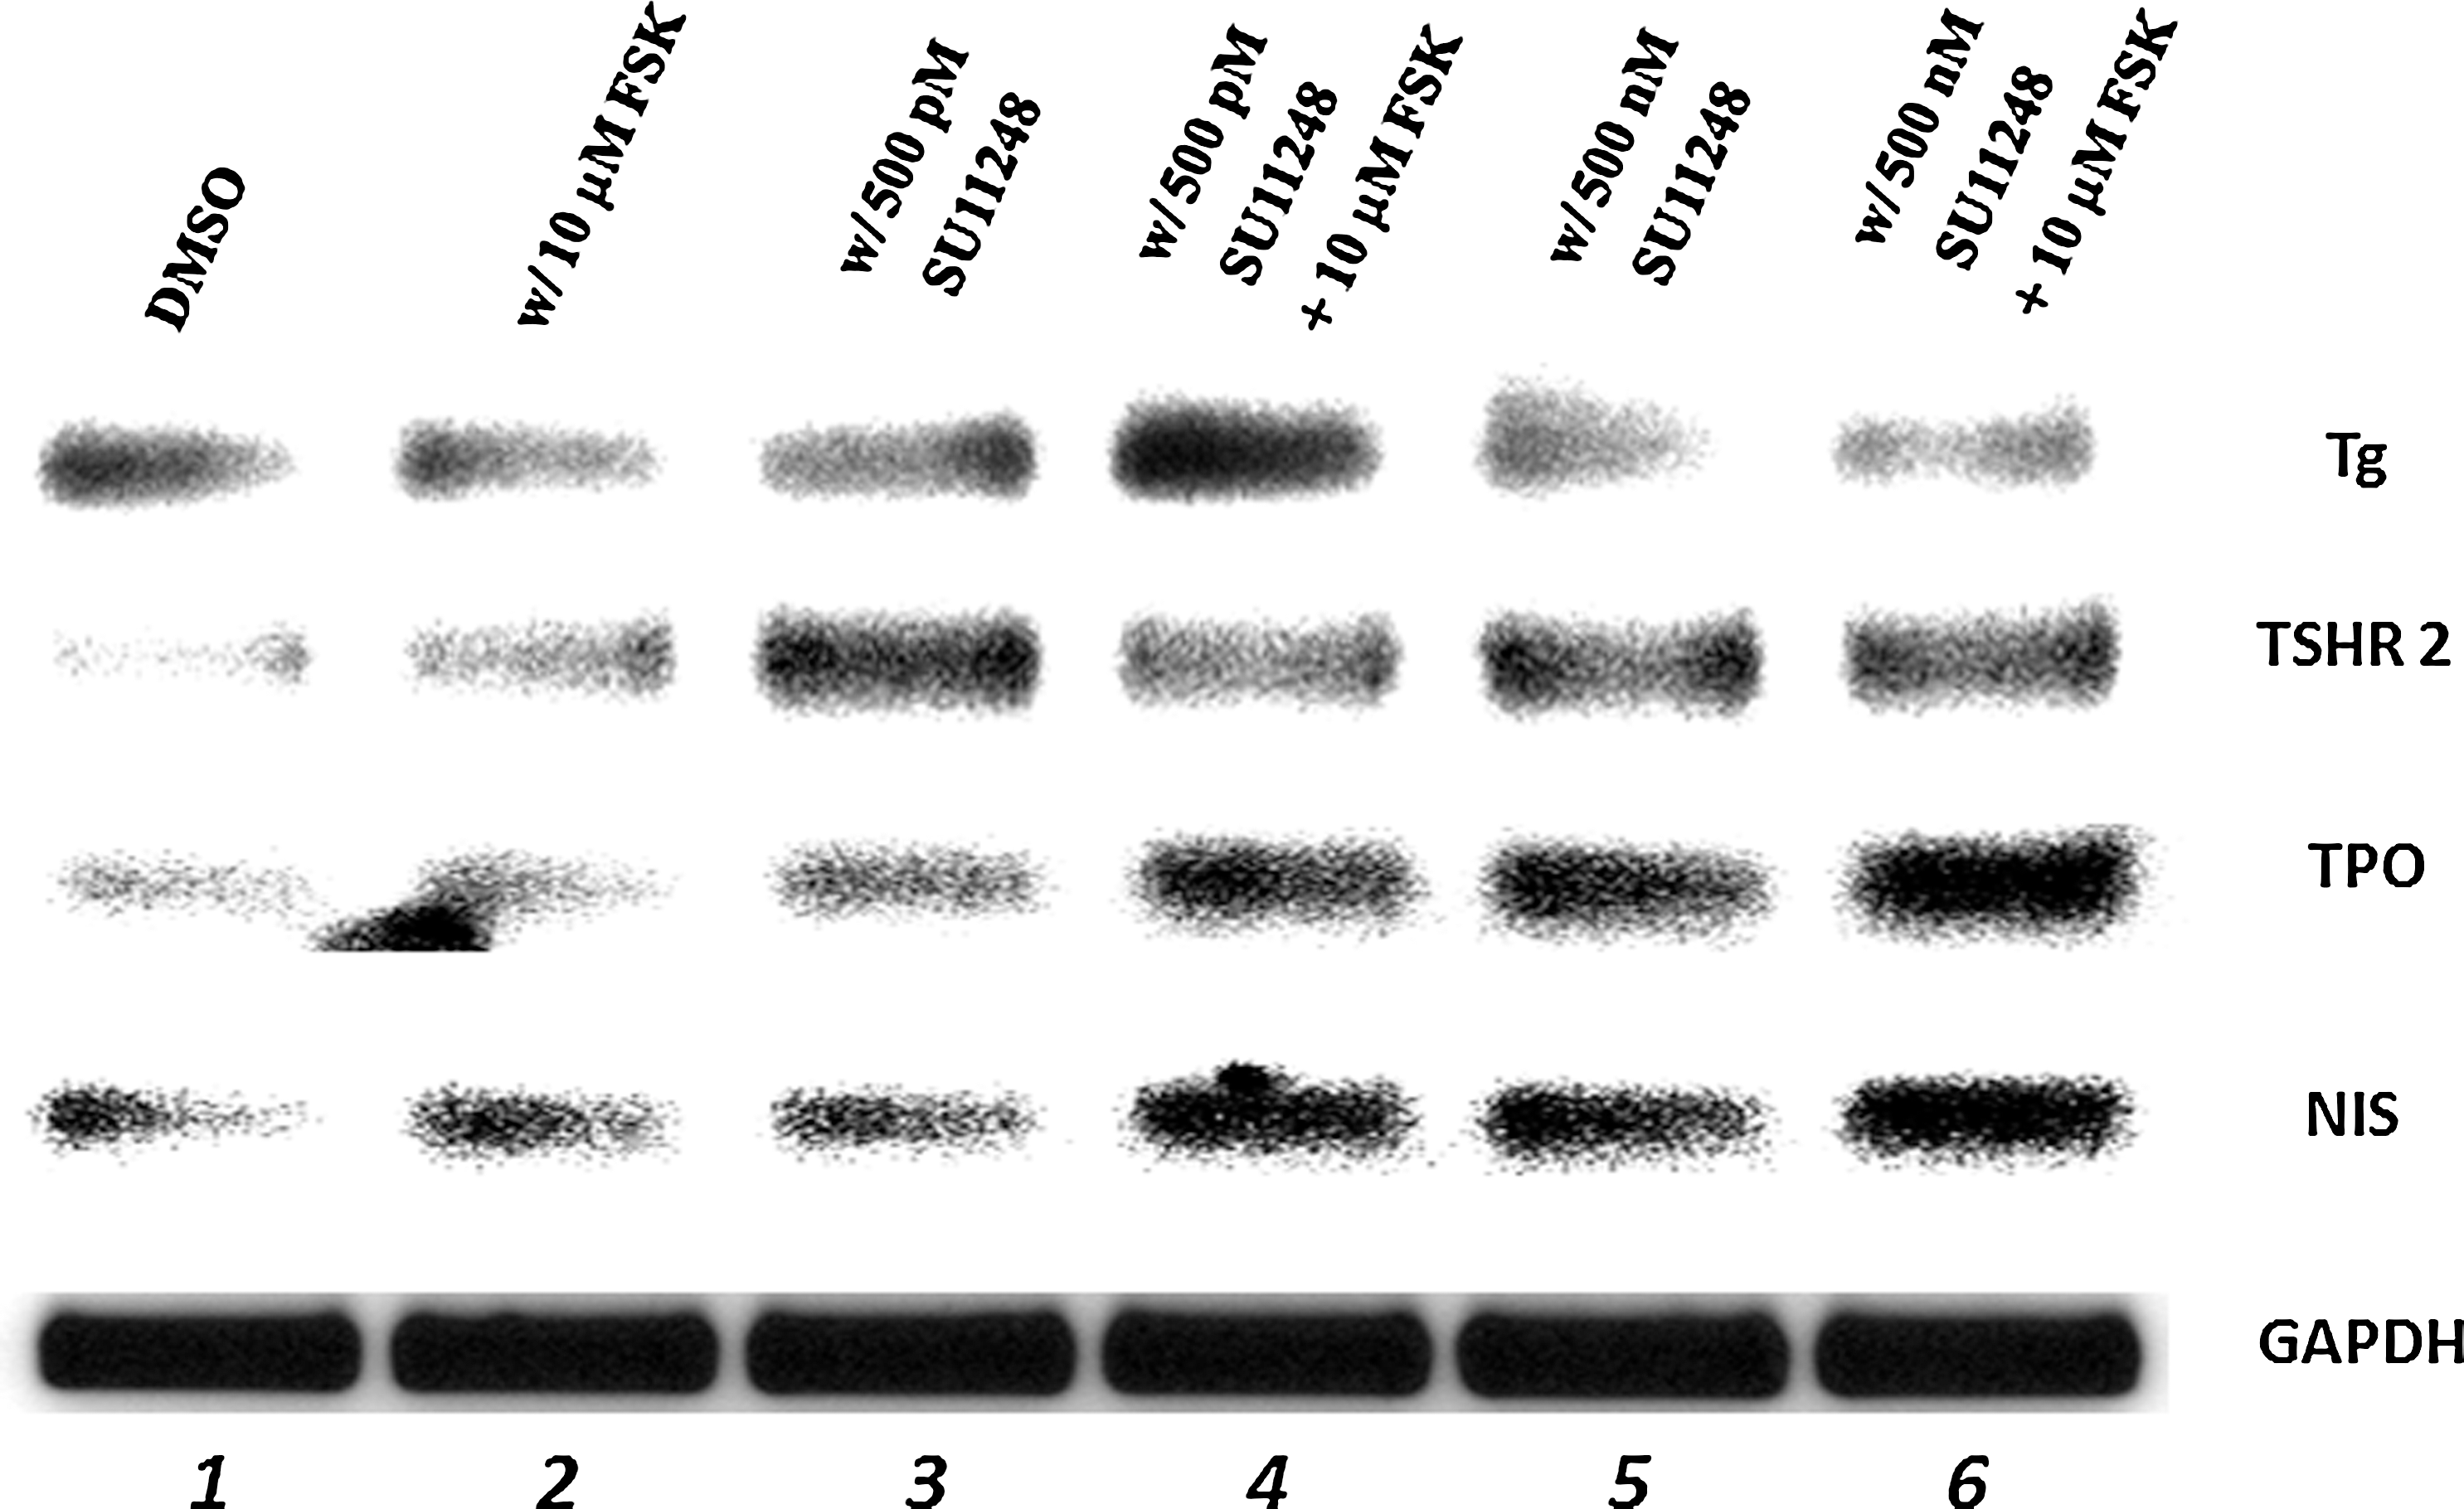
Polymerase chain reaction (PCR) amplification of thyroglobulin (Tg), thyroid-stimulating hormone receptor (TSHR), thyroid peroxidase (TPO), and sodium (Na)/iodide (I) symporter (NIS). RET/PTC1 cells were treated with DMSO or 500 pM or 500 nM sunitinib for 3 days with or without 10 μM forskolin (FSK) for the third day before collecting the mRNA and PCR amplification. PCR was performed for Tg (88 nt), TSHR (90 nt), TPO (105 nt), NIS (212 nt), and GAPDH (141 nt) denoted on the right of each panel. Legend across the top indicates the treatments of the RET/PTC1 cells before collecting the cytoplasmic extracts. The PCR products were obtained after 30 cycles of PCR amplification. Each experiment was done at least three times.
Sunitinib stimulates gene expression of NUE transcription factors
To understand the basis for increased NIS gene expression in sunitinib-treated RET/PTC1 cells, we investigated the effect of 1 μM sunitinib, a concentration below the LC50, and evaluated expression of transcription factors that bind to the NUE. In the absence of sunitinib, the NUE binding transcription factors Pax-8, ATF-1, and CREM Q1 are weakly expressed (Fig. 7, lane 1). Gene expression of these three factors was not enhanced with the addition of FSK (Fig. 7, lane 2). However, in the presence of 1 μM sunitinib, there was an increase in expression of all three factors, and CREM Q2 expression was reduced (Fig. 7, lane 3). In the presence of 1 μM sunitinib in combination with 10 μM FSK, there was increased expression of all four transcription factors (Fig. 7, lane 4). RET/PTC1 cells treated with sunitinib and FSK showed an increase in endogenous NIS gene expression that appears to be directed by the stimulation of the NUE binding transcription factors.
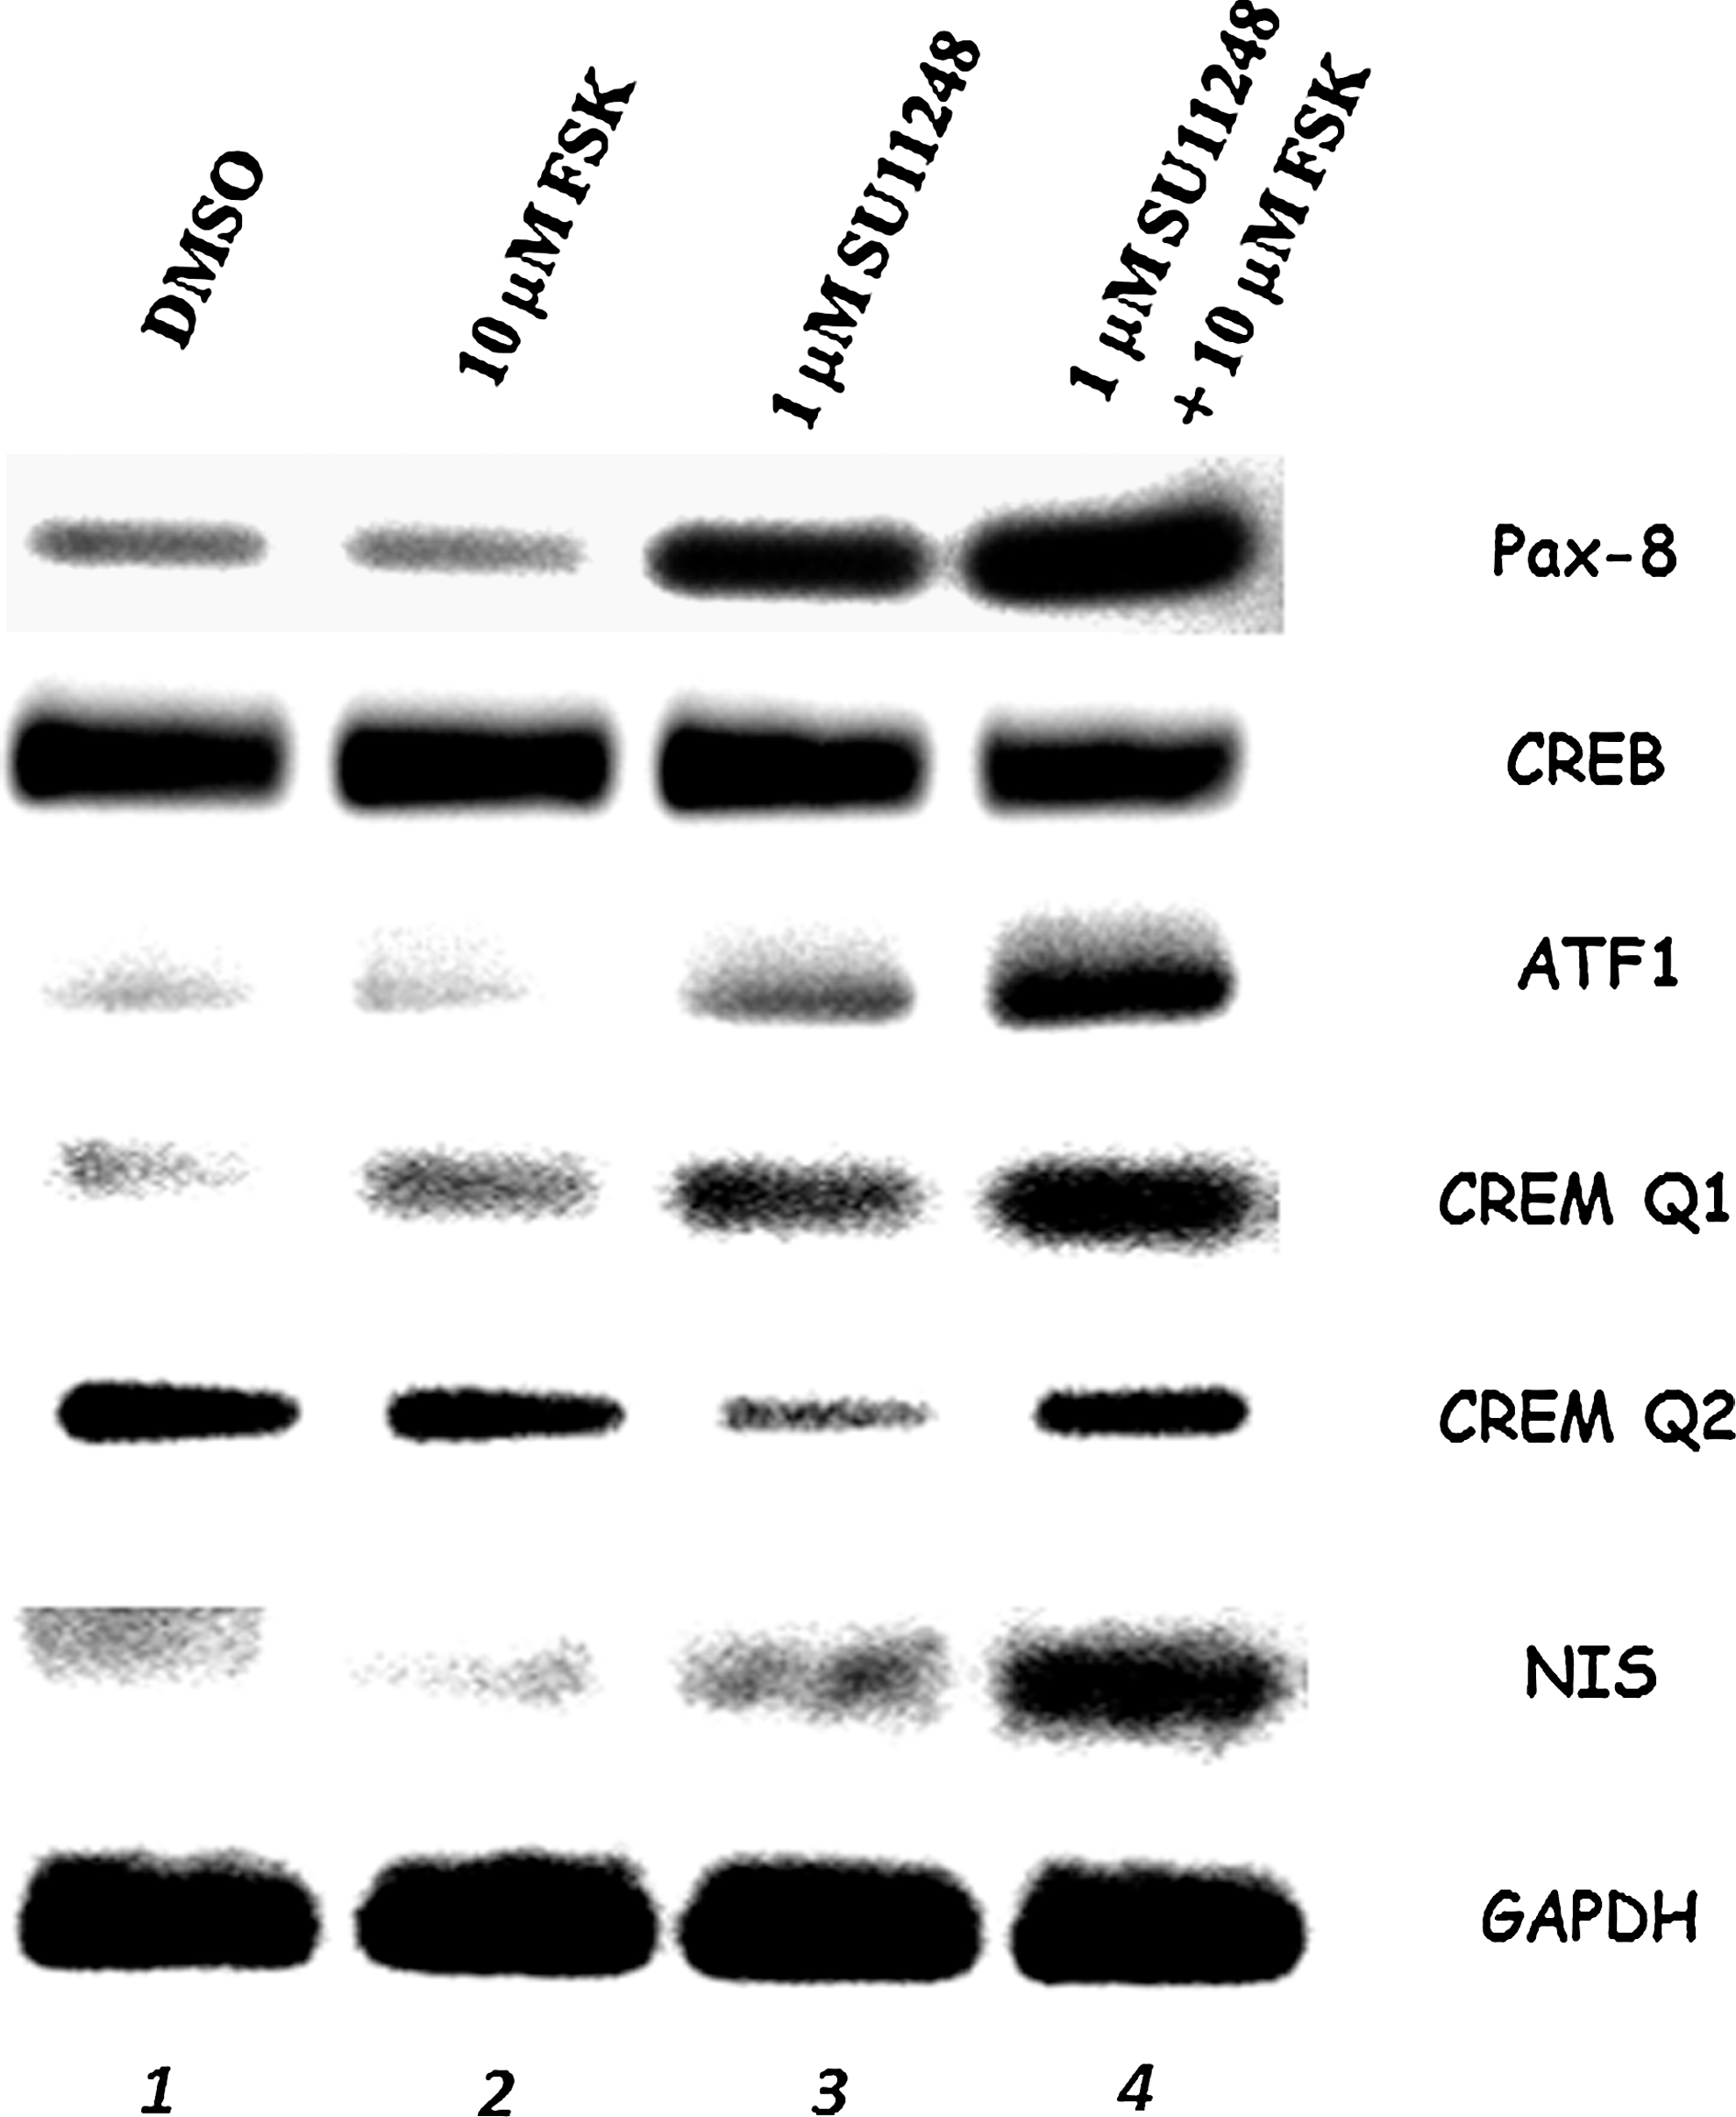
PCR amplification of NIS upstream enhancer binding transcription factors Pax-8, CREB, ATF-1, CREM Q1, and CREM Q2 along with NIS. RET/PTC1 cells were treated with DMSO or 1 μM sunitinib for 3 days with or without 10 μM FSK for the third day before collecting the mRNA and PCR amplification. PCR was performed for Pax-8 (85 nt), CREB (104 nt), ATF-1 (71 nt), CREM Q1 (89 nt), CREM Q2 (128 nt), NIS (212 nt), and GAPDH (141 nt) and denoted on the right side of each panel. Legend across the top indicates the treatments of the RET/PTC1 cells before collecting the cytoplasmic extracts. The PCR products were obtained after 30 cycles of PCR amplification. Each experiment was done at least three times.
Inhibition of MEK/ERK and SAPK/JNK MAPK cytosolic pathways individually and in combination increases NIS gene expression in RET/PTC1 cells
To better understand the mechanism by which sunitinib increases NIS gene expression, we inhibited both MEK/ERK an SAPK/JNK pathways individually as well as in combination. We used the MEK/ERK inhibitor (UO126) and SAPK/JNK inhibitor (SP600125) at concentrations that were determined to be effective in several cell lines by the manufacturer (CalBiochem). In the presence of 1 μM UO126, cytosolic ERK 1/2 phosphorylation was reduced with and without FSK (Fig. 8A top, left panel, lanes 3 and 4), indicating that the MEK/ERK pathway was inhibited. In the same RET/PTC1 cells, NIS gene expression was increased using 1 μM UO126 inhibitor (Fig. 8A top, right panel, lanes 5 and 7), and NIS expression was enhanced with the addition of FSK (Fig. 8A top, right panel, lanes 6 and 8). Similarly, in the presence of 1 μM SP600125, cytosolic p54 was reduced (Fig. 8A bottom, left panel, lanes 3 and 4), indicating that the SAPK/JNK pathway was inhibited. In the same RET/PTC1 cells, NIS gene expression was increased using 0.5–25 μM SP600125 inhibitor (Fig. 8A bottom, right panel, lanes 3, 5, and 7), and was enhanced with the addition of FSK (Fig. 8A top, right panel, lanes 4, 6, and 8).

PCR amplification of NIS. RET/PTC1 cells were treated with DMSO, UO126, or SP600125, at concentrations indicated above each lane, for 3 days with or without 10 μM FSK for the third day before the cells were lysed and the cytoplasmic extracts were separated from the nuclear extracts. The cytoplasmic extracts were used for Western blots demonstrating the inhibitory effects of UO126 and SP600125 on the mitogen-activated protein kinase signaling MEK/ERK, and SAPK/JNK in RET/PTC1 cells. The nuclear extracts were used to collect all of the mRNA and PCR amplification. (
Further, we investigated the effects of inhibiting both MEK/ERK and SAPK/JNK pathways simultaneously on NIS gene expression. The data show that inhibiting both pathways concurrently with and without FSK increases NIS gene expression (Fig. 8B, lanes 3–10), but there is not an additive effect by use of both inhibitors simultaneously. In fact, at the highest concentrations of inhibitors used we noticed a slight decrease in NIS gene expression (Fig. 8, lanes 9 and 10). We believe that using inhibitor combinations may alter general cellular activity and thus cause additional effects on NIS gene expression. The appropriate combinations of inhibitors and concentrations of inhibitors are important for optimal enhancement of NIS gene expression.
Discussion
These data demonstrate that sunitinib is a potent growth inhibitor of RET/PTC1 thyroid cancer cells. Previous work showed that sunitinib strongly inhibits the growth of RET/PTC3 cells (7). In the RET/PTC1 cells, sunitinib inhibits cell proliferation, cell migration, and the cell cycle. In addition, low concentrations of sunitinib block the aberrant MEK/ERK and SAPK/JNK MAPK cytosolic signal transduction pathways, resulting in gene expression of FSK-stimulated NUE-binding transcription factors, Pax-8, ATF-1, and CREM Q1. This in turn is associated with increased NIS gene expression. The activated MEK/ERK and SAPK/JNK pathways appear to be, at least in part, important for unregulated proliferation of PTC cells; by inhibiting either of these pathways and reversing the aberrant cell growth, NIS gene expression is stimulated. The optimal combination and concentrations of inhibitors of these pathways are important parameters for optimal enhancement of NIS gene expression. The data also suggest that the tyrosine kinase receptor (TKR) inhibitor sunitinib may be effective in blocking cell proliferation and enhancing NIS gene expression in some thyroid cancers, depending on the signal transduction pathway that characterizes the cancer.
RET/PTC1 cells are more sensitive to sunitinib treatment than FRTL-5 cells
Previously it was shown that normal rat thyroid cells (FRTL-5) are resistant to sunitinib at a concentration as high as 25 μM for 24 hours (15). FRTL-5 cells had a LC50 of 14.6 μM at 48 hours of treatment (15). RET/PTC1 cells are much more sensitive to sunitinib with an LC50 of 1.8 μM at 48 hours (Table 1).
The RET/PTC1 rearrangement is a constitutively active receptor tyrosine kinase, and the kinase domain has about 50% homology to the kinase domains of other TKRs (PDGFR, KIT, VEGFR, and FLT3). Sunitinib has been shown to inhibit these TKRs by blocking the ATP binding site of the receptors (16). It has been suggested that the RET/PTC1 rearrangement is upstream of BRAF in the MEK/ERK MAPK signal transduction pathway (17,18). We found that the MEK/ERK and the SAPK/JNK pathways are inhibited in sunitinib-treated RET/PTC1 cells (Fig. 5A), and we suggest that this inhibition is likely to be involved in the mechanism causing the inhibition of the cell cycle and of expression of genes essential for the biosynthesis of thyroid hormone. However, our data do not exclude the possibility that sunitinib blocks pathways other than RET resulting in the increase in expression of NIS, TSHR, TPO, and the NUE transcription factors. Mechanistically, based on our data it appears that the inhibition of MEK/ERK and SAPK/JNK cytosolic pathways is a strong contributor for the increase in NIS gene expression, in RET/PTC1 cells (Fig. 8). Further, many pathways crosstalk, and the activation of STAT3 may induce gene expression of products that inhibit iodide-metabolizing gene transcription.
Sunitinib induces a morphological reversion, inhibits proliferation, and enhances thyroid-specific gene expression
We observed morphological changes that occurred in RET/PTC1 cells. Incubation with 1 μM sunitinib for several hours transformed the morphology of RET/PTC1 cells, whereas cells treated with the DMSO control exhibited the branched-like morphology representative of RET/PTC1 cells. This morphological change is accompanied by MAPK inhibition, cell cycle arrest, and the ability to reactivate the cAMP/PKA-mediated pathway with FSK. Sunitinib-treated RET/PTC1 cancer cells were morphologically changed, and their growth was inhibited, consistent with the report of Kim et al., who demonstrated that RET/PTC3 cells lost proliferating ability and changed morphology in the presence of sunitinib (7).
Sunitinib-treated RET/PTC1 cells were able to express the thyroid-specific genes, Tg and TPO, indicating positive effects on cell differentiation. Sunitinib-treated RET/PTC1 cells had enhanced expression of genes regulated by the cAMP/PKA pathway when FSK was used to stimulate the NUE binding transcription factors along with NIS. These data suggest that sunitinib may be used to promote NIS gene expression, NIS protein translocation to the membrane, and iodide uptake. Even though a much higher concentration of sunitinib is required to cause these effects in FRTL-5 rat cells, sunitinib increased iodide uptake in FRTL-5 cells (15).
Elucidating the defects of NIS gene expression in RET/PTC1 cancer cells
NIS is functional in many differentiated thyroid cancers but nonfunctional in about one-fourth of thyroid carcinomas, resulting in a poor prognosis (1). NIS may be nonfunctional because of lack of gene expression (5,6,19 –22) as well as lack of translocation of the protein to the basolateral membrane (23,24). We recently demonstrated that RET/PTC1 cells lacked FSK-stimulated CREM activator and FSK enhancement of ATF-1 and Pax-8 gene expression, which are necessary for optimal NIS gene expression (6). We report here that FSK can enhance CREM activator, ATF-1, and Pax-8, which in turn stimulate NIS gene expression in sunitinib-treated RET/PTC1 cells, but not to a level sufficient to obtain significant iodide transport (data not shown). The regulation of NIS gene expression is complex because many transcription factors are involved, and some of them are activated by the cAMP/PKA-mediated pathway. Signaling pathway crosstalk and other signaling events appear to play a role in preventing NIS expression in cancer cells, such as the MEK/ERK and AKT/PI3K pathways (25). In addition to various signaling pathways that interfere with NIS gene expression, other factors may be involved. MicroRNAs may play a role in expression of NIS in normal thyroid cells and thyroid cancer cells because there appear to be different variations in microRNA patterns between normal thyroid cells and papillary cancer cells harboring the RET/PTC1 rearrangement (26,27).
In conclusion, sunitinib is a powerful inhibitor of RET-associated thyroid cancers and could be used to enhance levels of active NIS protein for radioiodide uptake and cancer cell ablation, resulting in better patient prognosis.
Footnotes
Acknowledgments
The authors thank Dr. Gregory Brent and Dr. Takahiko Kogai for kindly providing the hNIS and hGAPDH primers and for enlightening discussions and review of the manuscript. The authors thank Dr. Masahiro Sugawara for providing material used in this work. The authors thank Matthew Rettig for helpful discussions. This work was supported by Merit Research Funds from the Department of Veterans Affairs to J.M.H. and a grant from Pfizer, Inc.
Disclosure Statement
The authors declare that no competing financial interests exist.