
Abstract
Background:
The vitamin D receptor (VDR) has been studied as a novel target for cancer therapy in many tissue types as VDR ligands decrease cell proliferation in vitro and decrease tumor growth in vivo in sensitive cells. The objective of this study was to analyze the response to VDR agonist therapy in a panel of validated thyroid cancer cells and assess genetic markers predicting sensitivity and resistance to calcitriol and the noncalcemic analog DP006.
Methods:
Thyroid cancer cell lines were analyzed for VDR and RXR protein by Western blot. Cell growth after VDR agonist treatment (calcitriol or DP006) was assessed after 6 days of treatment by viable cell assay. To investigate calcitriol/DP006 resistance in VDR-expressing cells, the VDR was sequenced and 1-α and 24-hydroxylase mRNA expression was assessed.
Results:
VDR protein was variably expressed in the thyroid cancer cell lines and its presence was not sufficient for decreased viable cell count in response to calcitriol or DP006. The most sensitive cells (TPC1) have an ff FokI VDR polymorphism and the most resistant cells (HTh7 and 8505C) have an FF FokI VDR. This is a unique finding given that the balance of the literature of VDR polymorphisms describes an association of the ff FokI polymorphism with cancer risk and/or decreased VDR transactivation. 1-α and 24-hydroxylase mRNA expression before and after VDR agonist therapy was examined. 1-α-Hydroxylase levels did not change after calcitriol treatment. However, we found that higher baseline 24-hydroxylase levels and/or lower stimulation of 24-hydroxylase levels after calcitriol treatment were associated with relative resistance to calcitriol/DP006.
Conclusions:
The VDR represents a novel therapeutic target in poorly differentiated thyroid cancer; however, the efficacy of VDR agonist therapy to decrease viable thyroid cancer cell count cannot be predicted solely on the presence of the VDR. The FF FokI VDR genotype and high baseline 24-hydroxylase levels were associated with relative resistance to calcitriol and DP006. Therefore, identifiable markers of sensitivity or resistance to VDR agonist therapy may allow for a personalized use of these agents in poorly differentiated thyroid cancer.
Introduction
The interest in the association of vitamin D (VD) levels with cancer and the VD receptor (VDR) as a therapeutic target for cancer has dramatically increased in the last several years, even giving rise to a consensus conference by the World Health Organization evaluating the evidence associated with VD and cancer (4). The VDR is a member of the nuclear hormone receptor superfamily that binds to DNA at VD response elements upon ligand binding to alter transcription of VD responsive genes (5). VD appears to have anticancer activity via multiple mechanisms, including decreasing proliferation, promoting re-differentiation, inhibiting angiogenesis, and accentuating the effects of standard chemotherapy (6 –9). Given the lay press coverage of VD as a therapeutic supplement for many disease states, it is critical that a rational scientific approach is used to study the efficacy and mechanisms of VD treatment.
In this article, we present an evaluation of a panel of validated thyroid cancer cell lines for VDR protein expression and response to VD treatment in vitro with the active VDR ligand 1-α,25-dihydroxyvitamin D3 [1,25(OH)2D3, calcitriol] and the novel noncalcemic analog DP006. The observation was made that VDR expression did not necessarily predict decreased cell count in response to active VDR ligand; therefore, etiologies of resistance were evaluated, including VDR sequence analysis and 24-hydroxylase expression.
Materials and Methods
Cell lines and chemicals
SW1736, C643, HTh7, and HTh74 cells were kindly provided by Dr. Kenneth Ain (University of Kentucky) with permission from Dr. N-E Heldin (University Hospital, S-751 85 Uppsala, Sweden); TPC1 cells were kindly provided by Dr. S. Jhiang (Ohio State University); 8505C cells were kindly provided by Dr. Massimo Santoro (University of Torino). All cells were last confirmed to be unique and not contaminated by short-tandem repeat profiling in July 2009. They match the short-tandem repeat profile as previously reported by our group (10). LnCap [a well-characterized prostate cancer cell line that expresses VDR protein for use as a positive control (11)] was kindly provided by Dr. Scott Lucia (University of Colorado School of Medicine). All cells were grown in RPMI 1640 (Invitrogen Corporation) supplemented with 5% fetal bovine serum (Hyclone) and 0.5% penicillin/streptomycin. Calcitriol was purchased from Sigma-Aldrich (catalog# D1530) and the novel low potency, noncalcemic VD analog DP006 was kindly provided by Deltanoid Pharmaceuticals. Calcitriol was reconstituted in dimethyl sulfoxide (DMSO) and DP006 in 100% ethanol. These served as the volume equivalent controls for all experiments involving drug administration.
Western blot analysis
Nuclear extracts were obtained from all cell lines for evaluation of VDR and RXRα, RXRβ, and RXRγ proteins utilizing a nuclear extract kit from Active Motif (catalog #400100). The protein content of lysates was measured utilizing a commercial protein assay kit, DC from Bio-Rad. Sixty micrograms of protein was loaded for each sample and proteins were separated on a 10% sodium dodecyl sulfate–polyacrylamide gel and transferred to polyvinylidene difluoride membranes. The membranes were blocked with 1 × TBST (20 mM Tris-HCl [pH 7.6], 8.5% NaCl, and 0.1% Tween 20) containing 5% nonfat dry milk at room temperature for 2 hours and incubated in the appropriate primary antibody in 1 × TBST containing 5% nonfat dry milk at 4°C overnight. VDR (catalog# sc-13133) and RXRα (catalog# sc-553) antibodies (Santa Cruz Biotechnology) were used at a concentration of 1:500. Poly (ADP-ribose) polymerase (PARP) protein (Chemicon) at 1:1000 was probed for loading control. After washing, membranes were incubated for 1 hour at room temperature with the appropriate secondary antibody conjugated to horse-radish peroxidase at a 1:5000 dilution for VDR, PARP, and RXRα. The enhanced chemiluminescent (ECL) detection reagent from Amersham Biosciences was used for immunodetection. Densitometry was assessed using an Alpha Innotech alpha imager comparing VDR pixel counts relative to PARP (three separate blots).
Viable cell counting
Cells were plated in 60-mm plates to reach 80%–90% confluency by the end of the 6-day assay. After overnight incubation, the medium was aspirated and replaced with the appropriate concentration of drug or volume equivalent vehicle, and this was changed after 3 days. At 6 days, the cells were washed with phosphate-buffered saline (PBS) and were counted using the Beckman Coulter ViCell-Counter (Beckman Coulter, Inc.). Due to limited supplies of DP006, a dose titration of 1, 5, and 50 μM was performed and compared to 100 nM calcitriol in TPC1 and SW1736 (Supplementary Fig. S1; Supplementary Data are available online at
Cell cycle analysis
Thyroid cancer cells were plated at different densities such that they reached 80%–90% confluence in six-well plates after 48 hours (50,000 cells for TPC1 and 100,000 for the others) and 72 hours for HTh74 and SW1736 (the two slowest growing cell lines). Cells were grown in our standard growth medium and were treated with calcitriol 100 nM (or were grown in the presence of volume equivalent vehicle). After 48 hours, cells were harvested, washed with PBS, and covered with 1 mL of saponin/propidium iodide (PI) stain (10 mL of 3% saponin, 5.0 mL of a 1 mg/mL stock of PI [in water], 10 mL of a 1 mM stock of ethylenediaminetetraacetic acid, 2.5 mL of a 1 mg/mL stock RNase [DNase free], and then PBS to reach 100 mL). Cell cycle distribution was determined by flow cytometry using a Beckman Coulter FC500 at the University of Colorado Cancer Center Flow Cytometry Core. ModFit LT (Verity Software House) was used for cell cycle modeling and doublet discrimination.
VDR sequence analysis
Total RNA was isolated from cells using RNeasy Mini Kit (Qiagen) and reverse transcribed using cDNA Achive kit from Applied Biosystem. Then polymerase chain reaction (PCR) was performed of the entire VDR coding region using 5′ VDR, GGGTCTGAAGTGT CTGTGAG, and 3′ VDR, TGAGGAGGGCTGCTGAGTAG. Then, the PCR product was cloned into a vector and given for sequencing. The FokI polymorphism discovered was confirmed using Genomic DNA. Genomic DNA was prepared using DNeasy Tissue Kit (Qiagen) and primers for each VDR exon were used for sequencing. Excess primers and dNTPs were removed before sequencing using ExoSAP-IT (USB Corporation). PCR products were sequenced using each exon's forward primer by UCCC DNA sequencing and Analysis core. These were confirmed by sequencing with the reverse primers. The primers used to include the first ATG start codon (site of the FokI polymorphism) are forward, GAGATGCCCACCCTTGCTGA, and reverse, GCTCCCTTCATGGAAACACC.
Quantitative reverse transcription-PCR
Total RNA was isolated from cells using the RNeasy Mini Kit (Qiagen) as per the manufacturer's protocol. The mRNA for 1-α-hydroxylase (CYP27B1) and 24-hydroxylase (CYP24A1) was measured by real-time quantitative reverse transcription (qRT)-PCR using ABI PRISM 7700. The sequences of forward and reverse primers as designed by Primer Express (PE ABI) were 5′-GGTCGCCGATTA GCAGAGC-3′ and 3′-CCTGGATGTCGTATTTGCGG-5′ for 24-hydroxylase and 5′-TGCTATTGGCGGGAGTGG-3′ and 3′-TGCCGGGA GAGCTCATACAG-5′ for 1-α-hydroxylase. The TaqMan™ fluorogenic probe used was 6FAM-TCAACTGCA TTTGGCTCTTTGTTGGATTG-TAMRA for 24-hydroxylase and 6FAM-ACGGTGT CCAACACGCTCTCTTGGG-TAMRA for 1-α-hydroxylase. Amplification reactions, thermal cycling conditions, and generation of a standard curve have been described previously (12).
Statistical analysis
All statistical analyses were performed using GraphPad Prism Version 5. Experiments were performed a minimum of two times in duplicate, with the majority three or more times in triplicate. The viable cells assays were analyzed using a one-way analysis of variance (ANOVA) with Dunnett's multiple comparison tests for comparison to control conditions. The protein densitometry, 1-α and 24-hydroxylase studies were analyzed with a one-way ANOVA with Tukey's multiple comparison tests. The cell cycle analysis utilized a two-way ANOVA with Bonferroni posttests. Significance was based on a p-value of <0.05.
Results
The VDR is differentially expressed in a panel of thyroid cancer cell lines
A representative Western blot shows that VDR protein is present in different quantities among LnCap (+control) and six thyroid cancer cell lines (one PTC and five ATC) (Fig. 1). Nonspecific bands are seen below VDR and are different between different lots of the same primary VDR ab (blots in Supplementary Figs. S2a–b). RXRα protein, known to be a heterodimer partner of VDR, is present in all cell lines (13). RXRβ and RXRγ had low to undetectable levels in all cell lines (data not shown). VDR to PARP densitometry by alpha imaging based on three independent Western blots showed a significant difference in relative VDR protein levels across all cell lines (p < 0.001), with significantly lower VDR in TPC1 and HTh7 compared to C643 and SW1736 (p < 0.05) (Fig. 1b).
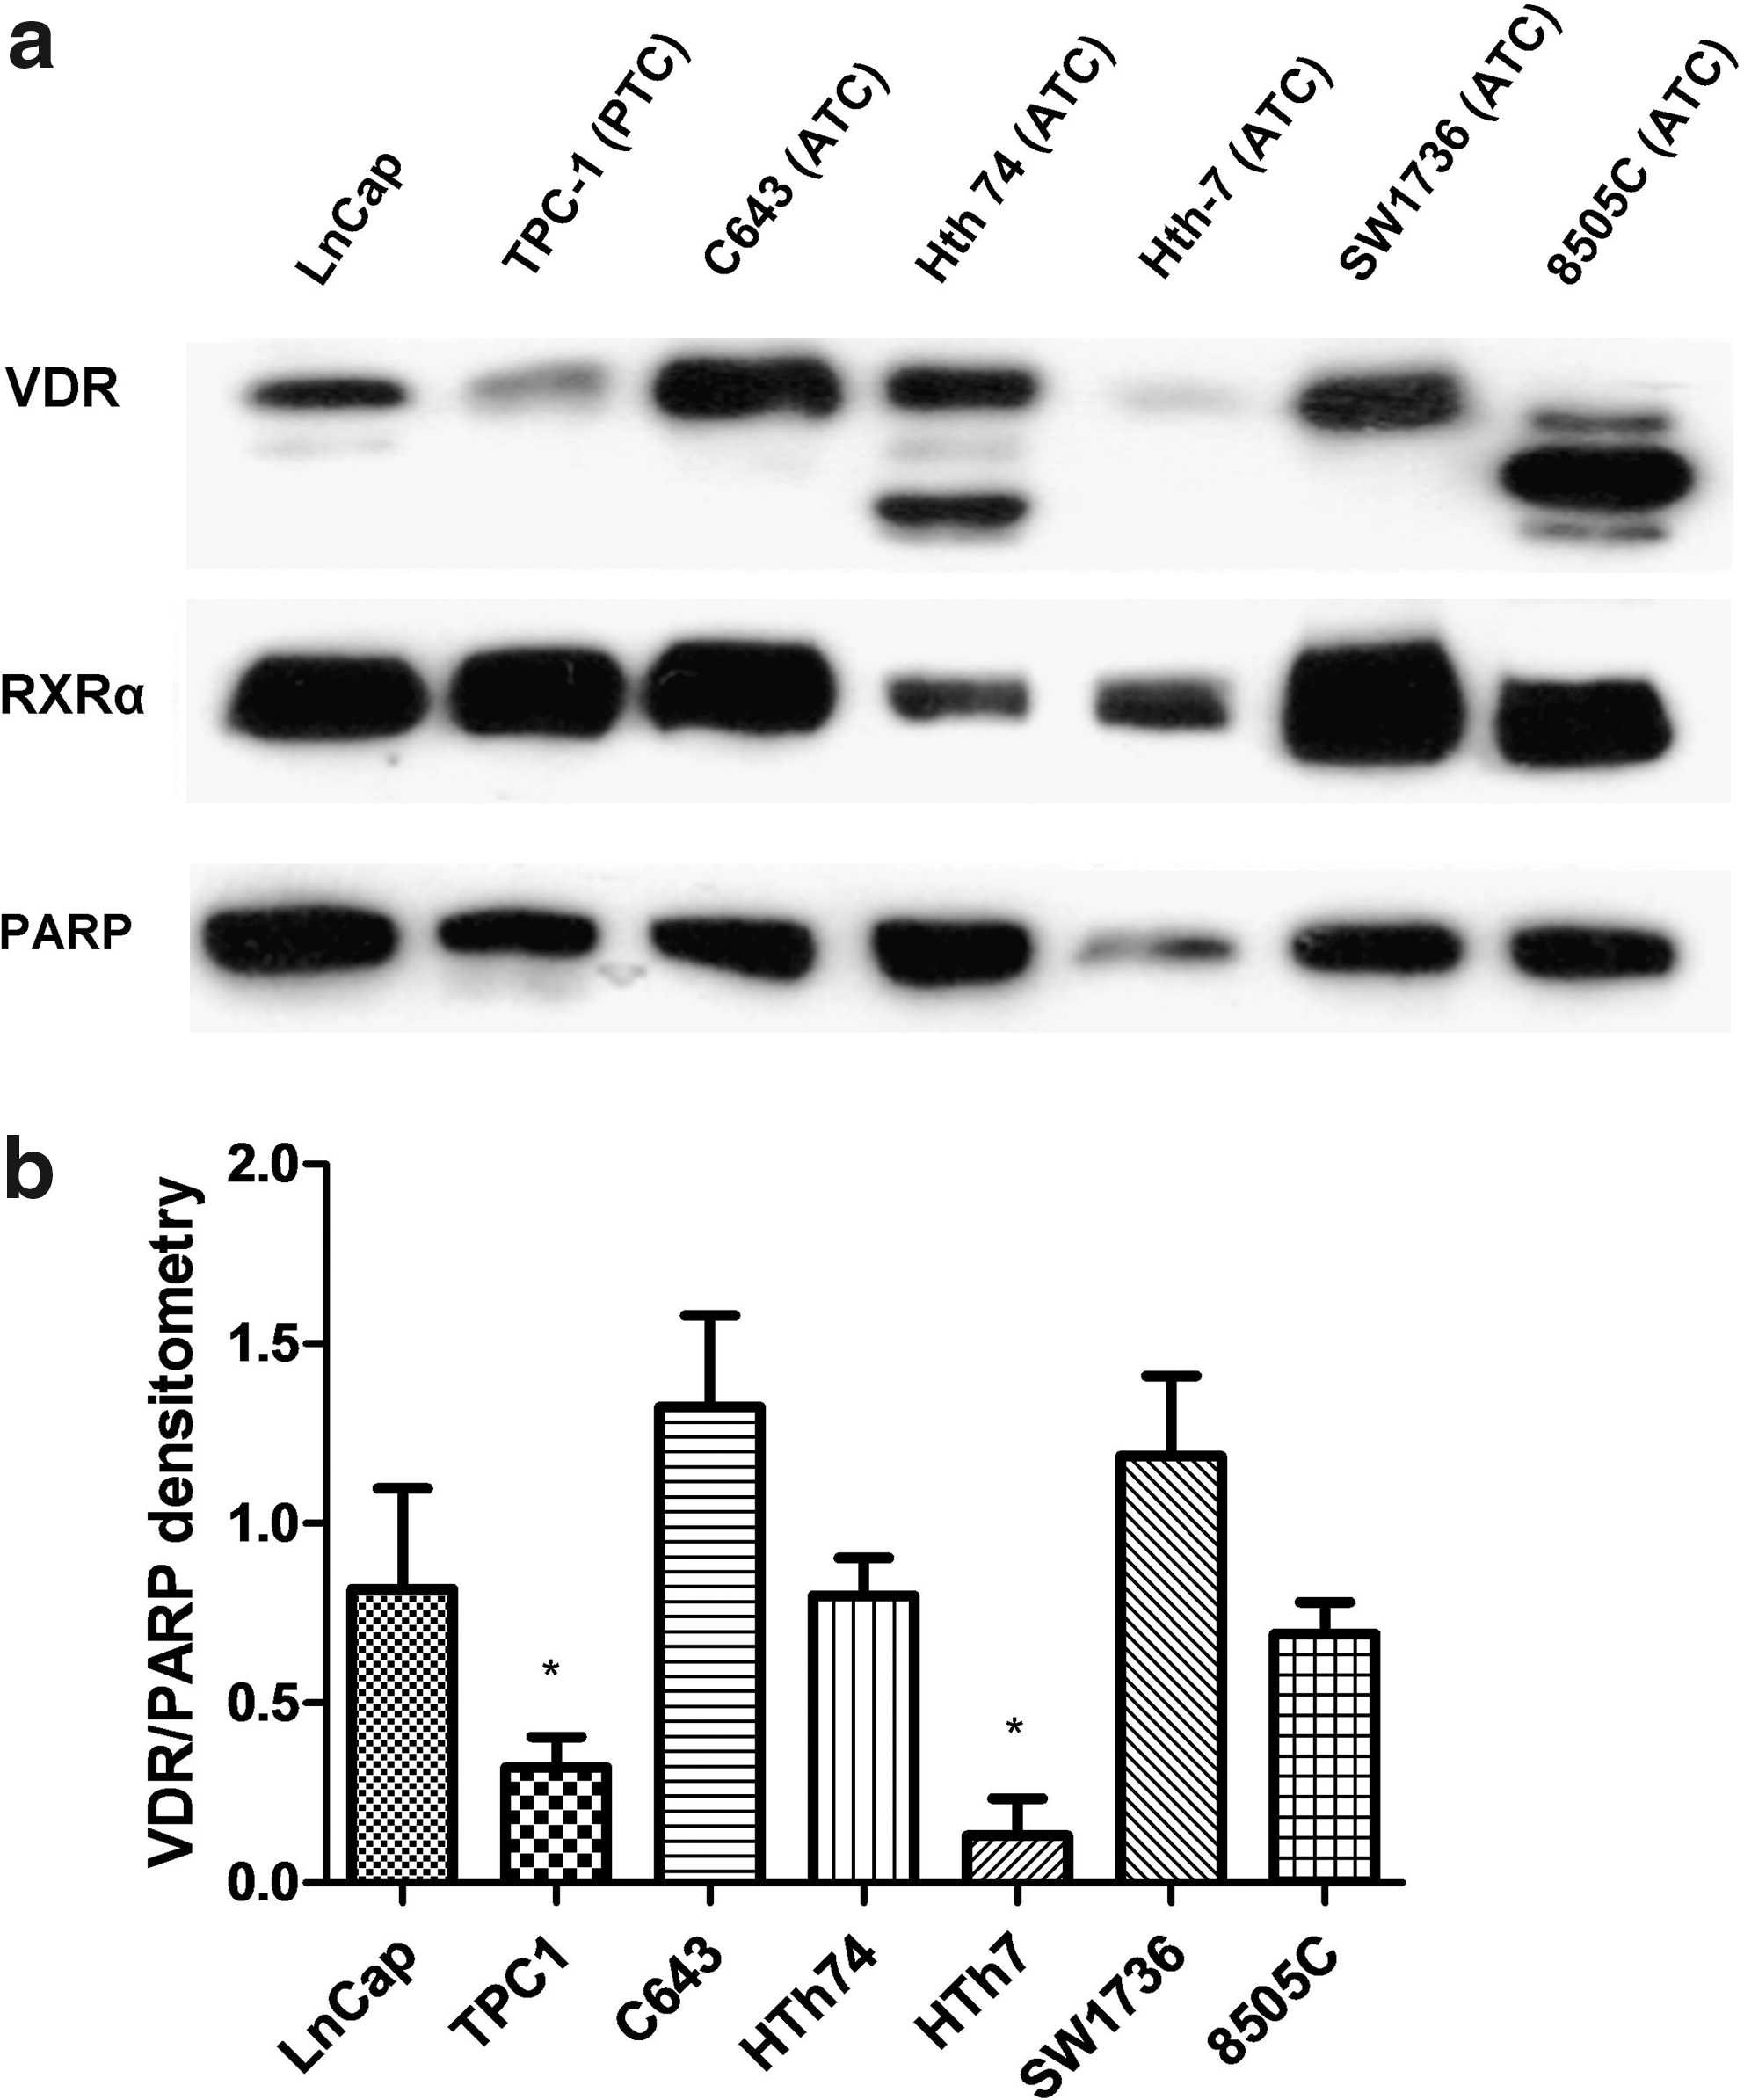
The vitamin D receptor (VDR) is differentially expressed in a panel of thyroid cancer cell lines. (
Decreased viability of thyroid cancer cells in the presence of calcitriol or DP006 is not related to VDR level
The percent response (decrease in viable cell count relative to control conditions) for each thyroid cancer cell line are reported at 1, 10, and 100 nM of calcitriol and 5 μM DP006, respectively: TPC1 (1%, 20%, 65%, and 69%); C643 (0%, 17%, 43%, and 49%); HTh74 (12%, 27%, 33%, and 55%); HTh7 (0%, 0%, 4%, and 22%); SW1736 (2% increase, 6% increase, 24%, and 28%); and 8505C (10%, 8%, 12%, and 12%). The only significant decrease in viable cells at 1 nM of calcitriol was in HTh74 (p < 0.01). TPC1 and HTh74 were both sensitive at 10 nM relative to control with a p-value of <0.0001, whereas C643 was sensitive at 10 nM with a p-value of <0.05. Relatively resistant cells HTh7, SW1736, and 8505C did not have decreased cell growth with calcitriol 10 nM compared to vehicle (Fig. 2).

Sensitive VDR expressing cell lines have a dose responsive decrease in viable cell count. Cells were plated in 60 mm plates to reach 80%–90% confluency by the end of the 6 day assay. After overnight incubation, the medium was aspirated and replaced with the appropriate concentration of drug (1, 10, or 100 nM calcitriol and 5 μM DP006) or volume equivalent vehicle, and this was changed after 3 days. At 6 days, the cells were washed with phosphate-buffered saline and were counted using the Beckman Coulter ViCell-Counter (Beckman Coulter, Inc.). The line at 100% represents growth of the cells in volume equivalent vehicle. *p < 0.05 compared to control. **p < 0.01 compared to control. ***p < 0.001 compared to control. Error bars represent standard deviation [SD].
Calcitriol inhibits cell cycle progression in TPC1 but not other sensitive or resistant thyroid cancer cells
To assess if the decrease in viable cells with calcitriol was due to effects on cell cycle, thyroid cancer cells were analyzed for relative proportions of cells in G1, S, and G2M phases after 48 hours of treatment. The changes are reported for percentage change of population in G1, S, and G2M phases, respectively: TPC1 (+12.9%, −6.0%, and −6.9%); C643 (+0.4%, −0.5%, and +1.2%); HTh74 (+5.5%, −3.5%, and −1.9%); HTh7 (−1.1%, +0.5%, and +0.6%); SW1736 (−4.0%, +2.9%, and +1.1%); and 8505C (1.5%, −1.4%, and no change). Only TPC1 had a significant change in the percent of cells in each cell cycle phase (p < 0.001 for G1 arrest and p < 0.05 for S and p < 0.01 for G2M) (Fig. 3). HTh74 trended toward G1 arrest with a p-value of 0.07. To confirm that significant cell cycle changes in response to calcitriol were not missed by checking too early, HTh74 and SW1736 were checked after 72 hours of treatment: HTh74 (+4.6%, −2.8%, and −1.8%) and SW1736 (−4.0%, +3.2%, and +1%) (using the same convention as above, data not shown). The saponin/PI stain did not reveal a significant increased sub-G1 apoptotic signal relative to control for any cell line or any condition (data not shown).
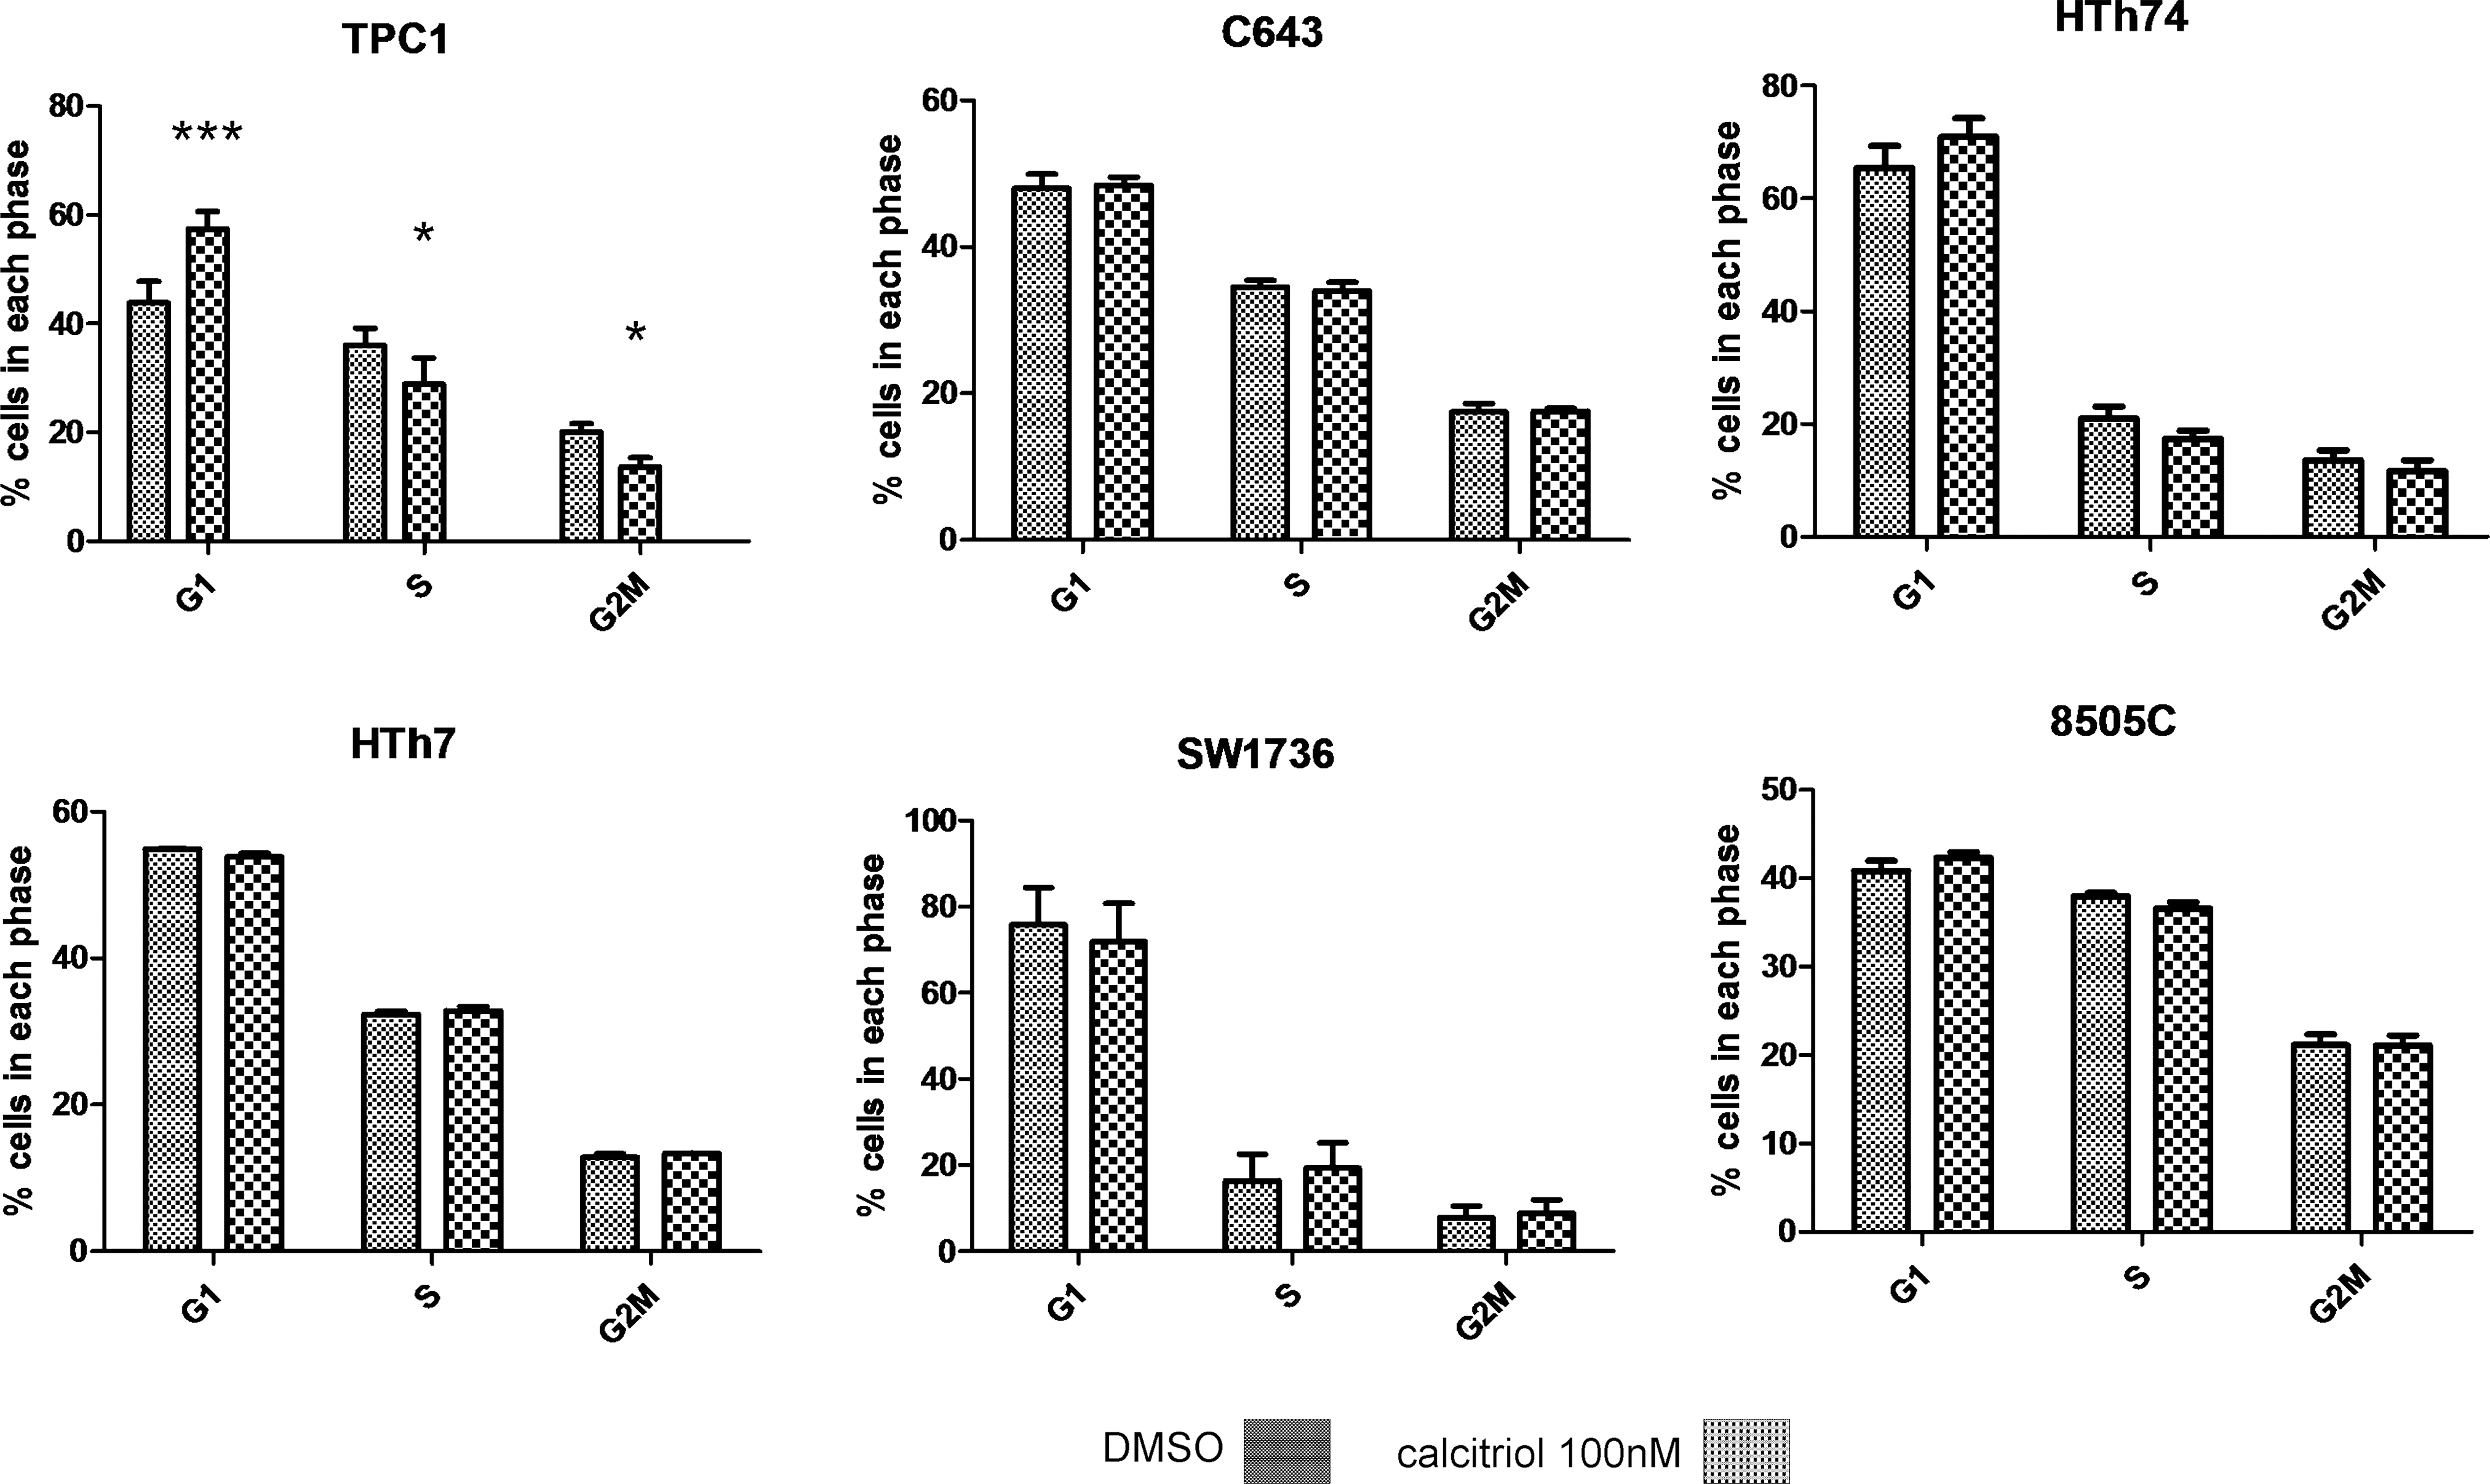
The most sensitive thyroid cancer cells, TPC1, demonstrate cell cycle inhibition in response to calcitriol. Cells were grown in six-well plates in our standard growth medium and were treated with either calcitriol 100 nM or in the presence of volume equivalent vehicle. After 48 hours, cells were harvested, washed with phosphate-buffered saline, and covered with 1 mL of saponin/propidium iodide stain, and cell cycle distribution was determined by flow cytometry. *p < 0.05 compared to control; ***p < 0.0001 compared to control. Error bars represent SD.
The ff FokI variant of the VDR is associated with the greatest decreased viable cell count in response to VDR agonist therapy, whereas the FF FokI variant is associated with the greatest resistance
To determine if response to calcitriol was related to VDR mutations, we sequenced the coding region of the VDR. The most sensitive cell line (TPC1) to calcitriol treatment has an ff FokI VDR polymorphism, whereas the two most resistant (HTh7 and 8505C) have an FF FokI VDR genotype. The cells with intermediate response are heterozygous (Ff) for FokI (Fig. 4).

The FF FokI VDR polymorphism is associated with partial resistance to VDR agonist therapy. The coding region of the VDR was sequenced and the FokI polymorphisms detected were confirmed with both forward and reverse sequencing. TPC1, the most sensitive cells to calcitriol/DP006 has the ff FokI polymorphism, whereas HTh7 and 8505C, both relatively resistant, have the FF FokI VDR genotype.
1-α-Hydroxylase levels do not change with calcitriol treatment, but baseline 24-hydroxylase levels and their response to VDR agonist treatment are correlated with decreased thyroid cancer cell viability to calcitriol and DP006
To assess VDR agonist regulatory enzymes, we measured 1-α-hydroxylase mRNA levels before and after calcitriol treatment. Although overall generally low, 1-α-hydroxylase levels were significantly higher in resistant (7.6–10 attograms/nanograms of ribosomal rRNA [ag/ng rRNA]) compared to sensitive (1.6–4.4 ag/ng rRNA) thyroid cancer cells and did not significantly change in response to calcitriol (Fig. 5). To assess VDR transactivation, we measured 24-hydroxylase mRNA expression in response to calcitriol and DP006. Responsive cell lines had lower baseline 24-hydroxylase expression (Fig. 6a) and increased fold change of 24-hydroxylase after 100 nM calcitriol or 5 μM DP006 for 24 hours, whereas resistant cell lines either had high baseline 24-hydroxylase levels and blunted fold change (SW1736 and 8505C) or just blunted response to VDR agonist (HTh7) (Fig. 6b). The data for each cell line are baseline, fold change after calcitriol, and fold change after DP006, respectively: TPC1 (0.7 ag/ng rRNA), 374-fold increase, 3582-fold increase; C643 (3.9 ag/ng rRNA), 275-fold increase, 312-fold increase; HTh74 (0.3 ag/ng rRNA), 2272-fold increase, 2618-fold increase; HTh7 (0.2 ag/ng rRNA), 17-fold increase, 5-fold increase; SW1736 (38.9 ag/ng rRNA), 32-fold increase, 66-fold increase; and 8505C (108 ag/ng rRNA), 8-fold increase, 4-fold increase.
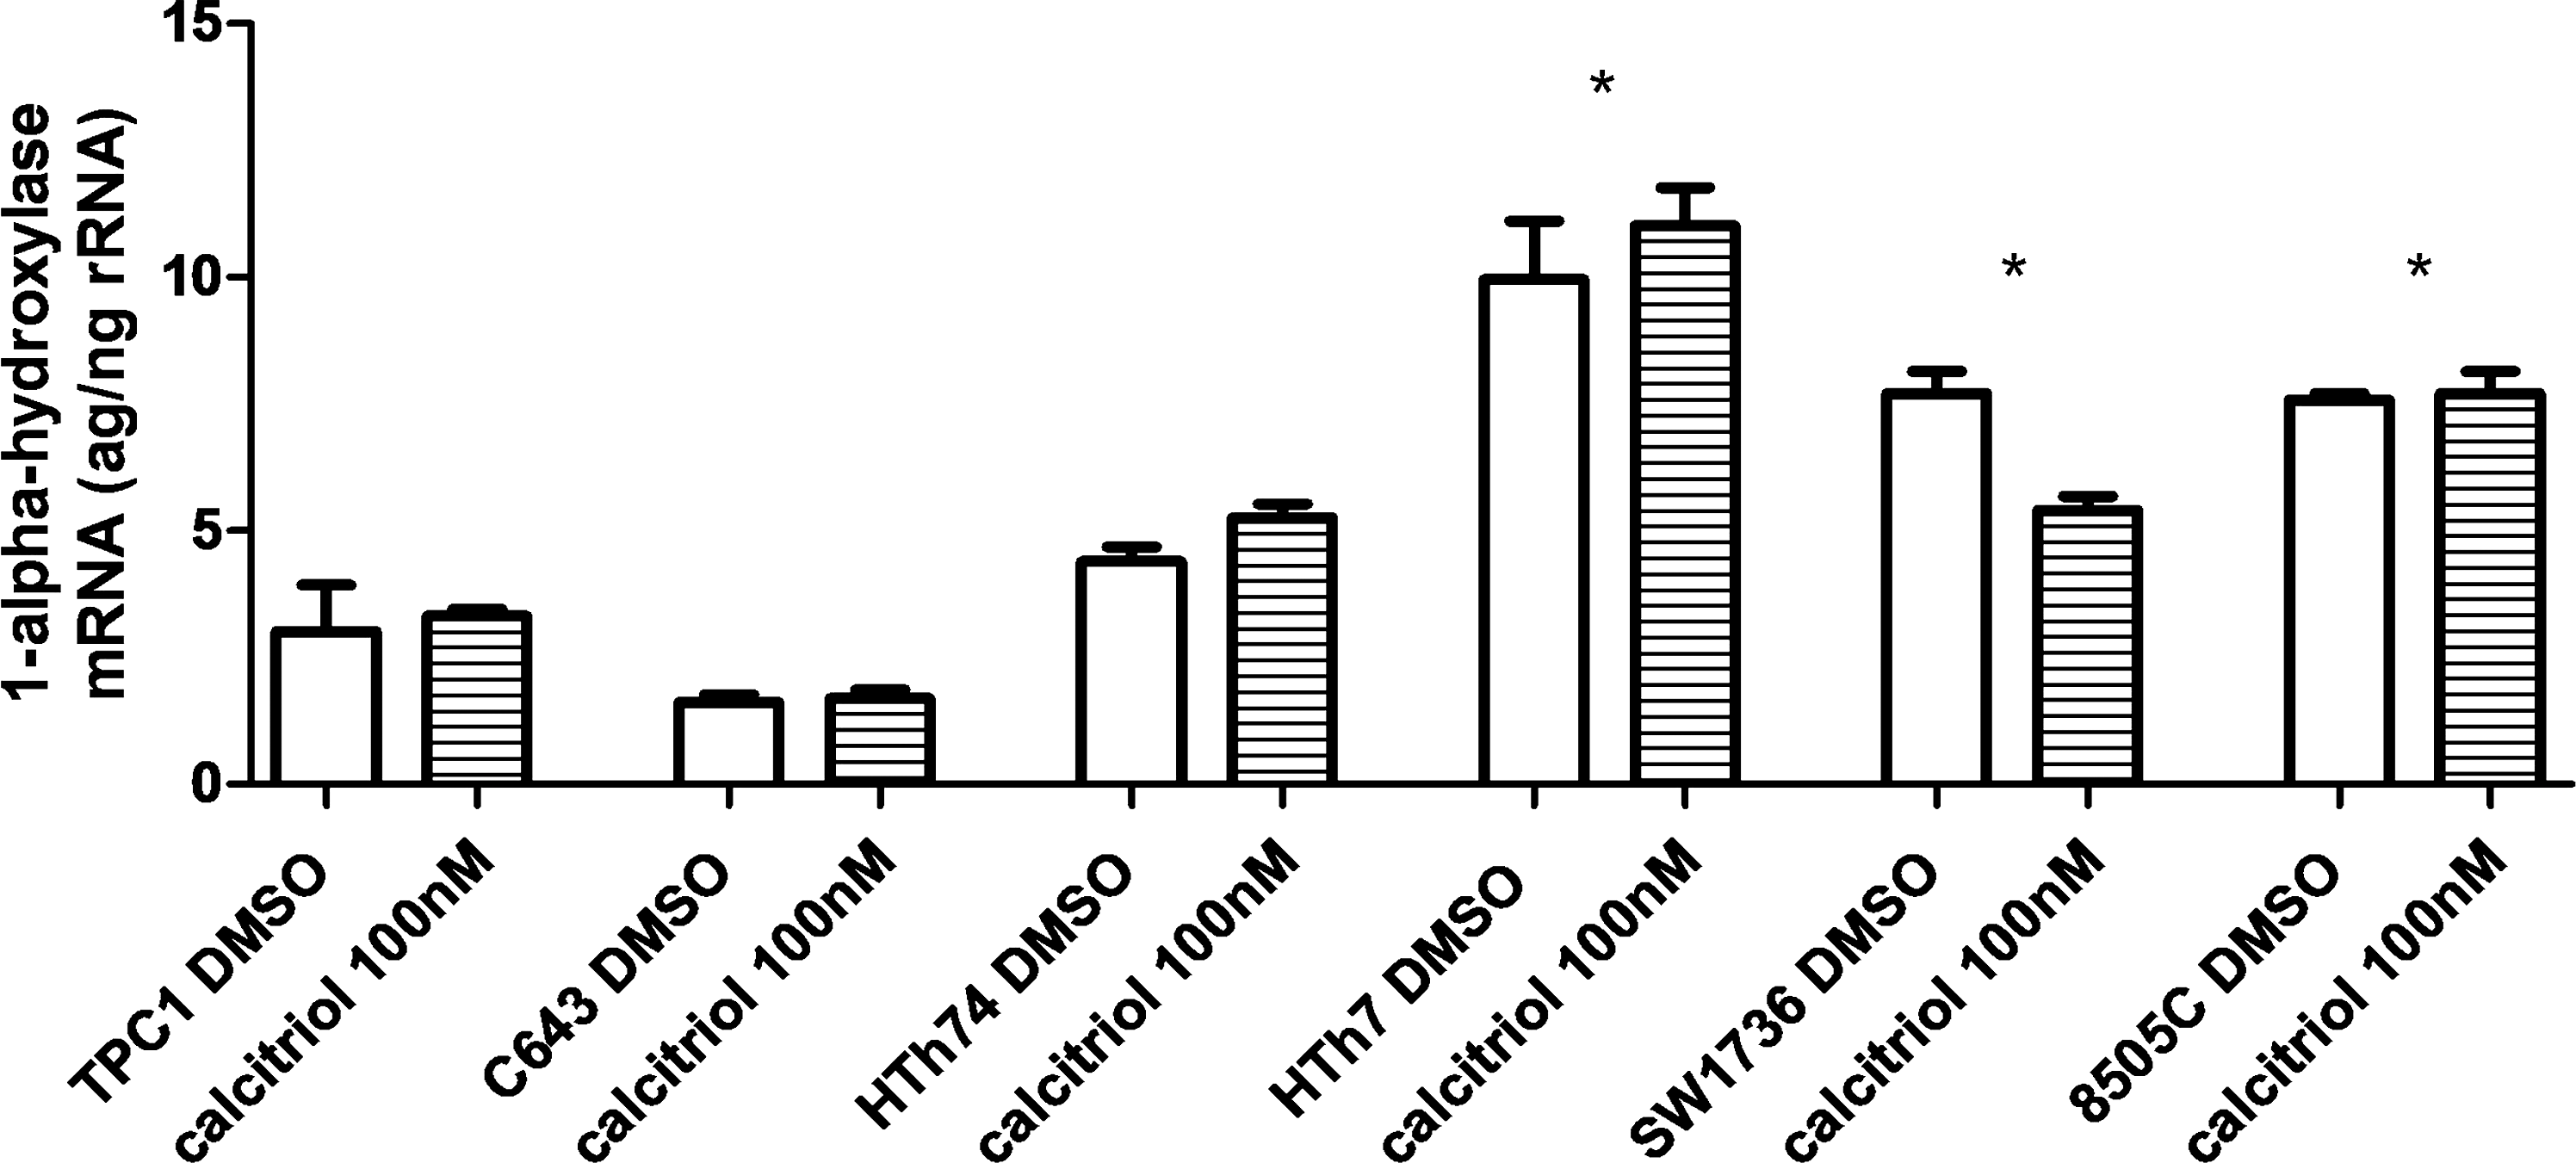
1-α-Hydroxylase mRNA expression is higher in resistant than in sensitive thyroid cancer cells. Total RNA was isolated from cells using the RNeasy Mini Kit (Qiagen) after 24-hour treatment with 100 nM calcitriol or volume equivalent vehicle. The mRNA for 1-α-hydroxylase (CYP27B1) was measured by real-time quantitative reverse transcription-polymerase chain reaction using ABI PRISM 7700 and the units are attograms/nanograms of ribosomal RNA (ag/ng rRNA). Error bars represent SD. *p < 0.05 compared to TPC1, C643, or HTh74.
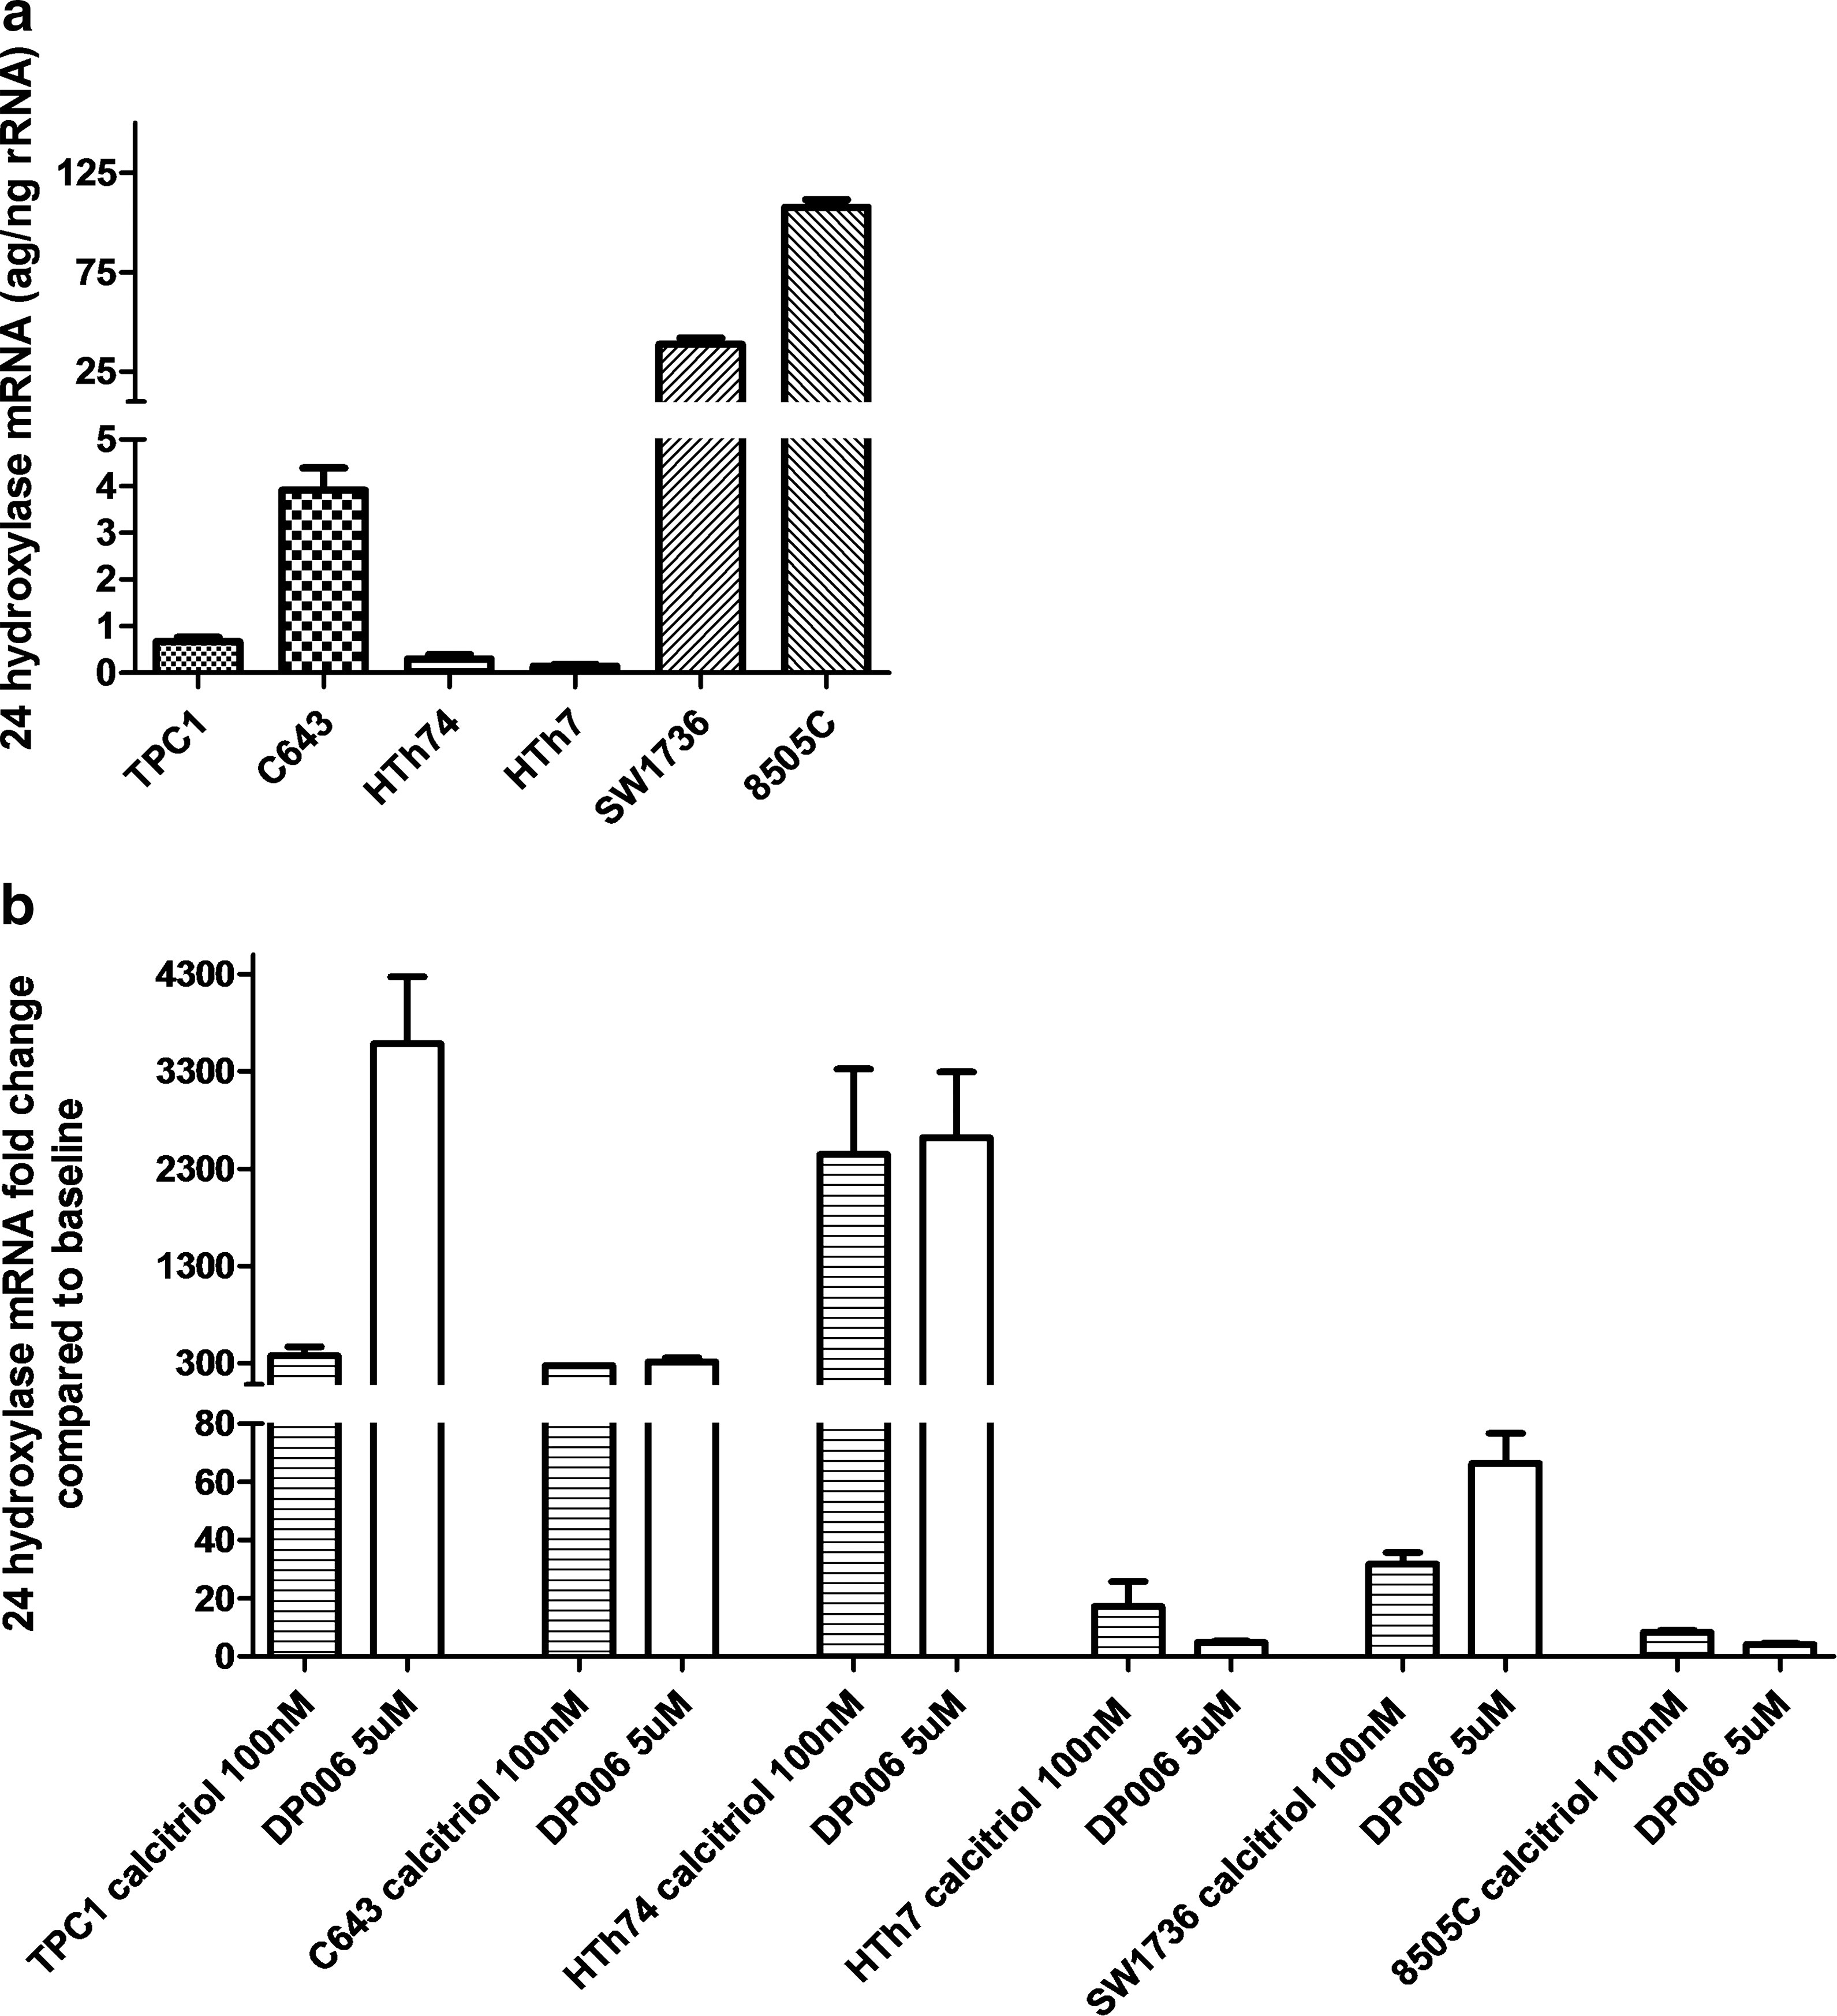
Baseline 24-hydroxylase mRNA levels are higher in resistant thyroid cancer cells and/or have less stimulation after calcitriol/DP006 treatment than in sensitive thyroid cancer cells. Total RNA was isolated from cells using the RNeasy Mini Kit (Qiagen) after 24-hour treatment with 100 nM calcitriol, 5 μM DP006, or volume equivalent vehicle. (
Discussion
In this report, we have described VDR expression in the largest panel of unique and authenticated thyroid cancer cells to date (10). We have shown that the presence of VDR protein is not necessarily sufficient for response to VDR agonist treatment as three cell lines in our panel have relative resistance to calcitriol/DP006 despite similar or higher levels of VDR compared to some sensitive thyroid cancer cells.
The thyroid expresses VDR and has the seventh highest level of 39 tissues studied as described by Mangelsdorf et al. in the Nuclear Receptor Signaling Atlas (14,15). There is inconsistent evidence that VDR dysregulation and polymorphisms are associated with thyroid dysfunction in terms of autoimmune thyroid disease with some groups indicating a correlation and others not (16 –18). We are only able to find two reports of VDR analysis in association with human thyroid carcinoma. Khadzkou et al. evaluated PTC specimens for VDR and 1-α-hydroxylase expression by RT-PCR and immunohistochemistry. 1-α-Hydroxylase converts 25(OH)D3 (the inactive storage and stable circulating form of VD) to 1,25(OH)2D3 (calcitriol, the more active VDR ligand binding form) to allow transcriptional activation of VDR. Thirty-five patients with PTC were evaluated and both primary tumors and matched normal tissue (adjacent to but not involved with PTC) as well as locoregional lymph node metastases were assessed. The majority of patients had exhibition of VDR and 1-α-hydroxylase in areas of PTC, but negative staining in normal thyroid epithelium. Quantitation of levels by qRT-PCR did not reveal differences for 1-α-hydroxylase levels in any tissue types. However, VDR levels by qRT-PCR were significantly lower in PTC lymph node metastases than in primary tumors or matched normal tissue (19). Importantly, this study did not assess VD levels in patients to see if there was a correlation with VD levels and tumor histology. Our analysis showed higher baseline 1-α-hydroxylase mRNA levels in resistant cell lines than in sensitive cell lines, suggesting that higher levels may be predictive of more aggressive tumors (though the absolute difference between groups of cell lines in our analysis was small). Additionally, there was no increase in response to calcitriol treatment, suggesting that this enzyme level may not be the best marker of thyroid cancer sensitivity to VDR activation.
A more recent study by Penna-Martinez et al. evaluated the presence of VDR gene polymorphisms in blood samples of patients with differentiated thyroid carcinoma (20). There was a positive correlation of the ff FokI polymorphism with follicular thyroid cancer but not PTC relative to the frequency found in healthy controls. This is consistent with other studies that demonstrate a positive correlation between the ff FokI polymorphism with breast and ovarian cancer risk (21,22). The FokI polymorphism occurs when there is a T-to-C substitution at the 5′ end of the coding region, creating an ATG start codon of the VDR, designated by f, at that allele and resulting in a longer VDR protein by three amino acids relative to the F allele without this polymorphism (23). However, the functional consequences of these polymorphisms are unclear as transfection experiments with either WT VDR or FokI variants of VDR in COS-7 cells did not show differences in transcriptional activity or binding of VD (24). However, other studies do show less transcriptional activity with the ff FokI polymorphism by either 24-hydroxylase or luciferase activity in response to calcitriol (25). On the balance, the literature would suggest that the ff FokI VDR variant has decreased transcriptional activity and a potentially small increased association with cancer in a variety of tissue types, especially those associated with VD status in epidemiological studies (26). One deficit of the recent study by Penna-Martinez et al. is that VDR sequencing in the thyroid tumor tissue was not performed (20). It is possible that there are somatic mutations that are more predictive of thyroid cancer as opposed to germ line mutations more likely assessed with blood sample. This is particularly relevant to our analysis, as our most responsive thyroid cancer cell line (TPC1) has the ff FokI VDR polymorphism, yet was the most sensitive in terms of decreased cell growth to VDR agonists. This finding may be indicative of tumor aggressiveness, as TPC1 is the only PTC in our panel, and in a study of aggressive prostate carcinoma, the ff FokI VDR polymorphism was associated with a lower percentage of tumors with grade 4/5 Gleason scores (27). Additionally, HTh7 and 8505C, the most resistant cell lines to VDR agonist therapy, have the FF FokI VDR genotype, yet had the least stimulation of 24-hydroxylase in response to calcitriol/DP006 regardless of the baseline 24-hydroxylase level. Therefore, our results suggest that the ff FokI polymorphism predicts either less aggressive cancer or greater response to VDR agonist treatment, which is a novel finding in thyroid cancer and may be a tissue-specific phenomenon.
Only two studies have evaluated 25(OH)D3 levels with the presence or absence of thyroid cancer. Penna-Martinez et al. saw no correlation of these levels with thyroid cancer patients compared to healthy controls but did find a lower mean 1,25(OH)2D3 level in thyroid cancer patients compared to healthy controls (20). Unfortunately, there is no description of calcium status, parathyroid, or renal function that would be important given the rapid and dynamic regulation of 1,25(OH)2D3 levels. A more recent study by Laney et al. evaluated 25(OH)D3 levels in patients with benign versus cancerous nodules as well as patients with a known history of thyroid cancer that was either active or in remission (28). The investigators took the important step of evaluating the VD levels across cancer stage as well among thyroid cancer patients. There was no significant difference in the rate of VD deficiency between any of the groups. The study may not have had the power to detect these differences across stages I–IV of thyroid cancer. Additionally, thyroid cancer stage is dramatically affected by age and there is no analysis of individual tumor size, local invasion, or lymph node involvement.
VDR activity can be modulated by regulatory enzymes that control VD metabolism to active and inactive forms (29,30). 24-Hydroxylase is highly regulated by VDR activation and is often used as a read out for VDR functional status. 24-Hydroxylase feeds back to initiate a metabolism cascade that inactivates 1,25(OH)2D3 and converts it to the inactive calcitroic acid (24,25(OH)2D3) (30). However, 24-hydroxylase may play a larger role in cancer risk or cancer progression. Possible mechanisms of resistance to VDR activation include decreased intracellular concentration of 1,25(OH)2D3 by either downregulation of the 1-α-hydroxylase or upregulation of the catabolic 24-hydroxylase (31). In a study of candidate oncoproteins in breast cancer, 24-hydroxylase was found to have high copy number (32). Our own study shows a much higher level of 24-hydroxylase baseline expression in the relatively resistant SW1736 and 8505C thyroid cancer cells, suggesting that there may be less active 1,25(OH)2D3 available for VDR binding and activation.
We are only able to find one case report in the PubMed-referenced literature assessing VD as therapy for thyroid cancer. A 2005 case report demonstrated both anatomic and biochemical stabilization of a very large, locally aggressive PTC for which surgical resection was not possible with high doses of vitamin DR3R for 2 years (33). Alhough anecdotal, this report does support our findings that calcitriol therapy appears mainly cytostatic as evidenced by an increase in G1 and decrease in S phase in our most responsive cell line. These data recapitulate that seen in TPC1 in a previous study for VD therapy in thyroid cancer (34). Those investigators also did not find a significant apoptotic response to VD therapy in TPC1. A possible explanation for the lack of cell cycle arrest seen in C643 is that this cell line harbors a mutant p53, where a WT p53 gene has been reported as necessary for cell cycle arrest in response to calcitriol therapy in a prostate cancer cell model (35,36).
In summary, thyroid cancer differentially expresses the VDR, but a high relative level of the VDR does not necessarily predict response to VD therapy. Potential markers of resistance to VD therapy in VDR-expressing cell lines include the presence of the FF FokI VDR polymorphism (in contrast to the balance of the literature suggesting the ff FokI VDR polymorphism is more often associated with cancer) and constitutive 24-hydroxylase expression, which may also be a mechanism of resistance by cleaving active ligand before VDR binding and activation. The dominant mechanism for decreased viable cell count in response to VDR agonist in sensitive thyroid cancer cells is unclear, though cell cycle arrest and/or senescence are more likely mechanisms than apoptosis. In conclusion, VDR targeting in poorly differentiated thyroid cancer represents a novel treatment strategy, but a personalized approach based on markers of sensitivity, such as low 24-hydroxylase levels or the FF FokI VDR sequence, or resistance, such as high 24-hydroxylase levels or the ff FokI polymorphism, will likely help optimize this form of therapy.
Footnotes
Acknowledgments
This work was supported by an American Cancer Society Grant: MRSG-06-193-01-TBE. Support of the University of Colorado Cancer Center DNA Sequencing & Analysis Core, Flow Cytometry Core, and PCR Gene Expression core was critical for completion of these studies. The core services are supported by an NIH Cancer Center Support Grant: P30 CA046934. The project described was supported in part by award number R25GM083333 (Zachary Crces-Initiative for Maximizing Student Diversity) from the National Institute of General Medical Sciences. The content is solely the responsibility of the authors and does not necessarily represent the official views of the National Institutes of Health.
Disclosure Statement
The authors declare that they have no disclosures.