
Abstract
Background:
Suppressive or replacement doses of levothyroxine (LT4) are affected by the rate and extent of the active ingredient absorbed, as well as by the lean body mass. Obesity has reached epidemic proportions worldwide and is related with many comorbidities. The aim of this study was to determine the pharmacokinetic parameters of LT4 in severely obese individuals and compared them with similar data in lean control subjects.
Methods:
We studied 62 euthyroid subjects who had negative tests for anti-thyroid peroxidise antibodies (Ab-TPO). Thirty eight of these subjects were severely obese but otherwise healthy (severe obese subjects [SOS] group). Twenty-four were healthy control subjects (control group), with a body mass index of 23.3 ± 1.7 kg/m2. Subjects received 600 μg oral sodium LT4 after an overnight fast. Serum triiodothyronine (T3), T4, and thyroid-stimulating hormone were measured at baseline. Serum T4 and T3 was measured 0.5, 1, 1.5, 2, 2.5, 3, and 4 hours after LT4 administration.
Results:
Baseline serum T4 and thyroid-stimulating hormone concentrations were higher in the SOS group than in the control group; serum T3 was similar in the two groups. The corrected area under the curve and the maximum T4 concentration after LT4 administration were lower, whereas the time to maximum concentration from the baseline was higher in SOS than in the control group. The estimated plasma volume was higher in the SOS than in the control group. Mean serum T3 levels increased gradually during the four hours after LT4 administration in the control group. In contrast, they decreased gradually in the SOS group.
Conclusions:
Severely obese individuals may need higher LT4 suppressive or replacement doses than normal-weight individuals due, among other factors, to impaired LT4 pharmacokinetic parameters. The latter could be attributed to their higher plasma volume and/or to delayed gastrointestinal LT4 absorption. T4 conversion to T3 might be defective in severe obesity.
Introduction
Levothyroxine (LT4) is a synthetic form of T4 that is used to treat hypothyroidism and differentiated thyroid cancer. Oral doses of LT4 are absorbed mainly by the intestinal mucosa of the upper jejunum and ileum (5) within the first 3 hours of ingestion (6). This absorption is affected by a number of gastrointestinal disorders (6,7), by other medications (8), and by concurrent food consumption (9). There are also a range of individual differences in the rate of absorption, as well as in the metabolism and bioavailability of LT4 (10), or defects in the commercial preparation of LT4 (11), that can have significant clinical consequences.
Obese patients require higher replacement and suppressive LT4 dosages, which is due in the main to their higher lean body mass as well as their increased total fat mass (12). However, to our knowledge, there are no reports in the literature regarding LT4 pharmacokinetic parameters in obese patients. Our aim was to study the LT4 pharmacokinetics in severe obese subjects (SOS). For this purpose, we selected a cohort of patients with severe obesity to determine what, if any, pharmacokinetic differences there were regarding LT4.
Materials and Methods
Patients
We selected 62 subjects. The study group consisted of 38 patients with severe obesity (SOS), and included 16 men and 22 women. The mean (±standard deviation [SD]) age of this cohort was 34.4 ± 9.8 years, the body mass index (BMI) of each individual was ≥40 kg/m2, and their mean (±SD) BMI was 48.6 ± 8.3 kg/m2. The control group was matched for gender and age and comprised 24 volunteers (12 men and 12 women) whose mean (±SD) age was 35.4 ± 6.7 years with a mean (±SD) BMI of 23.3 ± 1.7 kg/m2.
At the initial screening visit to the clinic, both groups had normal levels of thyroid-stimulating hormone (TSH), thyroid hormones, and thyroid autoantibodies (Ab-TPO). None of the participants in the study had a history of thyroid disease or other comorbidities, or were taking any medication. They all had negative serological antibody titers for Helicobacter pylori. All the women were tested for pregnancy before the start of the study; all the results were negative. Informed written consent was obtained, and the study protocol was approved by the Ethics Committee of the University Hospital of Patras, Greece.
Study design
All participants attended our endocrine unit between 0800 and 0900 after fasting for 12 hours overnight. They then underwent an LT4 absorption test. The oral solution was prepared by diluting sodium LT4 powder (Faran Company, Athens, Greece) with absolute alcohol 95% and watered to a final concentration of 600 μg of LT4 per 240 mL. The test was performed as follows: blood samples were collected at 0.5 and 0.25 hours before the administration of the oral solution of 600 μg of LT4. Further blood samples were collected at the time of the dose and 0.5, 1, 1.5, 2, 2.5, 3, and 4 hours after the dose. No food other than water was allowed during the sample collection. Baseline values were taken as the mean of the values obtained at the −0.5, −0.25, and 0 time points. Blood samples were centrifuged immediately and stored at −20°C until they were assayed for the levels of T4, triiodothyronine (T3), and TSH. All patients tolerated the administration of the 600 μg LT4 solution well.
Moreover, we estimated plasma volume (PV) in both groups, as follows. First, we calculated blood volume index (inBV) according to a recently suggested formula inBV = 70/√BMIp/22 (13). Then, we multiplied inBV with the body weight to find out the total blood volume. Thereafter, assuming that SOS and controls had an average hematocrit of 40%, we estimated the PV taking into consideration that PV corresponds to 60% of total blood volume.
Assays
Serum thyroid hormones and TSH were measured by chemiluminescence immunoassays (E170 Module for Modular Analytics; Roche diagnostics GmbH, Mannheim, Germany). The samples were assayed in a single large batch. The intra-run and inter-run coefficient of variance values were 1.5%–3.1% and 1.3%–1.7% for T3, 1.1%–3.0% and 3.7%–4.5% for T4, and 3.4%–4.2% and 3.3%–7.2% for TSH, respectively. The values of the lower detection limits were 19.5 ng/dL for T3, 0.42 μg/dL for T4, and 0.005 μU/mL for TSH.
Statistics
All values are expressed as the mean ± SD. Statistical significance was set at a p-value of <0.05. The area under the curve (AUC) from the baseline to four hours, peak T4 concentration (Cmax), and time to peak concentration (Tmax) were estimated to evaluate the extent and the rate of absorption of LT4. The AUC was calculated using the trapezoid rule. The mean values were compared by independent sample t-tests. There are 3 methods for correction AUC and Cmax to avoid the misinterpretation of LT4 values due to endogenous T4. In method 1, it is assumed that there is no suppression of endogenous T4 and TSH release and that the endogenous production of T4 remains constant throughout the sampling period following a large exogenous dose of LT4. In method 2 it is assumed that the endogenous production of T4 is suppressed completely. In method 3 it is assumed that there is no suppression of endogenous T4, but it takes into account the diurnal variation of T4 levels. The three mathematical correction methods yield similar results regarding the key bioequivalence parameters of AUC, Cmax, and Tmax (14). We used method 1, and the corrected AUC and Cmax were evaluated as follows: for each subject and period, the mean of the three T4 values at −0.5, −0.25, and 0 hours before dosing was subtracted from each concentration after dosing (15).
A repeated-measures analysis of variance (ANOVA) was performed to compare the mean differences in hormone levels before and after administration of the oral solution. Data were analyzed using SPSS Version 17 (SPSS, Inc., Chicago, IL).
Results
The mean serum baseline values of T4 and TSH were higher in the SOS group than in the controls (T4: 8.66 ± 1.29 vs. 7.53 ± 1.26 μg/dL, p < 0.001; TSH: 2.27 ± 0.97 vs. 1.25 ± 0.94 μIU/mL, p < 0.001), whereas the mean baseline concentration of T3 was similar between the groups (T3: 137 ± 16 vs. 133 ± 19 ng/dL, ns) (Table 1).
BMI, body mass index; TSH, thyroid-stimulating hormone; T3, triiodothyronine; T4, thyroxine; SD, standard deviation.
The AUC and Cmax of the mean concentration of T4 were similar in the two groups (AUC: 49.26 ± 9.31 vs. 49.23 ± 8.61 μg.h/dL, ns; Cmax: 13.80 ± 2.86 vs. 13.97 ± 2.56 μg/dL, ns), whereas the Tmax was higher in the SOS group than in the control group (Tmax: 2.49 ± 0.86 vs. 1.85 ± 0.79 hours, p < 0.01; Fig. 1). However the corrected AUC and Cmax were lower in the SOS group than in the control group (AUC: 13.47 ± 7.35 vs. 19.07 ± 5.44 μg.h/dL, p < 0.01; Cmax: 5.13 ± 2.29 vs. 6.43 ± 1.78 μg/dL, p < 0.05).
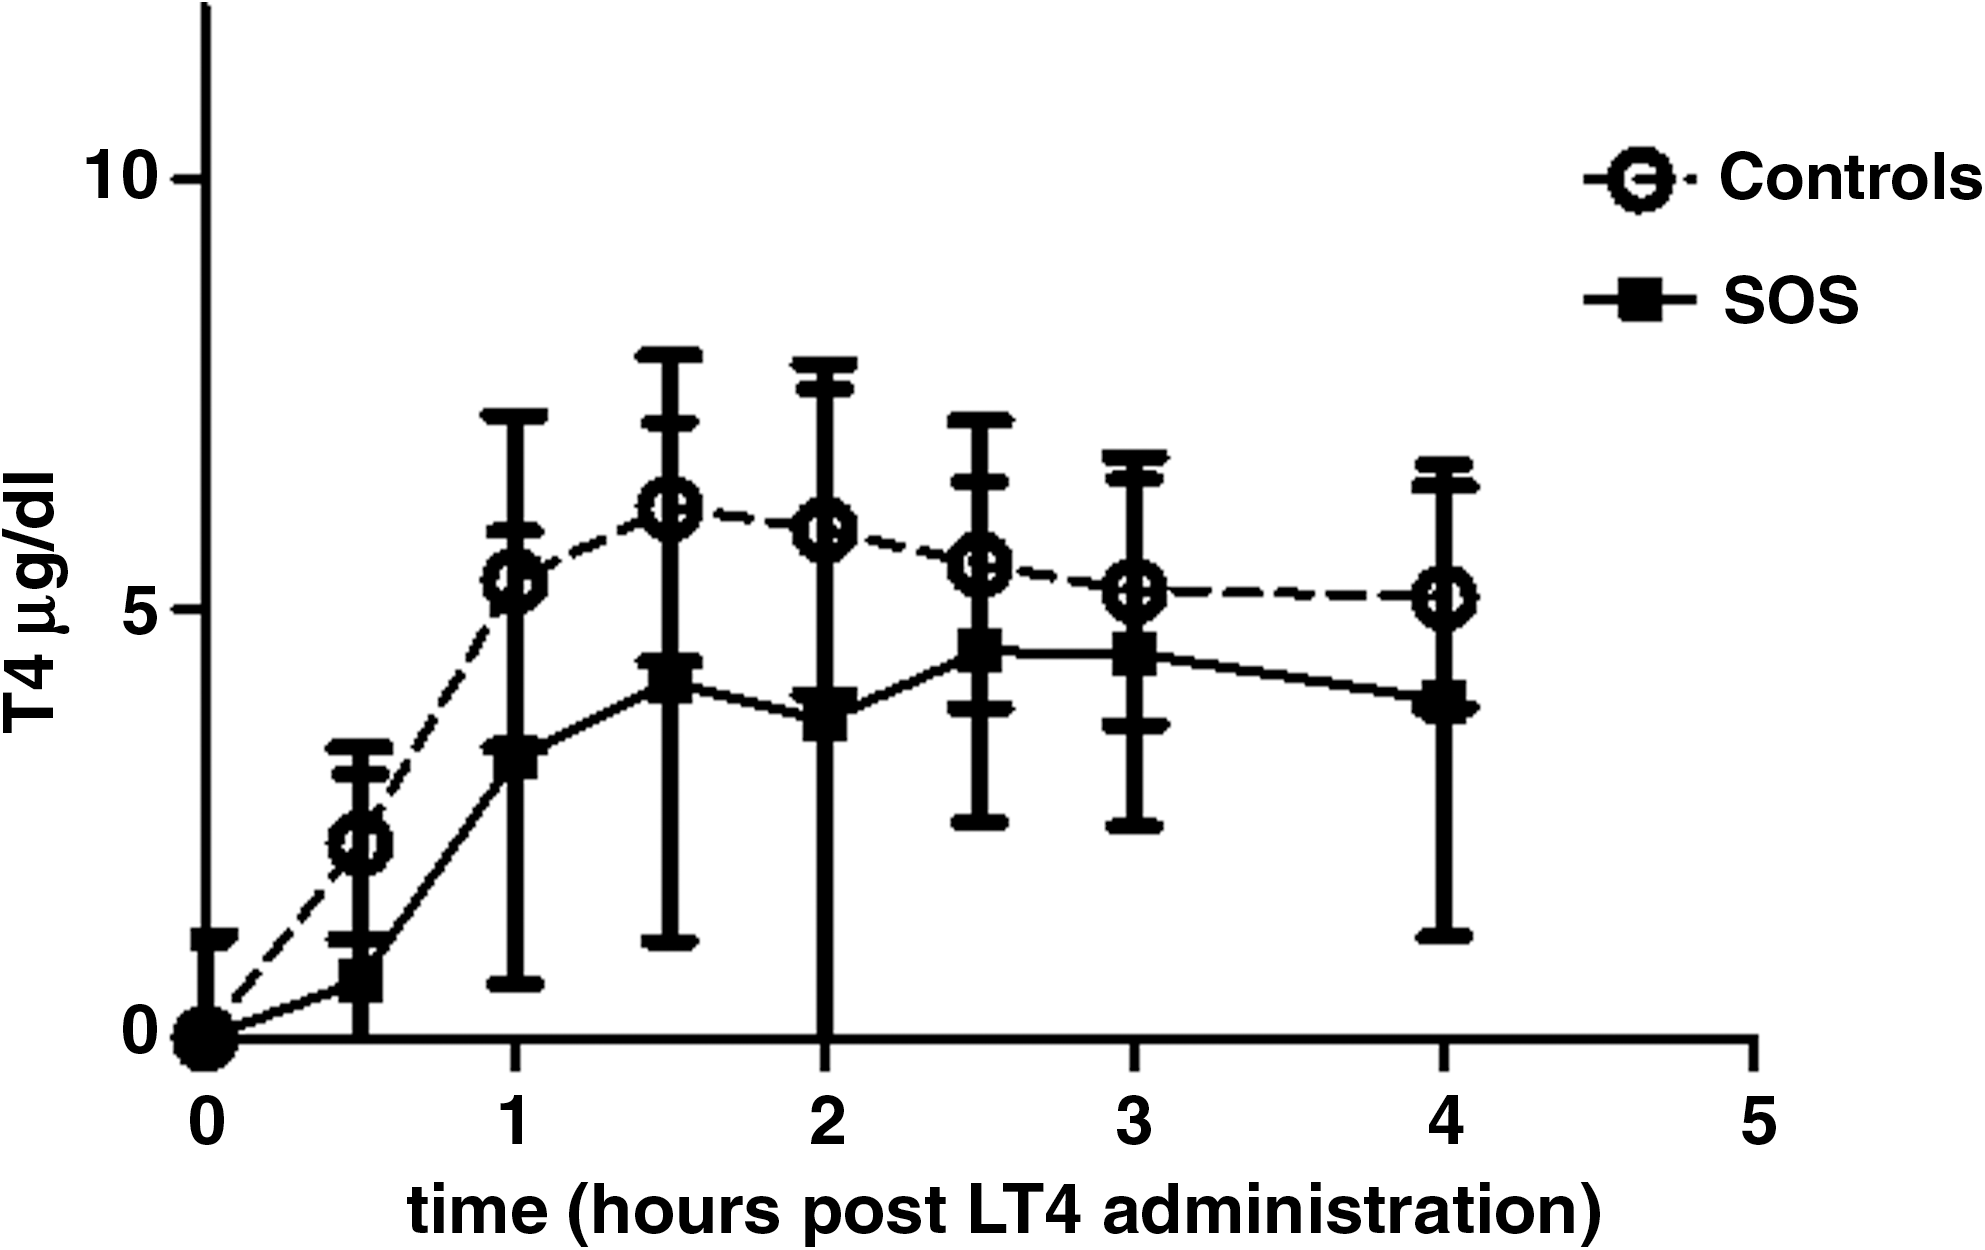
Corrected mean serum T4 concentrations postadministration of oral solution 600 μg LT4 in severe obese subjects (SOS) and in normoweight healthy controls. LT4, levothyroxine.
PV was higher in SOS than in controls (3688.8 ± 345.7 vs. 2590.1 ± 271.4 mL, p < 0.001).
In the SOS group, the mean concentration of T3 after the administration of the solution of LT4 declined gradually (ANOVA for repeated measures: F < 14.39, p < 0.001). Post hoc analysis showed that the lowest value was achieved at 2 hours after the administration of the LT4 solution (137 ± 16 [baseline T3 level] vs. 128 ± 14 ng/dL [T3 level at 2 hours], p < 0.001). In contrast, in the control group, the mean concentration of T3 after the administration of LT4 increased gradually (ANOVA for repeated measures: F < 19.370, p < 0.001). Post hoc analysis showed that the highest level was achieved at 2 hours after the administration of LT4 (133 ± 19 [baseline T3 level] vs. 155 ± 21 ng/dL [T3 level at 2 hours], p < 0.001). The AUC of the mean concentrations of T3 was lower in the SOS group than in the control group (AUC: 521 ± 60 vs. 597 ± 80 ng.h/dL, p < 0.001; Fig. 2).
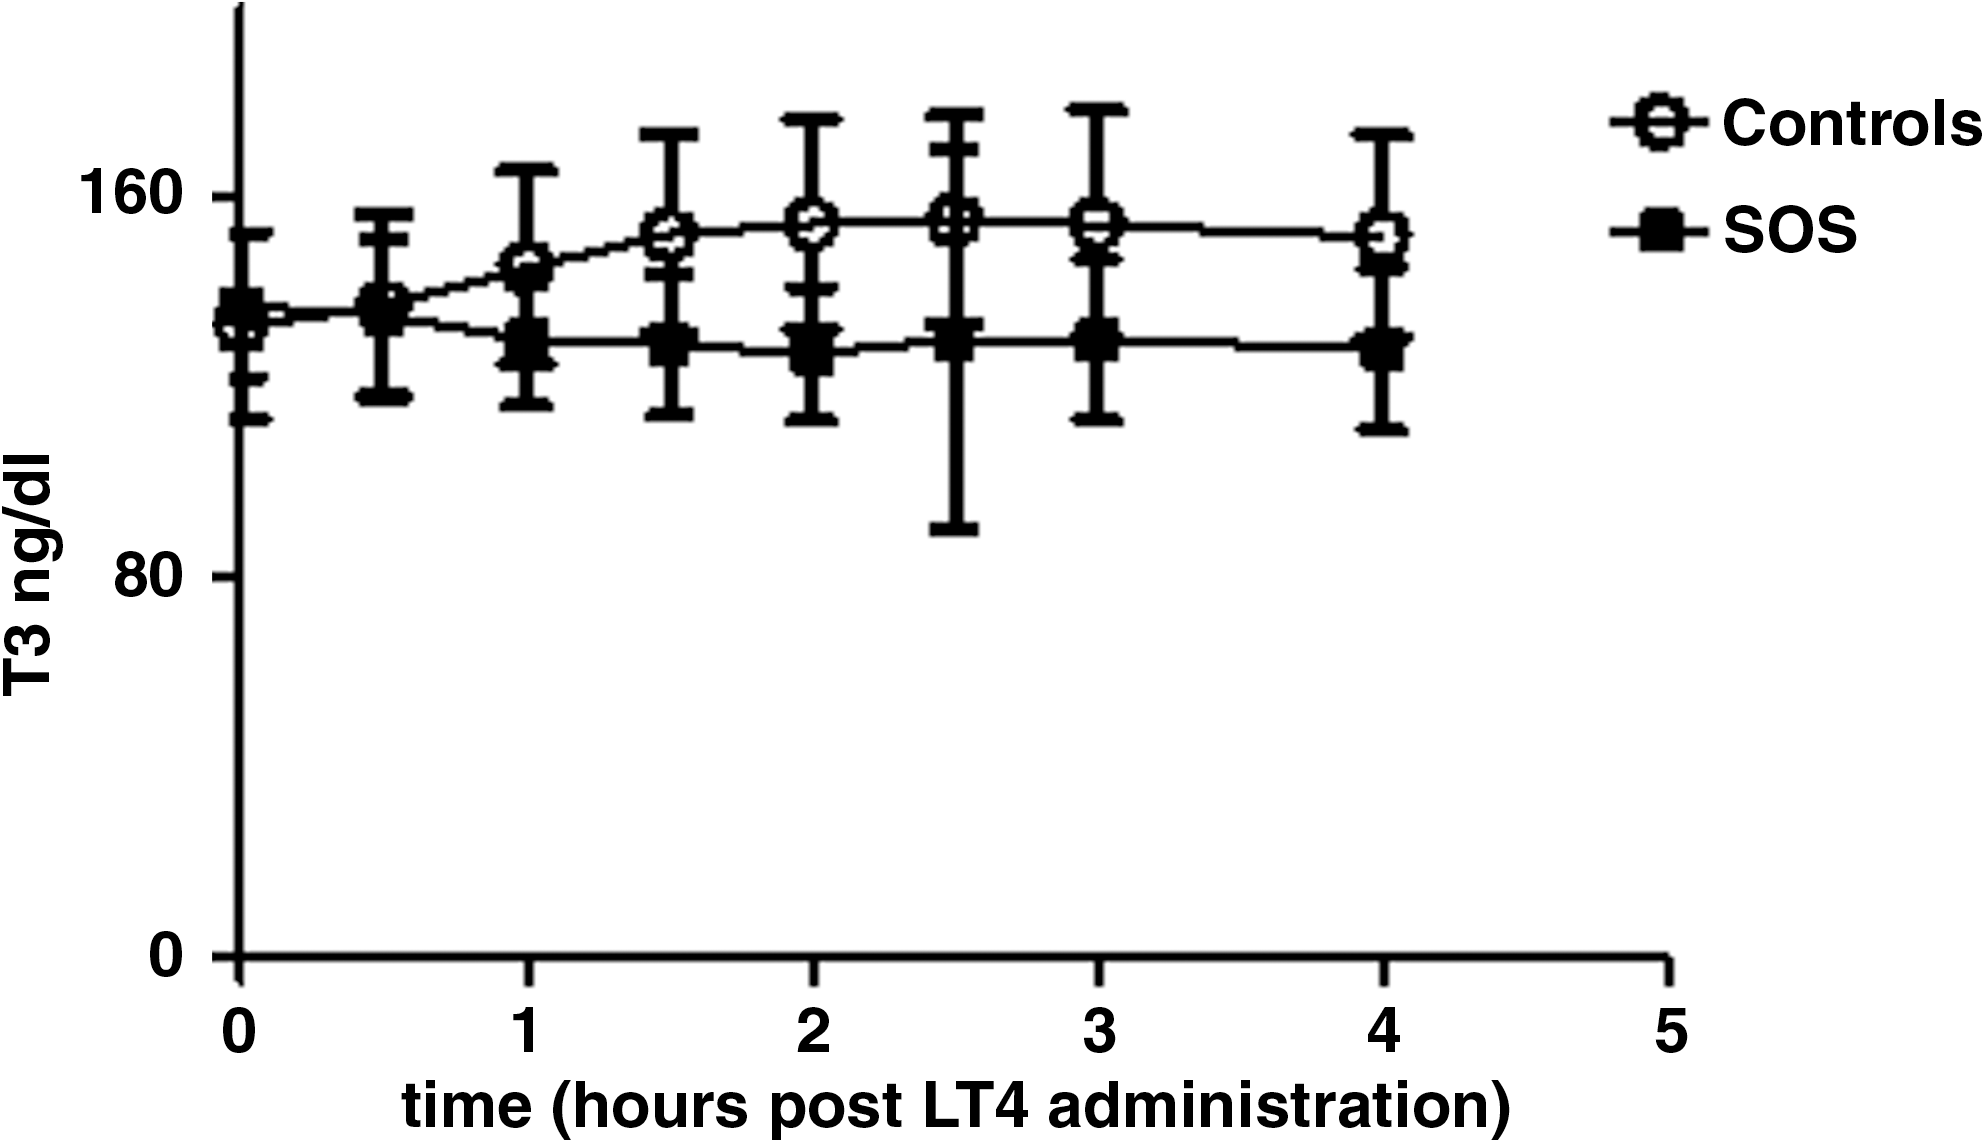
Mean serum T3 concentrations postadministration of oral solution 600 μg LT4 in severe obese subjects (SOS) and in normoweight healthy controls. T3, triiodothyronine.
Discussion
The increment of serum T4 concentration was lower during the first 4 hours after the administration of LT4 in the subjects with severe obesity than in the subjects in the control group.
We examined the pharmacokinetic parameters of LT4 using one of the three suggested methods for correction from endogenous T4 production. T4 is an endogenously produced hormone that is secreted continuously by the thyroid gland. It cannot be distinguished biochemically and physiologically from the exogenously administered synthetic compound LT4 sodium (16). The corrected AUC and Cmax of the mean concentration of T4 were lower and the Tmax was higher in the SOS group than in the control group.
In contrast, uncorrected AUC and Cmax (which means that no adjustments were made for endogenous T4, which appeared to be higher in obese subjects) did not reveal any differences between groups. It has often been argued that the current regulatory methodology bioequivalence suggested by the FDA (uncorrected method) is not sufficiently sensitive to detect potentially clinically significant differences in the bioavailability of LT4 products (15).
In our study the pharmacokinetic parameters were estimated without fitting a compartment model and the fixed administered LT4 dose was not adjusted in SOS subjects, as almost in all pharmacokinetic studies in the literature. The AUC and Cmax represents in part the extent and the Tmax the rate of absorption of LT4 (17). The observed corrected lower AUC and Cmax in SOS group might be in part due to higher PV of the SOS. In normals, total T4 distribution is directly related to plasma T4 volume, and there is no evidence to the contrary in the obese (18). Therefore, PV can be used as a proxy for total bioavailability of the T4 administered. As far as we know, there are no studies but one (19) in the literature reporting changes of T4 distribution volume according to body weight. In this study no difference in T4 distribution volume was found after weight gain of ∼5 kg followed a period of short period overfeeding (3 weeks). The same authors reported that long-term overfeeding (7 months) resulted in no changes in serum T4 despite the weight gain of ∼15 kg. Unfortunately, no kinetic studies of T4 were done in these subjects.
Since LT4 was administered orally and not intravenously, the decreased AUC and Cmax as well as the delayed Tmax in SOS could be also attributed to delayed gastrointestinal absorption. Changes from normal patterns in gastrointestinal motility and intestinal transit in obese patients are not uncommon. Obese patients have accelerated gastric emptying as well as disturbances in small bowel motility, although the clinical significance of these is not fully understood (4). The above speculation needs more studies to be clarified.
The serum baseline values of T4 and TSH were higher in the SOS group, whereas serum T3 concentration was similar in both groups. It is known that serum TSH is increased in subjects with severe obesity but remains in the normal range (20), whereas the data for the thyroid hormones are conflicting (21).
An interesting finding of our study was that the concentration of serum T3 decreased after the administration of LT4 to subjects in the SOS group, whereas in subjects in the control group the level of serum T3 increased as expected. The serum T3 values in SOS seem to follow the diurnal variation of T3 in the morning (22), independently of LT4 administration. The explanation for this finding is not clear. One possible explanation is that a defective type I deiodinase (DIO1) is present. In Zucker fatty (fa/fa) rats, a kinetic study showed that T3 synthesis was impaired in tissues that contained type I 5′-deiodinase, despite an adequate availability of T4 (23). However, in a recent report, liver biopsies from 13 subjects with severe obesity showed unchanged expression and activity of DIO1 when compared to lean controls (24). However, given that these results are based on in vitro studies, we cannot exclude the possibility that the DIO1 functions in a different way in vivo. An alternative explanation could be an impairment of monocarboxylate transporter 8, which is a specific transporter of thyroid hormone into cells (25). Further studies are needed to confirm and explain this finding.
LT4 is used widely, but it has a narrow therapeutic window, which means that its use can have adverse effects if the treatment dose is only slightly too high or too low. Safe and effective use of LT4 requires dosage titration and monitoring of patients. It is known that subclinical thyroid abnormalities, either hypo or hyper, have adverse effects on the cardiovascular and myoskeletical system and the quality of life (26,27). The requirements of individuals for LT4 are determined by (i) the rate and the extent to which the active ingredient of the drug becomes available to the cells that produce TSH within the pituitary, to suppress or normalize the secretion of TSH, and (ii) lean body mass over the total body weight, particularly in subjects with high BMI values, such as athletes or obese individuals (12).
Severe obesity is considered to be a chronic disease and is a recognized risk factor for many comorbidities. The intestinal absorption of LT4 is affected by gastrointestinal disorders, such as gastritis that is related to Helicobacter pylori infection, celiac disease, and the ingestion of drugs and dietary fiber (6 –9). Given our results, severe obesity should be added to the list of diseases that contribute to the altered absorption of LT4.
In conclusion, severely obese individuals probably need higher LT4 suppressive or replacement doses (12) than normal-weight individuals probably due, among other factors, to impaired LT4 pharmacokinetic parameters. The latter could be attributed to their higher PV and/or to delayed gastrointestinal LT4 absorption. This is a new additional parameter to consider when LT4 is prescribed. T4 conversion to T3 might be defective in severe obesity.
Footnotes
Disclosure Statement
The authors declare that they have nothing to disclose.