
Abstract
Background:
The importance of restricting iodine intake to increase thyroid uptake of 131I is well-known, but its minimum duration is not clear. The present study aimed at determining whether 3 weeks is superior to 2 weeks for a low-iodine diet (LID) as a means of increasing the thyroid uptake of 131I and reducing urinary iodine. A second goal was to evaluate the effectiveness of a questionnaire about ingestion and exposure to iodine to predict individuals in whom the LID would be less effective.
Methods:
Forty-six outpatients who came to the Nuclear Medicine Unit of Santa Casa de Porto Alegre, Brazil, for thyroid evaluation, were randomized to receive an LID for 2 or 3 weeks. Questionnaires regarding their exposure to iodine, the thyroid uptake of 131I, and the iodine and iodine/creatinine ratio in urine samples were administered or obtained at the beginning and end of the diet.
Results:
The questionnaire indicated exposure to exogenous iodine in five patients during their LID, all in the 3-week group. Their thyroid 131I uptake was significantly lower than patients who did not give a history of iodine exposure (p = 0.016). The comparative analysis between the 2-week and 3-week diet groups was then performed excluding the five contaminated patients. The 131I uptake increased by 43% in the 2-week group and 26.7% in the 3-week group (p = 0.105). Both diets for 2 and 3 weeks caused significant decrease in urinary iodine (p < 0.001), without a difference between the groups (63.2% in the 2-week group and 60.9% in the 3-week group, p = 0.955). There was no difference in the percentage of patients with urinary iodine ≤100 μg/L (p = 0.25) and urinary iodine ≤50 μg/L (p = 0.86) between the groups. A correlation between urinary iodine and iodine/creatinine ratio (r = 0.516; p < 0.001) was observed.
Conclusion:
Two weeks of an LID are probably sufficient to augment thyroid uptake of 131I, with little or no benefit from longer periods of an LID. Questionnaires regarding exposure to iodine similar to those employed here should identify individuals in whom the LID has not been as effective in increasing the thyroid uptake of 131I.
Introduction
It is not well defined in the literature as to how long patients should follow an iodine restricted diet to optimize RAI-U in benign and malignant thyroid tissue. One retrospective study indicated that an iodine restricted diet was superior to a conventional diet for patients who have been thyroidectomized (7), which was contradictory to another retrospective study showing no difference in RAI-U in iodine restricted and conventional diets (8). Two other studies, one prospective (2) and one retrospective (9), showed the superiority of a 2-week LID when compared with a 1-week LID. Current guidelines advise an LID period of 2 weeks (10) or 1 to 2 weeks (11). To our knowledge, no studies evaluating longer diet periods, which might be more efficacious, have been published, and there is a lack of randomized prospective studies of the relationship between the duration of iodine restricted diets and their effects on the RAI-U in patients who have not been thyroidectomized.
The present study was designed to compare the effects of 2 and 3 week LID2 and LID3, respectively and low iodine exposure on urinary iodine concentration (UIC) and RAI-U in patients who had not undergone thyroidectomy. In addition, we evaluated the use of a questionnaire on exposure to iodine to determine whether it would identify patients in whom attempts to restrict iodine exposure were not satisfactory.
Materials and Methods
The primary outcome measurement of this study was the urinary iodine/creatinine ratio (UICr). Secondary outcomes were the RAI-U and the findings of a questionnaire regarding intake and exposure to iodine.
Patients
Participants, aged 23 to 78 years, were recruited from the Nuclear Medicine Department of Complexo Hospitalar Santa Casa in Porto Alegre, Brazil (Table 1), from October 2007 to December 2008. They were referred for thyroid scintigraphy due to subnormal thyrotropin (TSH) (13/21 [61.9%] in the LID2 group and 15/25 [60%] in the LID3 group) or for evaluation of thyroid nodules or goiter. Participation was voluntary, and written consent was obtained. To detect a difference of 95 μg/gCr in the means of UICr, with a power of 0.8 and α = 0.05, two sided, the calculated sample size for each study group was 20 patients, as calculated using Epi Info 6.EXE® (Centers for Disease Control and Prevention, Atlanta, GA). To compensate for possible loss of patients during the study, a total of 50 subjects were enrolled. They were selected from 490 patients who came to the Nuclear Medicine Unit for thyroid exams. A flow diagram (Fig. 1) shows the study design as well as losses and exclusions after randomizations together with reasons.
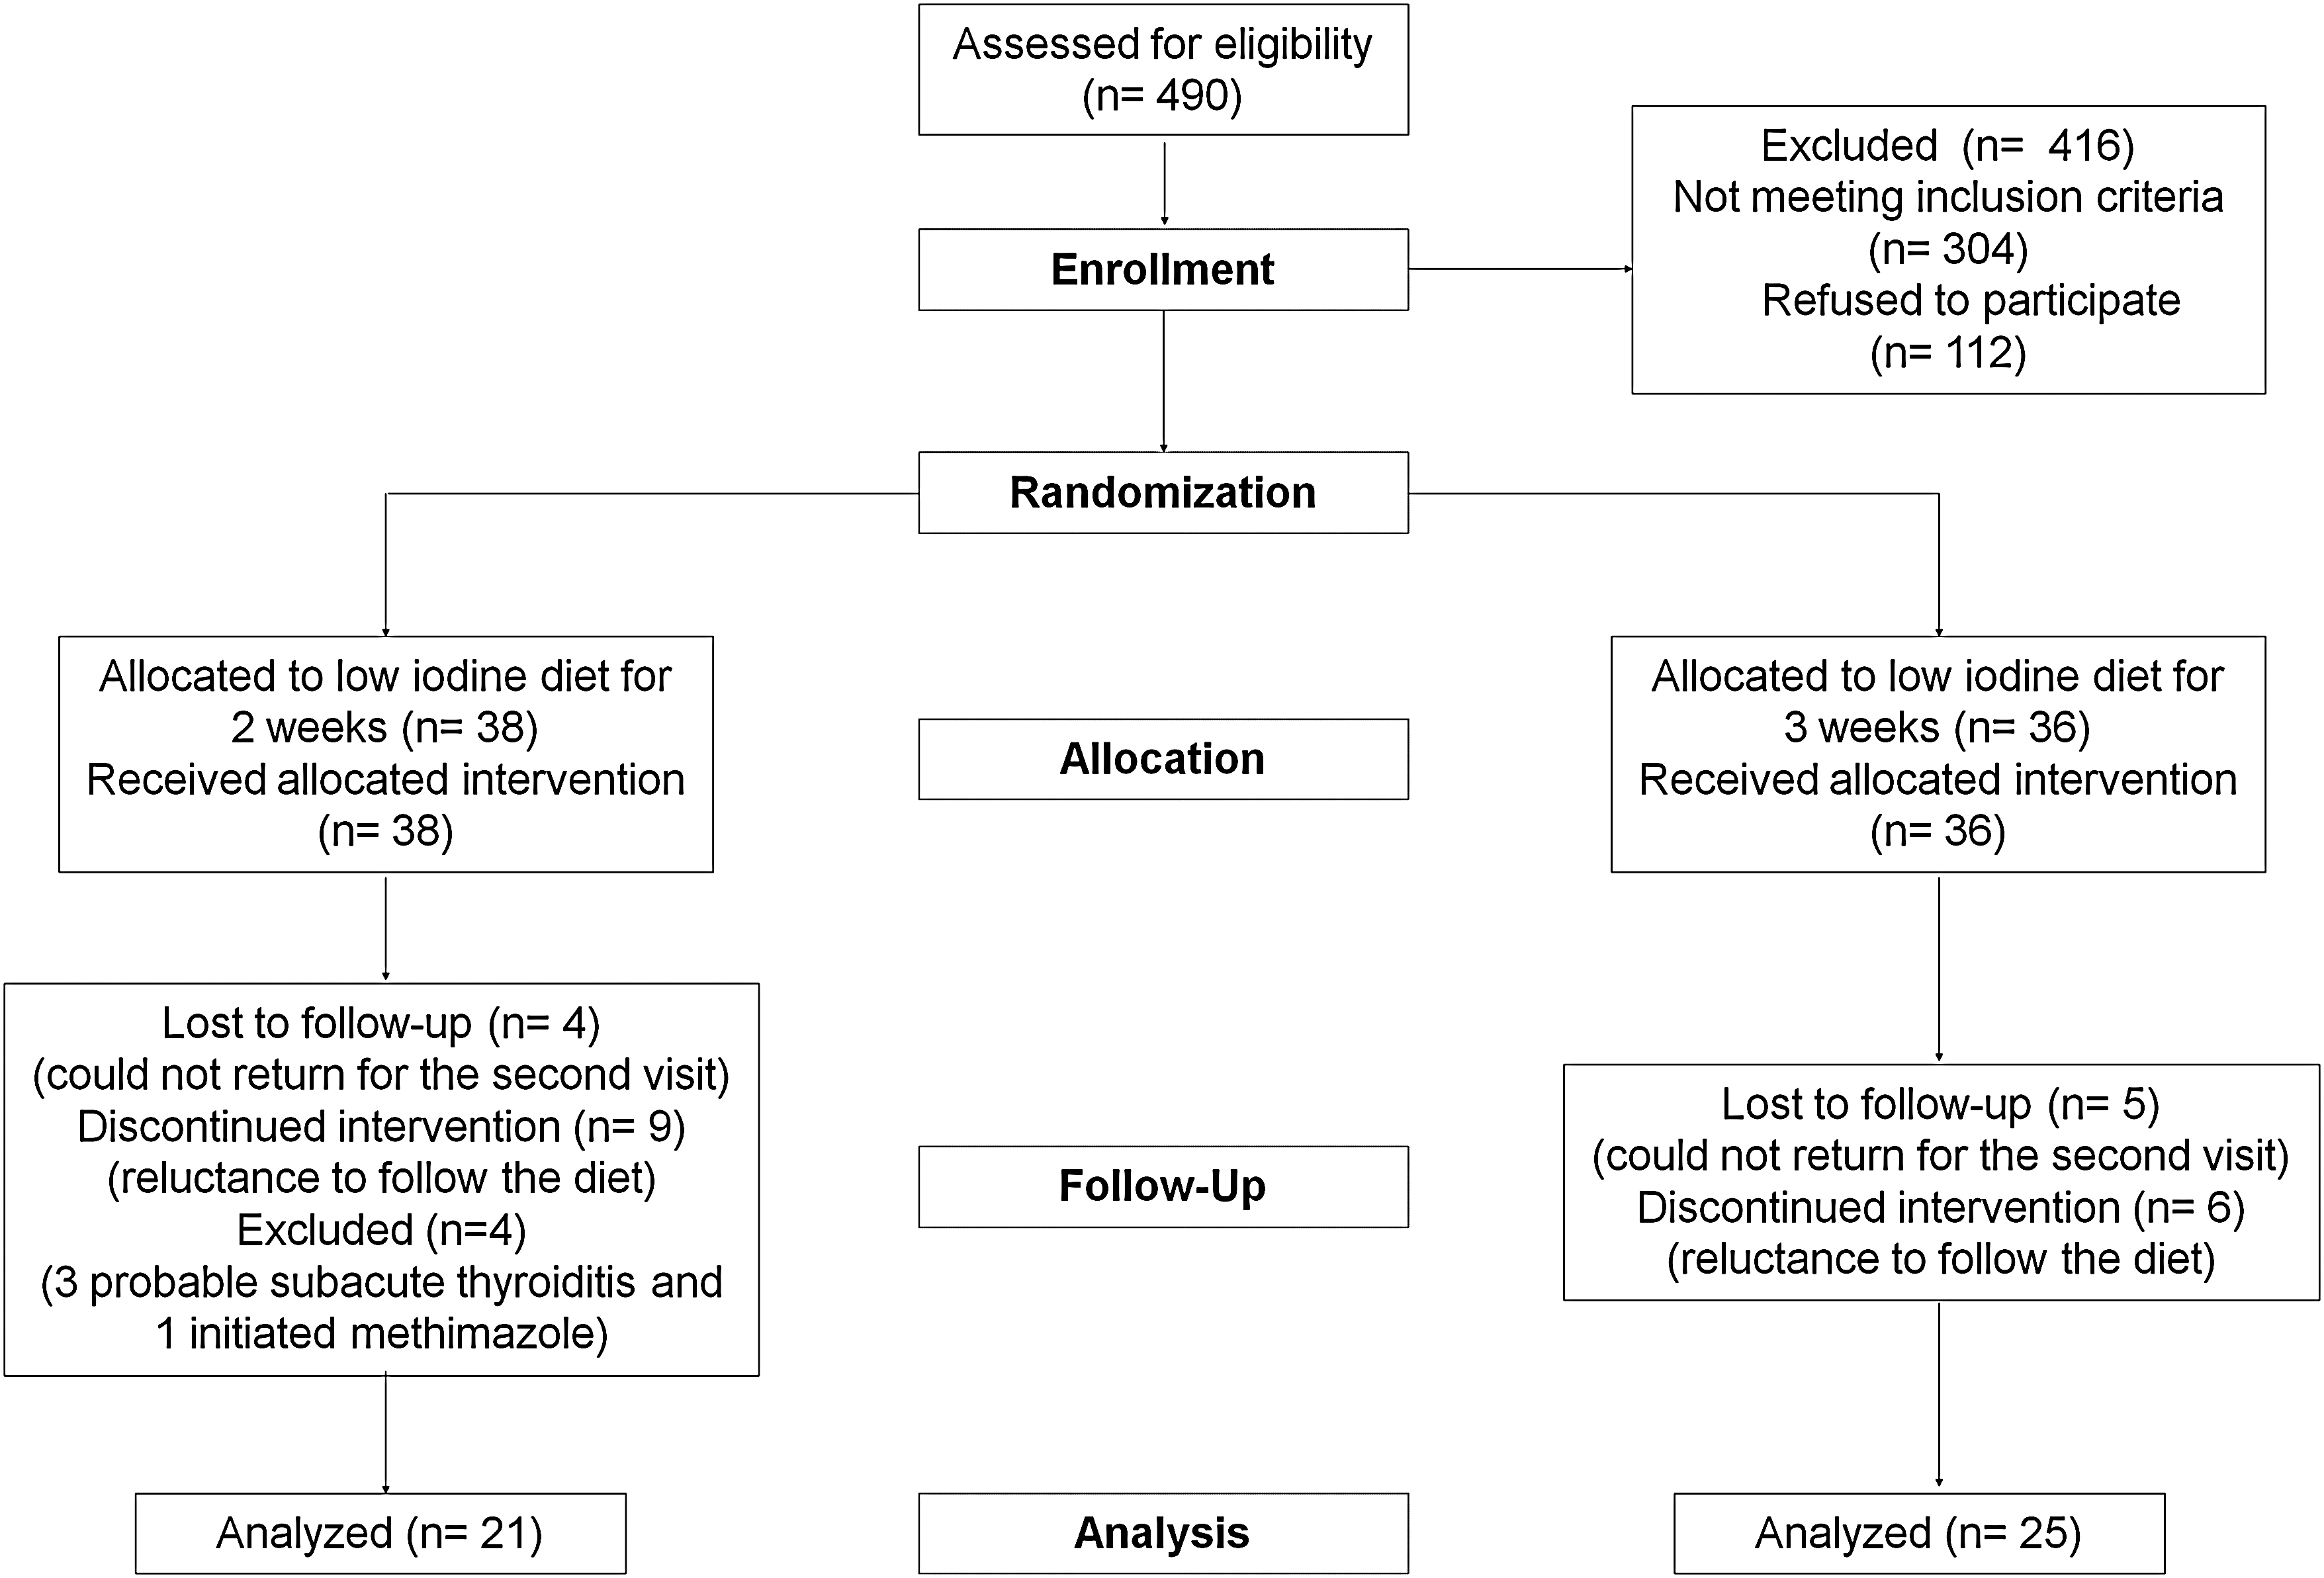
Flow diagram of the study.
Data are shown as n (%), mean ± standard deviation.
I, iodine in urine; Cr, creatinine in urine; TSH, thyrotropin.
Eligibility criteria
All patients aged 18 or older who came to the Nuclear Medicine Unit for thyroid radioiodine scintigraphy were considered for the study. Patients were considered ineligible if any of the following criteria were present: (i) TSH above the upper limit of reference, (ii) previous thyroidectomy, (iii) pregnancy or breastfeeding, (iv) use of levothyroxine within the past 30 days, (v) use of antithyroid medications within the past 7 days, (vi) patients already following an LID prescription, (vii) confirmed or probable subacute thyroiditis or exogenous thyrotoxicosis, (viii) patients unable to understand the informed consent, or (ix) unwillingness to return for follow-up.
Randomization
Patients were allocated to either LID2 or LID3 according to a computer-generated 1:1 randomization list. Results of 21 patients who were allocated for the LID2 group and of 25 patients who were allocated for the LID3 group were analyzed.
Experimental protocol
For each patient, before 131I intake, a urine sample was obtained, centrifuged for 6 minutes at 3200 rpm, and the supernatant was stored at −20°C for future analysis of the UIC and the UICr. Patients then answered a questionnaire about the consumption or exposure to iodinated products (Table 2) and were randomly allocated to either LID2 or LID3. Participants received the same instructions about the diet (Table 3) except for the duration, and they were also counseled on avoiding nondietary iodine sources as indicated in the questionnaire. All information was read by physicians and given to patients in written form. On the same day, an oral diagnostic dose of 131I (150–200 μCi) was administered, and each patient was asked to return 24 hours later for RAI-U measurement. After a period of 2 or 3 weeks, another urine sample was obtained. In addition, the patient answered the questionnaire again and received another oral diagnostic dose of 131I (150–200 μCi) for RAI-U measurement 24 hours later. The physicians who administered the questionnaires before and after the diet were not blinded to information regarding the patients, but the questionnaire was administered in a standardized fashion. The technicians who performed the UIC and the RAI-U measurements were blinded as to which group the patients belonged to.
Urinary iodine analysis
Afternoon urine samples were analyzed, as in one study a good correlation with 24 hours urinary iodine was shown (12). Pre and postdiet samples were stored at −20°C and later analyzed. UIC was measured by a method based on its indirect detection by ammonium ceric sulfate reduction, following the method of Sandell and Kolthoff (13), with a modification in the technique as described by Pino et al. (14), which uses ammonium persulphate instead of chloric acid for sample digestion. The intra-assay coefficient of variation was 5%, by measuring six samples. The inter-assay coefficient of variation for the same sample was 3%, considering a total of six experiments.
Urinary creatinine analysis
Urine creatinine was measured to allow for expression of the UICr, to minimize the variation in spot UIC samples due to varying water excretion. Urine creatinine was determined by an automated method performed by ADVIA®1800 (Siemens Healthcare Diagnostics, Deerfield, IL).
Thyroid 131I uptake
RAI-U was measured 22 to 26 hours after 131I ingestion using the Capintec Thyroid Uptake System, Captus® 600 (Capintec Inc., Ramsey, NJ).
Statistical analysis
Results are shown as mean ± standard deviation. Repeated measures analysis of variance were used to compare results for variables that were measured before and after the LID and to compare changes in variables in the LID2 group with the changes for the analogous variable in the LID3 group.
The chi-square test was used to compare the magnitude of the decrease (or increase) in the variables UIC, UICr, and RAI-U between the LID2 and LID3 groups. Student's t-test was used to evaluate differences in RAI-U, in UIC, and in UICr between patients who were exposed and those who were not exposed to exogenous iodine during the study period.
Data were analyzed by Microsoft Excel and SPSS (Statistical Package for Social Sciences, version 12.0) software programs and p < 0.05 was regarded as statistically significant.
Results
There were no adverse reactions in any of the patients during the period when they were taking the LID.
Questionnaire
Examination of the completed questionnaires regarding iodine exposure revealed that 5 of the 46 patients (all in the LID3 group) had been exposed to exogenous sources of iodine. Four used hair dye, and one used anti-cough syrup during the study period. The data below refer to the comparative analysis of each parameter between the LID2 and LID3 groups, excluding these five contaminated persons.
Urinary iodine concentration
In the five patients exposed to exogenous iodine, mean decrease in the UIC at the end of the LID compared with the beginning of the LID was 8.2 ± 97.5 μg/L, that is, significantly lower (p = 0.018) than the decrease in the patients who were not exposed to exogenous iodine (140.1 ± 114.5 μg/L).
A comparative analysis of UIC was performed between the two diet groups, excluding the five contaminated patients. Both LID2 and LID3 were associated with a statistically significant decrease in UIC, and no significant difference was found between the groups (p = 0.955). Mean UIC decreased by 63.2%, from 223.1 ± 115.6 to 82.0 ± 81.9 μg/L (p < 0.001), in the LID2 group and by 60.9%, from 228.2 ± 115.3 to 89.2 ± 82.7 μg/L (p < 0.001), in the LID3 group (Fig. 2).
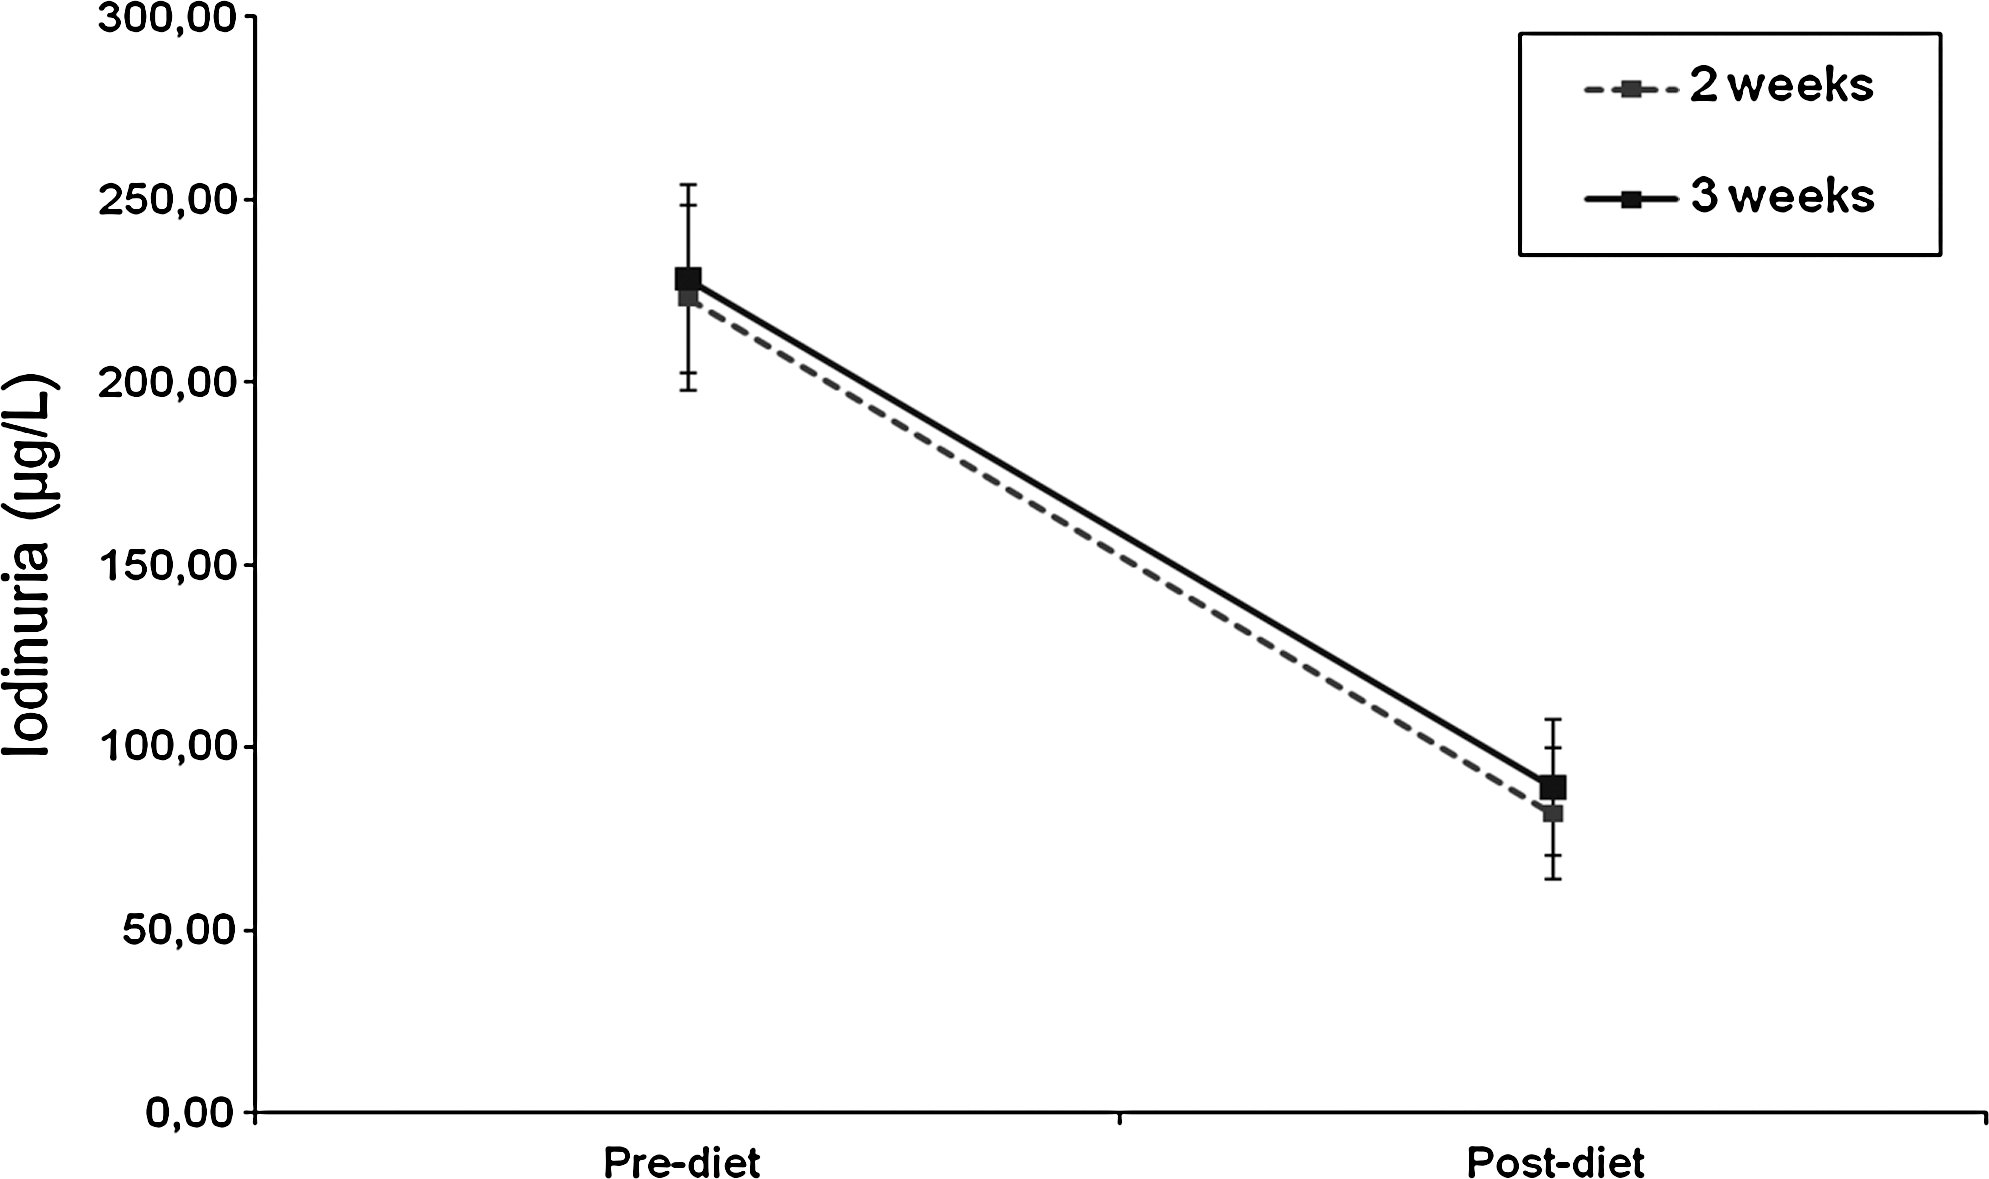
Comparison of the decrease in iodinuria (μg/L) between 2-week (n = 21) versus 3-week (n = 20) diet periods (p = 0.955), excluding the five exogenous iodine contaminated patients.
In the LID2 group, 15 of the 21 patients (71.4%) reached UIC levels considered adequate for the performance of scintigraphy (UIC ≤100 μg/L). Of these, 10 patients (47.6%) reached optimum levels (UIC ≤50 μg/L). In the LID3 group, adequate levels (UIC ≤100 μg/L) were reached by 11 of the 20 patients (55%); of these, 10 patients (50%) reached optimum levels (UIC ≤50 μg/L) (Fig. 3).

Distribution of urinary iodine values at 50 μg/L intervals among patients following a 2-week (n = 21) versus 3-week (n = 20) low-iodine diet period, excluding the five exogenous iodine-contaminated patients.
No significant difference was found between the two groups regarding to the percentage of patients having UIC ≤100 μg/L (p = 0.25) or the percentage of patients having UIC ≤50 μg/L (p = 0.86).
Iodine/creatinine ratio in urine samples
The UICr showed a significant decrease after the diet (p < 0.001), with no difference between the LID2 and LID3 groups (p = 0.779). The UICr decreased from 263.1 ± 146.9 to 86.9 ± 111.9 μg/gCr in the LID2 group and from 312.9 ± 123.3 to 122.59 ± 89.6 μg/gCr in the LID3 group.
There was a significant correlation between UIC and UICr (r = 0.516; p < 0.001).
131I uptake (RAI-U)
In the five patients whose questionnaire revealed exposure to exogenous iodine during the study, the RAI-U actually decreased, on average by 1.84% ± 4.7%, despite the LID; whereas in the patients not exposed to exogenous iodine, there was an increase by 6.77% ± 7.5% in the RAI-U (p = 0.016).
When these five contaminated patients were excluded from the analysis, the groups did not differ with regard to the change in the RAI-U before and after the LID (p = 0.105). The RAI-U increased by 43% in the LID2 group, from 20.0% ± 12.6% to 28.6% ± 15.7%, and by 26.7% in the LID3 group, from 19.31% ± 13.1% to 24.46% ± 13.9% (Fig. 4).
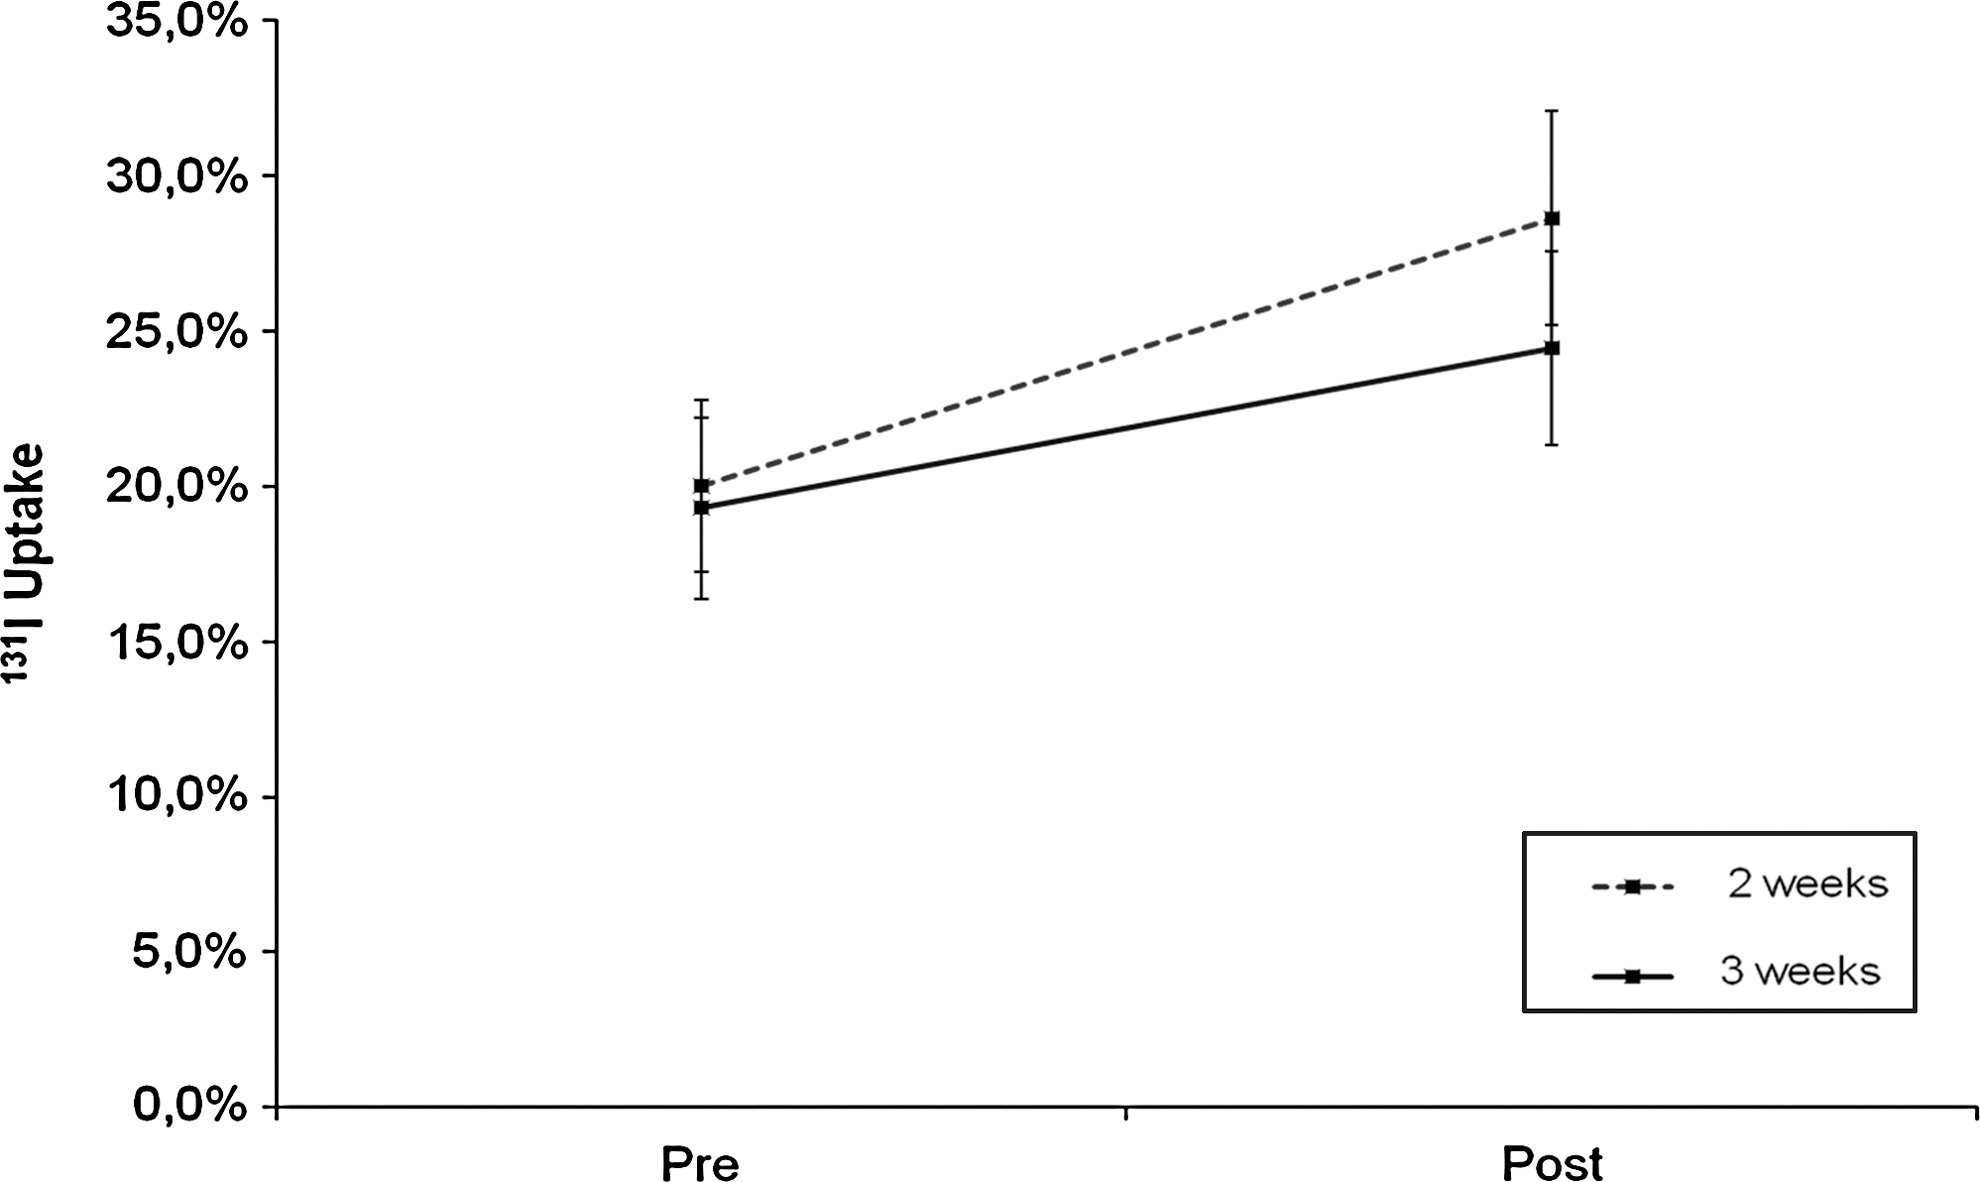
Comparison of the increase in 131I uptake between 2-week (n = 21) versus 3-week (n = 20) diet periods (p = 0.105), excluding the five exogenous iodine-contaminated patients.
Correlations between results
The correlations below were performed excluding the five members of LID3 who were iodine contaminated.
There was no significant correlation between body weight and percent increase in the RAI-U in both groups (r = 0.015, p = 0.928), percent decrease in the UIC in both groups (r = −0.033, p = 0.836), and percent decrease in the UICr in both groups (r = −0.159, p = 0.321).
Similarly, the age of patients did not show a correlation with these same variables, as shown: percent increase in the RAI-U in both groups (r = −0.079, p = 0.623), percent decrease in the UIC in both groups (r = −0.137, p = 0.393), and percent decrease in the UICr in both groups (r = 0.083, p = 0.608).
Likewise, the TSH value also showed no correlation with percent increase in the RAI-U in both groups (r = 0.114, p = 0.477), percent decrease in the UIC in both groups (r = 0.134, p = 0.405), and percent decrease in the UICr in both groups (r = −0.008, p = 0.959).
No correlations were found between percent increase in the RAI-U and percent decrease in the UIC in both groups (r = 0.241, p = 0.130), nor between percent increase in the RAI-U and percent decrease in the UICr in both groups (r = −0.165, p = 0.301).
There was a strongly significant correlation between UIC and UICr (r = 0.516; p < 0.001).
Discussion
The results of the present study are consistent regarding the influence of an iodine restricted diet on UIC, as reported in previous studies with patients who have been thyroidectomized (1,2). An inverse relationship between UIC and RAI-U was also observed in a previous study with patients with thyroid autonomy (3), but the effects of different periods of diet were not compared. Moreover, the percentage of patients considered adequately prepared (UIC <100 μg/L) for thyroid scintigraphy with a 2-week diet in this study is in line with the findings of previous studies with patients who have been thyroidectomized (2,9).
The difficulty in maintaining a restrictive diet for a prolonged period of time, a fact already mentioned in the literature (15), is often seen in clinical practice. In fact, if a diet is very restrictive compared with the one a patient is used to, a longer period of diet restriction may decrease the adherence to it. It is possible to hypothesize, also, that an increase in the period of iodine exposure restriction could increase the chances of exposure to iodine from other sources.
In this study, when excluding from the analysis the patients who were exposed to nonfood exogenous iodine during the diet period, which is a possible confusion bias, the 2-week diet was equivalent to the 3-week diet in the preparation for RAI-U, that is, there was no additional benefit in terms of a decrease in UIC or an increase in RAI-U with the extension for another week of the diet period. This finding suggests that other mechanisms besides the adhesion to iodine restriction could be involved. The plateau reached by the RAI-U (absence of difference between LID2 and LID3) could be determined by a limited effect of the iodine restriction upon the Na+/I− symporter, which is an intrinsic membrane protein that promotes iodide incorporation along with sodium ion translocation. The restriction to exogenous iodine could also determine a decrease in plasma levels of TSH, with secondary alterations in Na+/I− symporter function, compromising RAI-U. Unfortunately, this study was not designed to assess whether this hypothesis is or is not correct.
The significant correlation found between the UIC and the UICr in urine samples showed that the former may be sufficient for analysis of iodine body status; concomitant routine dosage of creatinine is probably not necessary.
The application, before and after the diet, of a questionnaire about exposure to iodine proposed in this study was efficient to predict a better response in the RAI-U. Mean RAI-U was significantly higher in patients who did not inform about exposure to exogenous iodine when compared with patients who stated having been exposed to iodized products.
In conclusion, in the present study, 2 weeks of an LID and low exposure to nondietary iodinated products were sufficient as well as equivalent to a 3-week period as preparation for thyroid scintigraphy in patients who have not been thyroidectomized. The proposed questionnaire on the exposure to exogenous iodine identified individuals in whom the LID has not been as effective in increasing the thyroid uptake of 131I.
Footnotes
Acknowledgments
We are grateful to PROAP of the Programa de Pós-Graduação em Ciências da Saúde of UFCSPA for their financial support; to Dr. Osvaldo Estrela Anselmi and all members of the Nuclear Medicine Department of Santa Casa de Porto Alegre; and to Drs. Juliana Passaglia, Larissa Camera, Luciana Penno, Márcia Boff, and Tayane Fighera for their collaboration.
Disclosure Statement
The authors declare that no competing financial interests exist.