
Abstract
Background:
Thyroid dysfunction and antibodies are increasingly recognized as risk factors during pregnancy. Thyroid function changes during pregnancy and there is a need for gestational age-specific reference intervals for thyroid hormones. The aim of this study was to calculate gestational age-specific thyrotropin (TSH), free thyroxine (fT4), and free triiodothyronine (fT3) reference intervals in an iodine-sufficient thyroid antibody-negative population.
Methods:
The study population consisted of a large, prospective population-based cohort, the Northern Finland Birth Cohort 1986 (singleton births, n = 9362), with extensive data throughout gestation. The subjects underwent serum sampling in early pregnancy. Samples were assayed for TSH, fT4, fT3, thyroid-peroxidase, and thyroglobulin antibodies (n = 5805). All mothers with thyroid antibodies or previous thyroid diseases were excluded when calculating gestational age-specific percentile categories for TSH, fT4, and fT3. Also, associations between body mass index (BMI) and thyroid hormones were established.
Results:
The upper reference limit for TSH was 2.5 multiples of median (2.7–3.5 mU/L, depending on gestational week). The lower reference limit was as low as 0.07 mU/L. Reference intervals for fT4 rose during early pregnancy and decreased thereafter, ranging between 11–22 pmol/L. Reference intervals for fT3 were uniform throughout gestation, ranging between 3.4 and 7.0 pmol/L. BMI was associated positively with early pregnancy TSH and fT3 concentrations and negatively with fT4 concentrations.
Conclusions:
These gestational age-specific reference intervals for thyroid hormones provide a framework for clinical decision making. Overweight and obesity are increasing problems among fertile women and they are associated with possibility of thyroid dysfunction during pregnancy.
Introduction
During early pregnancy, human chorionic gonadotropin (hCG) stimulates thyroid hormone (free thyroxine [fT4] and free triiodothyronine [fT3]) production (9) and inhibits thyrotropin (TSH) production through a feedback mechanism. In addition, the concentrations of thyroxine-binding globulin are higher in pregnant women, as a result of its increased synthesis via estrogens and reduced clearance (10). When the reference intervals for TSH and thyroid hormone concentrations were established, pregnant women were excluded as a result of the physiological changes seen in thyroid function during pregnancy. Therefore, several recent studies attempted to establish gestational age-specific reference intervals for pregnant women. These studies have shown that various assays and populations had great differences in TSH and thyroid hormone levels during pregnancy (11 –21) and have established conclusively that the reference intervals used for nonpregnant populations are not applicable for pregnant women. Hence, diagnostic and treatment thresholds during pregnancy should be adjusted according to serum concentrations of TSH, fT4, and fT3 in pregnant women.
In addition to pregnancy-induced changes in thyroid function, age, sex, smoking, ethnicity, and thyroid autoantibody positivity have effects on TSH and thyroid hormone concentrations (22 –24). Interestingly, body mass index (BMI) and thyroid function seem to be correlated: obese subjects have higher serum TSH (25), fT3, and fT4 concentrations (26). In a large pregnant population, it has been established that elevated hCG or fT4 concentrations are associated with lower median BMIs (27).
The aim of this study was to establish a framework of gestational age-specific reference values in a homogeneous and iodine-sufficient population and to examine the associations between thyroid hormone levels and BMI, using the prospectively collected Northern Finland Birth Cohort (NFBC) 1986.
Methods
The NFBC
The study population was the (prospective) NFBC 1986. The cohort covers 99% of all births with calculated term between July 1, 1985 and June 30, 1986, drawn from the two northernmost provinces of Finland (9362 mothers, 9479 children) (28,29). Only mothers with singleton pregnancies were included in the present study (n = 9247). The cohort has been followed up since the 12th week of gestation. Data collection was carried out during routine visits to maternal welfare clinics as well as via questionnaires. The first questionnaire, on demographic, biological, health behavioral, and socioeconomic characteristics of the mothers/families covered the period up to the 24th gestational week, when the mothers were enrolled in the study if still pregnant.
The second questionnaire covered maternal health and health behavior during pregnancy and the perinatal period. The mothers were assisted in completion of the questionnaire by nurses who ensured that all questions were answered. All women gave birth at hospital. Data concerning the mothers' background factors (i.e., age, BMI, smoking) were obtained through the questionnaires. Gestational age was defined by calculating from the date of the last menstrual period and/or ascertained by means of ultrasonographic measurement (around 70%).
The Ethics Committees of the University of Oulu and the National Institute for Health and Welfare approved this study. Informed written consent was obtained from all subjects.
Laboratory data
The biochemical data were obtained via the Finnish Maternity Cohort, which is a biobank consisting of serum samples collected from all pregnant women in Finland and approved under Finnish law. The law allows use of the stored samples in studies promoting public health. All Finnish women undergo screening for infectious diseases during their first visit to maternity care clinics. In Finland, more than 99% of women take part in free-of-charge maternity care and provide serum samples for screening. After the initial analyses, the samples were stored at −25°C and thawed for the first time for analyses conducted in 2006. All samples had been taken during office hours. Women visited the maternity care clinics for the first time at approximately 10th gestational week.
Quantitative analyses of thyroid hormones (TSH, fT3, and fT4) and autoantibodies (thyroid-peroxidase antibody [TPO-Ab] and thyroglobulin antibody [TG-Ab]) were performed using chemiluminescent microparticle immunoassays, using an Architect i2000 automatic analyzer (Abbott Diagnostics, Abbott Park, IL). The lower limits of detection and intra- and interassay coefficients of variation were 0.0025 mIU/L, 1.7% and 5.3% for TSH; 5.1 pmol/L, 3.6% and 7.8% for fT4; 1.53 pmol/L, 2.3% and 5.0% for fT3; 1.0 IU/mL, 2.5% and 9.8% for TPO-Ab; and 1.0 IU/mL, 2.7% and 8.2% for TG-Ab. The TSH assay has an analytical specificity of <10% cross-reactivity, with hCG at concentrations of ≤200,000 mIU/mL when TSH is in the normal range.
The assay manufacturer's reference intervals for the method are 0.35–4.94 mU/L for TSH, 9–19 pmol/L for fT4, and 2.62–5.70 pmol/L for fT3 as calculated from serum specimens from individuals with normal thyroid function.
The number of serum samples analyzed was 5805 (61.2% of the whole cohort). Only samples of a sufficient volume (≥1 mL) were included in this study. The excluded population did not differ significantly from those included (data not shown). The mean gestational age at sampling was 11.0 weeks (standard deviation [SD]: 3.6), and only samples drawn before or at the 20th gestational week were accepted (98% of the samples). The samples were analyzed in batches of 50–200 by experienced laboratory personnel during a time period of 2 months.
The effects of freezing, thawing, and frozen storage on thyroid laboratory parameters have been reported previously. In this study, long-term storage had no effect on TSH and fT3 stability, and long-term frozen storage had minimal effect on the concentrations of fT4 only (difference not clinically significant) (30). fT3 concentrations tended to be higher after freezing and thawing (30). However, as our samples were analyzed after long-term frozen storage, which has an effect on the stability of thyroid antibodies after 10 years of frozen storage (30), we established cutoff levels to determine antibody positivity. Women were deemed to be TPO-Ab positive or TG-Ab positive if the concentration of antibody was over the 95th percentile (>167.7 IU/mL for TPO-Ab and >47.7 IU/mL for TG-Ab).
All antibody-positive women were excluded from all analyses (n = 464).
Outliers observed in our data were excluded when establishing gestational age-specific values (n = 147). Outliers were defined as follows: TSH ≥4.5 mU/L, fT4 ≥25 pmol/L, or fT3 ≥8 pmol/L. These high values were thought to represent either laboratory error or undiagnosed disease and were therefore not included in the calculations.
All women with known thyroid disease and those taking thyroid medications were excluded from analyses.
Statistical methods
For TSH, fT4, and fT3 analyses, the medians and percentiles at points 2.5, 5, 25, 75, 95, and 97.5 were defined for every full gestational week. A sample size of over 100 was considered reliable enough to create gestational age-specific percentiles and the results were partly grouped to have sufficient sample size.
For association analyses, the BMI data were divided into four categories: underweight, with BMI < 20 kg/m2; normal weight, with BMI of 20.0–24.9 kg/m2; overweight, with BMI of 25.0–29.9 kg/m2; and obese, with BMI ≥30 kg/m2. The analyses were performed by using the Kruskal–Wallis test to test for thyroid hormone concentration trend in different BMI categories and the Mann–Whitney U test was used for pairwise comparisons of thyroid hormone concentrations when the population belonging to the normal BMI category was compared with all other categories. A p-value of <0.05 was deemed statistically significant. Statistical analysis was carried out and graphics were created using SPSS v. 18.0 software (SPSS, Inc., Chicago, IL).
Results
The mean age of the women was 28.1 years (SD: 5.3; range: 15.9–47.2) and the mean BMI was 22.4 (SD: 3.3). About a third (34.2%) of these women were nulliparous (n = 1725). Of all women, 18.5% smoked in early pregnancy (n = 932).
Thyrotropin
Table 1 shows TSH percentiles according to week of gestation, obtained from the NFBC 1986. Median (50th percentile) concentrations of serum TSH decreased from very early pregnancy onward, reaching a nadir at the 11th gestational week and increasing from there onwards (Fig. 1). A more pronounced increase was seen in transition from first to second trimester of pregnancy. The variation in TSH concentrations was greater in high-percentile categories. The multiples of medians (MoMs) were calculated for the data to allow comparison between different populations and methods. Figure 2 demonstrates the MoMs of percentile points 95 and 97.5 of TSH concentrations. In our data, both of these percentile points were approximately 2.5 MoM during gestational weeks 2–20. Therefore, the 95th percentile was selected to represent the upper reference limit so as to not omit any cases of hypothyroidism. This renders an upper reference interval of approximately 2.7–3.1 mU/L in the first trimester and 2.8–3.5 mU/L in the early second trimester. The 2.5th percentile was used to represent the lower reference limits and TSH concentrations were as low as 0.07 mU/L during the 9th and 10th gestational weeks.
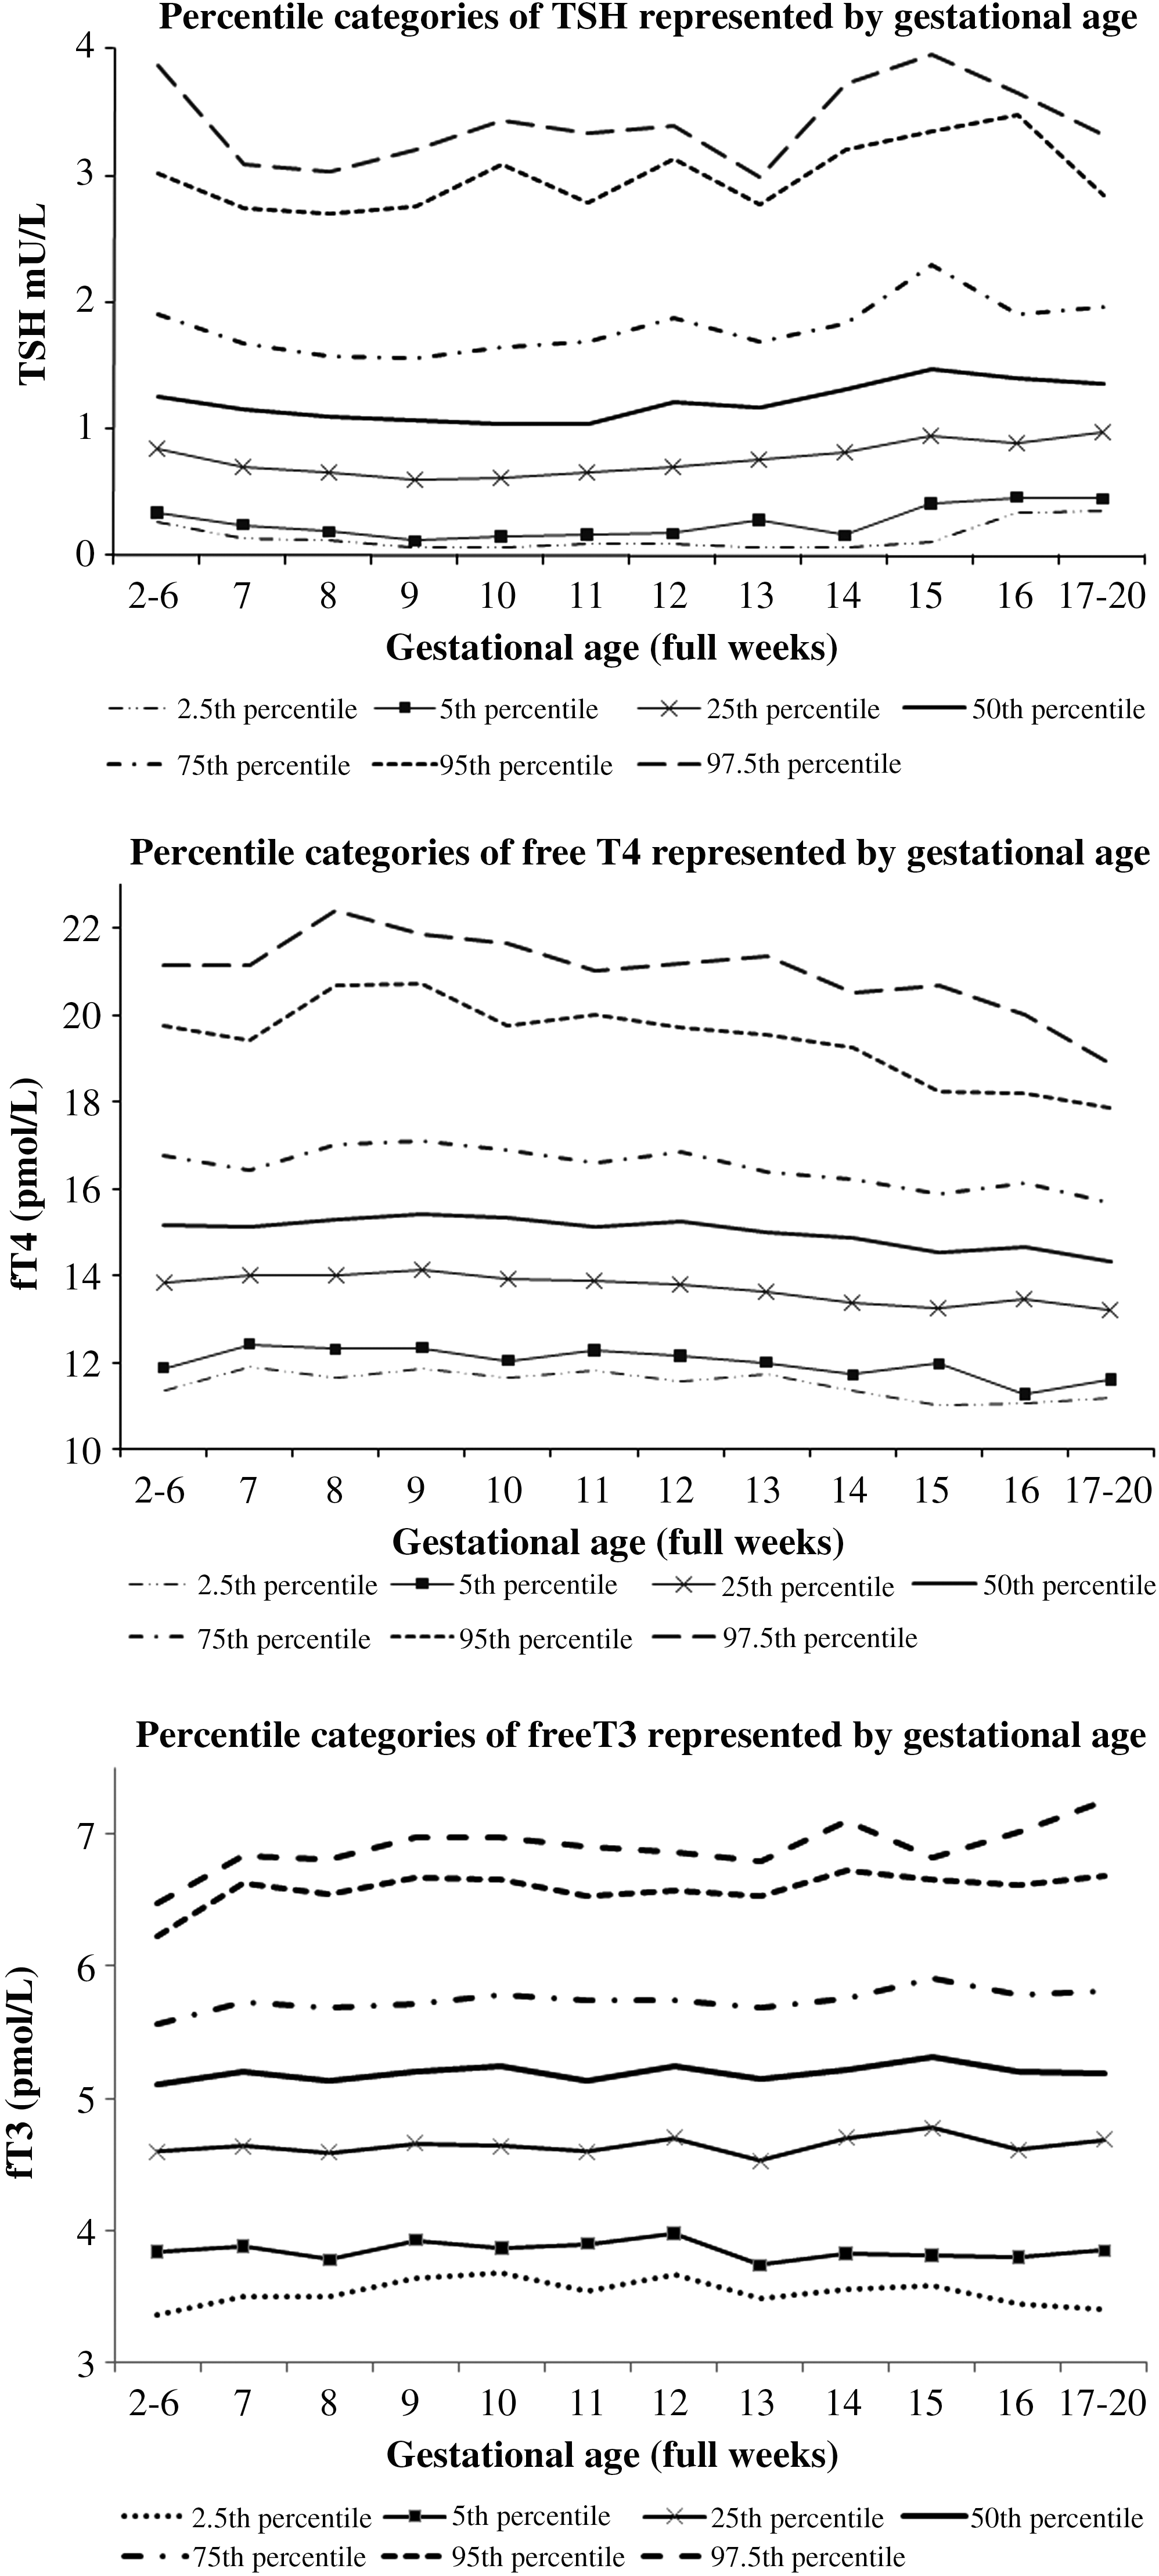
Percentile categories of TSH, fT4, and fT3. TSH, thyrotropin; fT4, free thyroxine; fT3, free triiodothyronine.
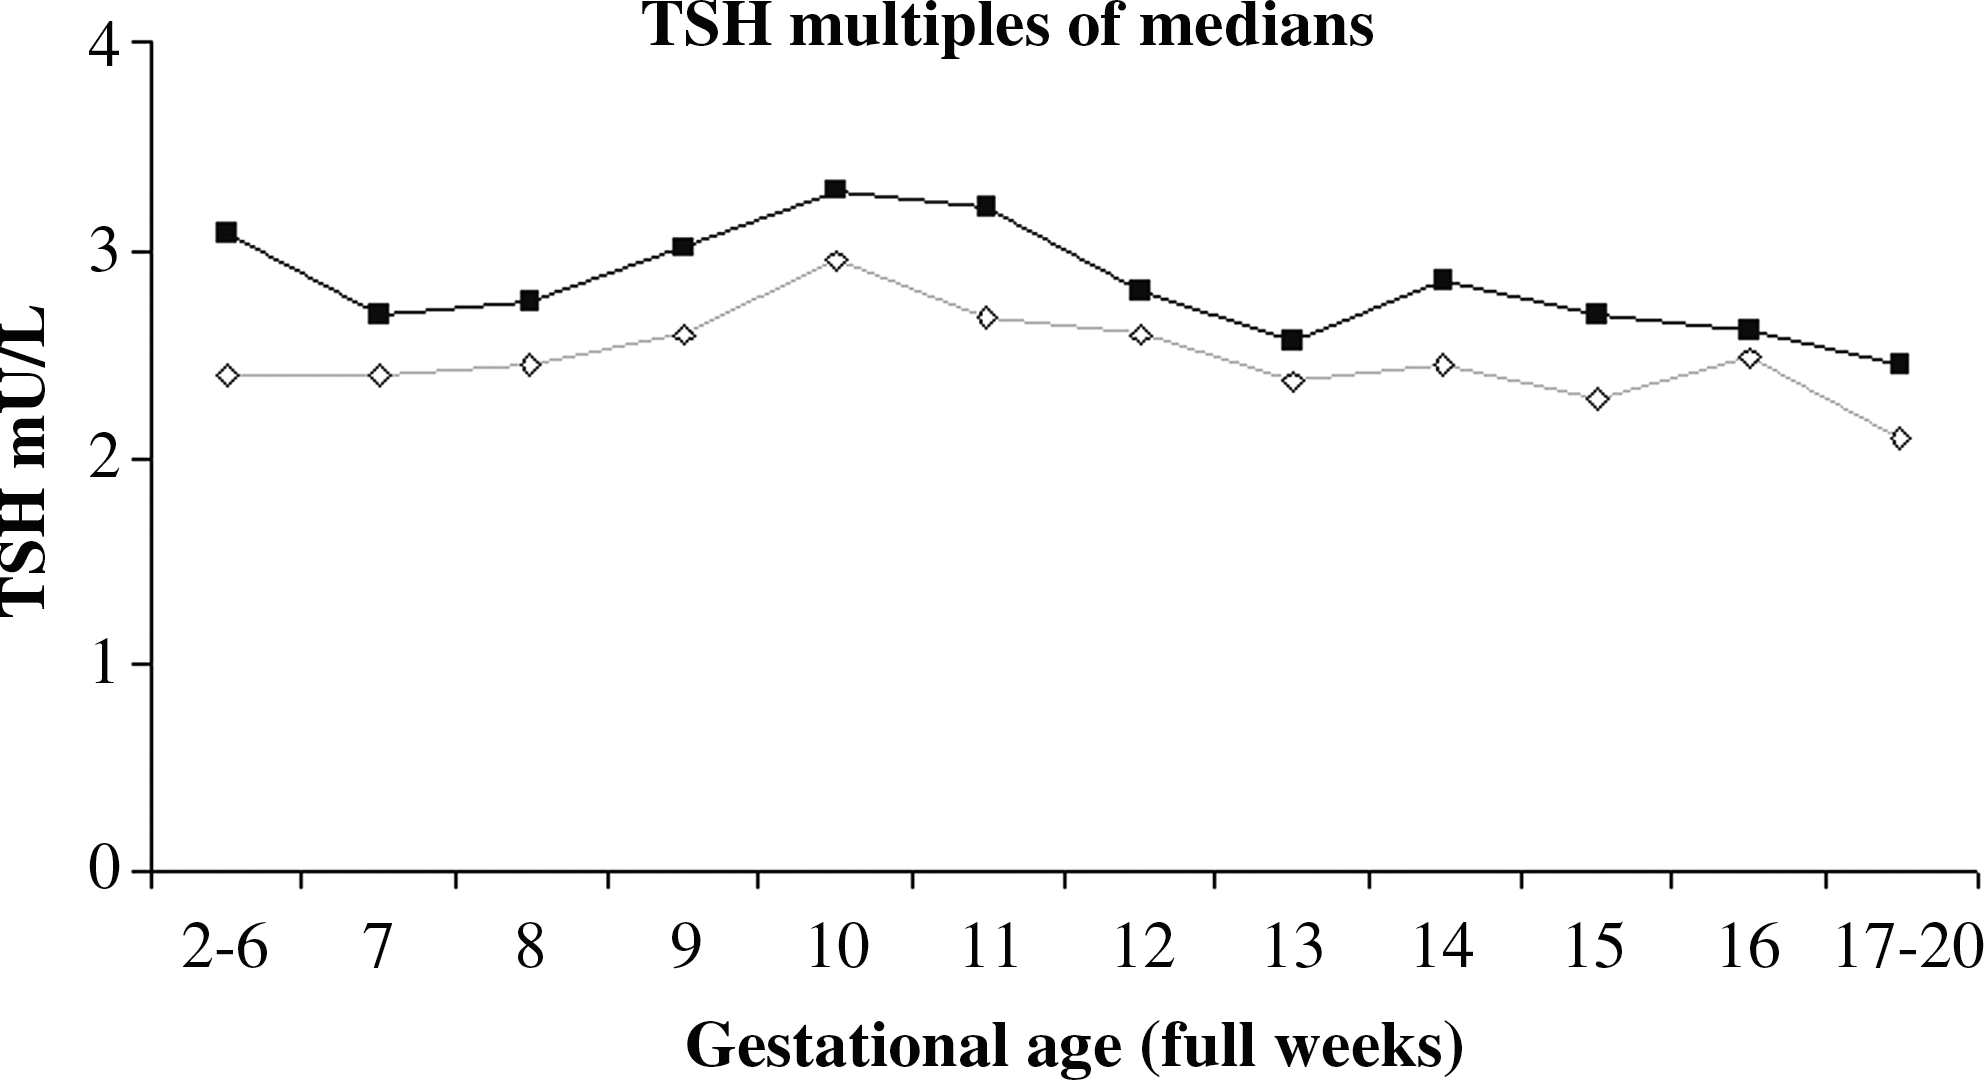
Percentile points 95 (⋄) and 97.5 (■) of multiples of medians obtained for the Northern Finland Birth Cohort 1986.
The 95% reference interval given by the assay manufacturer is 0.35–4.94 mU/L (Abbott Diagnostics).
TSH, thyrotropin.
Free thyroxine
Table 2 and Figure 1 present the fT4 percentiles categorized by gestational week, obtained from the NFBC 1986. The median fT4 values appear to show a small rise from the 6th to 10th gestational week, decreasing thereafter. The same trend can be seen in all percentile categories. As with TSH, fT4 concentrations showed higher variability in high-percentile categories. The 95th percentile was approximately 1.3 MoM and the 97.5th percentile was approximately 1.4 MoM during gestational weeks 2–20. The 95% gestational age-specific reference intervals ranged between 11 and 22 pmol/L (Table 2).
The 95% reference interval given by the assay manufacturer is 9–19 pmol/L (Abbott Diagnostics).
fT4, free thyroxine.
Free triiodothyronine
Table 3 and Figure 1 present gestational age-specific values for fT3 obtained from the NFBC 1986. There appeared to be no clear rise or fall in fT3 values during pregnancy in any of the studied percentile categories. The 95th percentile was approximately 1.25 MoM and the 97.5th percentile was approximately 1.3 MoM during gestational weeks 2–20. The 95% gestationnal age-specific reference intervals ranged between 3.4 and 7.2 pmol/L (Table 3).
The 95% reference interval given by the assay manufacturer is 2.62–5.70 pmol/L (Abbott Diagnostics).
fT3, free triiodothyronine.
BMI and thyroid hormone levels
When comparing TSH concentrations in different BMI categories, a significant trend was seen. Higher TSH concentrations were observed in high BMI categories (Kruskal–Wallis test for trend, p = 0.011; Table 4). However, TSH concentrations were significantly higher only in obese women when compared with normal-weight women (pairwise comparison, Mann–Whitney U test, p = 0.002). When the percentiles of fT4 in different BMI categories were compared, a significant inverse association was seen between fT4 concentrations and BMI categories (Kruskal–Wallis test for trend, p < 0.001; Table 4). Comparison of fT4 concentrations in different BMI categories revealed that fT4 levels were significantly lower in overweight or obese subjects compared with normal-weight women (pairwise comparison, Mann–Whitney U test, p = 0.042 and p = 0.001, respectively). No significant difference was seen in fT4 concentrations when comparing normal-weight and underweight women. Comparison of fT3 levels in different BMI categories revealed that fT3 concentrations rose with BMI, a trend seen in all fT3 percentile categories (Kruskal–Wallis test for trend, p < 0.001; Table 4), and statistically significantly higher fT3 concentrations were seen in overweight and obese women versus normal-weight women (pairwise comparison, Mann–Whitney U test, p < 0.001 and p < 0.001, respectively).
p-Value was calculated for TSH, fT4, and fT3 trends in different BMI categories by Kruskal–Wallis test. A p-value of <0.05 was deemed significant.
Discussion
Our study population is a large, prospective, and population-based cohort without thyroid antibodies and with sufficient iodine intake (31 –33), from which a framework of gestational age-specific reference intervals and treatment thresholds can be reliably obtained. Previous studies have shown wide variation in thyroid hormone levels during gestation in different populations, and therefore, there has been a need for population-specific reference intervals for pregnant women. This study also provides further evidence concerning the association between thyroid hormones and BMI.
In our study, we wanted to find out if BMI has an effect on thyroid function parameters or vice versa. We found that fT4 levels decrease and TSH concentrations increase with increasing BMI. Interestingly, we found that fT3 levels have an opposite association with fT4, and higher levels of fT3 were associated with higher BMI. Previously, obese euthyroid subjects have been found to have higher serum TSH concentrations than lean subjects (25). In another study, subjects with morbid obesity were found to have higher TSH, fT4, and fT3 concentrations than normal-weight subjects (26). It has been hypothesized that these changes could be a result of adjustment to adiposity (34). The associations between BMI and levels of TSH, fT4, and hCG have been studied previously in pregnant women (27)—in that study, BMI was higher when hCG or fT4 levels were lower. The findings reported by others appear to be in accordance with our results and our data show that they apply to pregnant women as well. Our results are important when evaluating risk factors for thyroid dysfunction in pregnant women. Based on our results, overweight and obese women are at higher risk for having thyroid dysfunction during pregnancy and, therefore, need to be considered as at-risk mothers for adverse pregnancy outcome. Overweight and obesity have been associated independently with adverse outcomes (35) and are probably intervening factors in studies evaluating the association between thyroid dysfunction and adverse perinatal outcomes.
The results show that TSH concentrations at different gestational ages differ significantly from the reference intervals given by the assay manufacturer (reference intervals: 0.35–4.94 mU/L, defined from general population with normal thyroid function; Abbott Diagnostics). Serum TSH concentrations in this population appeared to follow a pattern similar to that seen in other populations: concentrations decrease during early pregnancy, nadir at 11th gestational week—during the greatest period of hCG stimulation (9)—and rise thereafter, especially in the second trimester (13,14,16). However, TSH concentrations showed great variation at percentile points 95 and 97.5 in our data, which could be possibly due to daily variation of TSH and/or hCG cross-reactivity.
The low TSH values at percentile point 2.5 were at their nadir of 0.07 mU/L at gestational weeks 9 and 10, this concentration being much lower than the nonpregnant lower 95% limit of the reference interval given by the manufacturer (0.35 mU/L; Abbott Diagnostics). This finding has been established in other studies as well (13,14,16). These low TSH values are a result of hCG stimulation during the first trimester, which inhibits TSH production through feedback inhibition by thyroid hormones.
To evaluate upper reference limits in our pregnant population and to enable comparison with other population-based data and different methods, we calculated MoMs from our data. It appeared that a MoM of 2.5 represented the upper reference limit for TSH during the studied gestational weeks. Percentile points 95 and 97.5 in our population both represented approximately the same MoM and the lower percentile point was chosen as the upper reference limit to not omit any cases of hypothyroidism when using these reference intervals, because hypothyroidism during pregnancy is thought to be associated with adverse outcomes (1 –3). Previously, Dashe et al. (13) have reported MoMs with regard to TSH in singleton pregnancies and found that the upper reference limit of TSH concentrations was 4.0 MoM in the first and 2.5 MoM in the second trimester. However, their study population was of a different ethnicity compared with ours, theirs being mostly Hispanic and black, which could have an effect on TSH values (36).
All in all, our results concerning gestational age-specific TSH concentrations are comparable with those in other studies from various countries (11,20,37), but the upper reference limit of TSH seems to be lower (16,21) or higher (13) in some populations. To some extent, the differences are probably due to sample size, sample processing, assay methodology, population-specific characteristics, variation in iodine intake, and inclusion of thyroid antibody-positive women. In our study, only thyroid antibody-negative women were included as we wanted to find the normal values for a healthy pregnant population.
We also calculated gestational age-specific reference intervals for fT4. We observed a small rise in early gestational weeks and, after the 9th gestational week, a gradual drop in fT4 concentrations. This observation has been seen in other studies as well (12,16,38) and seems to be a reflection of increasing levels of thyroxine-binding globulin and hCG during early pregnancy. A recent report has shown that, with the Abbott Architect method (as used in this study), thyroid hormones show a smaller drop in the second trimester than with other methods (39). This is evident in our data as well, because only a very gradual decrease in fT4 concentrations is seen toward the second trimester. However, the overall concentrations of fT4 obtained from the NFBC 1986 are higher than those seen in some other studies (12,38) and higher than the assay manufacturer's reference interval (9–19 pmol/L; Abbott Diagnostics). However, our fT4 results are comparable with those of other studies (16,38). Different immunoassays show quite a marked variation in fT4 concentrations during pregnancy (7), but the Abbott Architect method has been found to be quite sensitive to altered binding protein concentrations (39). As two of the three previous studies used the same method as the present study, the differences in fT4 concentrations during pregnancy are more probably because of population-specific characters, and especially reflect overall iodine intake in the population.
The fT3 concentrations observed in this study appeared to be relatively uniform over weeks 2–20 of gestation. However, when comparing the results from this pregnant population with the reference intervals of the nonpregnant population (95% reference interval of the assay manufacturer Abbott Diagnostics: 2.62–5.70 pmol/L), the values in our study population exceeded the upper normal limit in all gestational weeks studied. In addition, when comparing our results with those of previous studies, some differences were seen. In a study by Panesar et al. (16), fT3 concentrations showed a marked decline over the course of pregnancy. In a study by Gilbert et al. (38), who used the same method as in our study, fT3 values were relatively uniform during the first trimester, but were lower than in our population. Our analyses were carried out after one freeze–thaw cycle. In a previous study, we have shown that fT3 concentrations tend to be somewhat higher after freezing and thawing (30), which could also explain the higher results compared with those in the nonpregnant population seen in the present study.
Our database is very extensive and has allowed the exclusion of all cases with thyroid diseases, thus rendering reliable results to create reference intervals. Iodine intake in this population has been stable since the 1970s (31 –33), which enables comparison of archived samples with contemporary samples with respect to thyroid hormones. However, our study has some limitations, because it is based on a set of samples that has been in long-term frozen storage. However, in a previous study, we have shown that thyroid hormones are quite stable even during such long-term storage, but freezing and thawing have some effect on fT3 concentrations (30). Therefore, our laboratory results can be considered to be reliable, but the results may be implemented in clinical practice only after consideration. Fresh serum sampling would of course be optimal in creating laboratory reference intervals, but creating gestational age-specific intervals requires a great amount of samples, which can be obtained from serum banks more easily.
In conclusion, the results of this study have provided additional information on the reference intervals of thyroid hormones during pregnancy from thyroid antibody-negative, iodine-sufficient population. Our results can be used as a basis of reference intervals in laboratories utilizing Abbott methods or methods similar to them. Before screening programs concerning thyroid hormones can be implemented in pregnant populations, such reference intervals need to be established.
More importantly, the present results provide new information on the association between BMI and thyroid hormone concentrations and indicate that the obese pregnant population may be more susceptible to thyroid dysfunction—an important finding considering how obesity is increasing in many populations.
Footnotes
Acknowledgments
The authors thank Ms. Sarianna Vaara, Ms. Tuula Ylitalo, and all other personnel from the Institute of Health Sciences, University of Oulu, for their valuable work regarding handling of the NFBC 1986 data. The authors also thank Mr. Jouni Sallinen and Mr. Frank Quinn (Abbott Laboratories) for providing laboratory reagents, and Ms. Annika Uimonen and Ms. Mari Päätalo for conducting the analyses. This work was supported in part by grants from the Alma and K.A. Snellman Foundation (Oulu, Finland), the Jalmari and Rauha Ahokas Foundation (Finland), the Lilly Foundation (Finland), Oulu University Scholarship Foundation (Oulu, Finland), the Finnish Medical Association of Clinical Chemistry, the Foundation of the Northern Ostrobothnia Hospital District (Finland), the Finnish Medical Foundation (Finland), the Finnish Medical Society Duodecim (Oulu, Finland), the National Graduate School of Clinical Investigation (Finland), and the Academy of Finland.
Disclosure Statement
The authors declare that they have nothing to disclose.