
Abstract
Background:
Glucose transporter 4 (GLUT4) is highly expressed in muscle and fat tissue, where triiodothyronine (T3) induces solute carrier family 2 facilitated glucose transporter member 4 (SLC2A4) gene transcription. T3 was also shown to rapidly increase glucose uptake in myocytes exposed to cycloheximide, indicating that it might act nongenomically to regulate GLUT4 availability. We tested this hypothesis by evaluating, in thyroidectomized rats (Tx rats), the acute and/or chronic T3 effects on GLUT4 mRNA expression and polyadenylation, protein content, and trafficking to the plasma membrane (PM) in skeletal muscle, as well as on blood glucose disappearance rate (kITT) after insulin administration.
Methods:
Rats were surgically thyroidectomized and treated with T3 (0.3 to 100 μg/100 g body weight) from 10 minutes to 5 days, and killed thereafter. Sham-operated (SO) rats were used as controls. Total RNA was extracted from the skeletal muscles (soleus [SOL] and extensorum digitalis longus [EDL]) and subjected to Northern blotting analysis using rat GLUT4 cDNA probe. Total protein was extracted and subjected to specific centrifugations for subcellular fractionation, and PM as well as microsomal (M) fractions were subjected to Western blotting analysis, using anti-GLUT4 antiserum as a probe. GLUT4 mRNA polyadenylation was examined by a rapid amplification of cDNA ends–poly(A) test (RACE-PAT).
Results:
Thyroidectomy reduced skeletal muscle GLUT4 mRNA, mRNA poly(A) tail length, protein content, and trafficking to the PM, as well as the kITT. The acute T3 treatment rapidly (30 minutes) increased all these parameters compared with Tx rats. The 5-day T3 treatment increased GLUT4 mRNA and protein expression, and restored GLUT4 trafficking to the PM and kITT to SO values.
Conclusions:
The results presented here show for the first time that, in parallel to its transcriptional action on the SLC2A4 gene, T3 exerts a rapid post-transcriptional effect on GLUT4 mRNA polyadenylation, which might increase transcript stability and translation efficiency, leading to the increased GLUT4 content and availability to skeletal muscle, as well as on GLUT4 translocation to the PM, improving the insulin sensitivity, as shown by the kITT.
Introduction
In contrast, a number of the effects of T3 and T4 occur very rapidly and are unaffected by gene transcription and protein synthesis inhibitors, indicating that they also act nongenomically (1). These nongenomic actions continue to be reported. Though their mechanisms are still not well understood, it appears that some involve activation of protein kinase signaling pathways (1).
Skeletal muscle is an important target for T3, which regulates the transcription rate of several genes that code for contractile and other proteins that are important for energy metabolism, such as glucose transporter 4 (GLUT4) (2 –5). GLUT4 is upregulated by T3; is highly expressed in skeletal muscle, heart, and adipose tissues; and plays an important role in whole body glucose homeostasis (5,6). It is stored in intracellular vesicle membranes, and can be acutely translocated to and inserted in the plasma membrane (PM) by insulin stimulation and muscle contraction, allowing glucose uptake to increase (7).
The high GLUT4 expression in skeletal muscle and its regulation by T3 make this tissue and this hormone particularly important for the control of glycemic homeostasis (6 –8). Long-term T3 administration has been shown to stimulate GLUT4 expression and glucose transport in rat skeletal muscle, which might contribute to the increased peripheral glucose utilization observed in hyperthyroidism (5).
Torrance et al. have reported a specific T3 receptor binding site within the T3-responsive region of the solute carrier family 2 facilitated glucose transporter member 4 (SLC2A4) gene, but this binding site had a relatively low affinity for the T3 receptor (9). The role of this binding with regard to the ability of T3 to stimulate GLUT4 mRNA does not seem to explain our preliminary results that T3 administration increases GLUT4 mRNA content in rat skeletal muscles in only 30 minutes (10). This would not be expected if the effect of T3 were mediated by a low-affinity T3-responsive region of the SLC2A4 gene, and the rapidity of the response favors the hypothesis that a nongenomic mechanism was involved. Similarly, Segal demonstrated that T3 increased glucose uptake by freshly isolated rat heart slices in vitro, as well as by several rat tissues in vivo, in only a few minutes (11,12). In the studies of Segal (11,12), evidence was provided that these effects were mediated by a nongenomic pathway, as not only the onset of action was rapid, but also that the effects occurred in the presence of the protein synthesis inhibitor cycloheximide. More recently, Gordon et al. obtained evidence that T3 stimulated the uptake of 2-deoxy-D-glucose into L6 cells by a nongenomic pathway (13).
One of the recognized nongenomic actions of T4 and T3 is the induction of rapid remodeling of actin filaments (2,14), which is required for GLUT4 translocation into the PM and glucose uptake (15), and is supposedly involved in the control of mRNA stability (16). mRNA stability is dependent on the poly(A) tail length of mRNA transcripts, a step that has been shown to be regulated by T3 (17). These data further support a significant role for T3 in the control of glucose uptake through its well-known transcriptional effects on the SLC2A4 gene expression and indicate that there are novel aspects yet to be defined, involving nongenomic actions of T3 on GLUT4 expression and trafficking to the PM.
Considering that our preliminary studies have shown that T3 administration increased GLUT4 mRNA content in rat skeletal muscles in only 30 minutes, which strongly indicates that this effect is mediated by nongenomic mechanisms, in the current study, we attempted to evaluate whether this effect results from an increase in GLUT4 mRNA stability, which could lead to an increase in GLUT4 protein content. Furthermore, we have investigated whether acute T3 administration induces GLUT4 translocation to the PM, augmenting blood glucose decay rate.
Materials and Methods
Animals and treatments
Male Wistar rats weighing 200–250 g were obtained from our own breeding colony and maintained on rat chow and tap water ad libitum. They were housed in a room kept at a constant temperature (23°C±2°C) and on a 12-hour-light/12-hour-dark (lights on at 0700 hours) schedule. The animals were made hypothyroid by surgical thyroidectomy, after being deeply anesthetized with ketamine and xylazine (100 and 10 mg/kg body weight [BW], intraperitoneal [i.p.], respectively) (18), and received 0.03% methylmercaptoimidazole (Sigma Chemical Co., St. Louis, MO) plus 4.5 mM CaCl2 (Sigma Chemical Co.) in drinking water during 21 days, before being treated with T3 (19).
Several groups of rats were studied. The control group comprised rats that were subjected to sham thyroidectomy, referred to as the SO group. The Tx group included rats that had been thyroidectomized 21 days before they were sacrificed and studied. To evaluate responses to chronic T3 administration, a group of thyroidectomized rats (Tx rats) were treated with T3, 5.0 μg/100 g BW, i.p., divided in two doses, for 5 days. They were referred to as the T3-chronic group. To evaluate rapid-onset responses to T3 administration, Tx rats were treated with three different doses of T3 and sacrificed 10 to 30 minutes after T3 administration. One group of Tx rats were treated with supra-physiological doses of T3 (100 μg/100 g BW, intravenous [i.v.]). These rats were divided into three subgroups. These subgroups were sacrificed 10, 20, and 30 minutes after T3 administration and are referred to as the T3 10′, T3 20′, and T3 30′ subgroups, respectively. Another group of Tx rats were treated with T3, 0.3 μg/100 g BW, and sacrificed 30 minutes later. These are referred to as the T3 0.3 subgroup. Another group of Tx rats were treated with T3, 1.5 μg/100 g BW, i.v., and sacrificed 30 minutes later. These are referred to as the T3 1.5 subgroup.
After being anesthetized, the rats were weighed and treated with T3 for 10 to 30 minutes; then, they had their slow-oxidative (soleus [SOL]) and fast-glycolytic (extensorum digitalis longus [EDL]) skeletal muscles excised. They were subsequently killed by decapitation, and trunk blood was collected for the measurement of total T3 serum concentrations by radioimmunoassay (RIA; Diagnostic Products Corporation, Llamberis, United Kingdom). The heart was removed for ventricular weight (VW) measurement.
The experimental protocol conformed with ethics principles in animal research adopted by the Brazilian College of Animal Experimentation and was approved by the local Ethics Committee for Animal Research (#16/04). The effectiveness of the treatments in the different experimental groups was evaluated by determining the T3 serum levels by RIA, using a standard curve prepared by adding different concentrations of T3 in iodothyronine-free rat serum and by the ratio between the VW and BW (4,14,20).
Evaluation of SLC2A4 gene expression
The GLUT4 mRNA and protein expression in SOL and EDL muscles was evaluated by Northern and Western blot, respectively.
Northern blot analysis
Total RNA was extracted by the guanidinium thiocyanate–phenol–chloroform method, electrophoresed, transferred to a nylon membrane, and subjected to Northern blotting analysis, as described (21 –24). The results were expressed as mean±standard error of mean (SEM) of GLUT4 mRNA/18S rRNA ratio.
Western blot analysis
The SOL and EDL muscles were homogenized in 10 mM Trizma, 1 mM EDTA, and 250 mM sacarose buffer. The homogenate was subjected to specific centrifugations for subcellular fractionation, in agreement with Yonemitsu et al. (25), with little modifications (18). Immunoblotting of the tissue protein extracts was performed using anti-GLUT4 antiserum (1:3000 Polyclonal Rabbit Raised Anti-GLUT4, AB1346; Chemicon International, Inc., Temecula, CA) in 8% BSA/PBS solution, according to the manufacturer's recommendations. Immunoblotting of SOL protein extracts was also performed using anti-Na+/K+ ATPase antiserum (1:5000 Polyclonal Rabbit Raised Anti-Na+/K+ ATPase; Upstate Biotechnology, Lake Placid, NY) as a control of subcellular fractionation procedure.
The band detection was performed using secondary peroxidase-conjugated antibody (1:10,000; Santa Cruz Biotechnology, Santa Cruz, CA) and the Enhanced Chemiluminescence kit (Amersham Biosciences, Buckinghamshire, United Kingdom). Blots were analyzed with Scion Image (Scion Corp., Frederick, MD). Results were expressed as arbitrary units (AU).
Considering the total protein yield of each subcellular membrane fraction (PM and M) and the respective tissue weight, PM, and M GLUT4, protein per gram of tissue was calculated (AU/g tissue); the sum of these data was considered as the total GLUT4 content per gram of tissue. The GLUT4 translocation index (%) was then calculated as indicated: ([100 × PM GLUT4]/[PM GLUT4+M GLUT4]) (18).
Evaluation of GLUT4 mRNA poly(A) tail length
Measurements of the GLUT4 and Cyclophilin mRNA poly(A) tail length from SOL and EDL muscles of SO, Tx, and T3 30′ (100 μg/100 g BW, i.v.) groups were performed by a rapid amplification of cDNA ends–poly(A) test (RACE-PAT), according to a standard protocol (24,26). Amplicon sizes were estimated by densitometry and compared with a 100-bp DNA ladder (Invitrogen Life Technologies) using the ImageMaster 1D-Pharmacia Biotech SW software (Pharmacia Biotech). The top of the smear indicated the longest amplified fragment, which represents the poly(A) tail size plus 100 bases upstream, according to the GLUT4 primer used. Cyclophilin was used as an internal control.
ITT and blood glucose disappearance rate determination
Rats were deprived of food for about 2 hours, anesthetized, and received an i.v. injection of regular insulin (0.75 U/kg BW, i.v.). Glucose blood levels were measured in samples obtained from the tail vein using a glucometer (Precision QIR®; Mediense Products) at 0 (T0), 4 (T4), 8 (T8), 12 (T12), and 16 (T16) minutes after insulin injection (23). The values obtained were used to calculate the kITT using the linear regression of the neperian logarithm of the blood glucose values obtained from 0 to 16 minutes with ITT (23).
Statistical analysis
The data were subjected to one-way analysis of variance, followed by the Student–Newman–Keuls post-test, and were expressed as means±SEM. Differences were considered significant at p<0.05.
Results
The effectiveness of thyroidectomy and T3 treatment of all groups was checked by determining the serum T3 concentrations. This was at least one-third lower (0.13±0.01 vs. 0.34±0.07 ng/mL, p<0.001) and two–fold higher (0.73±0.10 vs. 0.34±0.07 ng/mL, p<0.001) in T3-treated Tx rats, respectively, than those of the SO group. This was also indirectly monitored by checking the ratio between VW and BW. This was decreased (0.23±0.01 vs. 0.27±0.02, p=0.05) in Tx rats and increased (0.4±0.02 vs. 0.27±0.02, p<0.001) in T3-chronic rats when compared with the SO group. These data confirm the induction of hypo- and hyperthyroid states in our experimental groups.
Effect of thyroid state on GLUT4 mRNA and protein expression
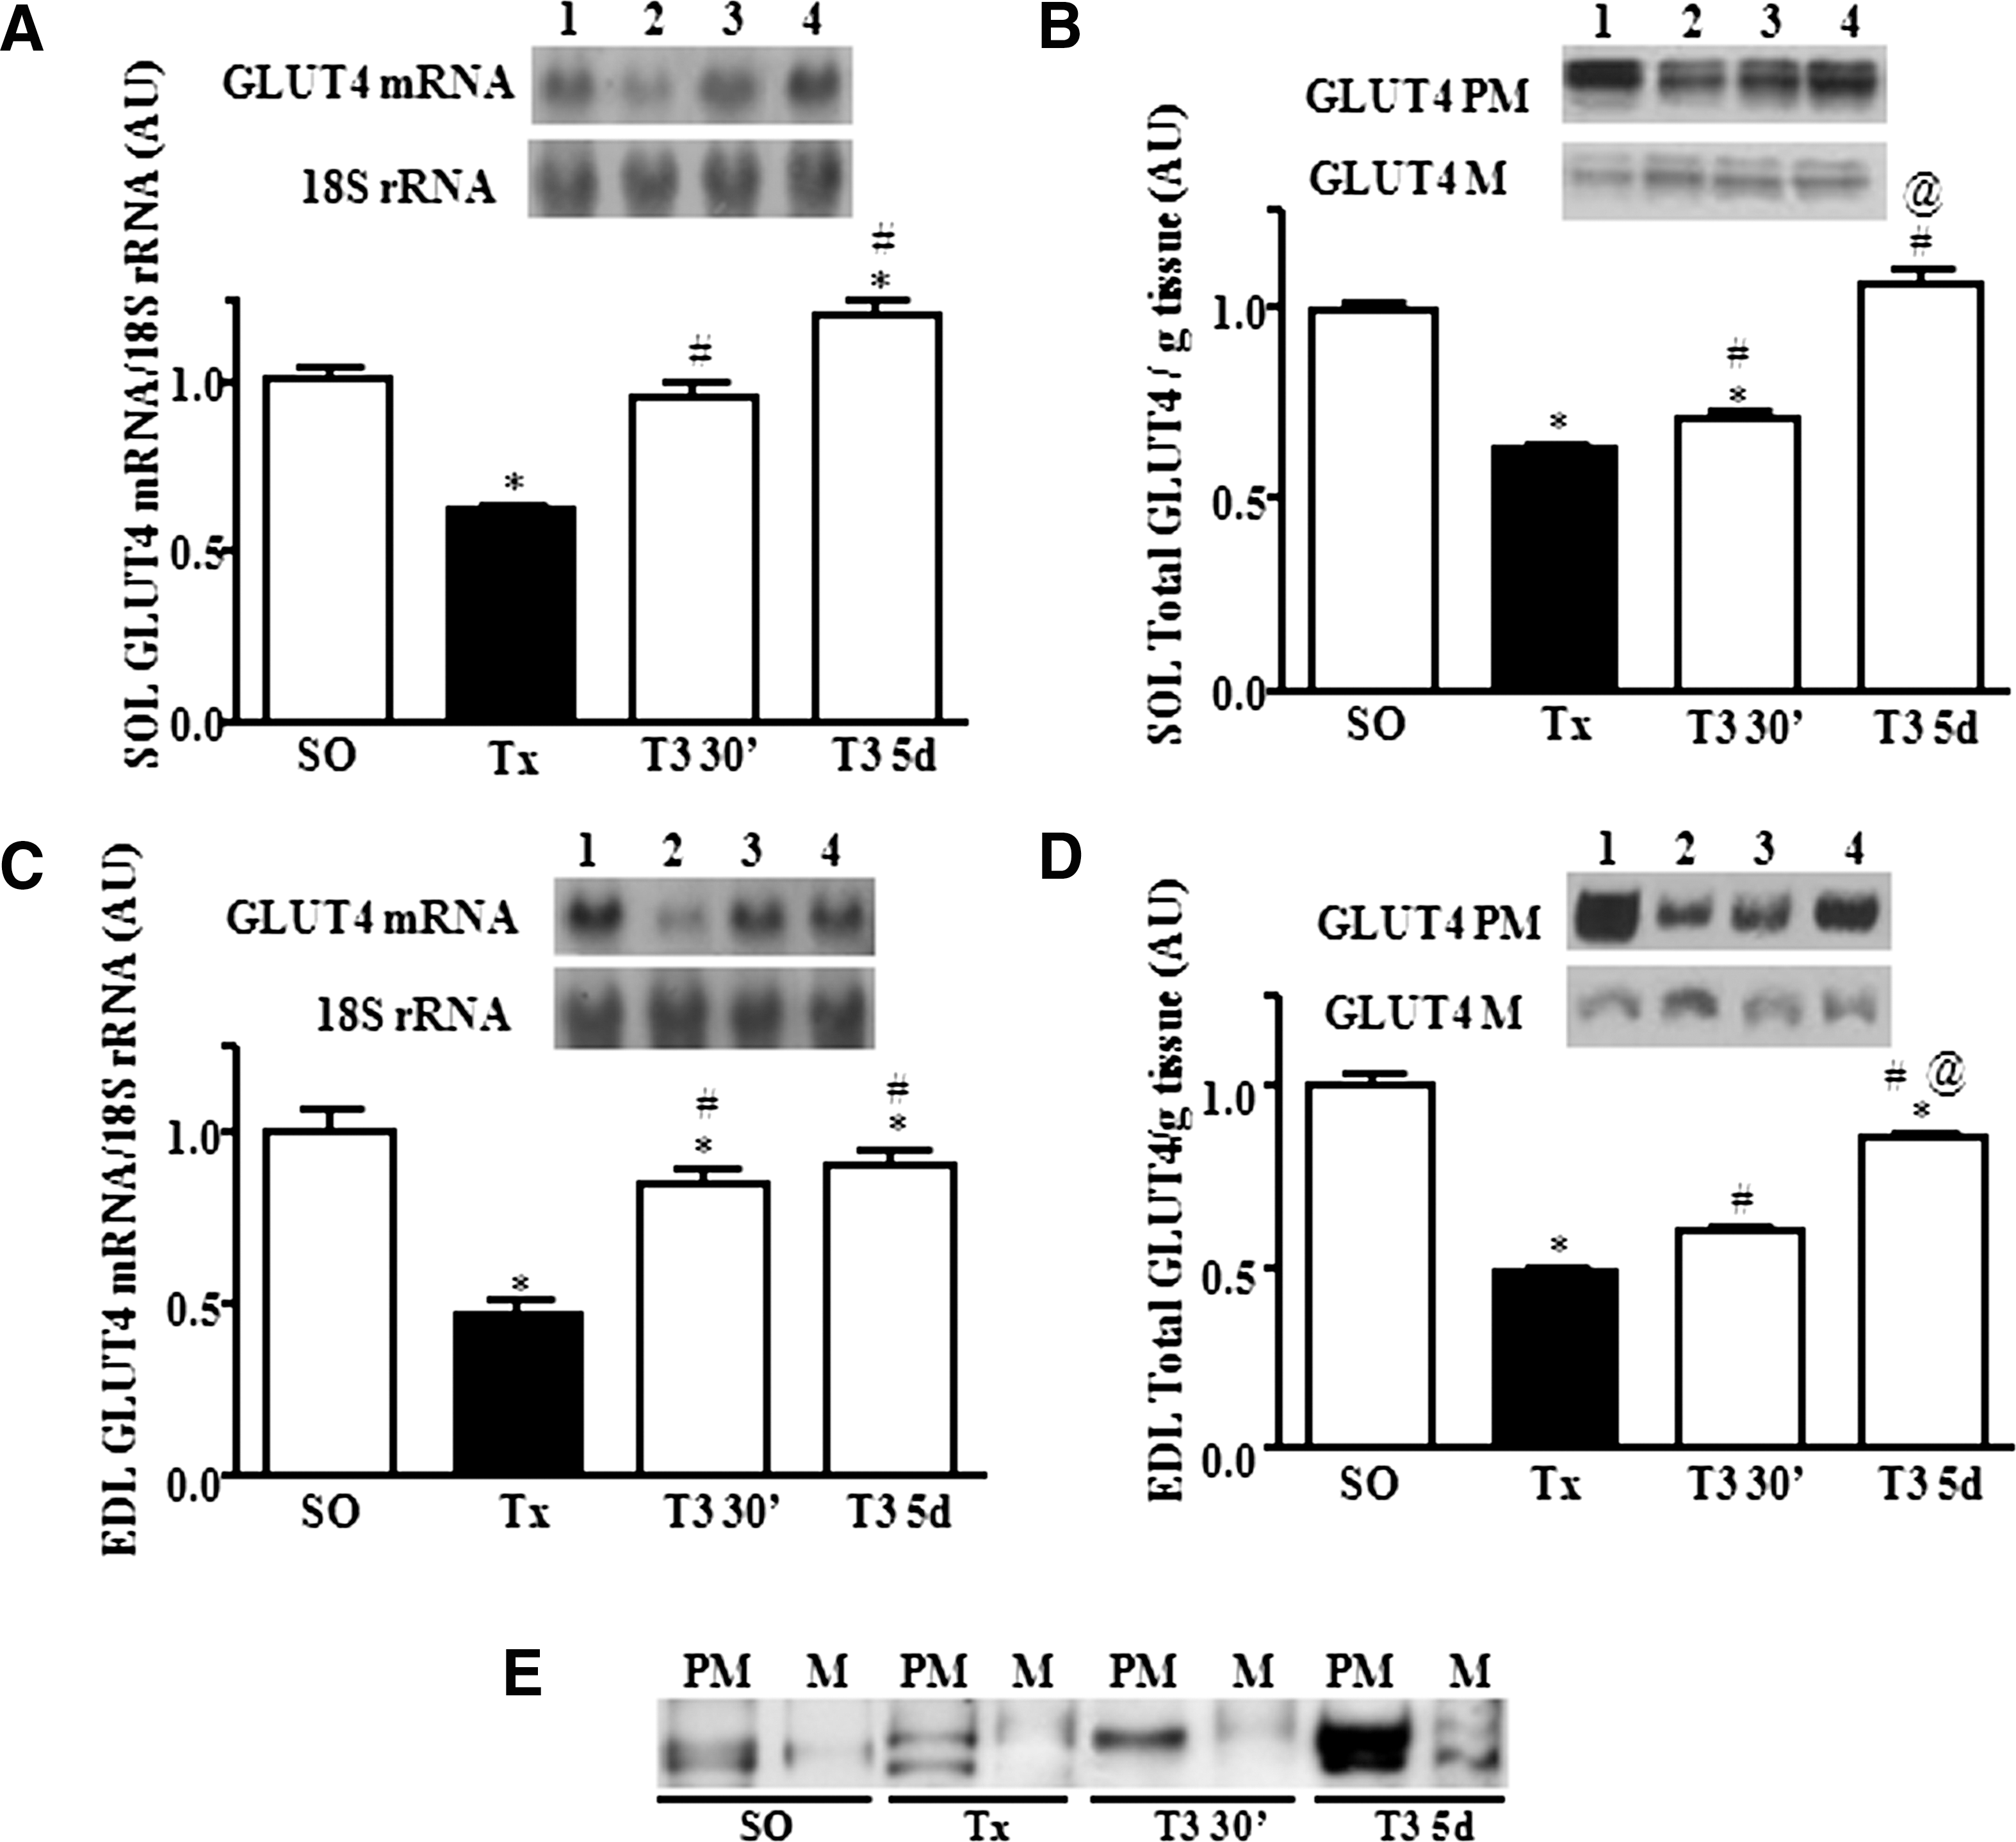
The data presented in the Figure 1 were obtained from experiments that aimed at characterizing a rapid-onset (30 minutes) action of T3 (T3 30′ [100 μg/100 g] vs. Tx and SO groups), supposedly triggered by a nongenomic mechanism, and compare it with the chronic (5 days) actions of T3, recognized as genomic (Tx and T3 5 days [5 μg/100 g] vs. SO groups) on GLUT4 mRNA and protein expression in SOL and EDL muscles. A and B represent SOL, while C and D represent the EDL muscles.
Northern blot analysis of
A significant reduction of GLUT4 mRNA content was observed in Tx rats in both muscles versus SO rats, and an increase after T3 treatment (30 minutes and 5 days) versus Tx (Fig. 1A, C). However, while in the SOL muscle the GLUT4 mRNA content was restored to values in the SO group after acute T3 treatment, and rose above them in chronic T3-treated rats (Fig. 1A), in the EDL muscle, the GLUT4 mRNA increase did not achieve SO values, after either T3 treatment schedules (Fig. 1C).
The data regarding total GLUT4 protein expression (M+PM) in SOL and EDL muscle of Tx rats subjected to the same T3 treatment schedules are presented in Figure 1B and D, respectively. Thyroidectomy caused a significant reduction of total GLUT4 protein content in both SOL and EDL muscles versus the SO group. However, 30 minutes after T3 treatment (100 μg/100 g BW, i.v.; T3 30′ group), the SOL and EDL muscle total GLUT4 content increased versus the Tx group, although remaining lower than values in the SO group. When Tx rats were subjected to chronic T3 treatment
T3 effect on GLUT4 mRNA poly(A) tail length
The analyses of GLUT4 (left side) and cyclophilin (right side) mRNA poly(A) tail length carried out in SOL and EDL muscles of SO, Tx, and T3 30′ rats are presented in Figure 2A and B, respectively. The polymerase chain reaction-amplified mRNAs appeared as a smear indicating that there were a mixture of GLUT4 mRNA with different poly(A) tail lengths. Thyroidectomy reduced the SOL and EDL GLUT4 mRNA poly(A) tail length by ∼100 adenylate residues and acute T3 treatment promptly increased it, although only the SOL of T3-treated Tx rats reached values in the SO group. Cyclophilin mRNA poly(A) tail length was not altered by these treatments.
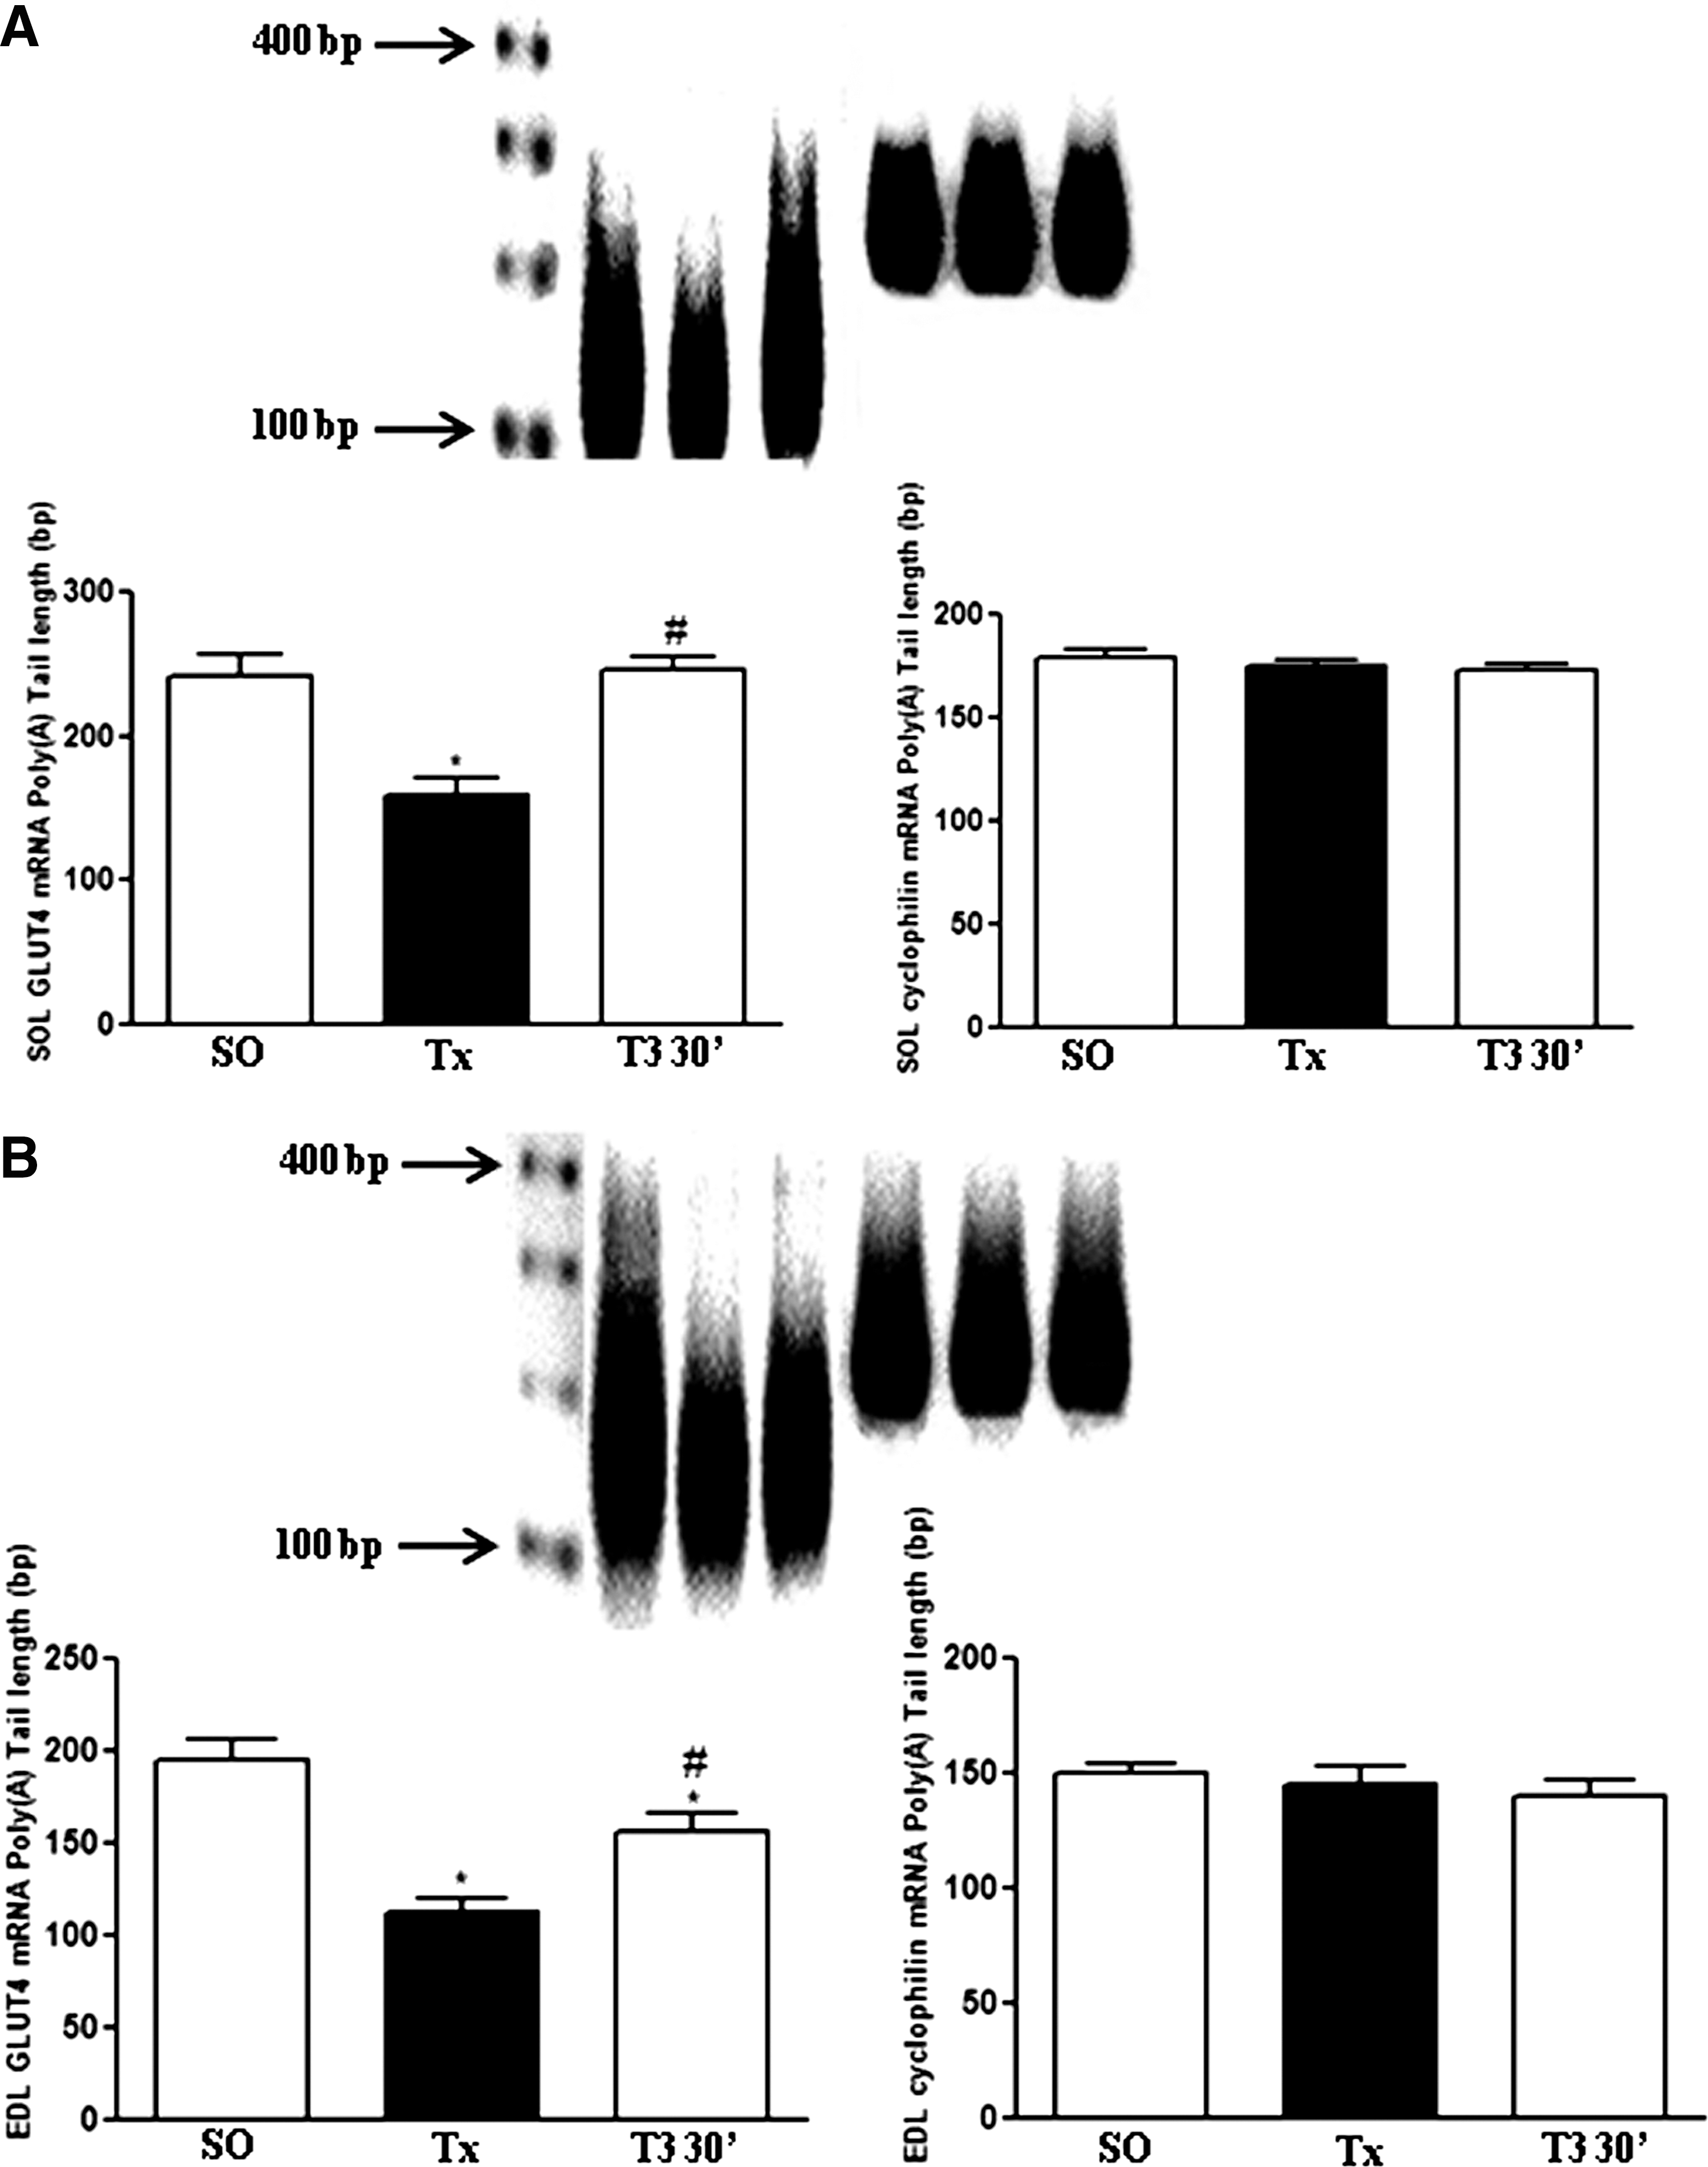
GLUT4 and cyclophilin mRNA poly(A) tail length analyzed by rapid amplification of cDNA ends–poly(A) test (RACE-PAT) assay, in
Time–course and dose–response studies of the T3 effects on GLUT4 protein expression
The GLUT4 protein expression of SOL and EDL muscles excised from Tx rats subjected to (i) 100 μg of T3/100 g BW, i.v., and killed 10, 20, and 30 minutes thereafter, or (ii) 0.3 and 1.5 μg of T3/100 g BW, i.v., and killed 30 minutes later is shown in Figure 3, in which 3A and B represent the time–course study, and 3C and D, the dose–response study. Thyroidectomy caused a significant reduction of total GLUT4 protein content in both muscles. However, 30 minutes after T3 treatment (100 μg/100 g BW, i.v.; T3 30′ group), the SOL and EDL muscle total GLUT4 content increased, as shown in Figure 3A1, and B1, even though remaining lower than the values in SO rats. The GLUT4 content also increased in EDL muscle when Tx rats were killed 20 minutes after treatment with the same dose of T3 (T3 20′ group; Fig. 3B1). No changes of GLUT4 content in SOL and EDL were detected when the animals were killed 10 minutes after T3 treatment (T3 10′ group) or when Tx rats were treated with physiological doses of T3 and killed 30 minutes later (T3 0.3 group; Fig. 3C1, D1). However, the administration of T3 in a dose five times higher than the physiological one led to an increase of GLUT4, which was restricted to SOL muscle (T3 1.5 group; Fig. 3C1). The amounts of GLUT4 measured in the PM and M fraction in SOL and EDL muscles of rats subjected to the experimental conditions just indicated are presented in the same Figure 3. This shows a significant decrease of the SOL and EDL PM GLUT4 content in the Tx group versus the SO group. Figure 3A2 and A3 shows that T3 acutely increased PM GLUT4 and decreased M GLUT4 content in SOL muscle, in 20 minutes (T3 20′ group), an effect that was observed in EDL muscle only 30 minutes after T3 treatment (T3 30′ group; Fig. 3B2, B3). No changes were detected in PM GLUT4 after T3 treatment for 10 minutes. Figure 3C2 and D2 shows that whereas the amount of PM GLUT4 increases, the M GLUT4 decreases (Fig. 3C3, D3) in SOL and EDL muscle after treating Tx rats, with 1.5 μg of T3/100 g, for 30 minutes. These alterations in PM and M GLUT4 content were also observed in Tx rats treated with physiological doses (0.3 μg/100 g BW), but only in the EDL muscle.

Western blot analysis of GLUT4 protein in
T3 effect on GLUT4 translocation index
The translocations of GLUT4 measured as the percentage of total GLUT4 present in the PM in SOL and EDL muscles of rats are presented in Figure 4 (A–C). The figure shows that there was a significant decrease of GLUT4 (%) in the PM in SOL and EDL muscles in the Tx group versus the SO group. Figure 4A, which compares the acute (100 μg/100 g, BW, i.v., 30 minutes) versus the chronic (5 μg/100 g, BW, i.p., 5 days) effects of T3, shows that the T3 treatment increased the SOL and EDL PM GLUT4 content (%), but only the latter schedule restored the percentage of GLUT4 in PM to control (SO group) values. Figure 4B shows that acute T3 treatment led to an increase of PM GLUT4 content in SOL muscle within 20 minutes (T3 20′ group), an effect that was observed in EDL muscle only 30 minutes after T3 treatment (T3 30′ group). No changes were detected in PM GLUT4 content 10 minutes after T3 treatment. Figure 4C shows that the percentage of PM GLUT4 increases in SOL and EDL muscle after treating Tx rats for 30 minutes with 1.5 μg of T3/100 g. The administration of physiological doses of T3 (0.3 μg/100 g BW) induced this alteration only in EDL muscle.
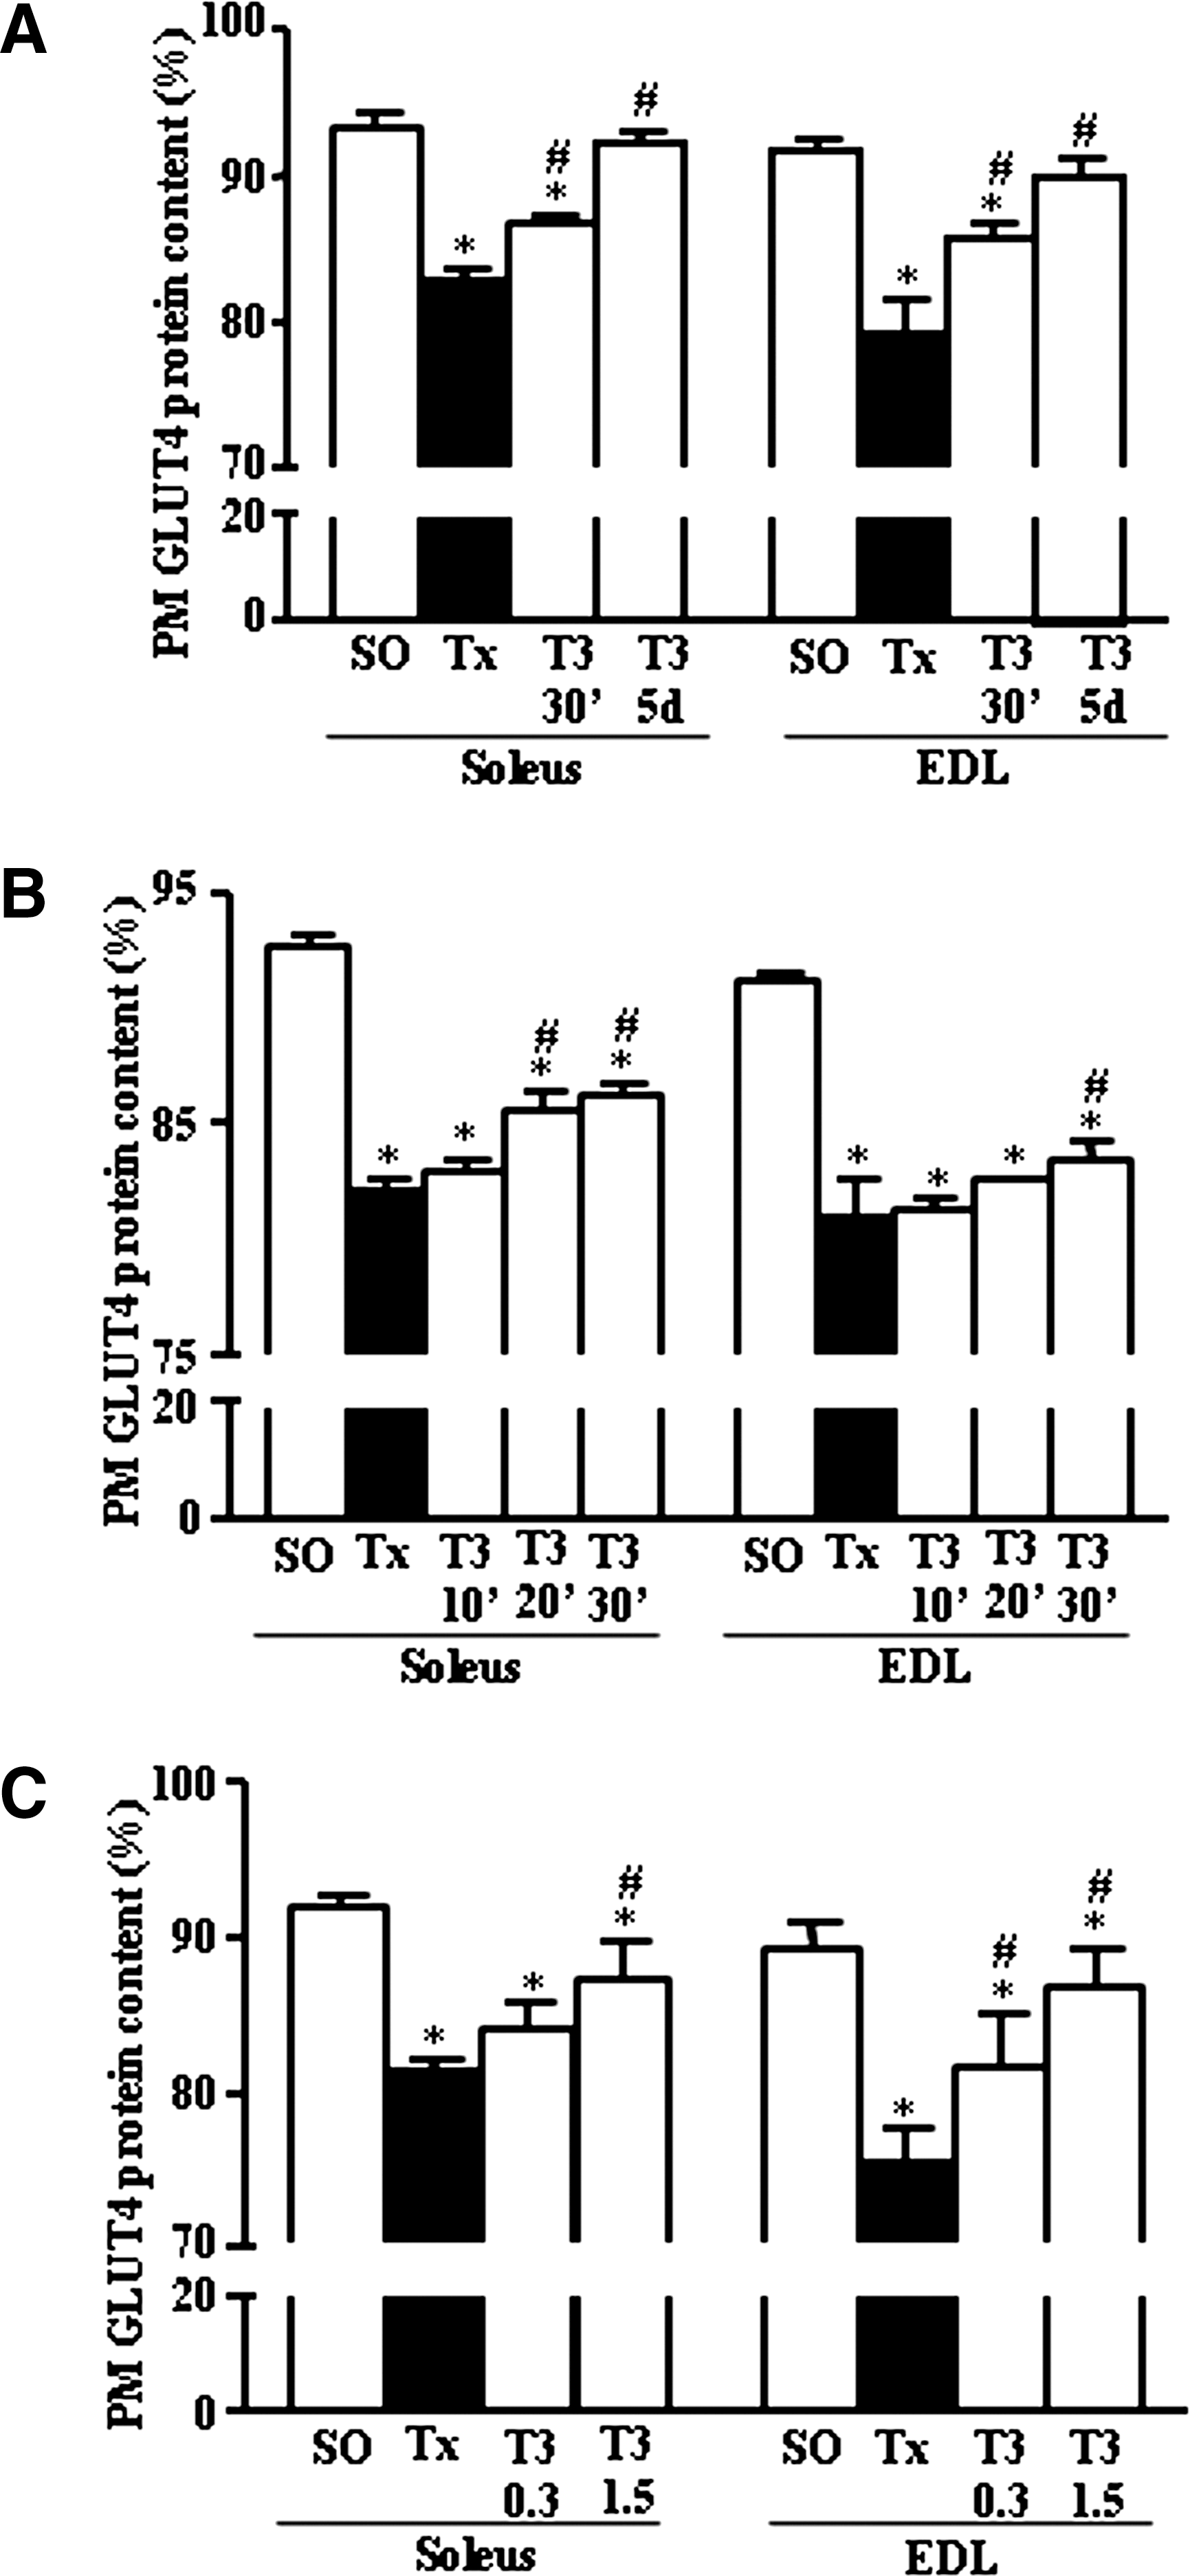
Graphic representation of the amount (%) of total GLUT4 protein detected in the PM (Western blotting) of SOL and EDL muscles at the moment of tissue harvesting. Results are expressed as mean ± SEM of GLUT4 content in PM (%).
T3 effect on insulin sensitivity
The blood glucose decay rates (%/min) of control (SO), Tx, and rats treated with T3 acutely or chronically, after insulin challenge (kITT), are shown in Figure 5. kITT was decreased in Tx rats. Acute and chronic T3 treatment increased kITT; however, only the Tx rats subjected to chronic T3 treatment achieved the SO kITT values.
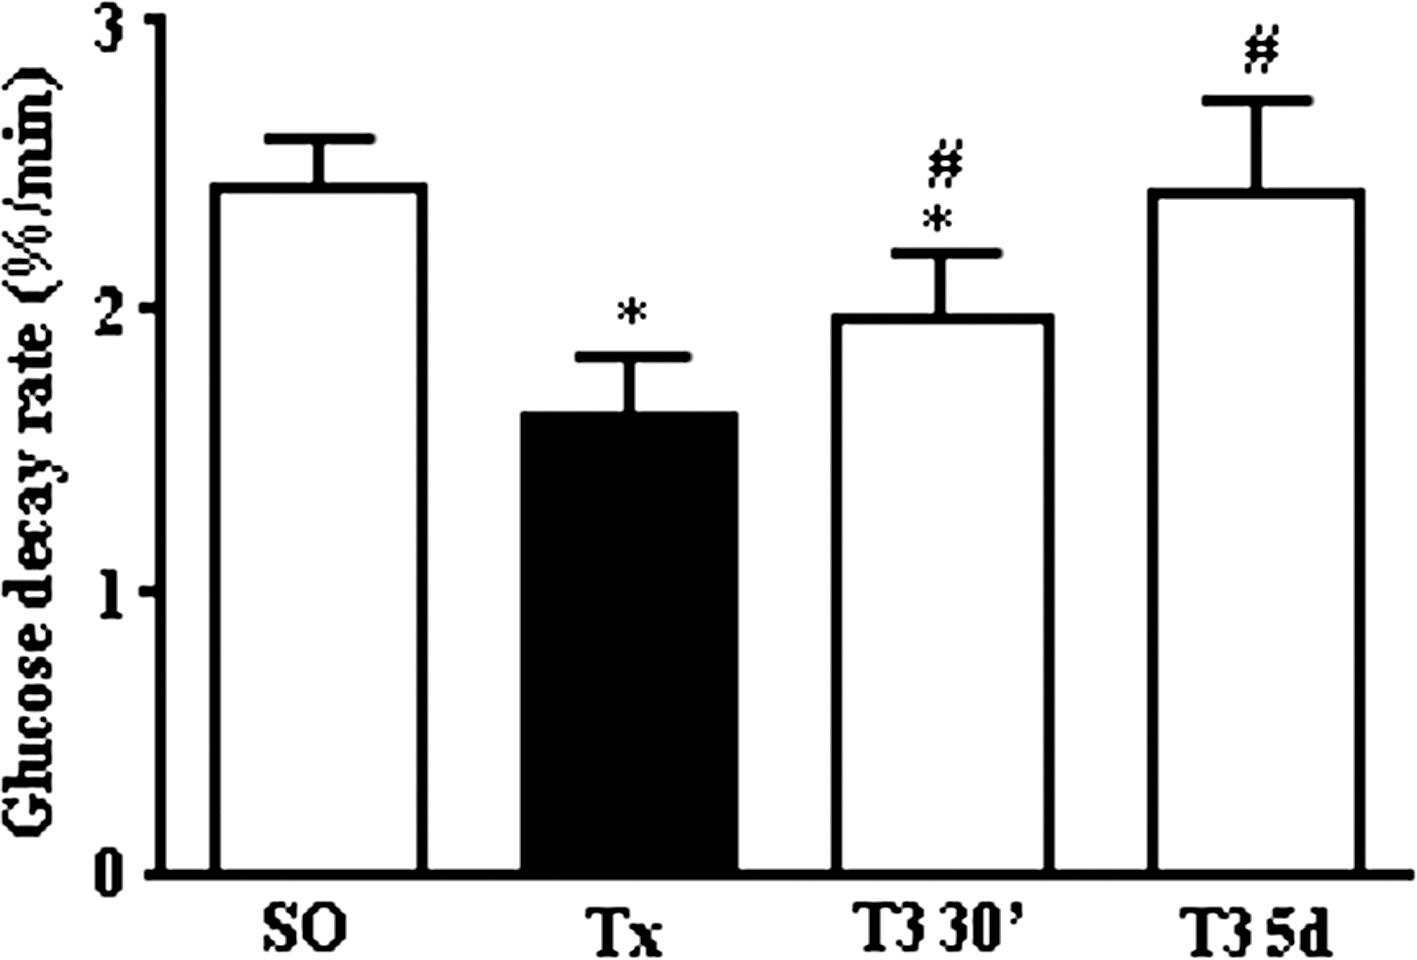
Effect of T3 treatment on insulin sensitivity. Glucose decay rate (kITT; %/min) was evaluated by means of insulin tolerance test (ITT) in SO rats (SO); Tx rats (Tx); Tx rats treated with 100 μg of T3/100 g BW, i.v., and killed 30 minutes thereafter (T3 30′); and Tx rats treated with 5 μg of T3/100 g BW, i.p., for a 5-day period (T3 5d). Results are expressed by mean ± SEM. *p < 0.05 versus SO, # p < 0.05 versus Tx (n = 10 per group).
Discussion
Our data indicate that GLUT4 mRNA and protein content, and total GLUT4 content in the PM fraction are reduced in skeletal muscle of hypothyroid rats and that these changes can be reversed by T3. This supports the concept that thyroid hormones participate in the maintenance of glucose homeostasis.
The increased GLUT4 mRNA and protein content in the T3-chronic group is likely consistent with previous data that show a transcriptional action of T3 upregulating the SLC2A4 gene expression (5,27).
In studies to evaluate rapid-onset responses to T3 administration, the increase of GLUT4 mRNA and protein content, observed as soon as 30 minutes after T3 administration, was a novel and unexpected finding. This does not appear to be related to effects of T3 and its receptor on the TRE present in the promoter region of the SLC2A4 gene; this TRE has been characterized as having a low affinity for TR binding (9).
It is supposed that higher-affinity TREs are under active repression by unoccupied heterodimers and/or homodimers and are highly responsive to thyroid hormone. As a consequence, they would be extremely sensitive to changes of T3 availability. In contrast, low-affinity TRE(s) would be less sensitive to changes of T3 availability; nevertheless, under certain conditions, they are up-regulated to some degree, and they may also predominate in genes that need to be constitutively expressed, such as the SLC2A4 gene (9). Therefore, the rapid increase of GLUT4 mRNA and protein expression 30 minutes after T3 administration strongly indicates that, rather than an induction of the SLC2A4 gene transcription rate, the acute T3 treatment may have increased GLUT4 mRNA stability and/or half-life, unless these effects were mediated by a high-affinity TRE that has not yet been identified in the SLC2A4 gene. However, the rapidity of the T3 effects would not account for its interaction with high- or low-affinity TRE, which favors the hypothesis that they resulted from a nongenomic action of T3.
The stability of an mRNA is directly related to its poly(A) tail length, with a longer poly(A) tail often being associated with enhanced translation efficiency (24,28). This is related to the fact that the mRNA poly(A) tail binds the Poly(A)-binding protein (PABP), which interacts with an α-CP protein, forming an α-complex that inhibits poly(A) deadenylation (29). It is known that the progressive addition of 15–20 adenylate residues to the poly(A) tail increases the number of PABP monomers bound, which progressively increases the translation response. PABP also associates with translation initiation factors, favoring the interaction of the poly(A) tail with the mRNA 5′-cap structure (30,31), thus playing an important role in translation initiation.
It was significant to note that in the current study the length of the poly(A) of GLUT4 mRNA in Tx rats was ∼100 adenylate residues shorter than that of SO rats and that it increased to the length of the SO rats GLUT4 mRNA length 30 minutes after treatment. This finding favors an increase of GLUT4 mRNA stability, and could explain the rapid increase of GLUT4 mRNA and protein content after acute T3 treatment. It also reinforces the hypothesis that T3 has a nongenomic effect in enhancing GLUT4 protein content. Changes in mRNA polyadenylation are post-transcriptional, and the changes noted should enhance intracellular synthesis of GLUT4. Our results are consistent with previous studies showing positive effects of T3 on the poly(A) tail length of a number of other proteins (32,33,28).
Other evidence for a nongenomic effect of T3 is that the relatively low amount of total GLUT4 in the PM fraction of Tx rats increased as soon as 20 minutes after the acute treatment with 100 μg of T3/100 g BW in SOL muscle, and in 30 minutes in both SOL and EDL muscles. An increase of PM GLUT4 was also observed in EDL muscle 30 minutes after Tx rats had been treated with physiological doses of T3 (0.3 μg of T3/100 g BW) and in both muscles 30 minutes after they had been treated with doses of T3 1.5 μg of T3/100 g BW.
GLUT4 translocation and insertion at the surface of insulin-responsive cells involves several steps in which many proteins are activated or inactivated by phosphorylation. The translocation step requires the activation of intracellular signaling pathways initiated by insulin interaction with its receptors at the PM, and further activation of PI3 kinase and protein kinase B (AKT/PKB) pathway. Additionally, PI3-kinase-independent signals involving c-Cbl associated protein, Cbl, and the GTPase TC10 contribute to GLUT4 translocation in adipocytes (7) and skeletal muscle cells (34). After translocation, GLUT4 needs to be inserted into the PM to allow the glucose uptake. Some studies have suggested that this protein needs to be activated, to ensure full stimulation of glucose uptake (35). In skeletal muscle, GLUT4 translocation is also triggered by muscular contraction, which determines the activation of AMP-activated protein kinase (AMPK) pathway and of pathways that involve the calcium-activated calmodulin-dependent protein kinase (CaMK) and/or protein kinase C (PKC) (36).
Considering that acute T3 treatment caused a rapid increase of PM GLUT4, it might be inferred that one of these pathways could have been activated by T3. Such an action remains hypothetical. It is interesting to note, however, that T3 increases calcium and 2-deoxyglucose uptake in several tissues of the rat, including diaphragm and fat (37). Increased intracellular calcium could activate CaMK and/or PKC pathways, leading to GLUT4 mobilization to the PM (36). In addition, D'Arezzo et al. have reported that rapid nongenomic effects of T3 on intracellular pH of L-6 myoblasts are mediated by intracellular calcium mobilization and kinase pathways (38).
Our current study also showed that SOL was more responsive to the effects of T3 on SLC2A4 gene expression and GLUT4 mobilization to the PM than the EDL muscle. This could be secondary to the high GLUT4 expression/availability in slow oxidative muscles, in comparison to fast glycolytic ones (39). With regard to the effects of T3 that occur after its chronic administration, this might be related to the fact that T3 nuclear receptors are highly expressed in oxidative muscles, which might explain the higher GLUT4 mRNA response to chronic T3 treatment in SOL than EDL muscles (40). Moeller et al. have reported that some thyroid hormone-mediated changes in gene expression can be initiated by cytosolic action of the TRβ through the PI3K pathway (41). Therefore, another consideration is whether this action, which is nongenomic, even though it involves a classic T3 receptor, might mediate some of the effects of T3 on GLUT4 translocation in skeletal muscle.
Even though the current study showed a novel nongenomic effect of T3 on GLUT4 mobilization to the PM, we are aware of the fact that the amount of GLUT4 protein appears to be the major determinant of the muscle's ability to respond to insulin (39). In fact, Figure 5 shows in Tx rats a reduced amount of GLUT4 on skeletal muscle and a decreased response to insulin stimulus, findings that have been reported in animal models (42,43) and hypothyroid patients (44,45). It also shows a re-establishment of the insulin response, in rats under 5-day T3 treatment, a procedure that increased the GLUT4 content, as described (5,27). Moreover, the acute T3 administration also improved the Tx rat response to insulin stimulus, a condition in which total GLUT4 was increased, probably as a result of the rapid nongenomic effect of T3 in increasing GLUT4 mRNA poly(A) tail length, which is known to be involved in mRNA stability and translation rate, as already noted (Fig. 2). However, the increased PM GLUT4 content in the Tx rat skeletal muscles detected 30 minutes after T3 administration, in doses five times higher than the physiological one, even in the absence of insulin stimulus (Fig. 3), is a convincing evidence that intracellular signaling pathways responsible for GLUT4 mobilization to the PM were nongenomically turned on by T3.
Even though there is a slight increase in GLUT4 at the PM fraction in response to acute T3 administration, the impact on glucose uptake may be significant, as depicted by the kITT shown in Figure 5, because skeletal muscle represents 40% of the total body mass. However, we cannot assure that docked GLUT4-containing vesicles were actually fused to the PM. The increased blood glucose decay rate in T3-treated rats indicates this possibility. However, we cannot rule out the hypothesis that T3 could be activating GLUT4 molecules already present in the PM, in parallel to the effects on GLUT4 trafficking to the PM, which would improve glucose uptake, as already reported for insulin activity (35).
In conclusion, the present results confirm the transcriptional action of T3 on the SLC2A4 gene, and reveal a rapid, T3-mediated post-transcriptional effect on GLUT4 mRNA polyadenylation. This is likely to increase GLUT4 mRNA stability and translational efficiency. T3 also rapidly increases GLUT4 trafficking to the PM. Thus, T3 has effects that should rapidly improve insulin sensitivity in muscles. Studies are required to determine the intracellular pathways that mediate the rapid effects of T3 on GLUT4 mRNA polyadenylation and translocation of GLUT4 to the PM.
Footnotes
Acknowledgments
The authors are grateful to Leonice L. Poyares for excellent technical assistance and to Dr. Luiz R. G. Britto for reviewing the article.
Disclosure Statement
No competing financial interests exist.