
Abstract
Background:
MicroRNA (miR) expression signatures are proposed to be able to differentiate thyroid cancer from benign thyroid lesions. We selected eight miRs (miR-146b, -221, -187, -197, -346, -30d, -138, and -302c) to examine the potential use of miRs to supplement diagnostic cytology in cases designated as “atypia of undetermined significance.”
Methods
Results:
A set of four miRs (miR-146b, -221, -187, and -30d) was identified that could differentiate malignant from benign lesions. A four-miR LDA classification rule was obtained and used to predict FNA cases as benign or malignant. For the training sample set, we obtained a diagnostic accuracy of 93.3%, sensitivity of 93.2%, specificity of 93.8%, positive predictive value (PPV) of 0.98, and negative predictive value (NPV) of 0.83. For the validation sample set, we obtained a diagnostic accuracy of 85.3%, sensitivity of 88.9%, specificity of 78.3%, PPV of 0.89, and NPV of 0.78. For the 30 atypia cases in the validation sample set, we obtained a diagnostic accuracy of 73.3%, sensitivity of 63.6%, specificity of 78.9%, PPV of 0.64, and NPV of 0.79. Based on the miR predictions, we classified the atypia cases predicted as “malignant” into “high risk” and those predicted as “benign” into “low risk” categories. While thyroid carcinomas, particularly papillary thyroid carcinomas (PTCs), were relatively enriched in the high-risk category, this particular miR panel is subject to inaccurate results in follicular neoplasias in atypia cases.
Conclusions:
We demonstrate that miR amplification from FNA samples is feasible and that the particular four miR profile in this study can identify PTCs. However, further refinement is required for application to FNA cytology of “atypia of undetermined significance” cases due to low accuracy in classifying follicular neoplasias.
Introduction
Although FNA cytology by experienced cytopathologists enables accurate identification of most thyroid lesions, it can not accurately distinguish follicular lesions as malignant or benign. Follicular lesions account for 20–30% of all thyroid nodules (3
–5). Common histologic diagnoses that may present cytologically as follicular lesions include nodular hyperplasia (NH), follicular adenoma (FA), follicular variant of papillary thyroid carcinoma (fvPTC), and follicular thyroid carcinoma (FTC). In 2007, the National Cancer Institute Thyroid FNA State of the Science Conference (
MicroRNAs (miRs) are small RNA sequences (19–25 nucleotides) that function to regulate the expression of genes. Several lines of evidence indicate that aberrant miR expression profiles are able to separate thyroid cancers from benign thyroid lesions and normal thyroid tissue, suggesting that miRs may have potential use as a diagnostic tool in thyroid pathology (16 –25). We had previously used microarray expression profiling to characterize deregulation of miR expression in fresh snap-frozen PTC samples and identified a panel of miRs upregulated in PTCs, including miR-146b, -221, and -222 (16). In this study, we sought to identify a panel of miRs that would separate benign from malignant pathologies on FNA samples and then apply that panel toward samples with an FNA diagnosis of atypia.
Materials and Methods
This study was approved by the Institutional Review Board at The Ohio State University. A retrospective examination of FNA cases (n=510, from 2005 to 2010) was performed. Of these, 135 archived FNA specimens with corresponding histological diagnosis were collected for the present study based on the availability of extra slides that had cell clusters consistent with the FNA cytology diagnosis. The FNA diagnosis was reviewed and reclassified using the Bethesda thyroid classification system. One to three slides of Diff-Quik and Papanicolaou-stained smears for each case were collected for RNA preparation. Snap-frozen thyroid tissues (n=6, two normal thyroid tissues, two PTC tumors, and two paired nonaffected thyroid tissues) were obtained for RNA preparation.
RNA extraction and real-time reverse transcriptase–polymerase chain reaction
Total RNA was extracted from snap-frozen thyroid tissues with Trizol Reagent (Invitrogen) according to the manufacturer's protocol. Total RNA from FNA slides and paraffin blocks was extracted based on a modified procedure (26,27). In brief, slides were placed into xylene solution for at least 24 hours. Cells were scraped off the slide with a razor blade and transferred into a tube. Similar xylene treatment was applied to the formalin-fixed, paraffin-embedded (FFPE) tissue samples. Total RNA was extracted with Trizol solution; glycogen was added when precipitating RNA pellets. The RNA concentration and quality was assessed with the NanoDrop 1000 spectrophotometer (NanoDrop Technologies).
The expression levels of mature miRs were measured by real-time quantitative reverse transcriptase–polymerase chain reaction (RT-PCR) using the TaqMan miR assays (Applied Biosystems). Briefly, reverse transcription with 50 ng RNA was performed by multiplexing specific miR primers (Applied Biosystems). U6B snRNA (U6; Applied Biosystems) was included as an endogenous control (17,18,23,28 –30). The amplification was done on ABI 7500 Real Time PCR System (Applied Biosystems). TaqMan assay for miR-146b, -221, -197, -346, and -138 and synthetic RNA oligos (IDT) were included in the same experiments to allow for quantification of amplified miRs. Briefly, the PCR was performed using 50 ng yeast tRNA and spiked with serially diluted synthetic miR (2 nM–0.2 fM). A negative control consisted of 50 ng of nonspiked yeast tRNA only.
Statistical analysis
The open-source R statistical package (
To classify FNA cases into benign or malignant groups, we performed linear discriminant analysis (LDA) to obtain a classification rule. Before performing LDA, we tested the required assumptions for discriminant analysis (34,35). The homogeneity of variance assumption between groups for each miR was tested with Bartlett test (34); multivariate normality assumption of miRs within each group was tested with E-test (35) using R library “energy”; homogeneity of variance covariance matrices assumption of predictor variables within groups was evaluated with Box's M-test (36). The leave one out cross-validation method was used to test the error rate of the classifier. In addition to LDA, multivariate logistic regression classification model was built with the training data set of 60 samples and further tested with a validation set of 68 samples.
Results
Initial analysis of miR expression
As a pilot experiment, we measured the expression levels of miR-197, -138, and -221 and an internal control gene (U6) using TaqMan real-time RT-PCR assay with RNAs extracted from FNA specimens (n=18) and snap-frozen thyroid tissues (n=6, including two normal thyroid tissues, two PTC tumors, and two paired nonaffected thyroid tissues). The real-time PCR Ct values obtained with these samples are shown in Supplementary Figure S1 (Supplementary Data are available online at
Quantitative analysis of miRs in FNA samples
Based on our previous work and the literature (16 –23), we selected eight miRs (miR-146b, -221, -187, -197, -346, -30d, -138, and -302c) to test their potential as molecular markers. The delta Ct method was used to analyze and compare the miR levels. The initial real-time RT-PCR results indicated that Ct of miR-302c was undetectable or >30 in 33/36 (91.7%) of the samples (data not shown). So, we excluded miR-302c from further measurements. The FNA cases were separated into benign or malignant lesions based on their surgical histological diagnosis. For the first set of 60 specimens (training sample set), the benign lesions (n=16) consisted of FA (n=6), Hurthle cell adenoma (HA, n=1), NH (n=8), and nonneoplastic goiter (NNG, n=1). The malignant lesions (n=44) consisted of anaplastic thyroid carcinoma (ATC) (n=3), FTC (n=5), PTC (n=32), and fvPTC (n=4). Normalized Ct values were calculated (delta Ct=Ct of tested miR minus Ct of U6) (Fig. 1). Only four miRs (miR-146b, -221, -187, and -30d) showed significant p-values by nonparametric Wilcoxon Rank sum test (Table 1). Overall, the expression levels of miR-146b, -221, and -187 were significantly higher in the malignant group than the benign group, while the level of miR-30d was significantly lower in the malignant group. For miR-197, -336, and -138, we did not observe significant differences of the expression between benign and malignant lesions. Furthermore, multivariate hypothesis testing using a stepwise forward variable selection method found that a minimal set of discriminating miRs consisted of four miRs (miR-146b, -221, -187, and -30d) (Table 1). The segregation of benign and malignant lesions by these four miRs was visualized by performing a PCA (Fig. 2).
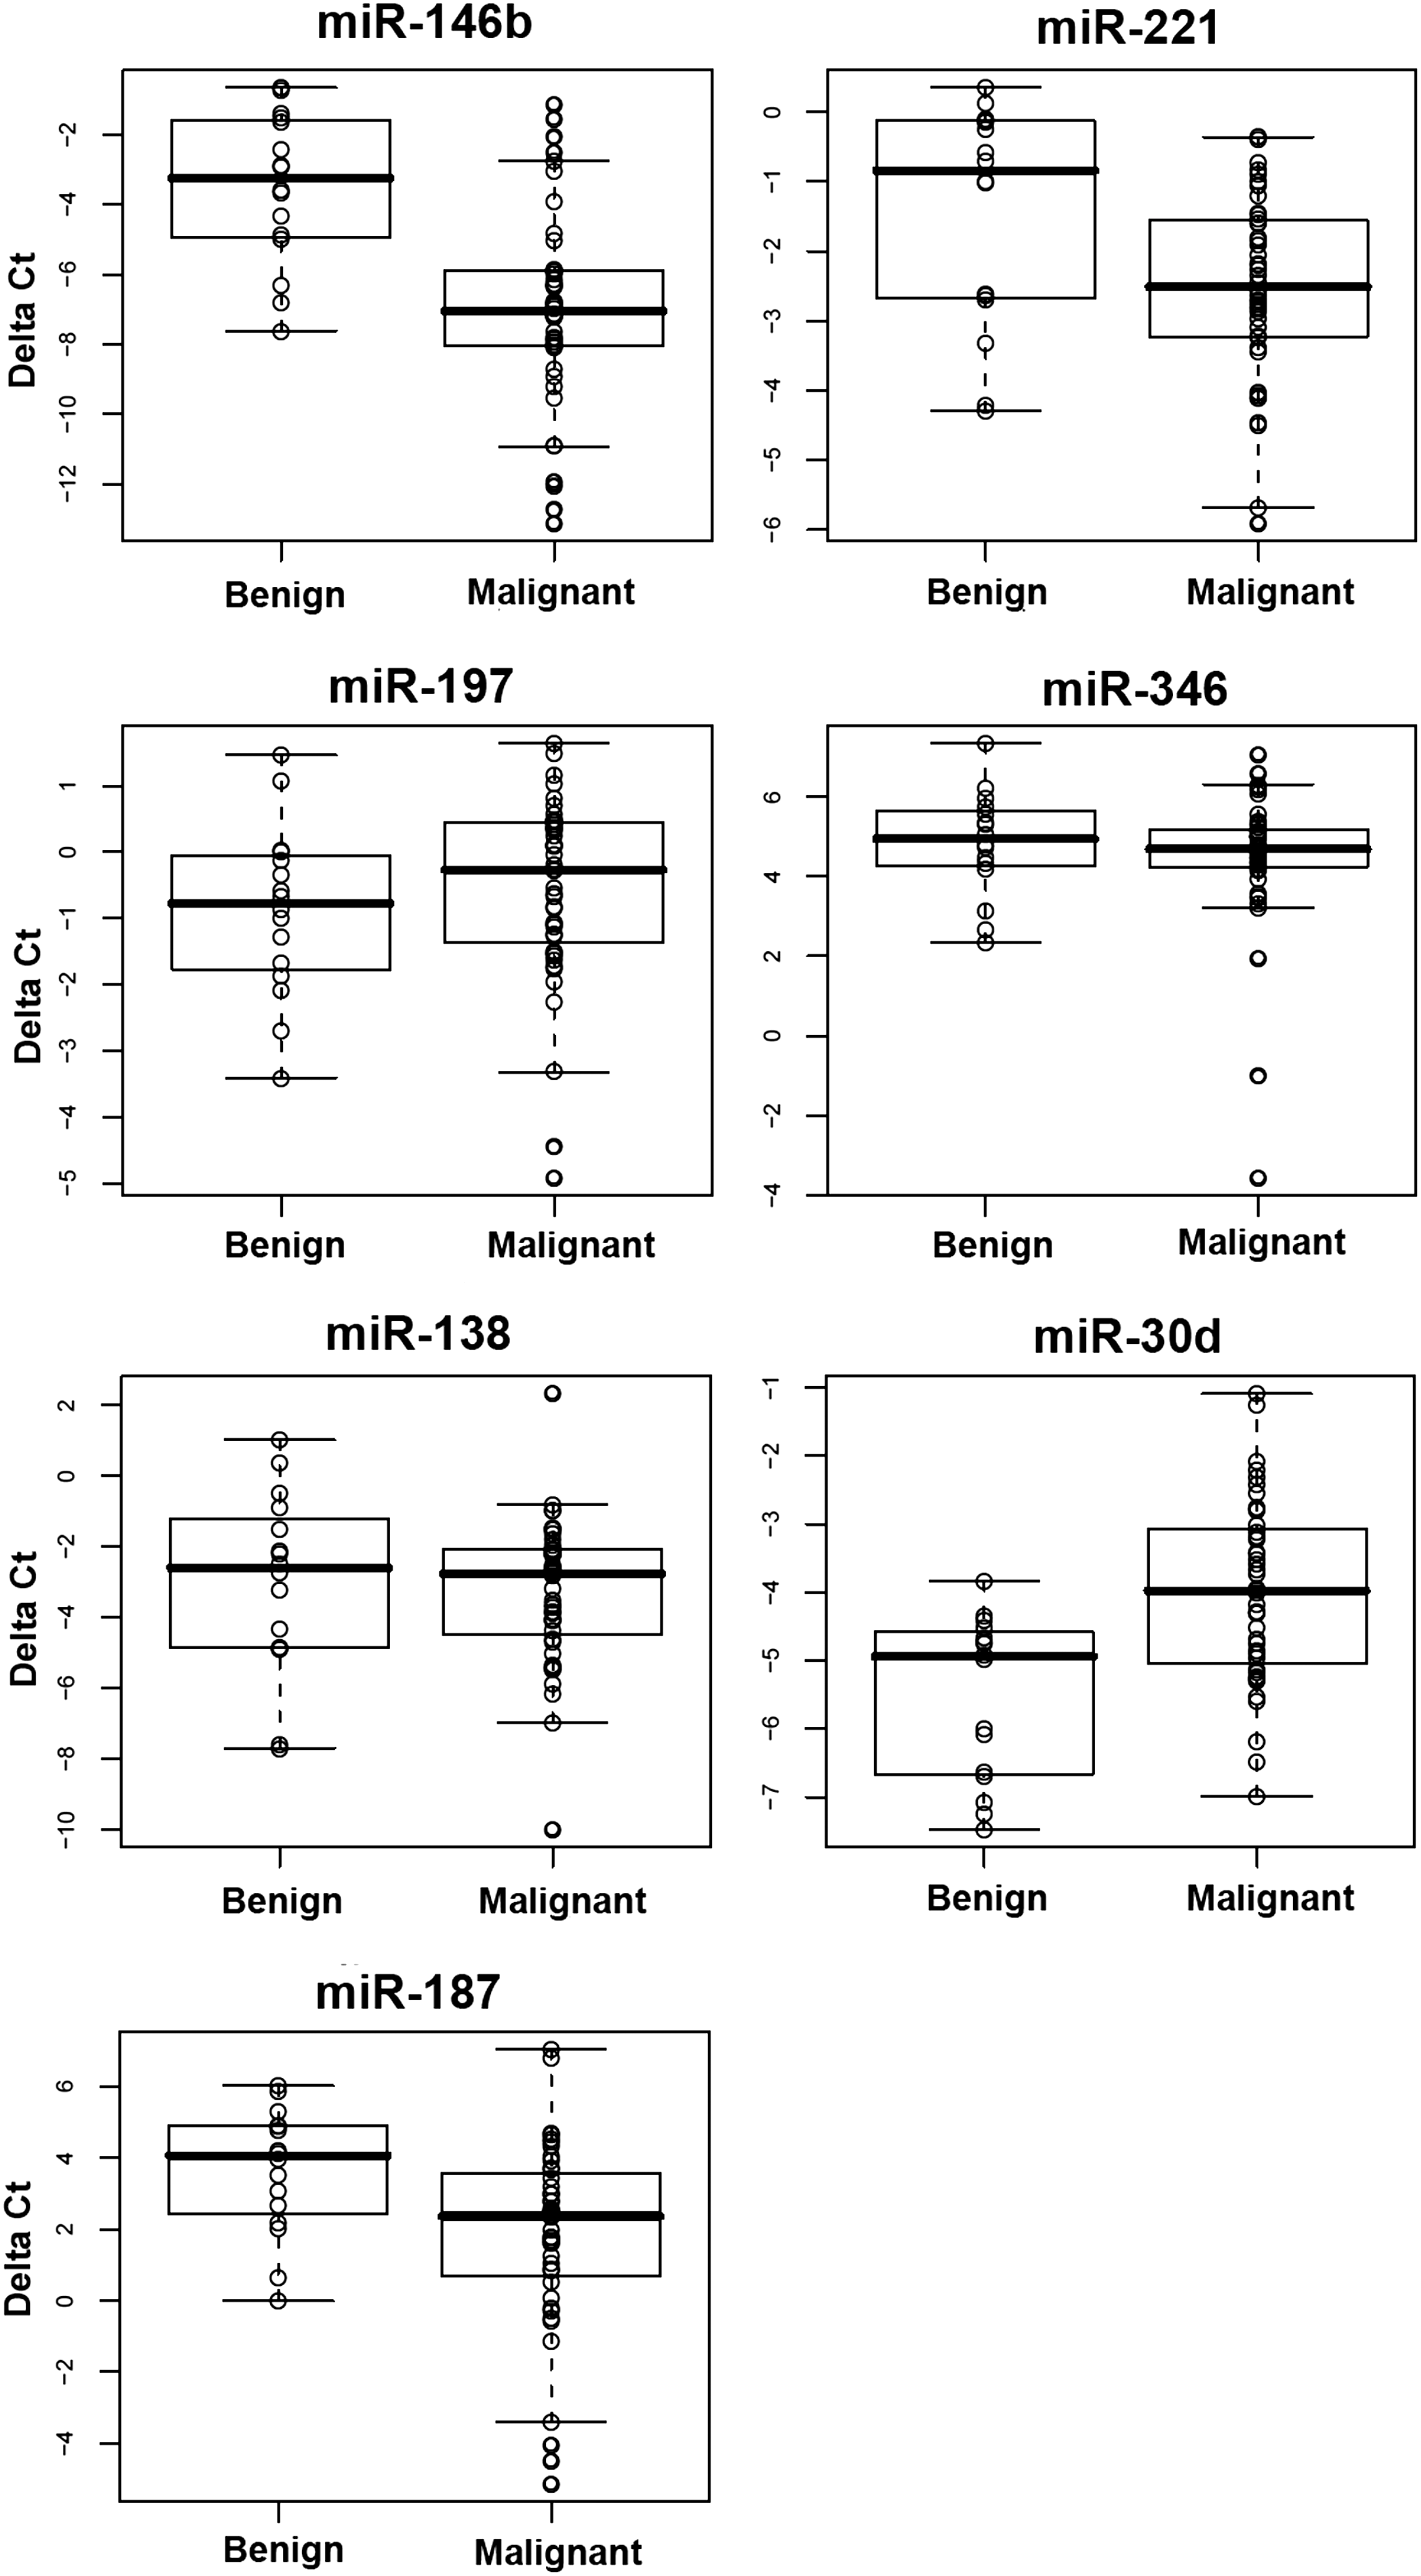
Real-time reverse transcriptase–polymerase chain reaction quantification of seven miRs in 60 cases of thyroid fine needle aspiration specimens. Delta Ct was calculated as follows: delta Ct=Ct of the tested miR minus Ct of U6. Samples were divided into two groups: benign lesions (n=16) and malignant lesions (n=44). miRs, micro
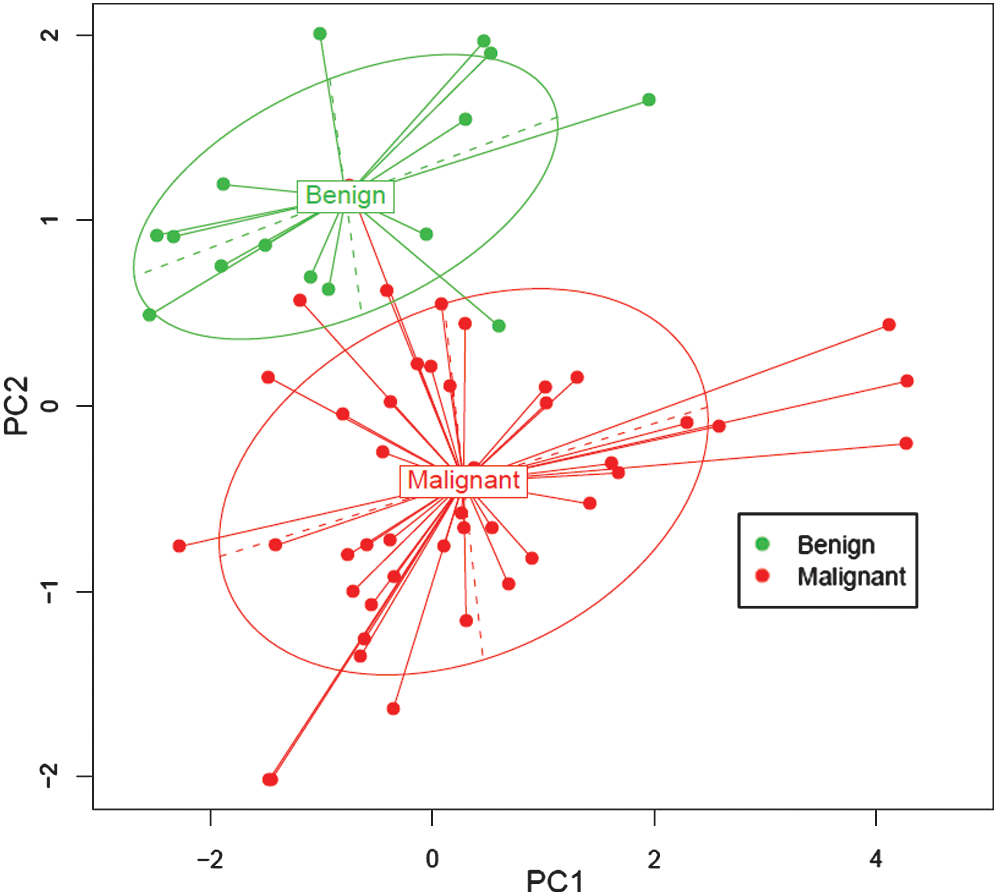
Visualization of the principal components analysis. Samples were plotted with respect to first (PC1) and second (PC2) principal components. Ellipses were drawn to include about 70% of samples in each group.
Nonparametric Wilcoxon Rank sum test.
Stepwise forward variable selection method based on Wilk's lambda criteria.
miR, microRNA.
Using a four-miR classification method to predict FNA cases as malignant or benign
In order to test the potential use of miRs on classifying FNA specimens, we performed LDA with the miR expression data of the four selected miRs and established a discriminating rule to discriminate benign and malignant lesions. Using this four-miR LDA classifier, we predicted each FNA case as benign or malignant for the 60 cases in the training sample set (Supplementary Table S1). Cross-validation was performed by comparing the predictions with the corresponding histological diagnosis. The miR predictions for 56 out of 60 cases were correct; we obtained diagnostic accuracy of 93.3% (95% confidence interval [CI], 83.8, 98.2), sensitivity of 93.2% (95% CI, 81.3, 98.6), and specificity of 93.8% (95% CI, 69.8, 99.8). The positive predictive value (PPV) was 0.98; the negative predictive value (NPV) was 0.83. The mispredicted 4 cases included 1/8 NH, 1/5 FTC, 1/3 ATC, and 1/32 PTC (Table 2).
Specimens were divided into benign or malignant category according to the histological diagnosis.
FA, follicular adenoma; HA, benign Hurthle adenoma; LT, lymphocytic thyroiditis; NH, nodular hyperplasia; NNG, nonneoplastic goiter; ATC, anaplastic thyroid carcinoma; FTC, follicular thyroid carcinoma; fvPTC, follicular variant papillary thyroid carcinoma; PTC, conventional papillary thyroid carcinoma; LDA, linear discriminant analysis.
To further test the miR-LDA method for prediction, we performed a blinded experiment using a second sample set of 68 new cases of thyroid FNA specimens (validation sample set). According to the histological diagnosis, these new cases included 24 cases of benign lesions (FA, n=10; HA, n=3; LT, n=1; NH, n=6; NNG, n=4) and 44 cases of malignant lesions (fvPTC, n=3; FTC, n=8; PTC, n=33). Using the four-miR LDA classification method, we correctly predicted 58 out of 68 (85.3%) cases as benign or malignant, with a diagnostic accuracy of 85.3% (95% CI, 74.6, 92.7), sensitivity of 88.9% (95% CI, 75.9, 96.3), and specificity of 78.3% (95% CI, 56.3, 92.5). The PPV was 0.89; the NPV was 0.78. The mispredicted 10 cases included 3/10 FA, 1/3 HA, 1/6 NH, 3/8 FTC, 1/3 fvPTC, and 1/33 PTC (Table 2).
Overall, the miR prediction method worked reasonably well for PTC cases, with malignant prediction rates of 35/36 (97.2%) and 34/36 (94.4%) in the training and validation sample sets, respectively. The malignant prediction rates for FTC were relatively low, 4 out of 5 (80%) in the training sample set and 5 out of 8 (62.5%) in the validation sample set.
To test the reproducibility of the miR measurement and classification, we repeated real-time RT-PCR of the four miRs in 65 randomly selected specimens (29 from the training sample set and 36 from the validation sample set). We then repeated miR-LDA predictions and obtained completely consistent results (data not shown).
To further evaluate the predictions with the four miRs, we obtained multivariate logistic regression model predictions with the same sets of miR expression data. Overall, the predicted results with the two methods were very similar. For the 60 cases in the training sample set, 57 out of 60 (95%) cases were correctly predicted with logistic regression model. Three cases were mispredicted; two of them were among the four cases which were mispredicted with the LDA method (Supplementary Table S1). For the validation sample set, 58 out of 68 (85.3%) cases were correctly predicted. Among the 10 mispredicted cases, 8 cases were also mispredicted with the LDA method (Supplementary Table S2).
Using the miR-LDA method to classify atypia FNA cases into high-risk and low-risk categories
FNA cytology classified all the specimens into atypia, follicular neoplasm, suspicious, or malignant categories according to the Bethesda system for thyroid cytology (Supplementary Tables S1 and S2) (8). For the 30 atypia cases in the validation sample set, we obtained a diagnostic accuracy of 73.3% (54.1, 87.7), sensitivity of 63.6% (30.8, 89.1), specificity of 78.9 (54.4, 93.9), PPV of 0.64 (0.31, 0.89), and NPV of 0.79 (0.54, 0.94).
To evaluate the potential use of the miR-LDA predictions for the atypia FNA cases, we classified the cases predicted as malignant into high risk and those predicted as benign into low-risk categories (Table 3). The risk of malignancy in each category was estimated according to the histological diagnosis. In the training sample set, 25 cases were classified as atypia. Based on the miR classification results, nine high-risk cases were classified and eight of them were carcinomas, with a risk of malignancy of 88.9%. Among the 16 low-risk cases, only 1 case was a carcinoma, with a risk of malignancy of 6.25% (Table 3). In the validation sample set, 11 atypia FNAs were classified into high-risk and 19 into low-risk categories according to the miR predictions. Among the 11 high-risk cases, 7 cases were carcinomas (3 PTC, 1 fvPTC, and 3 FTC) according to the histological diagnosis, with a risk of malignancy of 63.6%. Among the 19 low-risk cases, 4 cases were carcinomas (3 FTC and 1 fvPTC), with a risk of malignancy of 21.1% (Table 3). Overall, thyroid carcinomas were relatively enriched in the high-risk category, especially for PTC cases, while FTC and fvPTC were equally represented in the high- and low-risk groups.
FNA category was based on the Bethesda system for thyroid cytopathology.
Risk category was based on the miR prediction results. Low risk: predicted as benign; High risk: predicted as malignant.
FNA, fine needle aspiration.
Discussion
In recent years, advances in the analysis of miR expression profiles have been made in various human cancers, including thyroid cancer (37,38). We previously found that PTCs express a distinct miR signature (16). Among the differentially expressed miRs, miR-146b, -221, and -222 were the most highly overexpressed (16). Similar miR signatures in PTC have been observed by several other laboratories (16,17,19,20,23). Our work and that of others indicate that an aberrant miR expression profile can separate PTC from normal thyroid tissue and benign thyroid lesions. In thyroid cancer other than PTC, miR expression profiles have also been reported (18,20 –22); miR-197, -346, -146b, -221, -222, and -187 are reported to be overexpressed in FTC (20,21), while miR-30d and -138 were downregulated in ATC and poorly differentiated carcinoma (18,22). miR-302c showed the most dramatic upregulation in ATC (20). These results suggest that miR expression signatures in thyroid cancer have potential diagnostic value in thyroid pathology (16 –23). Compared with the vast majority of mRNA transcripts, miRs are only 19–25 nucleotides in size (38 –41). The miR molecules are relatively stable in FNA cytology and FFPE tissue specimens, making these small RNA molecules ideal markers for diagnostic applications (37,42). Even though several reports suggest that differentially expressed miRs could be used as molecular markers to discriminate malignancy and benign thyroid lesions, only a small number of FNA specimens have been studied (17,20,25). Nikiforova et al. (20) reported that a set of seven miRs (miR-187, -221, -222, -146b, -155, -224, and -197) could be used diagnostically to detect thyroid cancer in surgical and preoperative FNA samples. In this study, only 13 FNA specimens could be correlated with the histological diagnosis of the excised tumors from the same patients, which limited the evaluation of this set of miRs as a diagnostic tool in FNA. Chen et al. (17) measured six miRs (miR-146b, -221, -222, -146a, -155, and -187) in 20 PTC FNA samples and 20 benign thyroid lesions, and found only miR-146b, -221, and -222 to be able to differentiate PTC from benign lesions. Mazeh et al. (25) analyzed six miRs in 27 FNA specimens and found that miR-221 was the most favorable molecule in differentiating benign and malignant lesions.
In this study, we sought to further evaluate the diagnostic utility of selected miRs in thyroid FNA cytology, especially for the atypia cases. We started with eight potential miRs and identified a set of four miRs (miR-146b, -221, -187, and -30d) that could best differentiate malignant from benign lesions in thyroid FNA samples. It appeared that miR-146b and -30d showed the most significant differential expression between malignant and benign lesions (Table 1), which suggested that these two miRs would have relatively better diagnostic performance. For the LDA prediction performance, the combined values of all four miRs would determine the outcome of the prediction for a given case. Our data, together with others, provide evidence that some miRs such as miR-146b and -221 are consistently showing relatively strong diagnostic value for PTC.
We further analyzed the expression of these four miRs by LDA and proposed a four-miR LDA classification method to predict FNA cases as benign or malignant for a total of 128 FNA specimens that had corresponding histologic diagnoses. Our results indicate that the expression levels of these four miRs could differentiate benign from malignant thyroid lesions in preoperative patients with an accuracy of 93.3% for the training sample set and an accuracy of 85.3% for the validation sample set. The difference of accuracy between the two populations may reflect the relative frequencies of FTCs in the two populations. Indeed, there were eight FTCs in the validation sample set and four were misclassified. When evaluating only PTC cases, the four-miR LDA prediction had an overall 95.8% correct malignant predictive value (69/72 PTC and fvPTC). In contrast, the malignant predictive value for FTC cases was 69.2% (9/13 cases). While several other factors could also contribute to the false negative results, such as scant cellularity, poor RNA quality, or low proportions of malignant cells in the FNA samples, we conclude that this particular set of four miRs does not produce optimal discrimination in FTC in this small sampling of tumors in this study. Our result was similar to that reported by Sheu et al. (43). They analyzed a set of five miRs (146b, 181b, 21, 221, and 222) in RNA of formalin-fixed paraffin-embedded thyroid tissues and found that this set of miRs could distinguish PTC from FA and multinodular goiter but failed in the differential diagnosis of encapsulated FTC.
In our analysis, we included three ATC (in the training sample set) and four HA cases (one HA in the training sample set and three in the validation sample set), with 66.7% correct prediction rate for ATC, and 75% for HA. These data suggested that the four-miR signature has diagnostic value for ATC and HA. However, because of the limited case number, further work is warranted.
In conclusion, our results suggest that the miR profiles can be successfully determined in FNA samples and may improve detection of PTCs in thyroid FNA cytology. However, when focusing on FNAs read as “atypia of undetermined significance,” the particular miR panel used in this study is subjected to inaccurate results in follicular neoplasias and fvPTC, suggesting that further refinement in the miR classification profiles is needed.
Footnotes
Acknowledgments
We thank Carol Lyden and Jan Lockman for sample collection and lab work. This work was supported by a grant (P01CA124570) from the National Cancer Institute.
Disclosure Statement
R.S., S.L., W.L., P.W., M.S., J.H., R.N., T.F., A.d.l.C., and H.H. have nothing to disclose. M.D.R. is a member of the Clinical Advisory Board of Veracyte, Inc., and has consulted with Astra-Zeneca. R.T.K. is an unpaid steering committee member for Veracyte, Inc., and receives research support from Veracyte, Inc.