
Abstract
Background:
Two decades ago the Islamic Republic of Iran was among countries most severely affected by iodine deficiency. Iran has since achieved great success in the control and elimination of iodine deficiency disorders (IDDs) following the national salt iodization program, initiated in 1989. The aim of the study was to evaluate the effectiveness of sustained consumption of iodized salt by Iranian households and the current status of iodine nutrition in all 30 provinces of Iran.
Methods:
Goiters—measured by palpation—and urinary iodine concentration of children were assessed. In this descriptive cross-sectional study, 36,000 schoolchildren (18,000 girls and 18,000 boys), aged 8–10 years, were randomly selected, from October 2007 to February 2008, from 30 provinces of the country. Goiter prevalence and urinary iodine excretion in schoolchildren and the iodine content of salt at household, factory, and distribution site levels were measured.
Results:
The goiter rate in the country was 6.5% (6% grade 1 and 0.5% grade 2), and the weighted goiter rate was 5.7%. The total goiter rate in Hamedan, Zanjan, Kermanshah, Mazandaran, and Gilan provinces was over 10%. The median urinary iodine was 140 μg/L. Urinary iodine levels of 20–50, 50–99, and ≥100 μg/L were noted in 15.3%, 19.8%, and 64.9% of the samples, respectively. In four provinces, the median urinary iodine was lower than 100 μg/L. The mean (±SD) and median salt iodine values were 23.2 (±13.8) and 34.7 ppm, respectively, at the production level, and 32.4 (±14.7) and 32.3 ppm, respectively, at the distribution level. Ninety-eight percent of households consumed iodized salt, 58% of households had appropriate salt storage, and 27% of the household salts contained <20 ppm.
Conclusions:
Iran has achieved much in the development of universal salt iodization strategy and elimination of IDDs and currently meets all criteria for sustainable elimination of iodine deficiency. However, the lack of adequate iodine nutrition in some provinces necessitates special attention and proper monitoring.
Introduction
Two decades ago the Islamic Republic of Iran was among the countries most severely affected by iodine deficiency (11,12). This nutritional problem had been identified in Iran in 1968 (13), but had not declared a public health problem until early 1980. Since then, an effective national program of dietary iodine supplement via universal salt iodization (USI) has resulted in sustainable preventive programs for IDDs, and the country has achieved great success in IDD control and elimination leading to its recognition in 2000 by WHO-Eastern Mediterranean Regional Office as an iodine sufficient country (14). Once the criteria of iodine repletion have been achieved (15), the sustainability of iodine sufficiency then becomes the major concern. One of the major causes of failure in IDD elimination programs is the sense of complacency toward maintenance of adequate iodine intake in a population (16). Since the establishment of the Iranian National Committee for Control of IDDs in 1989, monitoring of IDD control programs is scheduled every 5 years to evaluate the sustainability of the program. A nationwide survey in 1989 of goiter by palpation showed that goiter existed in schoolchildren in most provinces at rates of between 30% and 80% (17) and the median urinary iodine was 12–82 μg/L in various parts of the country. Production, distribution, and consumption of iodized salt were begun in 1990 and the second national survey, 6-years following the start of iodized salt consumption, was conducted in 1996. This indicated that total goiter rate (TGR) was still above 40%; however, the median urinary iodine excretion was 200 μg/L, with 85% of subjects having urinary iodine of over 100 μg/L (18). In 2001, an evaluation of the program was conducted as the third national survey (19), indicating that the median urinary iodine was 165 μg/L, and the TGR was 9.8%. The current study is the fourth national survey as a part of the 5 yearly surveillance programs on sustainability of iodine sufficiency in Iran.
Materials and Methods
In this cross-sectional study, performed between October 2007 and February 2008, goiter rate and urinary iodine levels in schoolchildren and the amount of iodine content of salt at factory and distribution sites and households were measured.
Goiter rate and urinary iodine concentration
To estimate goiter prevalence, 30 clusters of 40 schoolchildren, aged 8–10 years (1200 subjects, equal number of girls and boys), were selected in each province. Overall 36,000 schoolchildren were selected for goiter assessment by seven trained physicians. Thyroid size was assessed using the palpation method and classified into grades 0–2 according to the classification of WHO/UNFCEF/ICCIDD (15). To reduce interobserver differences in goiter assessment by the palpation method (20), seven general physicians were trained under supervision of an experienced endocrinologist of the study, prior to initiation of the survey. Each physician had to grade goiter status in 60 children. Kappa coefficient of agreement was calculated for validation. All examiners had the highest Kappa for detection of goiter. One-tenth of the subjects were randomly selected for urinary iodine determination and 120 (equal numbers of rural and urban) urine samples were obtained from each province. Spot urine samples (10 mL) were collected between 08.00 and 11.00 a.m. while children attended school. Urine samples were transferred in screw-top plastic bottles on ice to the laboratory of the Research Institute for Endocrine Sciences and kept frozen at –20°C until the time of iodine measurement at the end of the study.
Iodine content of salts
At factory and distribution levels
Five samples from different parts of the factory site, from each of the 56 iodized salt producing factories that were active at the time of the study, and 100 samples from distribution sites in each province were collected and sent to the food and drug control laboratory of the health center in each province. Quantitative iodine measurement was performed at the center.
At households
Samples of iodized salt for household use (400 samples from each province) were collected for quality and quantity control, and the content of household salt was measured in the field, using rapid testing kits. Approximately 10% of salt samples were randomly selected and transferred to the laboratory for food and drug control of the health center in each province for iodometric titration.
Laboratory measurement
All urine samples were assayed for iodine concentration by three trained technicians at the Research Institute for Endocrine Sciences laboratory, using the acid digestion method (21,22). The laboratory is reference laboratory of the region and regular quality control is done. A median urinary iodine concentration (UIC) <100 μg/L was considered representative of iodine deficiency. Mild, moderate, and severe iodine deficiencies were considered if the median UIC was 50–99, 20–49, and <20 μg/L, respectively. Median UICs of 100–199, 200–299, and >300 μg/L were considered adequate, more than adequate, and excessive, respectively (15). The intraassay coefficient of variation (CV) of UIC measurement method for concentrations of 3.5, 15, and 38 μg/L was 11.2%, 8.2%, and 9.4%, respectively, and the interassay CV values for these concentrations were 12.5%, 8.9%, and 10.3%, respectively.
For qualitative salt iodine measurement, rapid test kits were used (23). Quantitative salt iodine measurements were performed by the iodometric titration assay (24) and values were shown in parts per million (ppm). The titration method has been standardized by the Research Institute for Endocrine Sciences and approved by the Ministry of Health and Medical Education (MHME) for uniform measurement of salt iodine in the laboratories for food and drug control of the health center of each province. Interexaminer differences in various provinces have been shown to be negligible for the titrimetric method of determining salt iodine content.
Statistical analyses
Chi-squared test was used for comparison of categorical variables. For continuous variables, Student's t-test, analysis of variance (ANOVA), Mann–Whitney, and Kruskal–Wallis ANOVA tests were used according to normality of their distribution. Correlations between continuous numerical variables were assessed by Spearman's Rank and Pearson coefficients. SPSS 9.05 software package (SPSS, Inc., Chicago, IL) was used for the statistical analysis and p<0.05 was considered as significant.
Results
Goiter rate
In total, 36,000 schoolchildren, aged 8–10 years, in 30 clusters of 40 children from each of 30 provinces of the country, participated in this study. The prevalence of TGR was 6.5% (6% grade 1 and 0.5% grade 2). After weighting goiter prevalence for the size of the population in each province, the TGR was calculated to be 5.7%. The TGR in Hamedan, Zanjan, Kermanshah, Mazandaran, and Gilan provinces was over 10%. Apart from these 5 provinces, the TGR in 25 provinces was 4.5% (4.4% grade 1 and 0.1% grade 2).
Urinary iodine concentration
The median UIC in 36,000 schoolchildren was 140 μg/L. Figure 1 depicts median UICs of all provinces in bar graphs. UICs of 20–50, 50–99, and ≥100 μg/L were found in 15.3%, 19.8%, and 64.9% of the population, respectively. There was no significant difference in UIC between boys and girls or between rural and urban areas. None of the provinces had median UIC <20 or above 300 μg/L. In Khoozestan, Tehran, Lorestan, and Western Azarbaijan, median UIC was between 50 and 100 μg/L. In eight provinces (Western Azarbaijan, Tehran, Khoozestan, Zanjan, Sistan-baluchestan, Ghom, Lorestan, and Hamedan) over 20% of schoolchildren had UIC <50 μg/L.
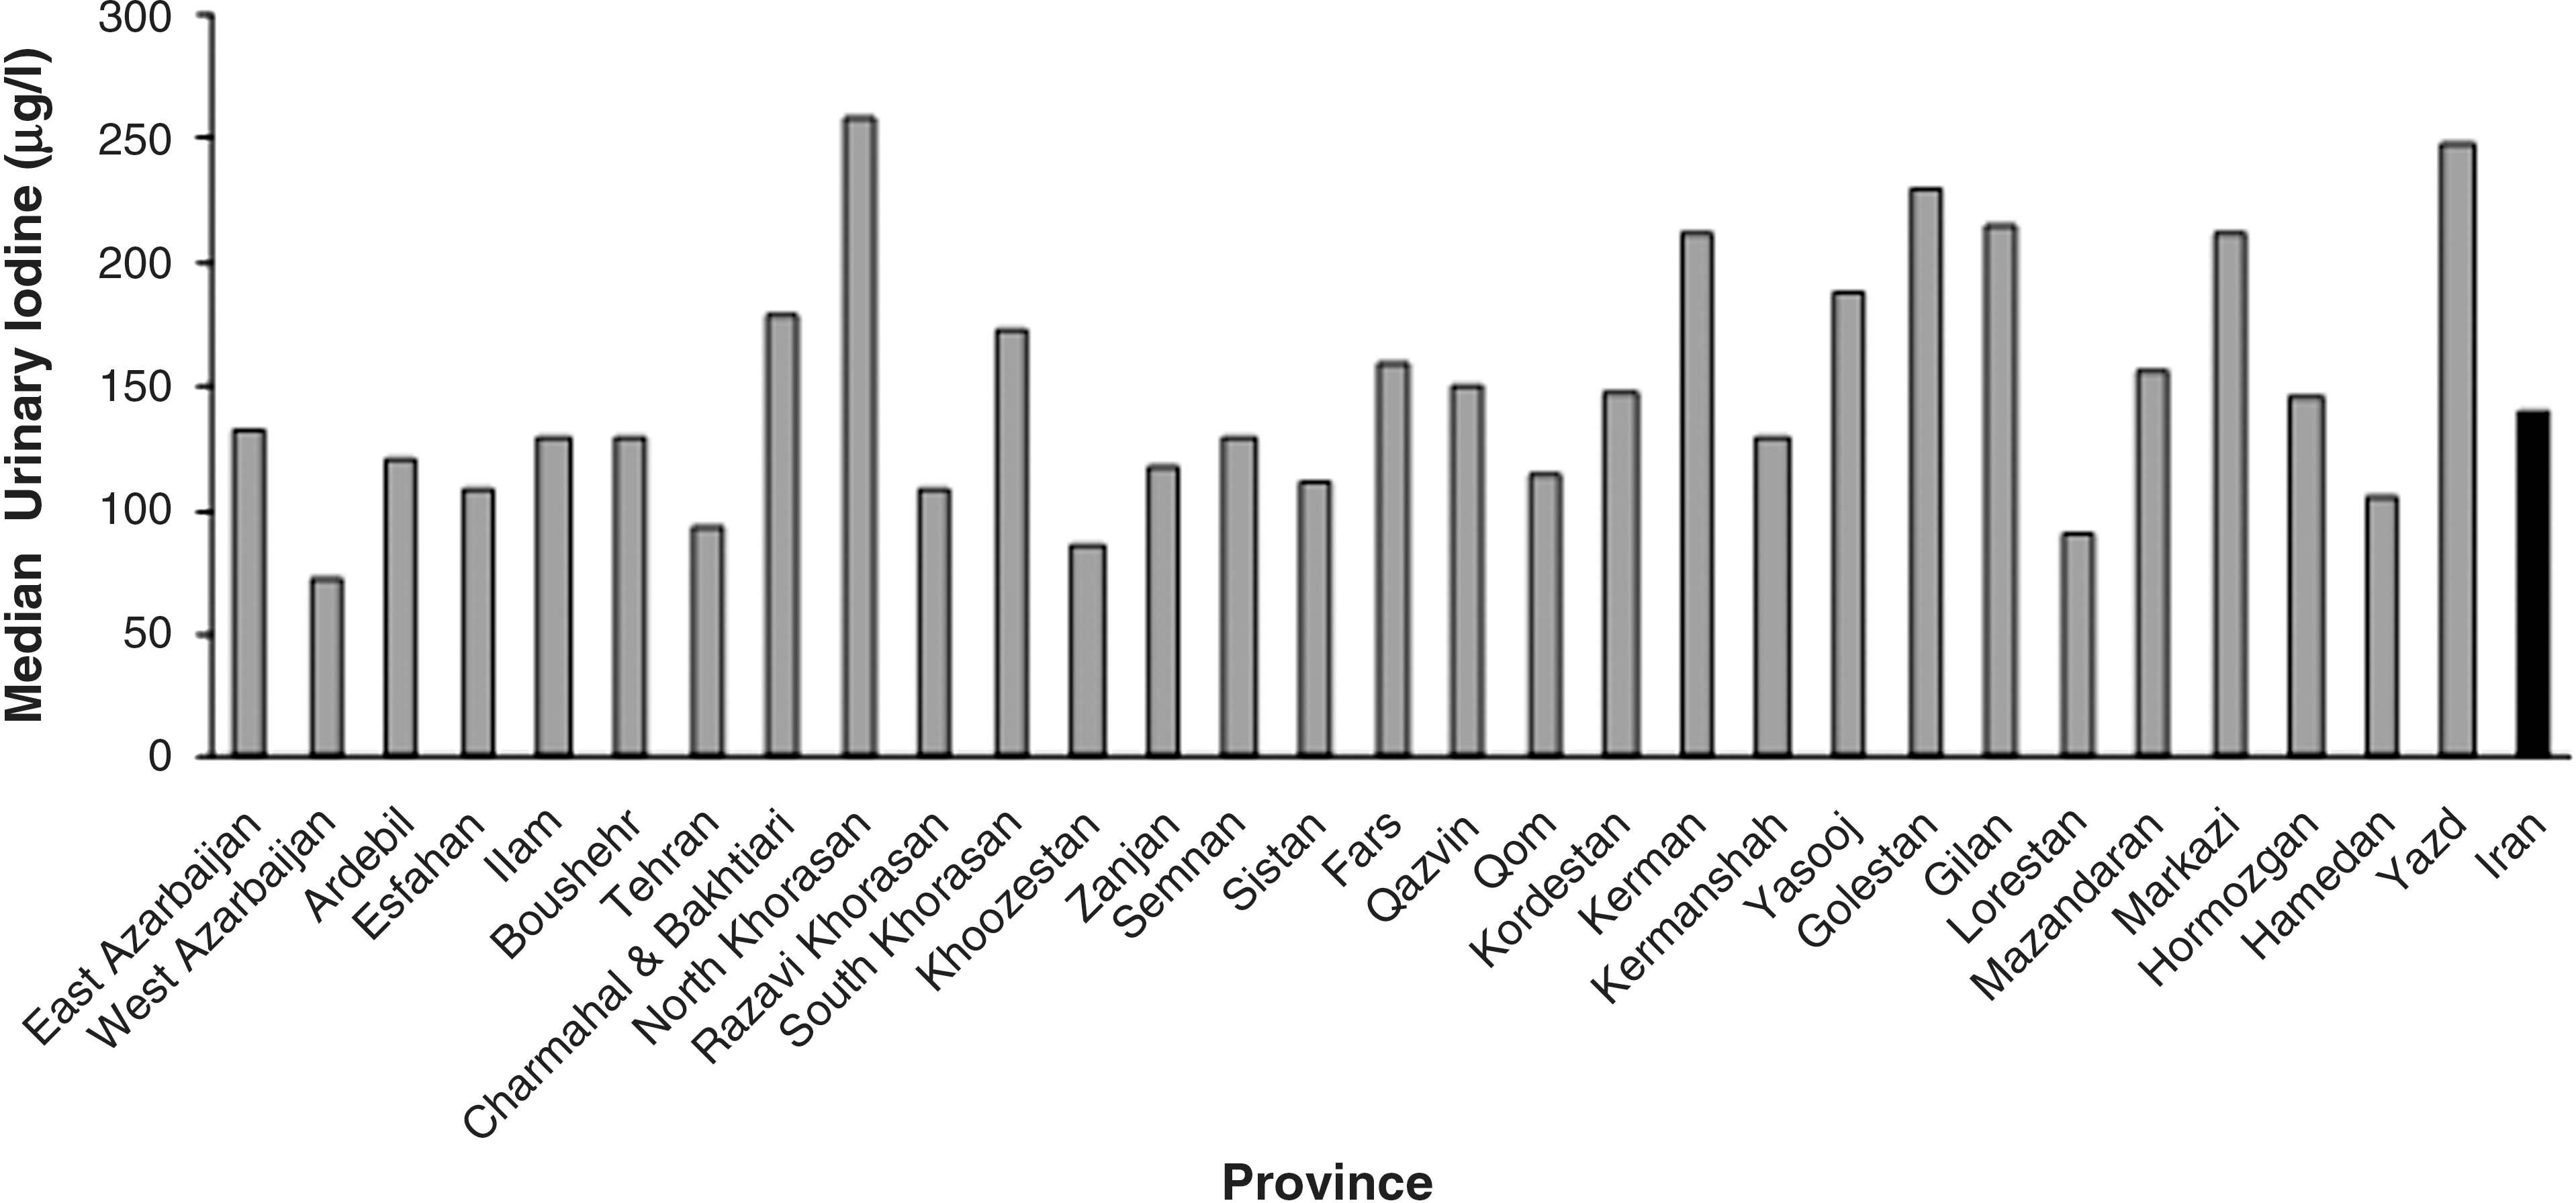
Median urinary iodine of various provinces of Iran in 2007. From each province between 80 and 120 samples of urine were collected. All urinary iodine concentrations are presented in μg/L. In Khoozestan, Tehran, Lorestan, and Western Azarbaijan, median urinary iodine is lower than 100 μg/L.
Salt iodine at production level
Mean (±SD) and median (range) of iodine concentrations in salt at the production level were 23.2 (±13.8) and 34.7 (26.5–40.2) ppm, respectively. Iodine levels of <20, of 20–40, and of ≥40 ppm were observed in 12%, 70%, and 18% of samples, respectively.
Salt iodine at distribution level
Mean (±SD) and median (range) of iodine level concentrations were 32.5 (±14.8) and 32.3 (26.4–43.0) ppm, respectively. Iodine levels of <20, of 20–40, and of ≥40 ppm were observed in 17%, 52%, and 31% of samples, respectively.
Salt iodine at household level
Ninety-eight percent of households consumed iodinated salt and 82% used crystallized iodized salt. Salt storage was appropriate in 58% of households. Quantitative assays of household salt samples showed that median iodine content was 30 ppm. Iodine levels <20, 20–40, and ≥40 ppm were observed in 27%, 53%, and 20% of household salts, respectively.
Figure 2 shows the distribution of salt iodine content at different levels in this study.
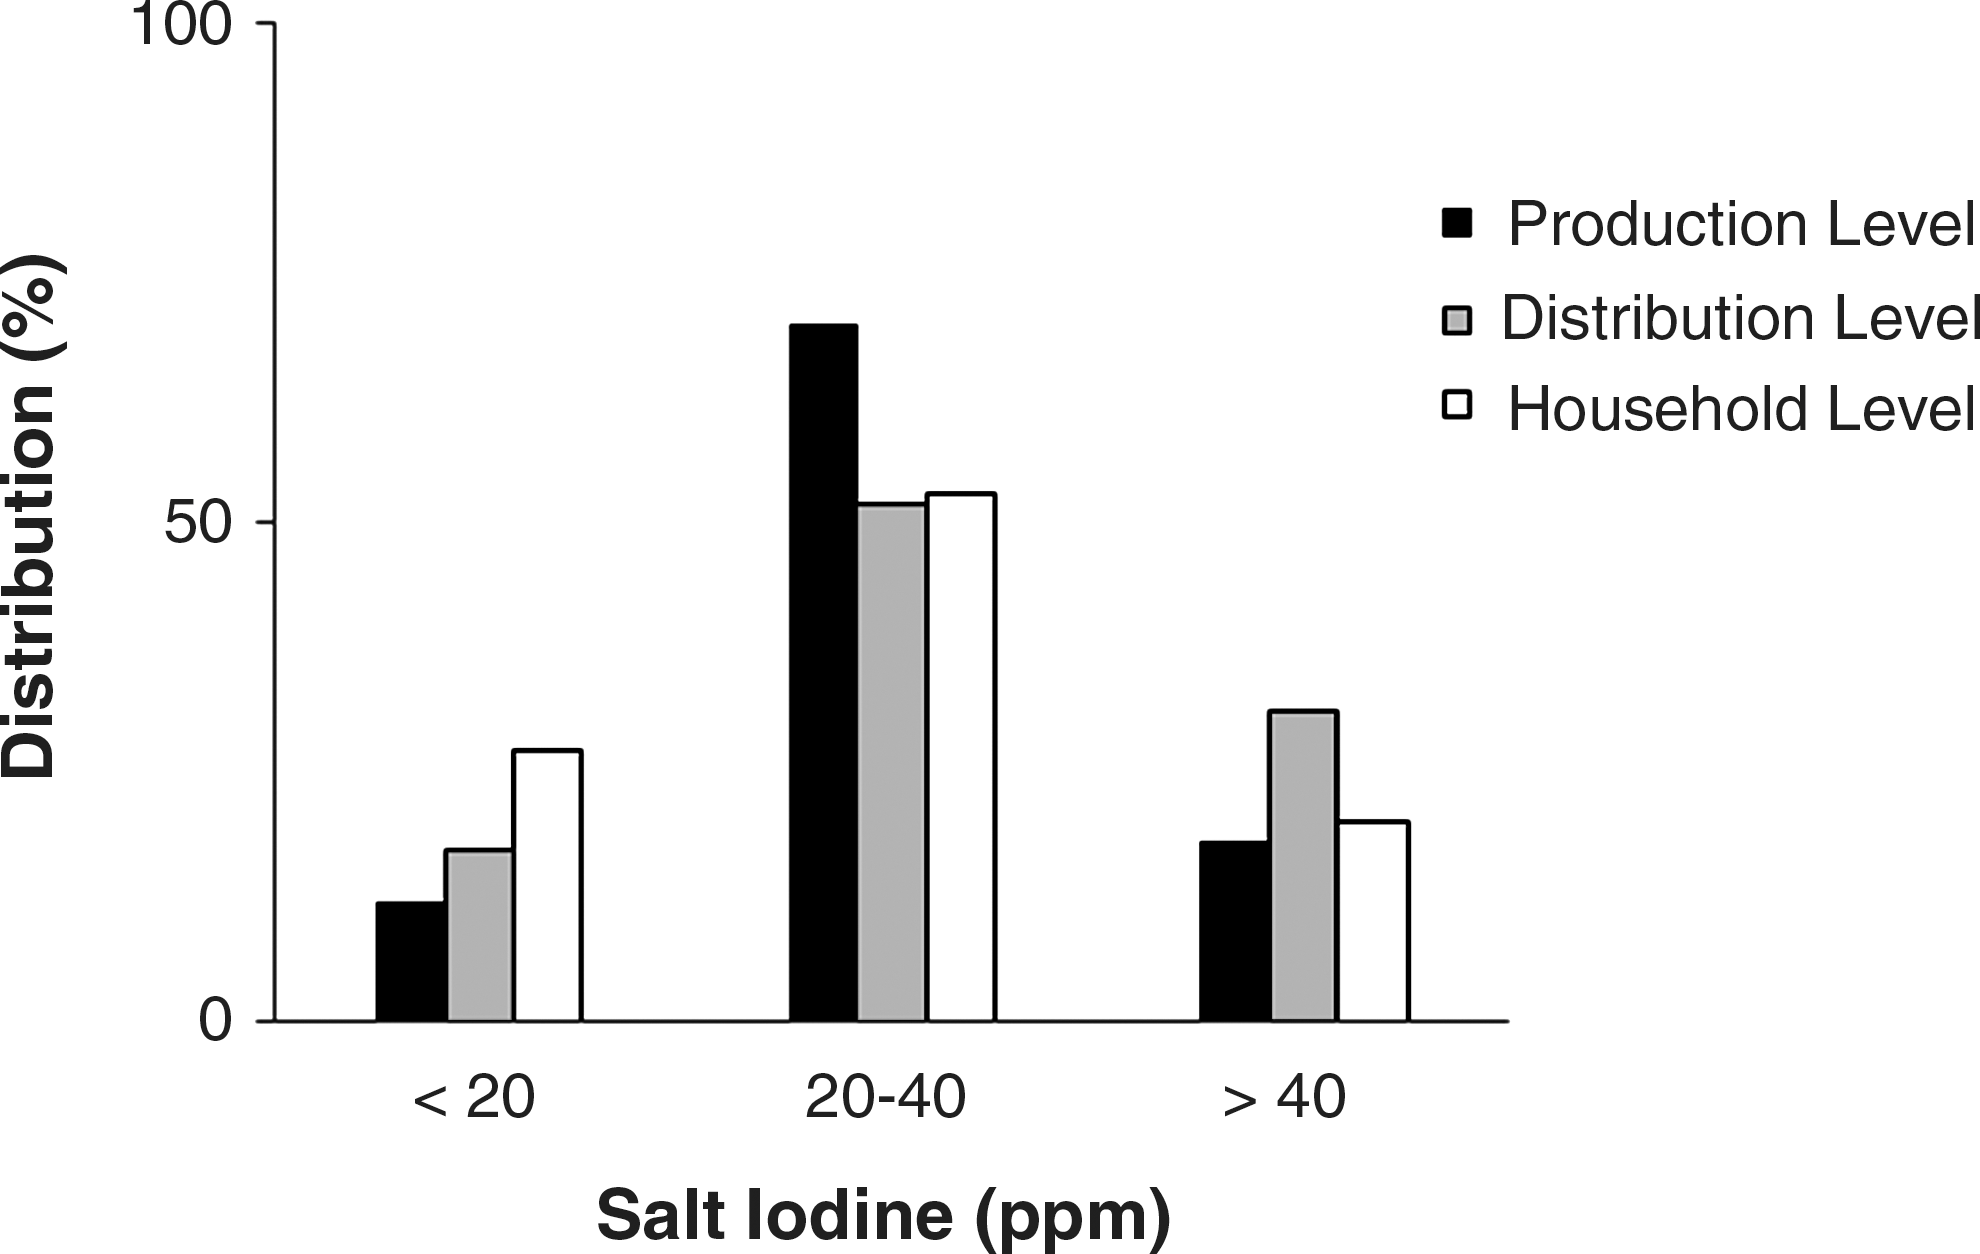
Distribution (%) of salt iodine content (ppm) at production, distribution, and household levels. ppm, parts per million.
Discussion
The results of this national survey, conducted in 2007–2008, indicated sustainable elimination of IDDs and favorable urinary iodine values in school-aged children of 30 provinces of Iran (Table 1). In fact, this survey was a part of the IDD elimination program, which monitors the stages of the program every 5 years in Iran. Although goiter prevalence has decreased to a favorable rate, and median urinary iodine indicates overall adequate iodine nutrition, findings in some provinces and the presence of up to 20% salt samples with <20 ppm iodine at household level may imply the risk of iodine deficiency in some areas. This situation is of particular importance for pregnant and lactating women and their infants. It may impair growth and neurodevelopment of the offspring and may increase infant mortality.
Data from the 2007 national survey.
Compared to 1996 and 2001, the TGR was significantly decreased in the majority of provinces, with no alteration in the salt iodine content (Fig. 3). In this survey the TGR was 6.5% (6% grade 1 and 0.5% grade 2) with weighted TGR of 5.7%, significantly lower than the corresponding rates of 53.8% (44.8% grade 1 and 9% grade 2) among 36,178 schoolchildren in 1996 and 13.9% (11% grade 1 and 2.9% grade 2) among 36,000 schoolchildren in 2001 (p<0.001). Figure 4 shows the prevalence of the TGR in the year 1989 and decrease of the TGR in monitoring surveys in 1996, 2001, and 2007.
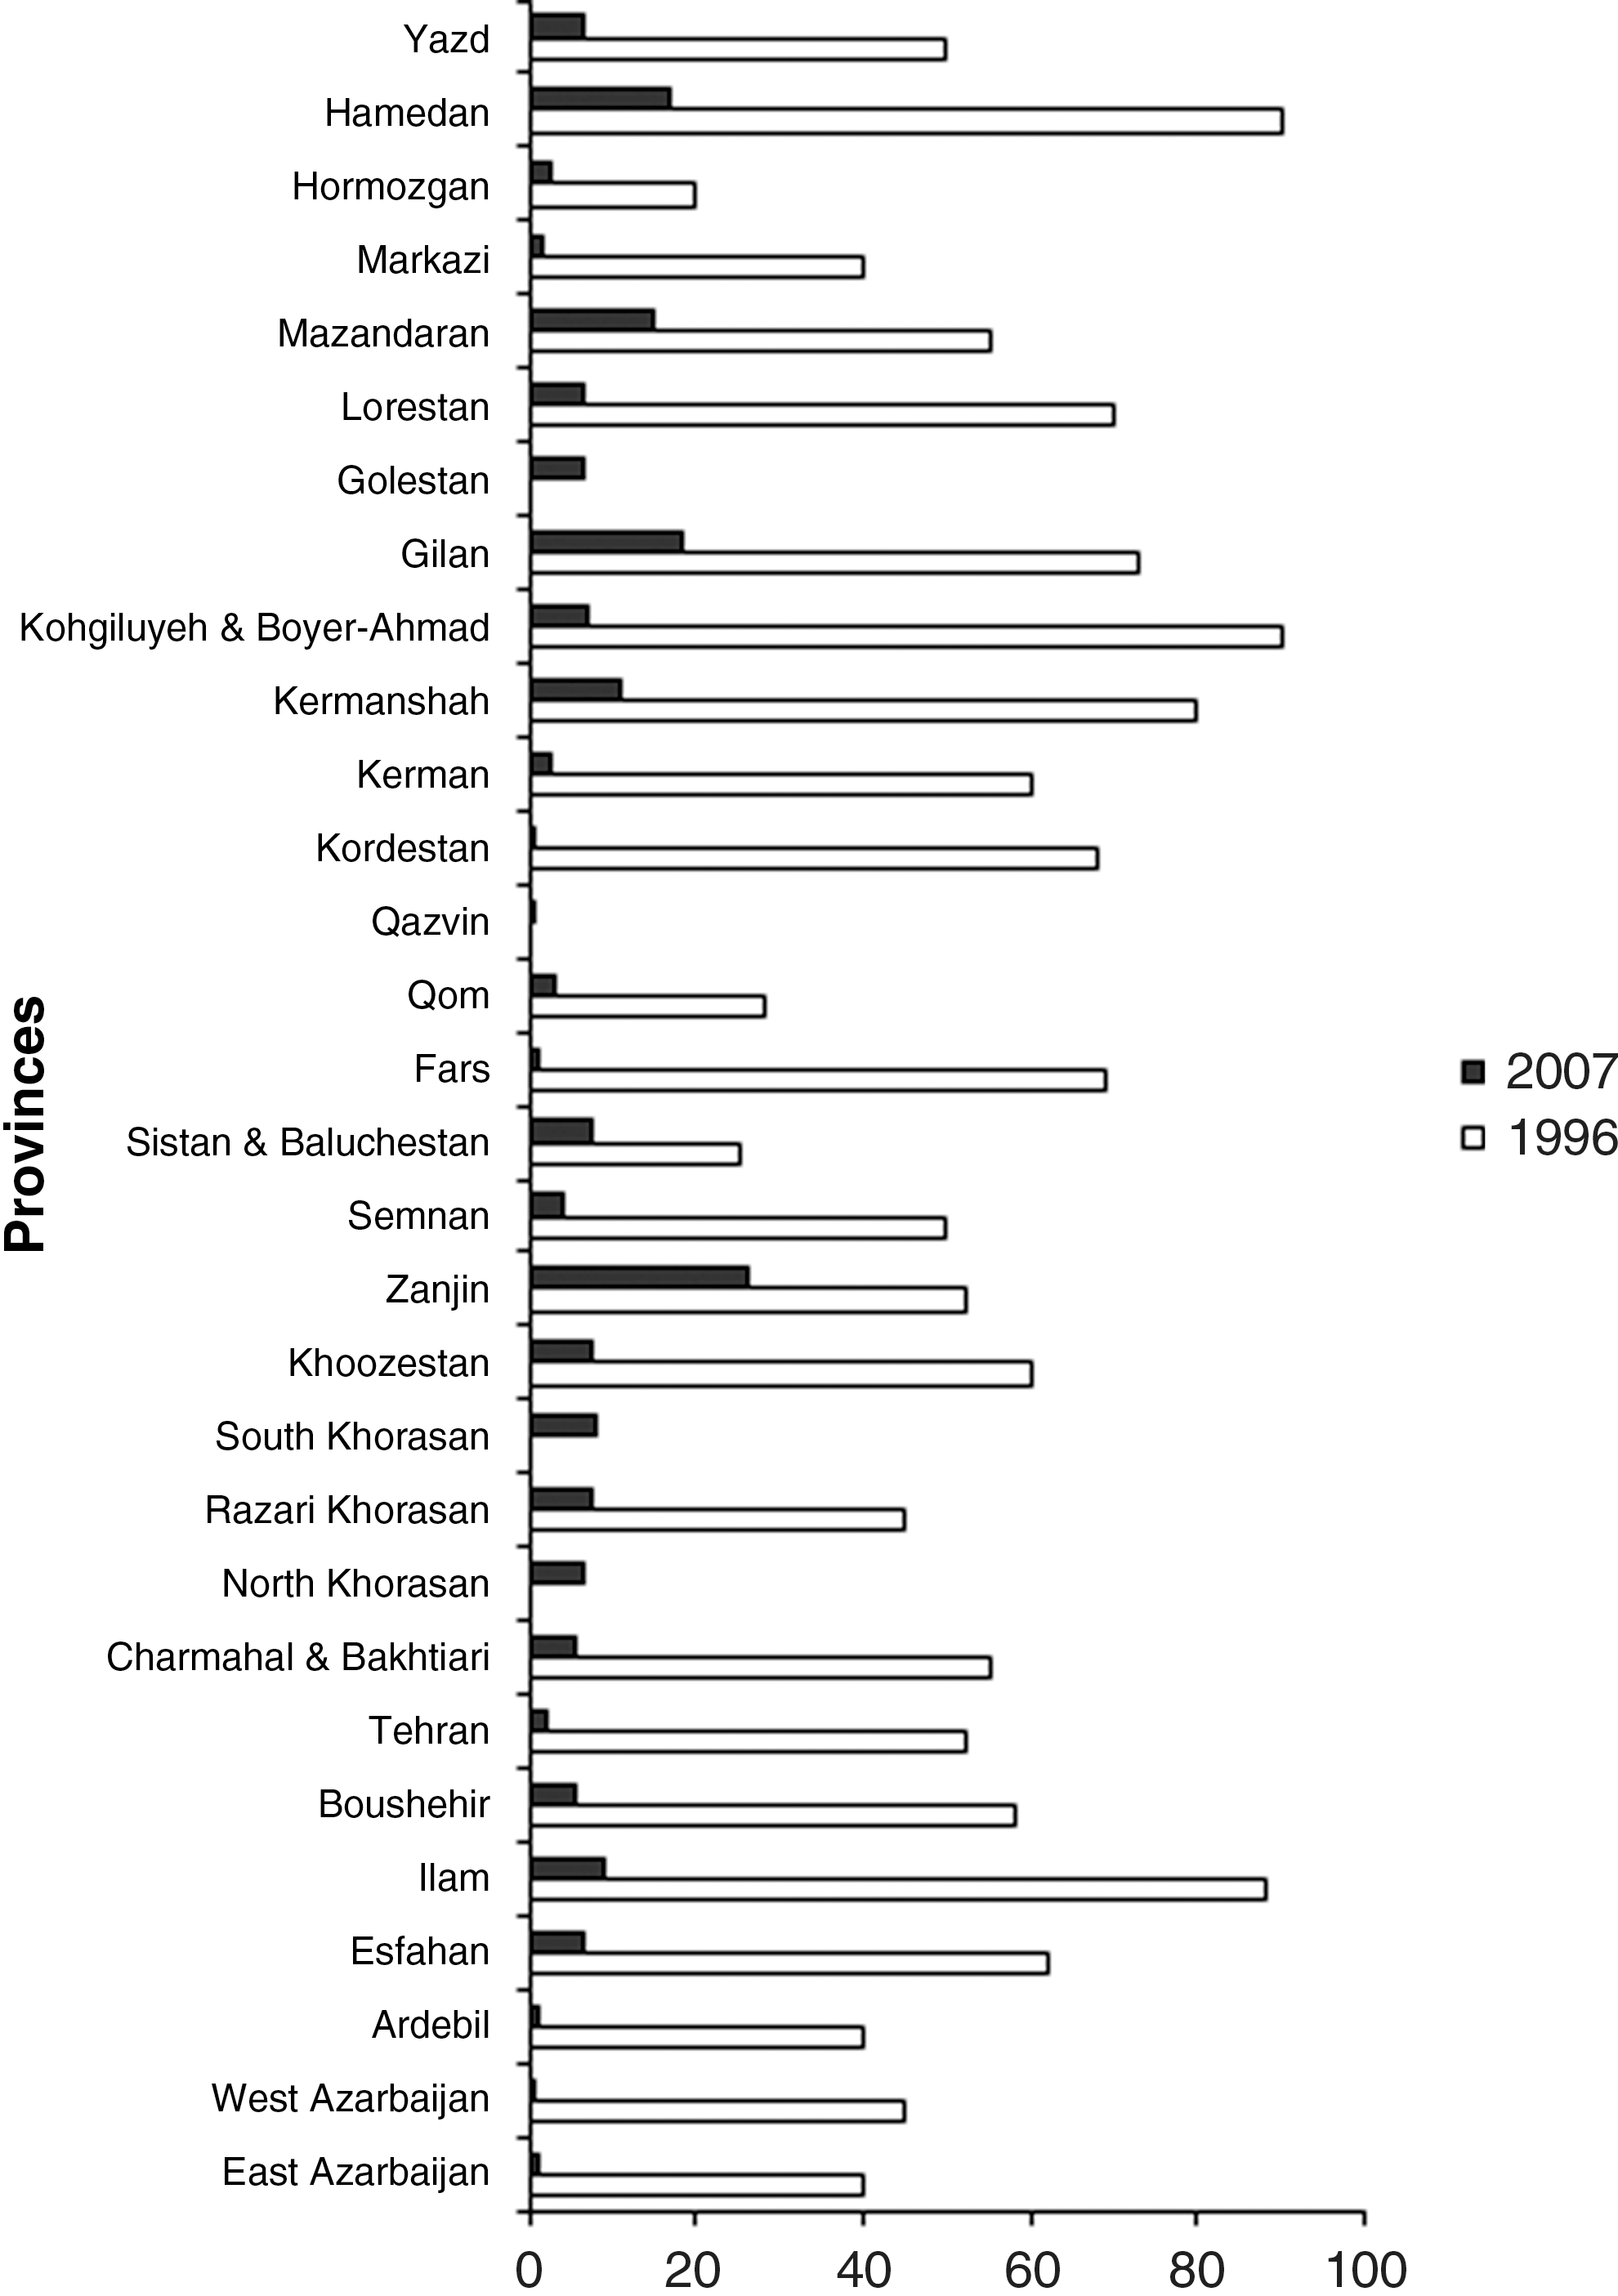
Total goiter rate (TGR) in different provinces of Iran in 1996 and 2007. TGR was significantly decreased in the majority of provinces compared with 1996, with no alteration in the salt iodine contents. In this survey TGR of the country was 5.7%, which was significantly lower than the corresponding rate of 53.8% in 1996 (p<0.001).
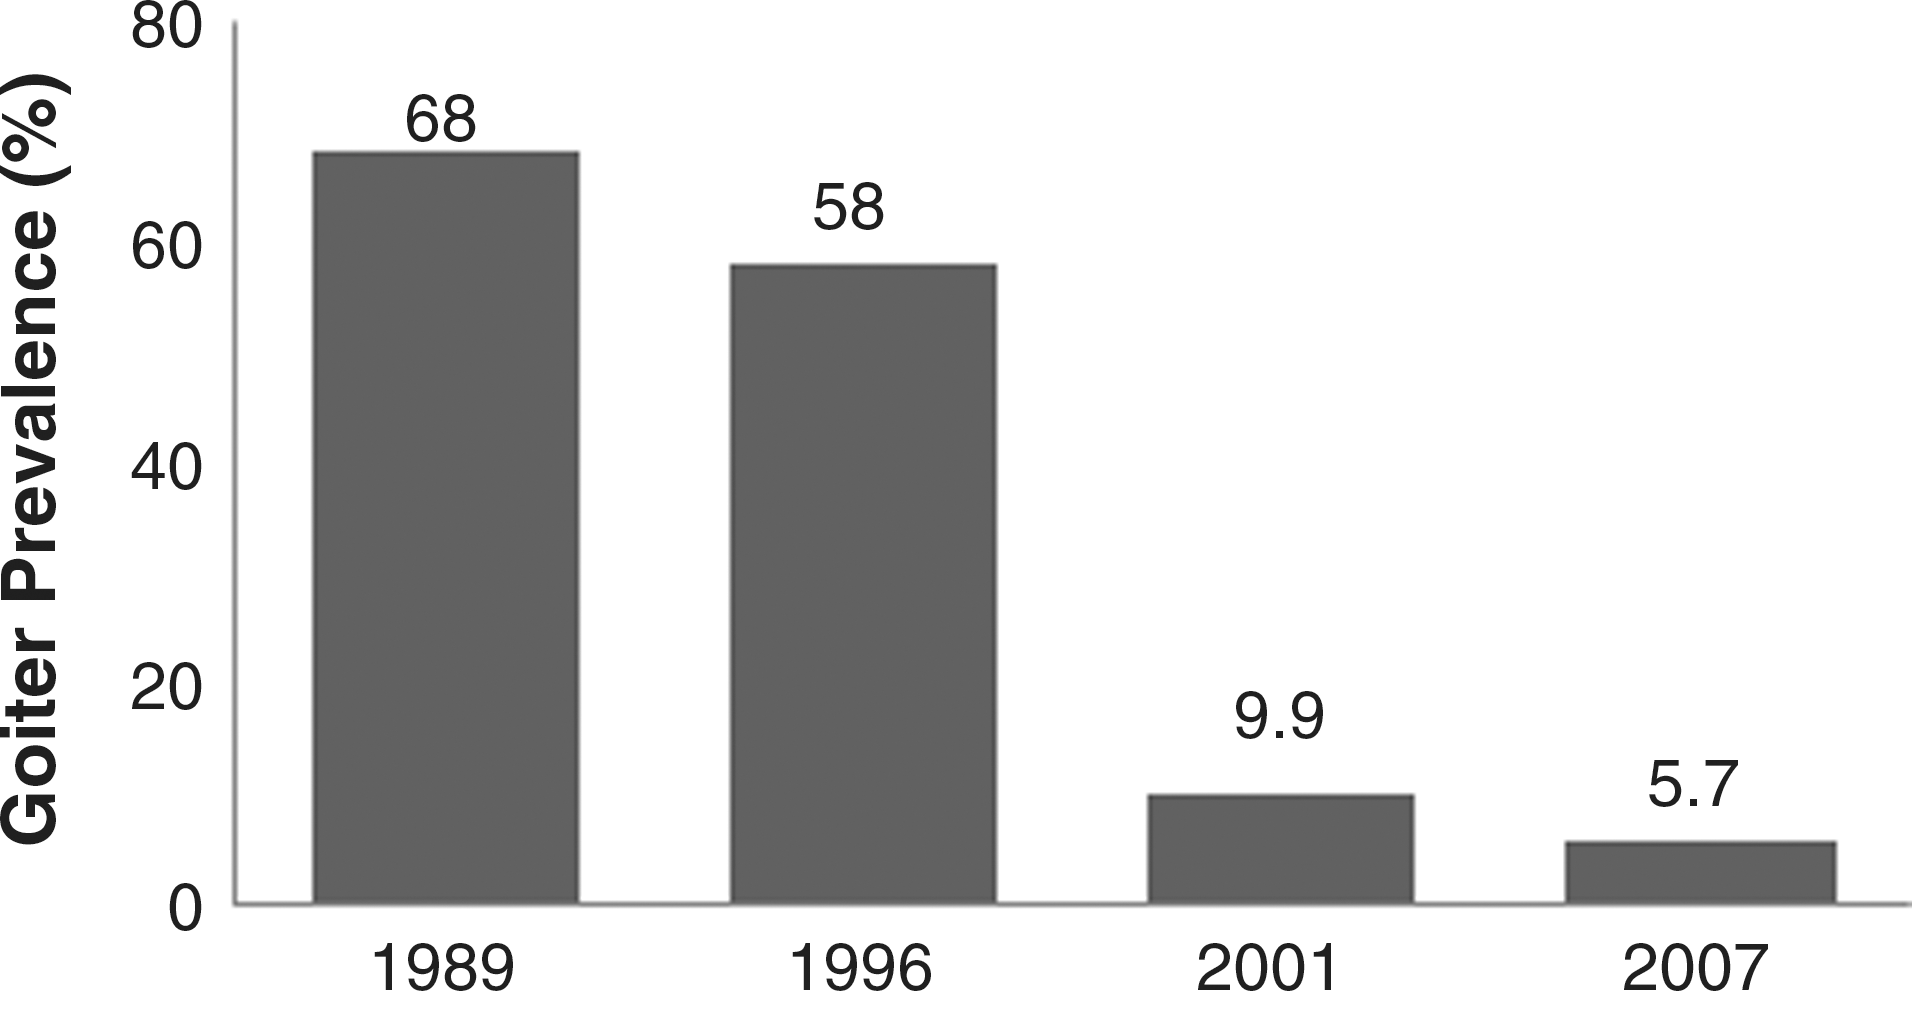
TGR (%) in four national surveys; 1989 (before) and 1996, 2001 and 2007 (after IDD control program). IDDs, iodine deficiency disorders.
The median UIC of schoolchildren in this study was 140 μg/L. This value was 205 μg/L in 1996 and 165 μg/L in 2001 (Table 2), when the median UIC in urban areas was 160 μg/L and in rural areas was 170 μg/L (p=0.16). But this was 230 μg/L in urban versus 205 μg/L in rural areas in 1996 (p=0.04). Values of UIC of <100 and >100 μg/L were present in 19.7% and 80.3% of children in 2001 and in 14.2% and 85.8% children in 1996, respectively (p<0.0001). The median UIC values, however, were higher than the WHO/UNICEF/ICCIDD optimal levels in many provinces 2 years after the 1996 enactment of the law on mandatory salt iodization in Iran. But after 7 years of national salt iodization, an optimal median UIC level was obtained among schoolchildren without any change in salt iodine content. It is unclear whether the reduction in median UIC values from 1996 to 2007 in our study is due to a dietary change in schoolchildren or some other environmental factors. A similar downward trend was primarily observed between National Health and Nutrition Examination Surveys 1 and 3 in the United States; however, median iodine finally stabilized at adequate UIC levels on further follow up (25). This condition is particularly important in pregnant and lactating women, whose low iodine intakes could be accompanied by detrimental outcomes in vulnerable populations such as neonates, infants, and young children (1). In this study the median UIC of schoolchildren in Khoozestan, Tehran, Lorestan, and Western Azarbaijan was between 50 and 100 μg/L. In eight provinces (Western Azarbaijan, Tehran, Khoozestan, Zanjan, Sistan-baluchestan, Ghom, Lorestan, and Hamedan) over 20% of schoolchildren had a UIC <50 μg/L. The persistence of a proportion of subjects with low urinary iodine or indeed a fall in median urinary iodine in these areas, despite unchanged method for urinary iodine measurement over the period 1996 to 2007, could be due to iodized oil injection during earlier years of salt iodization program, improper iodine content of salts, or changes of dietary habits, particularly in young people.
MUI, median urinary iodine; TGR, total goiter rate.
Since 1996, the mean (±SD) and median (range) salt iodine at the production level have not changed significantly, as current values are 23.2 (±13.8) and 34.7 (26.5–40.2) ppm, respectively, while corresponding values in 1996 for 278 factory salt samples were 33.8 (±13.2) and 33.9 (8–91) ppm and for 297 samples in 2001 were 33.2 (±13.4) and 32.8 (6–84) ppm, respectively (p=0.57). Frequency distributions of factory salts with iodine contents of <20, 20–40, and >40 ppm were 12%, 70%, and 18% in 2007; 17.2%, 54.5%, and 28.3% in 2001; and 15.8%, 54.7%, and 29.5% in 1996, respectively (p=0.89). Neither did median iodine contents of household salt samples show significant differences during last three periods, being 30 ppm in 2007 and 32.8 ppm in both 2001 and 1996 (p=0.68). The frequency distributions of household table salts with iodine content of <20, 20–40, and >40 ppm were 27%, 53%, and 20% in 2007; 8.3%, 71.7%, and 20.0% in 2001; and 7.8%, 71.9%, and 20.3% in 1996, respectively (p=0.97). Figure 5 compares the median UIC and salt iodine content in three national surveys after IDD control program.
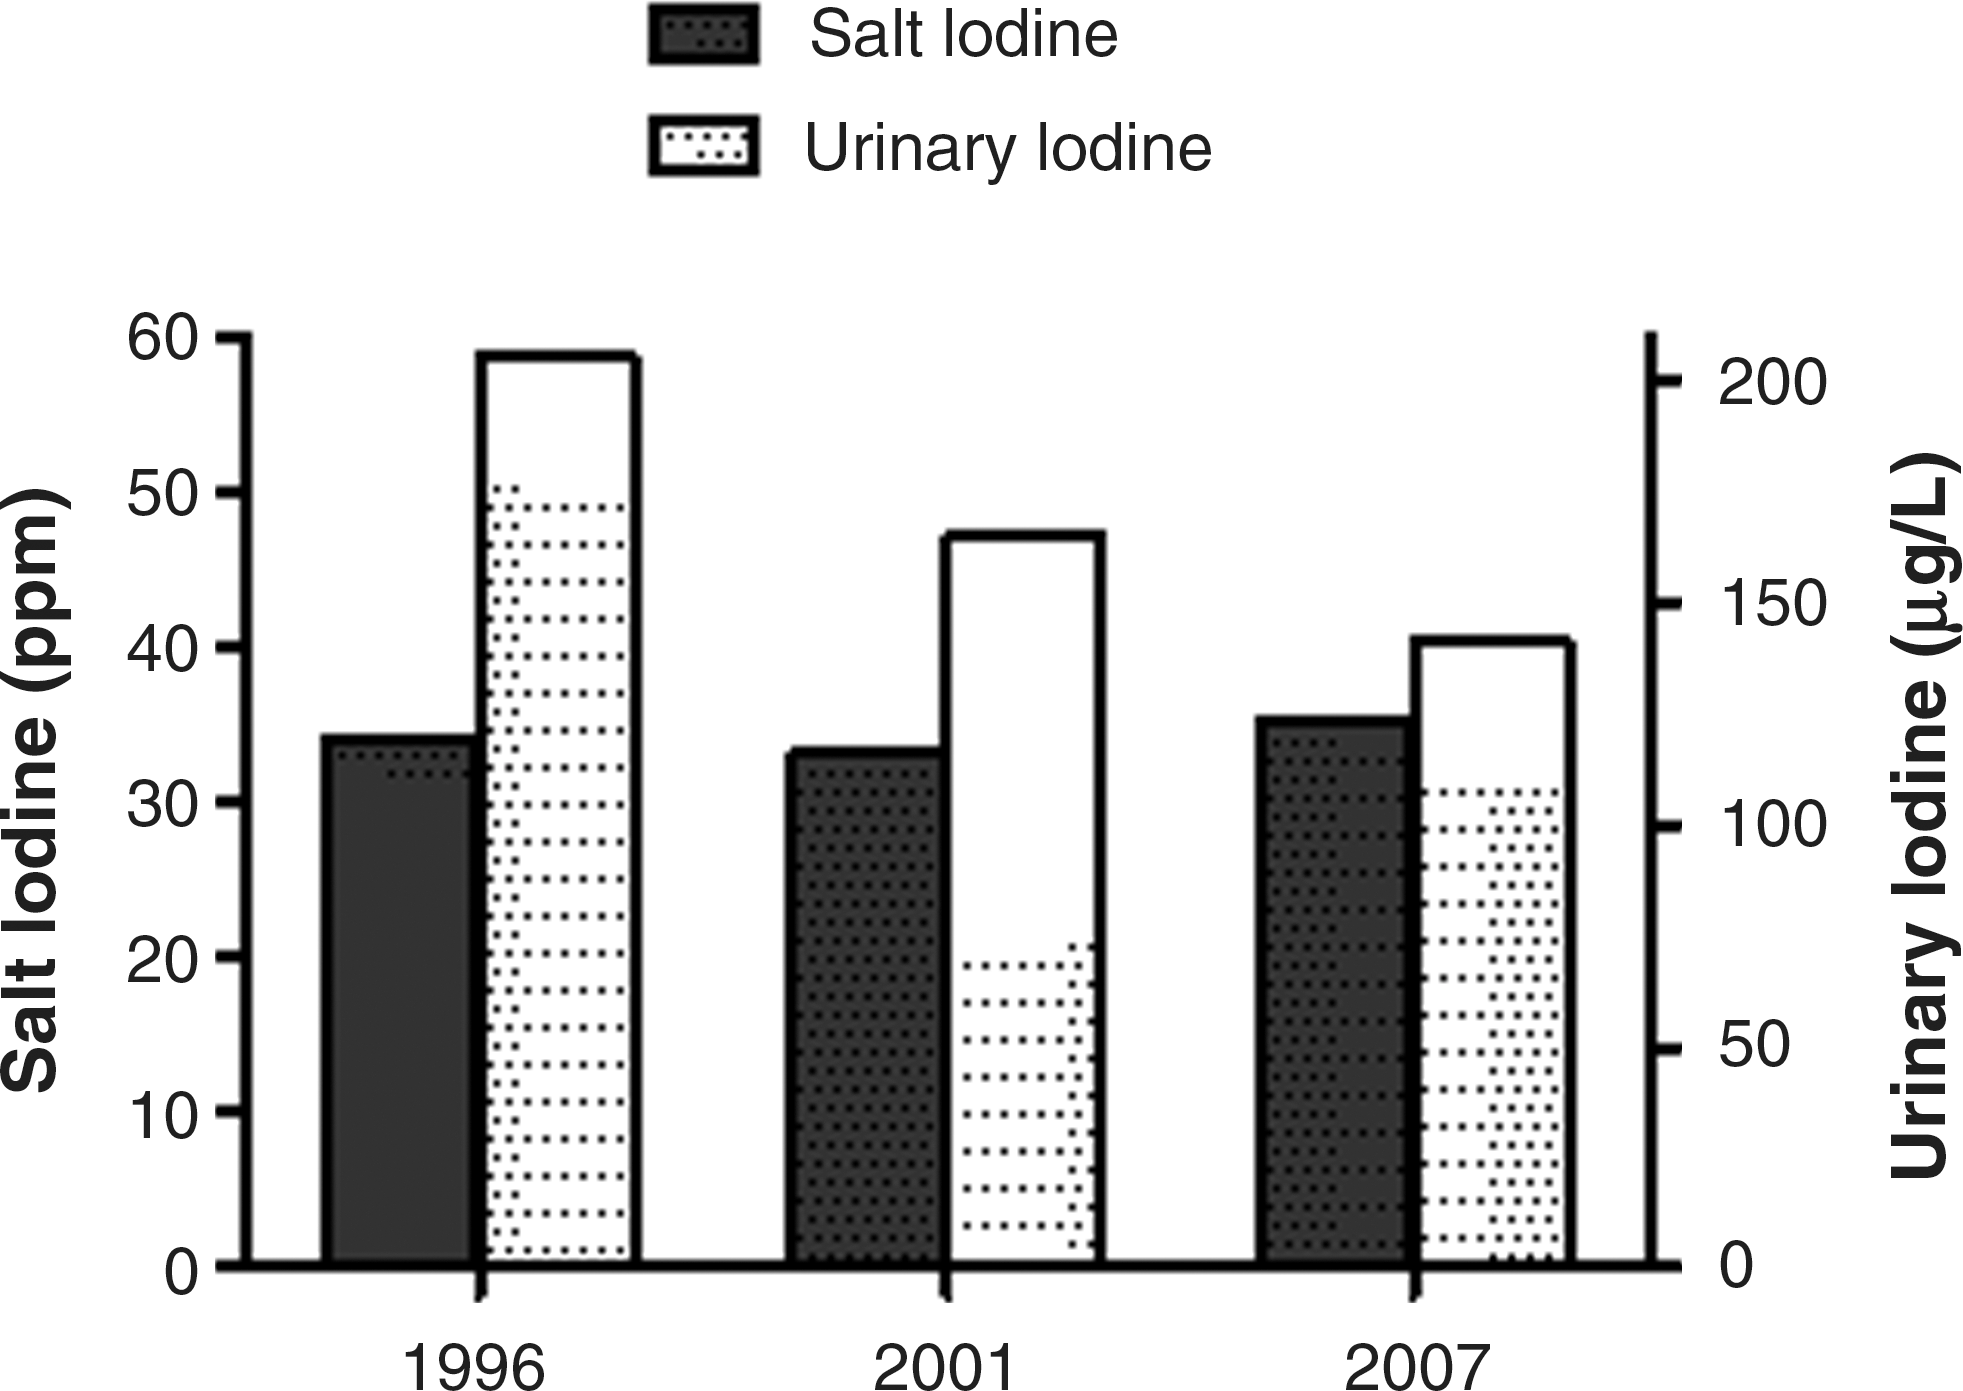
The median urinary iodine concentration (μg/L) and salt iodine content (ppm) in three national surveys over the period 1996–2007 (after IDD control program).
The results of the 2007 national survey were indicative of favorable urinary iodine values in school-aged children of 30 provinces. The TGR declined in comparison to the last survey. This result, occurring 17 years after the beginning of salt iodization and 12 years after >50% of households have been consuming iodized salt, was foreseen (Table 2). The prevalence of goiter in 12 provinces was <5% and in 13 provinces it was 5% to 10%. Only five provinces have a goiter prevalence of >10%. The noticeable decrease in the prevalence of grade 2 goiter (from 9% in 1996 to 2.9% and 0.5% in 2001 and 2007, respectively) is of high importance. Of the five provinces (Hamedan, Gilan, Mazandaran, Kermanshah, and Zanjan), with goiter prevalence over 10%, the prevalence of goiter showed no change in Zanjan and Hamedan, in comparison with 2001; in Kermanshah, the TGR decreased from 23.9% in 2001 to 10.8% in 2007, but in Gilan and Mazandaran there was a significant increase from 11.3% and 4% in 2001, to 18.5% and 14.9% in 2007, respectively. Since clinical assessment of low-grade goiter has less validity due to high interobserver variation, and because the examiners in the two surveys were not the same, these two factors may be responsible for this discrepancy rather than a true change in TGR. The median UIC of over 100 μg/L in the provinces with TGR >10% indicates that the grading of goiter might have been inaccurate and further assessment is needed. On the other hand, the median salt iodine content within the optimal range of 20–40 ppm, from 1996 to 2007, suggests that deficiency of available salt iodine content does not seem to explain the persistence of elevated goiter rate in some of the provinces. Assessment of other goitrogens, for example, nutritional habits, deficiencies of selenium (26,27), iron (28,29), vitamin A (30), and endocrine disruptions (31,32), might be useful in detecting the underlying causes of goiter rate in rural/urban areas of the country, where goiter rate is still high despite adequate iodine intake. However, since low iodine content of soil is the main factor responsible for iodine deficiency, IDDs return whenever there are inadequate iodine supplies to the population at risk or sustainability of the monitoring program is interrupted.
For many countries with IDD control programs, sustainability has become a major focus (33). There is much evidence of IDD relapse in some countries that had previously been successful in controlling IDD. In several countries in which IDD had been eliminated by USI, control programs faltered, and IDD recurred (34 –39). In Guatemala, their previously effective iodized salt program deteriorated, and currently the median UIC is <100 μg/L, and new cases of cretinism have appeared (34). In regions of the former USSR, successful, long-term iodized salt programs have lapsed, and IDD has returned. In Azerbaijan, the current GR is 86% and the median UIC is 54 μg/L, indicating moderate-to-severe IDD (35). Similar patterns of IDD recurrence were also demonstrated in Kazakhstan, Kyrgyzstan, and other neighboring countries (34). The reemergence of IDDs also has reported from industrialized countries previously thought to be iodine sufficient, such as Australia and New Zealand (36,37). A recent cohort study in school-aged children by Zimmermann et al., in an area of endemic goiter in Morocco, described changes in thyroid function after sudden interruption of USI (38). Moroccan children (6–16 years old), with severe IDD, received iodized salt for one year, normalizing their median urinary iodine and decreasing thyroid volume by 34%, but because of practical and financial constraints, salt iodization was discontinued and the improvements in IDD control parameters reversed rapidly following cessation of salt iodization. New research by Vanderpump suggests that the U.K. population is iodine deficient. A systematic assessment of UIC from 810 U.K. girls aged 14–15 years revealed that 69% were lower than 100 μg/L; this is consistent with iodine deficiency according to WHO standards. In addition, 18% had UIC levels lower than 50 μg/L (39). Overall, these data suggest that IDD control programs are fragile, and depend on a strong, long-term commitment from governments, donors, consumers, and the salt industry (40).
To ensure the achievement of goals in any public health interventional program, monitoring of the indicators is a vital element of an effective and sustained program for the control and elimination of iodine deficiency. Since most countries, including Iran, have now started to implement IDD control programs, urinary iodine rather than thyroid size is emphasized as the principal indicator of impact. In areas free of iodine deficiency, where most individuals have low-grade goiter, thyroid ultrasonography is necessary for the assessment of thyroid volumes. It would therefore be worthwhile to design the next national program of monitoring of iodine deficiency control with a view to determining goiter rates by thyroid ultrasonography for more precise assessment of goiter prevalence in different provinces of the country.
In conclusion, the well-monitored salt iodization program in Iran has ultimately resulted in optimization of UIC, and drastically decreased the goiter rate 18 years after USI, although the later effect appeared some years after normalization of UIC. The median urinary iodine of schoolchildren was as adequate as those reported in 1996 and 2001, indicating a well-established sustainable IDD program in Iran. However, lack of adequate nutrition in a few provinces of Iran is a major cause of concern, necessitating prompt attention of the authorities of the Ministry of Health, salt producers, and other officials responsible for promotion, implementation, and monitoring of the Iranian Program for Elimination of IDD and, last but not least, the need for periodical monitoring of any IDD control program following elimination of IDD.
Footnotes
Acknowledgments
This project was supported, in part, by grants from the Budget and Programming Organization, MHME. We would like to express our appreciation and acknowledgment to the officials and colleagues at the MHME and the branches in all provinces, our colleagues at the Research Institute for Endocrine Sciences of Shahid Beheshti University of Medical Sciences, UNICEF, and related officials and personnel all over the country for their cooperation and assistance throughout this project conducted for monitoring and evaluation of IDD. Their invaluable efforts and contributions played a major role in the results documented in this final report. We would like to thank Ms. N. Shiva for the English editing of the manuscript.
Disclosure Statement
The authors declare that no competing financial interests exist.