
Abstract
Background:
The preoperative diagnosis of thyroid nodules primarily depends upon fine needle aspiration (FNA) cytology. However, up to 25% of FNA samples have associated “suspicious or indeterminate”, but not diagnostic cytologic reports, resulting in difficulty deciding appropriate clinical management for these patients. We hypothesize that the use of molecular markers as an adjunct to FNA cytology can improve the distinction of benign from malignant nodules that have associated suspicious or indeterminate cytology.
Methods:
Using microarray analysis, we previously identified and reported on 75 genes useful in the distinction of benign versus malignant thyroid nodules. In the present study, we have further validated the expression of 14 of these markers in a large number of thyroid samples by immunohistochemistry (IHC) analysis of 154 thyroid tumors and quantitative real-time RT-PCR (QRT-PCR) analysis of 95 FNA samples. Of the 154 tumors analyzed by IHC, 44 samples (29%) had associated suspicious or indeterminate FNA cytology.
Results:
Receiver operating characteristic using three-gene model, (HMGA2, MRC2, and SFN) analysis for the detection of malignant nodules resulted in areas under the curve (AUCs) of≥0.95 (80% sensitivity; 100% specificity) and≥0.84 (71% sensitivity; 84% specificity) for the IHC data in tumors, and QRT-PCR data in FNA samples, respectively.
Conclusions:
Our results suggest that a three-gene model for the cytological diagnosis of indeterminate thyroid nodules is both feasible and promising. Implementation of this as an adjunct to thyroid cytology may significantly impact the clinical management of patients with suspicious or indeterminate thyroid FNA nodules.
Introduction
As an adjunct to FNA cytology, molecular markers are believed to be useful in differentiating benign from malignant thyroid nodules. Over the past decade, studies by others and our group have revealed differences in gene expression between benign and malignant thyroid tumors (10
–18). However, no study has included all of the thyroid tumor types that have associated suspicious FNA cytology (5), nor successfully implemented them as a diagnostic adjunct to FNA in a large cohort of patients with suspicious thyroid lesions. Relevant to this, by utilizing microarray analysis, we have previously identified 75 molecular markers that are differentially expressed between benign and malignant thyroid tumors (19). The transcript (mRNA) levels for 12 of these 75 markers were previously validated by quantitative real-time RT-PCR (QRT-PCR) in 107 thyroid tumors (19). In the present study, by using a combination of immunohistochemistry (IHC) and QRT-PCR analyses we have further validated the expression of 14 of the 75 differentially expressed genes, including HMGA2, KLK7, MRC2, PLAG1, CYP1B1, DPP4, FNDC4, CDH3, CEACAM6, PRSS3, SPOCK1, DIRAS3, SFN, and KIT in 154 thyroid tumors and in 95 intraoperative FNA samples. Of these 14 genes, seven were new (KLK7, MRC2, CYP1B1, FNDC4, DIRAS3, SFN, and KIT) and had not been tested in our previous QRT-PCR validation study (19) (Supplementary Table S1; Supplementary Data are available online at
Materials and Methods
Tumors and FNA samples
With Institutional Review Board (IRB) approval, thyroid tissue and intraoperative FNA samples were collected from patients who underwent a thyroidectomy at Johns Hopkins Hospital (Baltimore, MD) between 2000 and 2008. Tissue microarrays (TMA) were created as previously described (19,20) using 87 formalin-fixed paraffin-embedded (FFPE) thyroid specimens that included classic papillary thyroid carcinoma (n=20), follicular variant of papillary thyroid carcinoma (n=9), follicular carcinoma (n=14), lymphocytic thyroiditis nodules (n=11), follicular adenoma (n=14), and normal thyroid adjacent to tumor or nodule (n=19). A second set consisted of 86 FFPE tissue sections that were nonarrayed, including papillary thyroid carcinoma (n=16), follicular variant of papillary thyroid carcinoma (n=11), follicular carcinoma (n=3), lymphocytic thyroiditis nodule (n=7), follicular adenoma (n=16), adenomatoid nodule (n=18), Hürthle cell adenoma (n=11), and Hürthle cell carcinoma (n=4). A third set of samples included 95 intraoperative FNA specimens from 67 benign and 28 malignant thyroid nodules collected in RNAlater® (Ambion, Austin,TX) for QRT-PCR analysis. The intraoperative FNA specimens were collected under general anesthesia by the operating surgeon during thyroidectomy. Formal cytological review of the intraoperative FNA samples was not performed. The samples were collected for molecular analysis only. Briefly, FNA samples were collected from the thyroid nodule using a 25-gauge needle attached to 10 mL syringe. On an average, two- separate needle passes were transferred directly into a vial containing RNAlater® (for QRT-PCR). The nodule from which the FNA sample obtained was marked with a stitch that was recorded by pathology prior to accessioning for permanent histology. This was done to be certain the nodule in question matched the corresponding preoperative FNA sample (if available) and postoperative histology report.
Immunohistochemistry
Immunohistochemical staining was performed on 4–5 μm sections of FFPE thyroid tissues that included 87 specimens on TMA and 86 nonarrayed thyroid specimens. In total, these samples included 30 follicular adenomas, 18 adenomatoid nodules, 18 lymphocytic thyroiditis nodules, 11 Hürthle cell adenomas, 4 Hürthle cell carcinomas, 17 follicular carcinomas, 20 follicular variant of papillary thyroid carcinomas, 36 papillary thyroid carcinomas, and 19 normal thyroids. Briefly, sections were deparaffinized in xylene and rehydrated through a series of alcohol gradients. Antigen retrieval was achieved by heating in citrate buffer at pH 6.0 for 10 minutes and cooled at room temperature for 30 minutes. Endogenous peroxidase activity was quenched in 3% hydrogen peroxide and nonspecific binding of secondary antibody blocked by incubation with normal horse serum. Individual sections were incubated with primary antibodies (goat polyclonal antibodies; anti-HMGA2 IgG [1:300], anti-KLK7 IgG [1:100], anti-MRC2/Endo 180 IgG [1:100], anti-PLAG1 IgG [sc-1: 200], anti-P-Cadherin/CDH3 IgG [1:150], anti-DIRAS3/ARH1 IgG [1:100], SFN/14-3-3σ IgG [1:150], and rabbit polyclonal antibodies; anti-CYP1B1 IgG [1:100], anti-DPP4/CD26 IgG [1:100], anti- c-KIT IgG [1:100] from Santa Cruz Biotechnology, Santa Cruz, CA) overnight at 4°C. Conditions without primary antibody were used as technical negative controls. A streptavidin-biotin peroxidase detection system was used in accordance with the manufacturer's instructions and developed using 3,3′- diaminobenzidine (Vector Laboratories, Burlingame, CA). Sections were counterstained with 1% hematoxylin. Several cell lines including thyroid cancer cell lines (TPC, FTC133, XTC1), lung cancer cell line (H1299), Human Embryonic Kidney cell line (HEK293) and tissue sections (artery, colon, intestine, pancreas, testis, salivary gland, lung, liver, and kidney) were used as positive and negative controls.
Protein expression documented in IHC was blindly scored separately by two investigators (N.P. and D.P.C.) using manual microscopic examination. While scoring, both intensity and percent of positive/negative cells were recorded and were based on the following criteria: (i) high expression (intense immunostaining with>60% of tumor cells), (ii) moderate expression (intense immunostaining of 30%–60% of tumor cells), (iii) low expression (intense immunostaing in <30% of cells) and (iv) negative (no expression).
QRT-PCR
Total RNA was extracted from 95 FNA samples (collected in RNAlater®) by using miRCURY RNA isolation kit (Exiqon, Woburn, MA). Prior to RNA extraction, the RNAlater® was removed by centrifugation at 5000 g for 10 minutes at 4°C. DNaseI treatment was included to avoid DNA contamination. cDNA was synthesized in a 20 μL reverse transcription reaction mixture that contained 500 ng total RNA from each FNA sample. After optimization for each primer pair, real-time PCR assays were performed on iQTM5 real-time PCR detection system (Bio-Rad Laboratories, Hercules, CA) according to the manufacturer's recommendations. Briefly, 1 μL of cDNA was used in a 25 μL reaction mixture that contained an optimal concentration (150–250 nM) of primers and SYBR-Green Supermix. The thermal profile for PCR consisted of Taq-polymerase activation at 95°C for 3 minutes, followed by 40 cycles of PCR at 95°C for 20 seconds (denaturation), 55°C or 56°C for 30 seconds (annealing), and 72°C for 60 seconds (extension). Details with regard to primer sequence, annealing temperatures, and amplicon size are shown in Supplementary Table S2. An average Ct (threshold cycle) from duplicate assays was used for further calculation, and GAPDH-normalized gene expression was determined using the relative quantification method as formulated below. Results were expressed as the median of three to four independent measurements.
PCR products amplified after 30 cycles were electrophoresed on 1.5% agarose gel and visualized under ultraviolet light after ethidium bromide staining.
Statistical analysis
Each marker was separately examined and in combination using both univariate and multivariable analyses. For each marker, a logistic regression model was fit to the data to model the probability of malignant versus benign thyroid tumors. Using this model, we obtained odds ratios and 95% confidence intervals, and constructed receiver operating characteristic (ROC) curves to obtain estimates of area under the curve (AUC) as a measure of the overall diagnostic ability of various models that were formally compared based on DeLong's method (21). This method uses a Chi-square statistics to examine differences between correlated ROC curves. In addition, the correlation in expression between gene pairs was also examined (see correlation matrix in Supplementary Table S3) for use in defining genes that independently contributed to distinguishing malignant from benign thyroid tumors.
Results
Immunohistochemical analysis of thyroid tumors
A total of 173 FFPE sections (87 arrayed and 86 nonarrayed samples) that included 19 normal thyroid specimens were analyzed for protein expression of 10-genes (HMGA2, KLK7, MRC2, PLAG1, CYP1B1, DPP4, CDH3, DIRAS3, SFN, and KIT). The 10-genes were chosen from the list of 75 differentially expressed genes based on rank order, their apparent role in thyroid and/or other human cancers cited in the literature, and the availability of commercial antibodies. After immunostaining, the expression intensity of each of the selected genes was assessed both in the benign nodules and malignant tumors. The staining intensity for each gene was scored three times on a four-point scale as described in the Methods section. Scoring results were counter-validated by our study pathologist (DPC) independently and in a blinded fashion. Intra-observer reproducibility was between 95% and 98% (HMGA2 [98%], KLK7 [95%], MRC2 [98%], PLAG1 [96%], CYP1B1 [95%], DPP4 [96%], CDH3 [98%], DIRAS3 [95%], SFN [98%], and KIT [95%]).
Since normal samples were considered as negative controls, we have excluded all 19 samples in our statistical analysis and then performed univariate analysis on 154 tumors (77 malignant and 77 benign) and examined the association between tumor class (benign vs. malignant) and the expression level (negative-to-low vs. moderate-to-high) for each of these 10-genes (Table 1). Although the expression levels (moderate-to-high vs. negative-to-low) of all 10-genes showed an association with tumor/nodule types (malignant vs. benign), only 7-genes including HMGA2, MRC2, PLAG1, DPP4, CDH3, DIRAS3, and SFN were found to be statistically significantly different (p<0.001; AUC≥0.70) and were highly expressed in malignant tumors (Table 1). Representative IHC for these seven genes in a follicular adenoma and papillary thyroid carcinoma is shown in Figure 1A. To examine the ability of each of these individual genes or combinations thereof to distinguish malignant from benign tumors we did the following analysis: we modeled the probability of malignancy according to defined expression levels using logistic regression and performed a ROC analysis using areas under the curve (AUC) as a measure of performance. We selected the genes based on their AUC values, correlation coefficients among gene pairs, and p-values, and further examined the gene-combination effect in a multivariable model. Among all seven statistically significant genes, we applied a cut-off (>0.5) to the correlation in expression among gene pairs to form groups of genes. Among these gene groups, the gene associated with the highest AUC within each group was selected as representing the expression for that group, which resulted in the selection of HMGA2, SFN, and MRC2. To test/compare the performance of the multivariable models, we also selected CYP1B1, a gene with very poor correlation in expression compared to others and therefore, independent in its association with malignancy (Supplementary Table S3). Comparing test performances among all combinations, the three-gene combination (HMGA2+MRC2+SFN) was found to be better in terms of differentiating malignant from benign tumors (Supplementary Table S4). This 3-gene combination with an AUC=0.95, nearly as good as the use of all 10 genes (AUC=0.99) and, provided 100% specificity, 80% sensitivity, PPV 100%, and NPV 83% (Fig. 1B).

Immunohistochemical analysis of HMGA2, MRC2/Endo 180, PLAG1, DPP4/CD26, P-cadherin/CDH3, DIRAS3/ARH1, and SFN/14-3-3σ. ; AUC=0.99) combination. The solid diagonal line denotes an AUC=0.50.
Tumor expressing moderate-to-high protein levels.
p-value is based on a Chi-squared test.
–, not determined, AUC, area under the curve; CI, confidence intervals.
QRT-PCR analysis of FNA samples
Because of the sensitivity and robust nature of QRT-PCR, we examined mRNA expression of HMGA2, MRC2, PLAG1, DPP4, FNDC4, CDH3, CEACAM6, PRSS3, SPOCK1, and SFN in a new set of 95 FNA samples. The FNA samples were from the following tumor/nodule types; adenomatoid nodules (n=50), follicular adenomas (n=10), Hürthle cell adenomas (n=5), lymphocytic thyroiditis nodule (n=1), Graves' disease (n=1), follicular variant of papillary thyroid carcinomas (n=5), and papillary thyroid carcinoma (n=23). Of the 95 FNA samples 27 had corresponding indeterminate or suspicious preoperative cytology reports. The intraoperative FNA samples were not processed for cytological review. There was no difference in gene expression between FNA samples collected preoperatively compared to those collected intra-operatively (unpublished data). As shown in Figure 2A, all of these genes were highly expressed in malignant FNA samples compared with benign samples. A representative agarose gel electrophoretic analysis for the mRNA expression of 15 FNA samples is also shown in Figure 2B. With the exception of MRC2, FNDC4, and SFN, mRNA expression levels of the remaining genes had been previously evaluated in thyroid tumors by QRT-PCR. In addition, the protein expression of six of these genes, including HMGA2, MRC2, PLAG1, DPP4, CDH3, and SFN were also tested by IHC in tumors (see Supplementary Table S1).
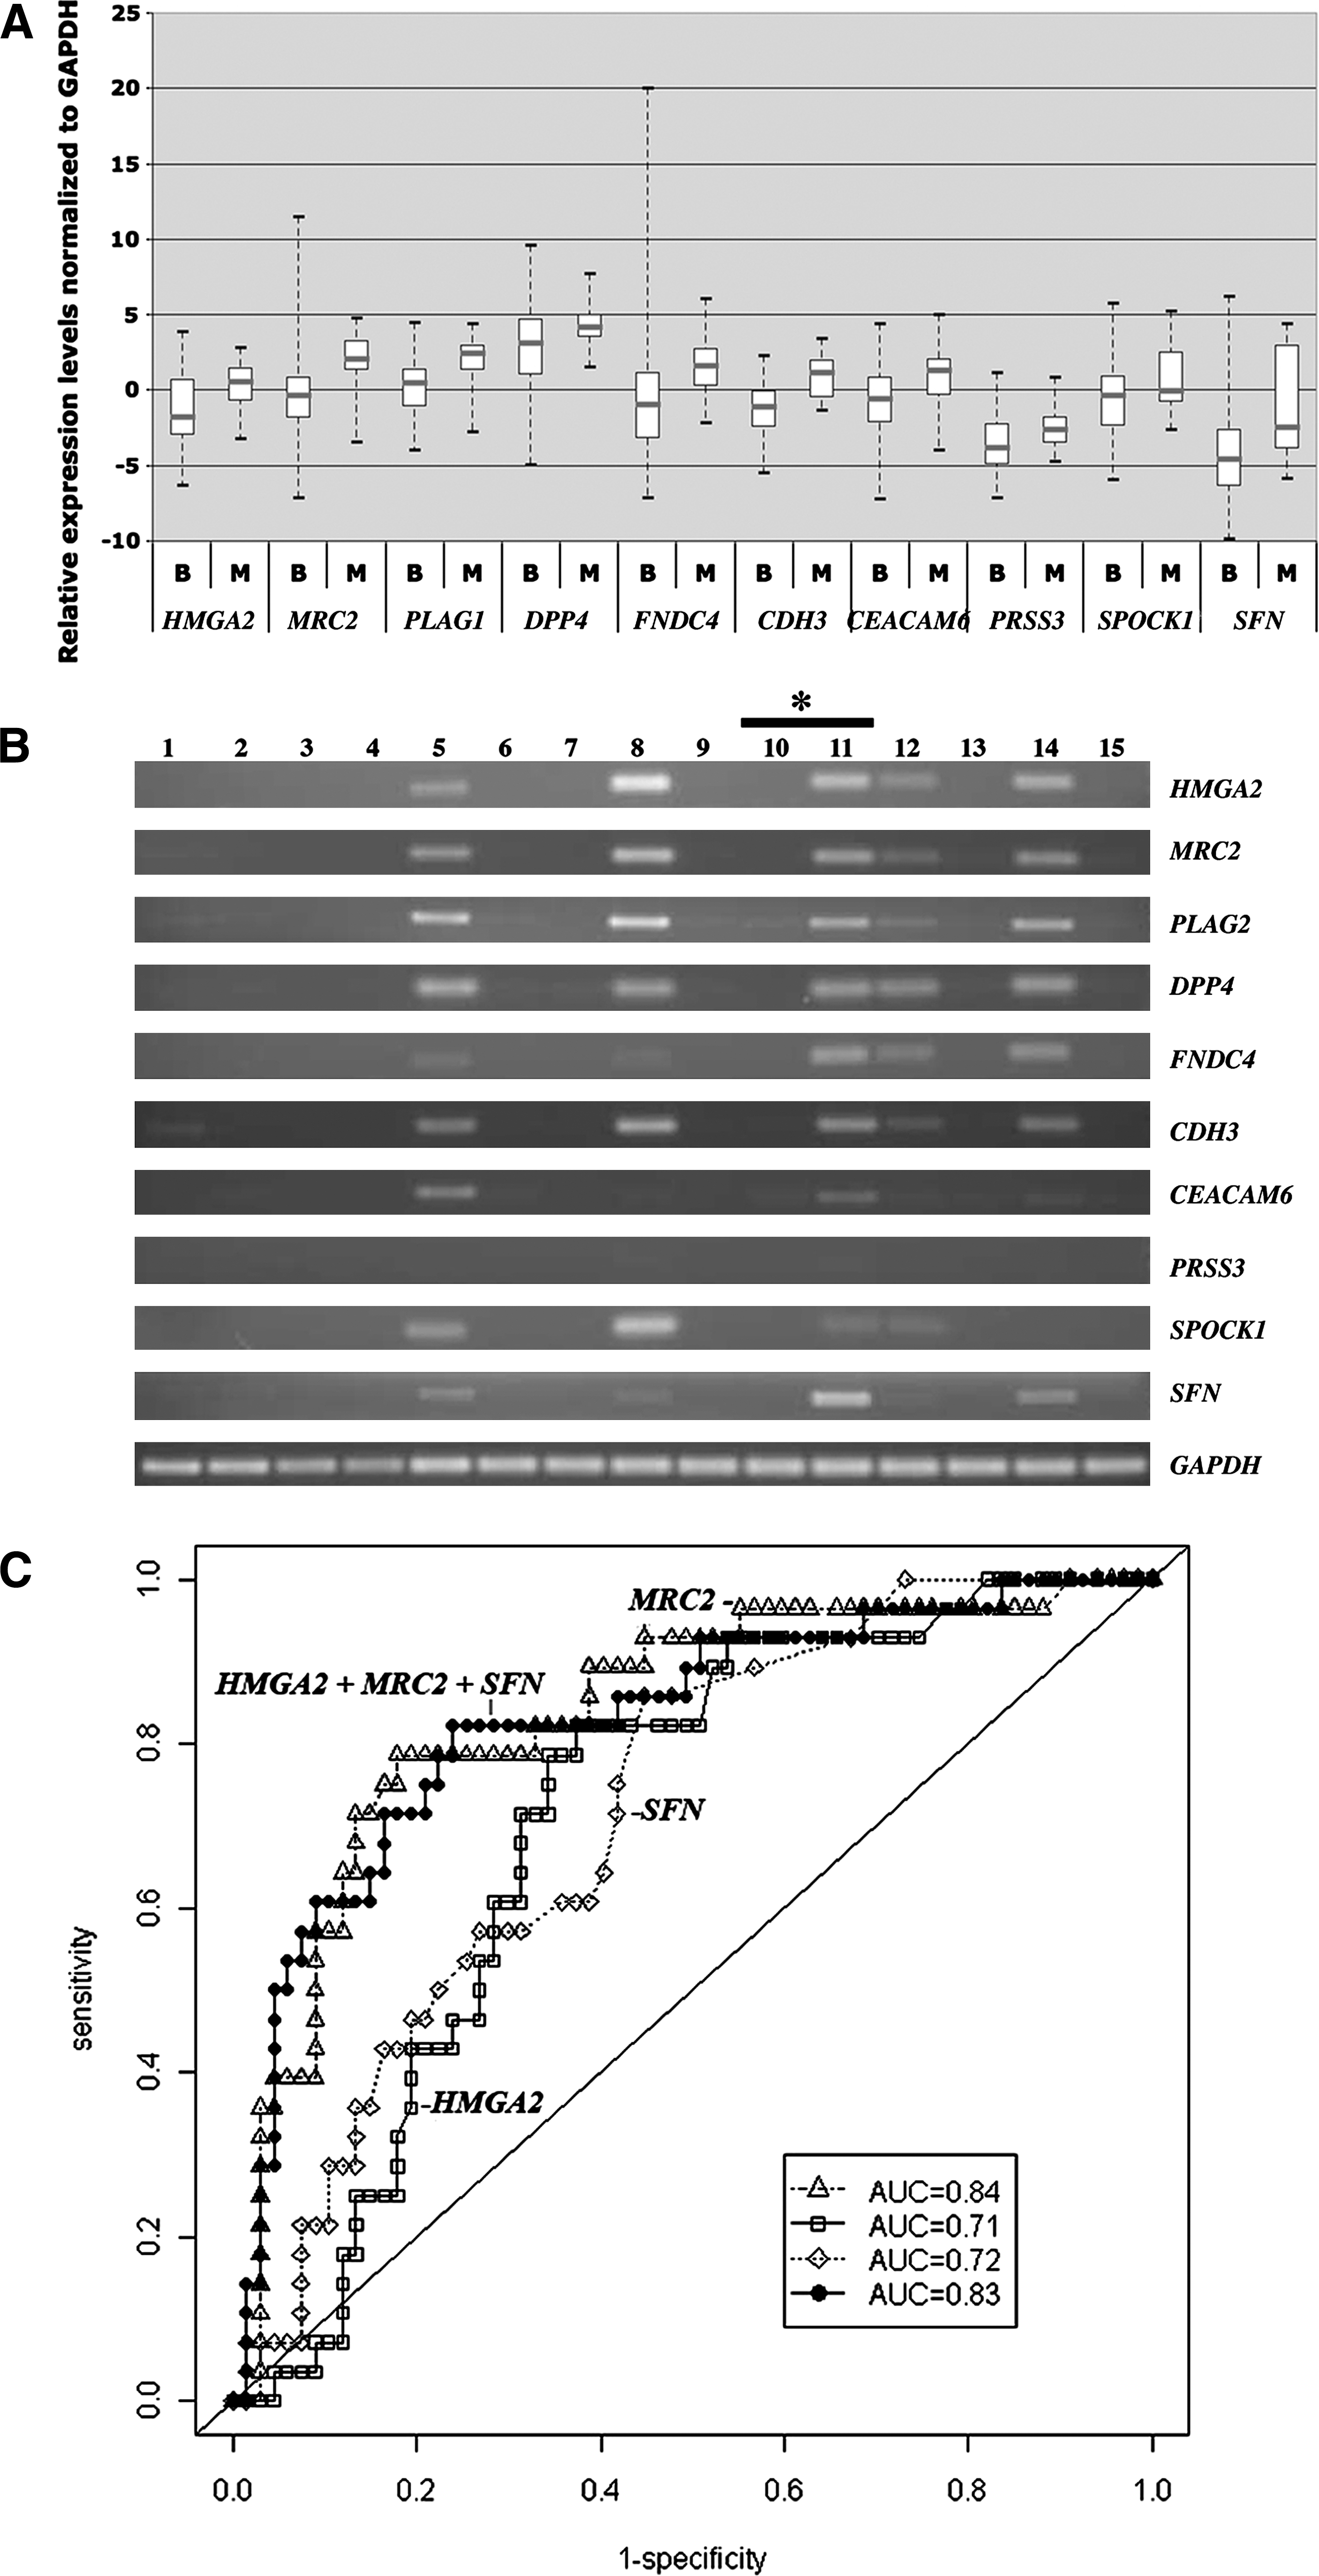
QRT-PCR analysis of HMGA2, MRC2, PLAG1, DPP4, FNDC4, CDH3, CEACAM6, PRSS3, SPOCK1, and SFN.
Similar to the approach used for analyzing the IHC results, logistic regression was performed on each gene individually first to examine the relationship between gene expression and tumor malignancy, then for use in constructing a ROC. Additionally, multivariable logistic regression was done to examine the ability of combinations of gene expression to distinguish benign from malignant. All 10 genes showed significantly higher odds of being associated with malignancy as compared with benign, with the gene, MRC2 (AUC=0.84) showing the highest discriminating ability (Table 2). Among the gene combinations that we analyzed, (HMGA2+MRC2+SFN), (HMGA2+MRC2+PLAG1), (HMGA2+MRC2+CDH3), and (HMGA2+PLAG1+CDH3) had AUC=0.83, and did not show any improvement compared with using MRC2 alone. Similar to the previous IHC analysis, the combination of (HMGA2+MRC2+SFN) had an AUC=0.83 with a sensitivity of 71%, specificity of 84%, PPV 65%, and NPV 88% (Fig. 2C). Of the 27 samples that had suspicious or indeterminate FNA results preoperatively the 3-gene model was 96% specific and 60% sensitive in the prediction of malignancy (PPV 75% and NPV 91%).
p-value is based on a Chi-squared test.
Discussion
FNA cytology is the most widely accepted diagnostic test for diagnosing a benign or malignant thyroid lesion in the majority of cases. However, since the cytological features of thyroid lesions are often not sufficiently distinct enough to distinguish between benign and malignant lesions, preoperative differentiation is often difficult and frequently inaccurate. To improve the sensitivity and specificity of cytological diagnosis, several studies have been conducted in the last decade to identify diagnostic molecular markers that can be used as an adjunct to FNA-based cytology (8,10 –18,22 –25).
In an effort to develop a molecular diagnostic panel for improving the differential diagnosis of thyroid nodules, we previously identified over 75 differentially expressed genes between benign and malignant thyroid tumors and validated 12 of these genes in thyroid tumors by QRT-PCR (19). In the present study we have further validated mRNA and/or protein expression of 14 genes in 154 thyroid tumors/nodules and 95 intraoperative FNA samples by using a combination of IHC and QRT-PCR analyses (Tables 1 and 2). The mRNA expression levels for seven of these genes (HMGA2, PLAG1, DPP4, CDH3, CEACAM6, PRSS3, and SPOCK1) were also previously confirmed in 107 thyroid tumors/nodules using QRT-PCR (19). However, the mRNA expression of remaining seven genes (KLK7, MRC2, CYP1B1, FNDC4, DIRAS3, SFN, and KIT) had not been previously examined. Altogether and including our previous study, we therefore validated the expression of 19 genes in a large number of thyroid tumors and FNA samples (Supplementary Table S1) (19). Within the context of thyroid nodule diagnosis, the differential expression of several of these genes, including HMGA2, MRC-2, DPP4, CDH3, SFN, KIT, and TPO5 have also been previously documented by other investigators (13 –15,26 –32). However, in contrast to our study, these investigators examined only a few histological subtypes, whereas we examined in all eight subtypes that can be associated with suspicious or indeterminate FNA cytology (5,19). Several markers or panels of markers have also been identified by other investigators and could be considered as an adjunct to our model. The most promising study is by Nikiforov et al., who tested Ras, ret/PTC, Pax-8/PPAR-γ, and BRAF in 52 benign and malignant thyroid lesions with associated suspicious/indeterminate FNA cytology (8). However, within this group there were 12 patients with benign cytology, 5 of which had a malignancy on final histopathology; with regard to this, it should be noted that, in general, 98%–99% of benign cytologies should be associated with benign histopathology (4). Using high dimensional genomic data from 178 retrospective surgical tissues and 137 prospectively collected FNA samples, Chudova et al. (25) have recently reported the molecular classification of thyroid nodules. The main focus in their study was to achieve maximization of negative predictive value in diagnosing a malignancy, whereas our present study focuses on the positive predictive value, thereby, in theory, allowing the clinician to better surgically manage these patients (i.e., perform total thyroidectomy, consider central neck dissection) (33).
To have a diagnostic tool that is useful in the clinical setting it is essential to select the least number of genes whose expression levels would provide the same ability to distinguish benign from malignant thyroid tumors that can have suspicious or indeterminate thyroid FNA cytology. Weber et al. previously demonstrated the genetic classification of follicular thyroid neoplasms with only three genes, Cyclin D2 (CCND2), protein convertase 2 (PCSK2), and prostate-differentiation factor (PLAB). The combination of these three genes could differentiate follicular thyroid carcinoma from follicular adenoma with a sensitivity of 100%, and a specificity of 94.7% (34). However, the diagnostic accuracy using these three-genes was found to be low (AUC range between 0.55 and 0.67) when they examined in large number of thyroid tumors and FNA samples representing several histological subtypes (35). The multi-marker assay with four different genes, chromosome 1 open reading frame 24 (C1orf24), integral membrane protein 1 (ITM1), DNA damage-inducible transcript 3 (DDIT3), and arginase II (ARG2) was also studied in thyroid tumors and FNA samples (12,36). Although this diagnostic test appeared promising, once again, the studies were performed on very few subtypes that can have suspicious or indeterminate thyroid FNA cytology (follicular adenoma, follicular carcinoma, follicular variant of papillary thyroid carcinoma, and hyperplastic nodules). The diagnostic utility of three genes, hector battifora mesothelial antigen-1 (HMBE-1), thyroid peroxidase (TPO), and dipeptidyl aminopeptidase IV (DPP4) was also examined in thyroid nodules with a final histology of follicular adenoma, papillary thyroid carcinoma, Hürthle cell carcinomas, follicular variant of papillary thyroid carcinoma, and follicular carcinoma (29). Although these genes showed promising IHC results, the use of HMBE-1, however showed no advantage over the use of TPO and DPP4 based on ROC analysis. Interestingly, both TPO and DPP4 were also identified in our microarray analysis as differentially expressed genes between benign and malignant thyroid tumors (19).
We have performed ROC analysis of the IHC and QRT-PCR data, separately with a total of 14-candidate genes, including HMGA2, KLK7, MRC2, PLAG1, CYPB1, DPP4, FNDC4, CDH3, CEACAM6, PRSS3, SPOCK1, DIRAS3, SFN, and KIT (Figs. 1B and 2C). Based on ROC analysis in thyroid tumors and intraoperative FNA samples, we propose a potential three-gene diagnostic model (HMGA2+MRC2+SFN) for the diagnosis of thyroid cancer. The gene combination HMGA2+MRC2+SFN (AUC=0.95) provides 100% specificity and 80% sensitivity in the differential diagnosis of thyroid tumors by IHC analysis (Fig. 1B). Further, the same gene combination used for FNA samples provides a specificity of 84% and a sensitivity of 71% with an AUC=0.83 when examined by QRT-PCR (Fig. 2C). Although, ideally, one would in the future examine the three-gene model first with a training set and then with a test set, our initial steps validating the array data in tumors that were not used for the initial array analysis and then testing it in a set of FNA samples from additional samples gives credence to the model having promise as a diagnostic adjunct. Indeed, the latter assay holds tremendous promise for its ease in use, and its reproducibility. Thus, with our three-gene model, the diagnostic accuracy for distinguishing benign and malignant thyroid nodules is much higher than the previously published studies. Additionally, the three-gene model is likely more robust for the following reasons; (i) our three-gene model was established through validation of both protein (IHC) and mRNA (QRT-PCR) expression in thyroid tumors/nodules and intraoperative FNA samples, respectively, and (ii) our study also includes a comprehensive set of tumors/nodules representing all the histological subtypes (follicular adenoma, adenomatoid nodule, lymphocytic thyroiditis nodule, Hürthle cell adenoma, Hürthle cell carcinoma, follicular carcinoma, follicular variant of papillary thyroid carcinomas, and papillary thyroid carcinoma) that can present a diagnostic dilemma for the cytopathologist and clinicians caring for these patients, and FNA samples from the following subtypes; adenomatoid nodule, follicular adenomas, Hürthle cell adenomas, lymphocytic thyroiditis nodule, Graves' disease, follicular variant of papillary thyroid carcinomas, and papillary thyroid carcinoma. Since we did not have follicular cancers represented by the FNA samples, it cannot be stated that this classifier can distinguish follicular adenoma from carcinoma. The possibility of specifically testing the classifier in a series more enriched for follicular adenoma (FA) and follicular carcinoma (FC) could be considered for future studies.
Considering the diagnostic accuracy that we observed from ROC analyses of tumors (Fig. 1B) and FNA samples (Fig. 2C), it may be reasonable to assume that the use of some combination of HMGA2, MRC2, and SFN could be applicable as an adjunct to FNA cytology in the differential diagnosis of indeterminate lesions. Interestingly, all of the markers that comprised our assay have been shown by others to have a role in cancer progression. The role of HMGA2 in the progression of pancreatic ductal adenocarcinoma (37) and papillary serous carcinoma (HG-PSC) in fallopian tubes (38) has been previously reported. MRC2 (also known as Endo 180) has been shown by others to be overexpressed in malignant thyroid tumors (13,19,26). MRC2 was also shown to co-function with urokinase-type plasminogen activator receptor-associated protein (uPARAP) in chemotactic tumor cell migration (39,40). The functionality of MRC2 has also been implicated in prostate cancer progression (40). Higher SFN/14-3-3σ expression has been reported in lung cancer (41), squamous cell carcinoma (42), pancreatic cancer (43) endometrial carcinoma (44), cervical cancer (45), and colorectal carcinoma (46) and appears to be associated with an overall worse prognosis. Specifically, higher SFN/14-3-3σ expression significantly correlates with large tumor size and depth of invasion of vulva squamous cell carcinoma (42). SFN/14-3-3σ has also been shown to be associated with metastases in squamous cell lung carcinoma (47). Using invasion assays, Neupane et al. showed that pancreatic cancer cells (Panc-1) overexpressing 14-3-3σ have increased EGF-stimulated invasion and motility (43). Thus, these above studies strongly support the possibility that the genes, HMGA2, MRC2/Endo 180, and SFN/14-3-3σ may not only serve in a diagnostic panel for thyroid cancer, but may also be directly involved in thyroid carcinogenesis.
In summary, our results suggest that the expression levels and patterns of HMGA2, MRC2/Endo 180, and SFN/14-3-3σ could be useful in the differential diagnosis of benign versus malignant thyroid cancers that have associated suspicious or indeterminate cytology. We therefore propose that a combination of cytology and multi-marker assay, comprising both mutation-specific and gene expression-specific markers could be used to assist in the cytological diagnosis of indeterminate thyroid nodules, thereby improving the sensitivity and specificity of thyroid cancer diagnosis and, resulting in improved surgical management of these patients.
Footnotes
Acknowledgments
We would like to thank Alan Silverio, Byron Anderson, Gwen Mayo, Monica Gray, Latasha Bennett, Francine Cappizzi, Helen Levy, Pat Brown Queen, Riley Williams, and Schikia Williams for their help in collecting thyroid specimens. These studies were supported by NIH grant RO1-CA107247-01A1 (M.A. Zeiger) and Surgery Pilot Grant from Johns Hopkins Department of Surgery (N.B. Prasad).
Author Disclosure Statement
The authors declare that no competing financial interests exist.