
Abstract
Background:
A major problem in the treatment of patients with congenital hypothyroidism (CHT) is that the optimal individual target values of thyrotropin (TSH) and free thyroxine (fT4) are unknown. We investigated whether patients with CHT have during treatment considered optimal stable fT4 and TSH steady-state concentrations (SSCs) that can be used as target values, and whether TSH or fT4 is more useful in guiding decisions regarding therapy.
Methods:
From 60 early-treated patients with CHT, TSH and fT4 follow-up samples within the age interval 1.5–132 months (postinitial period) and within TSH interval 0.5–10 mU/L were selected. TSH and fT4 SSCs were estimated by taking the individual mean values of a series of determinations, under the most euthyroid conditions possible (n=1257), for the whole age and TSH intervals, as well as for the age intervals 1.5–24, 25–72, and 73–132 months, as well as, for fT4, for the two split TSH intervals 0.5–4.49 and 4.5–10 mU/L. For all SSCs, the within-subject coefficient of variation (CVw) was determined. Further, fT4 SSCs were assessed for the first 6 weeks after therapy initiation.
Results:
For both TSH and fT4, individual SSCs differed significantly (p<0.001). The 95% confidence interval for TSH SSCs was 1.1–5.7 mU/L and for fT4 SSCs 16.6–28.7 pmol/L. Mean CVw values for TSH and fT4 SSCs were 60.9% and 13.1%, respectively. Individual fT4 and TSH SSCs were reproducible when assessed for the three age intervals, both slightly decreasing with age (p≤0.033), and fT4 SSCs were reproducible for the two split TSH intervals, with a slight fT4 difference (p<0.001). fT4 SSCs were largely independent of the administered LT4 dosage (range 2.4–6.1 μg/kg). fT4 SSCs of the initial period were comparable to those of postinitial period with a mean±SD difference of 1.0±3.5 pmol/L, p=0.07.
Conclusions:
Our study suggests that in CHT during therapy considered optimal, stable TSH and fT4 SSCs can be found slightly decreasing with age and largely independent of the administered LT4 dosage (range 2.4–6.1 μg/kg). In clinical follow-up, fT4 SSCs may be more valuable as individual target values than TSH SSCs.
Introduction
For healthy adults, as well as for adults with stable thyroid abnormalities (12 –14), narrow individual variations in serum TSH and T4 concentrations were found, suggesting that each individual has unique thyroid hormone settings that will be kept constant, even under abnormal circumstances. Individual fT4 concentrations showed a bandwidth with a within-subject coefficient of variation (CVw) below 10%, while TSH concentrations displayed more variation (CVw>10%) (12 –14).
In this study, we longitudinally followed 60 early-treated patients with CHT during the age period 1.5–132 months after start of therapy by analyzing their fT4 and TSH values in follow-up samples during therapy considered optimal. The objective was to investigate whether fT4 and TSH hormone steady-state concentrations (SSCs) are present in patients with CHT, and if so, which parameter with regard to variability and validity of the SSCs would be the most useful for clinical follow-up. In addition, we investigated whether thyroid hormone SSCs are present during the first weeks of therapy.
Methods
Subjects
The study group consisted of 60 patients (19 boys and 41 girls) with CHT born between February 1993 and July 1996. The characteristics of this group are described in previous publications (15,16). The group contained 26 children with severe CHT and 34 with mild CHT. The qualification “severe” or “mild” was related to etiology: severe CHT was defined as a total deficiency in T4 production, and mild CHT as a partial deficiency (15,16). In the Netherlands, all infants with a positive screening result are referred to and stay under the care of a local pediatrician who reports patient data to the national CHT coordination office. Our patients were recruited on the basis of questionnaires sent out by this office to the pediatricians and included after written informed parental consent. The study was approved by the medical ethics committee at the Erasmus Medical Center, Rotterdam, and by the privacy committee of the CHT Screening Board.
Treatment
The local pediatricians made all decisions on the treatment regimen. The aim was to achieve and maintain the euthyroid state. For the first weeks, a dosage reduction of LT4 (commercially available tablets only) with 1 μg/kg was advised when fT4 was >35 pmol/L with TSH <10 mU/L, and thereafter to keep fT4 in the upper normal range with TSH between 0.5 and 10 mU/L (17). Mean±SD pretreatment fT4 was 6.0±4.3 pmol/L. Mean LT4 starting dose was 8.7±2.2 μg/kg, subdivided into the groups High (≥9.5 μg/kg, n=29) and Low (<9.5 μg/kg, n=31). Mean age at initiation of treatment was 14.2 (4.5) days, subdivided into the groups Early (<13 days, n=27) and Late (≥13 days, n=33).
TSH and fT4 SSCs in the postinitial period
TSH and fT4 SSCs were defined as those concentrations in treated patients with CHT at which both TSH and fT4 are constant in spite of ongoing processes that strive to change them. TSH and fT4 SSCs can be estimated by determining the individual mean value of a series of determinations, under as much as possible stable and euthyroid conditions. We assumed that most euthyroid samples would be present in patient samples with a TSH value between 0.5 and 10 mU/L (17). This, of course, limited TSH SSCs to values within this interval, but in view of the finding that the majority of treated patients with CHT have a hypothalamic–pituitary feedback system within the high-normal range (9), we presumed that most TSH SSCs would be inside this interval. We therefore selected those TSH and fT4 measurements having TSH concentrations within this interval and obtained 1.5–132 months after the start of therapy (postinitial period). In a first run, individual mean and SD values of TSH and fT4 were determined over these samples (n=1425). Thereafter, samples outside the individual TSH and fT4 ranges (mean±2SD) and samples not inside both the fT4 as well as the TSH range were excluded, to improve the chance that the remaining samples would be predominantly euthyroid. For the remaining samples (n=1257, with an average of 21 samples/child), TSH and fT4 SSCs were determined, being the means of the measurements of the individual child. Each individual SSCs demanded at least three samples per child. For all individual series of observations, the CVw was determined.
To analyze the influence of age, SSCs were determined for three age periods: 1.5–24, 25–72, and 73–132 months. In addition, fT4 SSCs were assessed for the split TSH intervals 0.5–4.49 and 4.5–10 mU/L. Furthermore, relationships were analyzed between the SSCs and the type of CHT, age at onset of therapy, and the magnitude of the initial dose of LT4. In addition, we analyzed the relationship between fT4 SSCs and individual mean LT4 dosage over the whole age interval, as well as the relationship within the patients between the fT4 concentrations and the administered LT4 dose.
fT4 SSCs in the initial period
To explore the presence of SSCs at early age, those fT4 measurements were selected which had been obtained 1–6 weeks after the start of therapy (initial period), and having fT4 concentrations within the 95% fT4 SSCs range of the whole study group, established for the postinitial period. Infants were only included if three or more valid samples were available. Mean fT4 values (i.e., initial SSCs), SD, and CVw values were estimated.
Laboratory tests
fT4 and TSH were measured in 27 different laboratories whose quality of measurement is surveyed by the National External Quality Scheme on Immunoassay surveys. Because the normal adult values of these laboratories matched very closely, we accepted the small differences in fT4 and TSH concentrations caused by the different assay methods. Adult reference values were for fT4 11–25 pmol/L and for TSH, at the time of this study, 0.4–4.3 mU/L.
Statistical analysis
Statistical analysis was done with SPSS version 17.0 (SPSS, Inc., Chicago, IL). CVw (%) was calculated as (SDw/Meanw)×100%, where SDw is the within-subject variation of fT4 or TSH, and Meanw the individual mean value. The lower the CVw values, the less the Gaussian curve of the individual observations and that of the observations of the total population will overlap, which adds to the specificity of the SSCs. The index of individuality (IoI) was determined as the ratio between the CVw and the between-subject coefficient of variation (CVw/CVb) (18 –20). A two-tailed significance of p<0.05 was chosen for all tests. The significance of the SSCs was determined by an ANOVA procedure. CVw values for fT4 and TSH were compared with the paired t-test. The age dependency of TSH and fT4 SSCs and CVw values were evaluated by determining the differences of these variables between the first and last age period and testing them for inequality with zero with the Student's t-test; only patients with longitudinal data were included. The differences in fT4 SSCs as well as CVw values obtained for the two TSH split intervals were compared with the paired t-test. To analyze the effect on the SSCs of type of CHT, age at initiation of therapy (Early or Late), and magnitude of initial dose (High or Low), the Student's t-test was applied. The significance of the difference between the initial and postinitial fT4 SSCs and CVw values was assessed with the paired t-test. The association between TSH (converted to logarithmic values), and fT4 (in individualized standard deviation score values) was evaluated per age group, including the initial period, by log-linear bivariate Pearson correlations. To evaluate the effect of individual mean LT4 dosage over the whole age interval on fT4 SSCs, a bivariate Pearson correlation was used. A mixed model with fixed structure was used to analyze the relationship within the patients between the fT4 concentrations (dependent variable) and the administered LT4 dose (covariate). The number of samples needed to estimate an SSC depends on the desired 95% confidence interval (CI) and precision level, as well as on the variation around the individual SSCs. This number was calculated with the formula, N=(Z×CVw/D)2, where N is number of samples needed, Z is number of standard deviations required for the desired CI (i.e., Z=1.96 for a CI of 95%), and D is closeness to the SSCs (a measure for the precision level, i.e., D=5% for a precision level of 95%) (19,21). Normality of the distribution of fT4 and TSH in the individual samples was analyzed with the Shapiro–Wilk test. The means for fT4 and TSH of the resulting normality values as well as those of the individual values for skewness were compared with the paired t-test.
Results
TSH and fT4 SSCs in postinitial period
For both TSH and fT4, individual mean values (i.e., SSCs) differed significantly (p<0.001; Tables 1 and 2, Fig. 1). Mean±SD (P2.5;P97.5) TSH SSC was 3.3±1.9 (0.9;5.7) mU/L, and mean fT4 SSCs was 21.7±2.6 (16.5;28.8) pmol/L. For fT4, the mean CVw was less than that for TSH (12.0±3.9% vs. 58.9±13.6%, p<0.001). IoI for TSH and fT4 were 2.21 and 1.11, respectively. For the three age periods, we found that for both TSH as well as fT4, individual SSCs differed significantly (p<0.001). The longitudinal SSCs values correlated strongly (period 1 to period 2: fT4 R=0.68, p<0.001, TSH R=0.52, p=0.04; period 2 to period 3: fT4 R=0.86, p<0.001, TSH R=0.61, p<0.001). They slightly decreased with age. Mean individual TSH difference between the first and last age period was 0.6±1.4 (0.2;1.0) mU/L, p=0.005; mean individual fT4 difference was 0.8±2.6 (0.0;1.6) pmol/L, p=0.044. CVw did not significantly change over the years (Tables 1 and 2). Within the two SSCs series obtained for the split TSH intervals 0.5–4.49 and 4.5–10 mU/L, individual mean fT4 values differed significantly (p<0.001 for both). Mean TSH concentrations of the two intervals were 2.1±1.1 mU/L and 6.2±1.3 mU/L, respectively. Mean fT4 SSCs values (22.1±2.7 pmol/L) of the series from the lower TSH interval were slightly higher than those from the higher interval (21.3±2.6 pmol/L; p<0.001), a mean difference of 1.2±1.4 (0.76;1.62); mean CVw was 11.8±4.0% and 10.6±4.7%, respectively (p=0.37). The SSCs were neither affected by the type of CHT, nor by the initial treatment factors (Early or Late start of treatment, High or Low initial dosage; p>0.7 for all, data not shown).
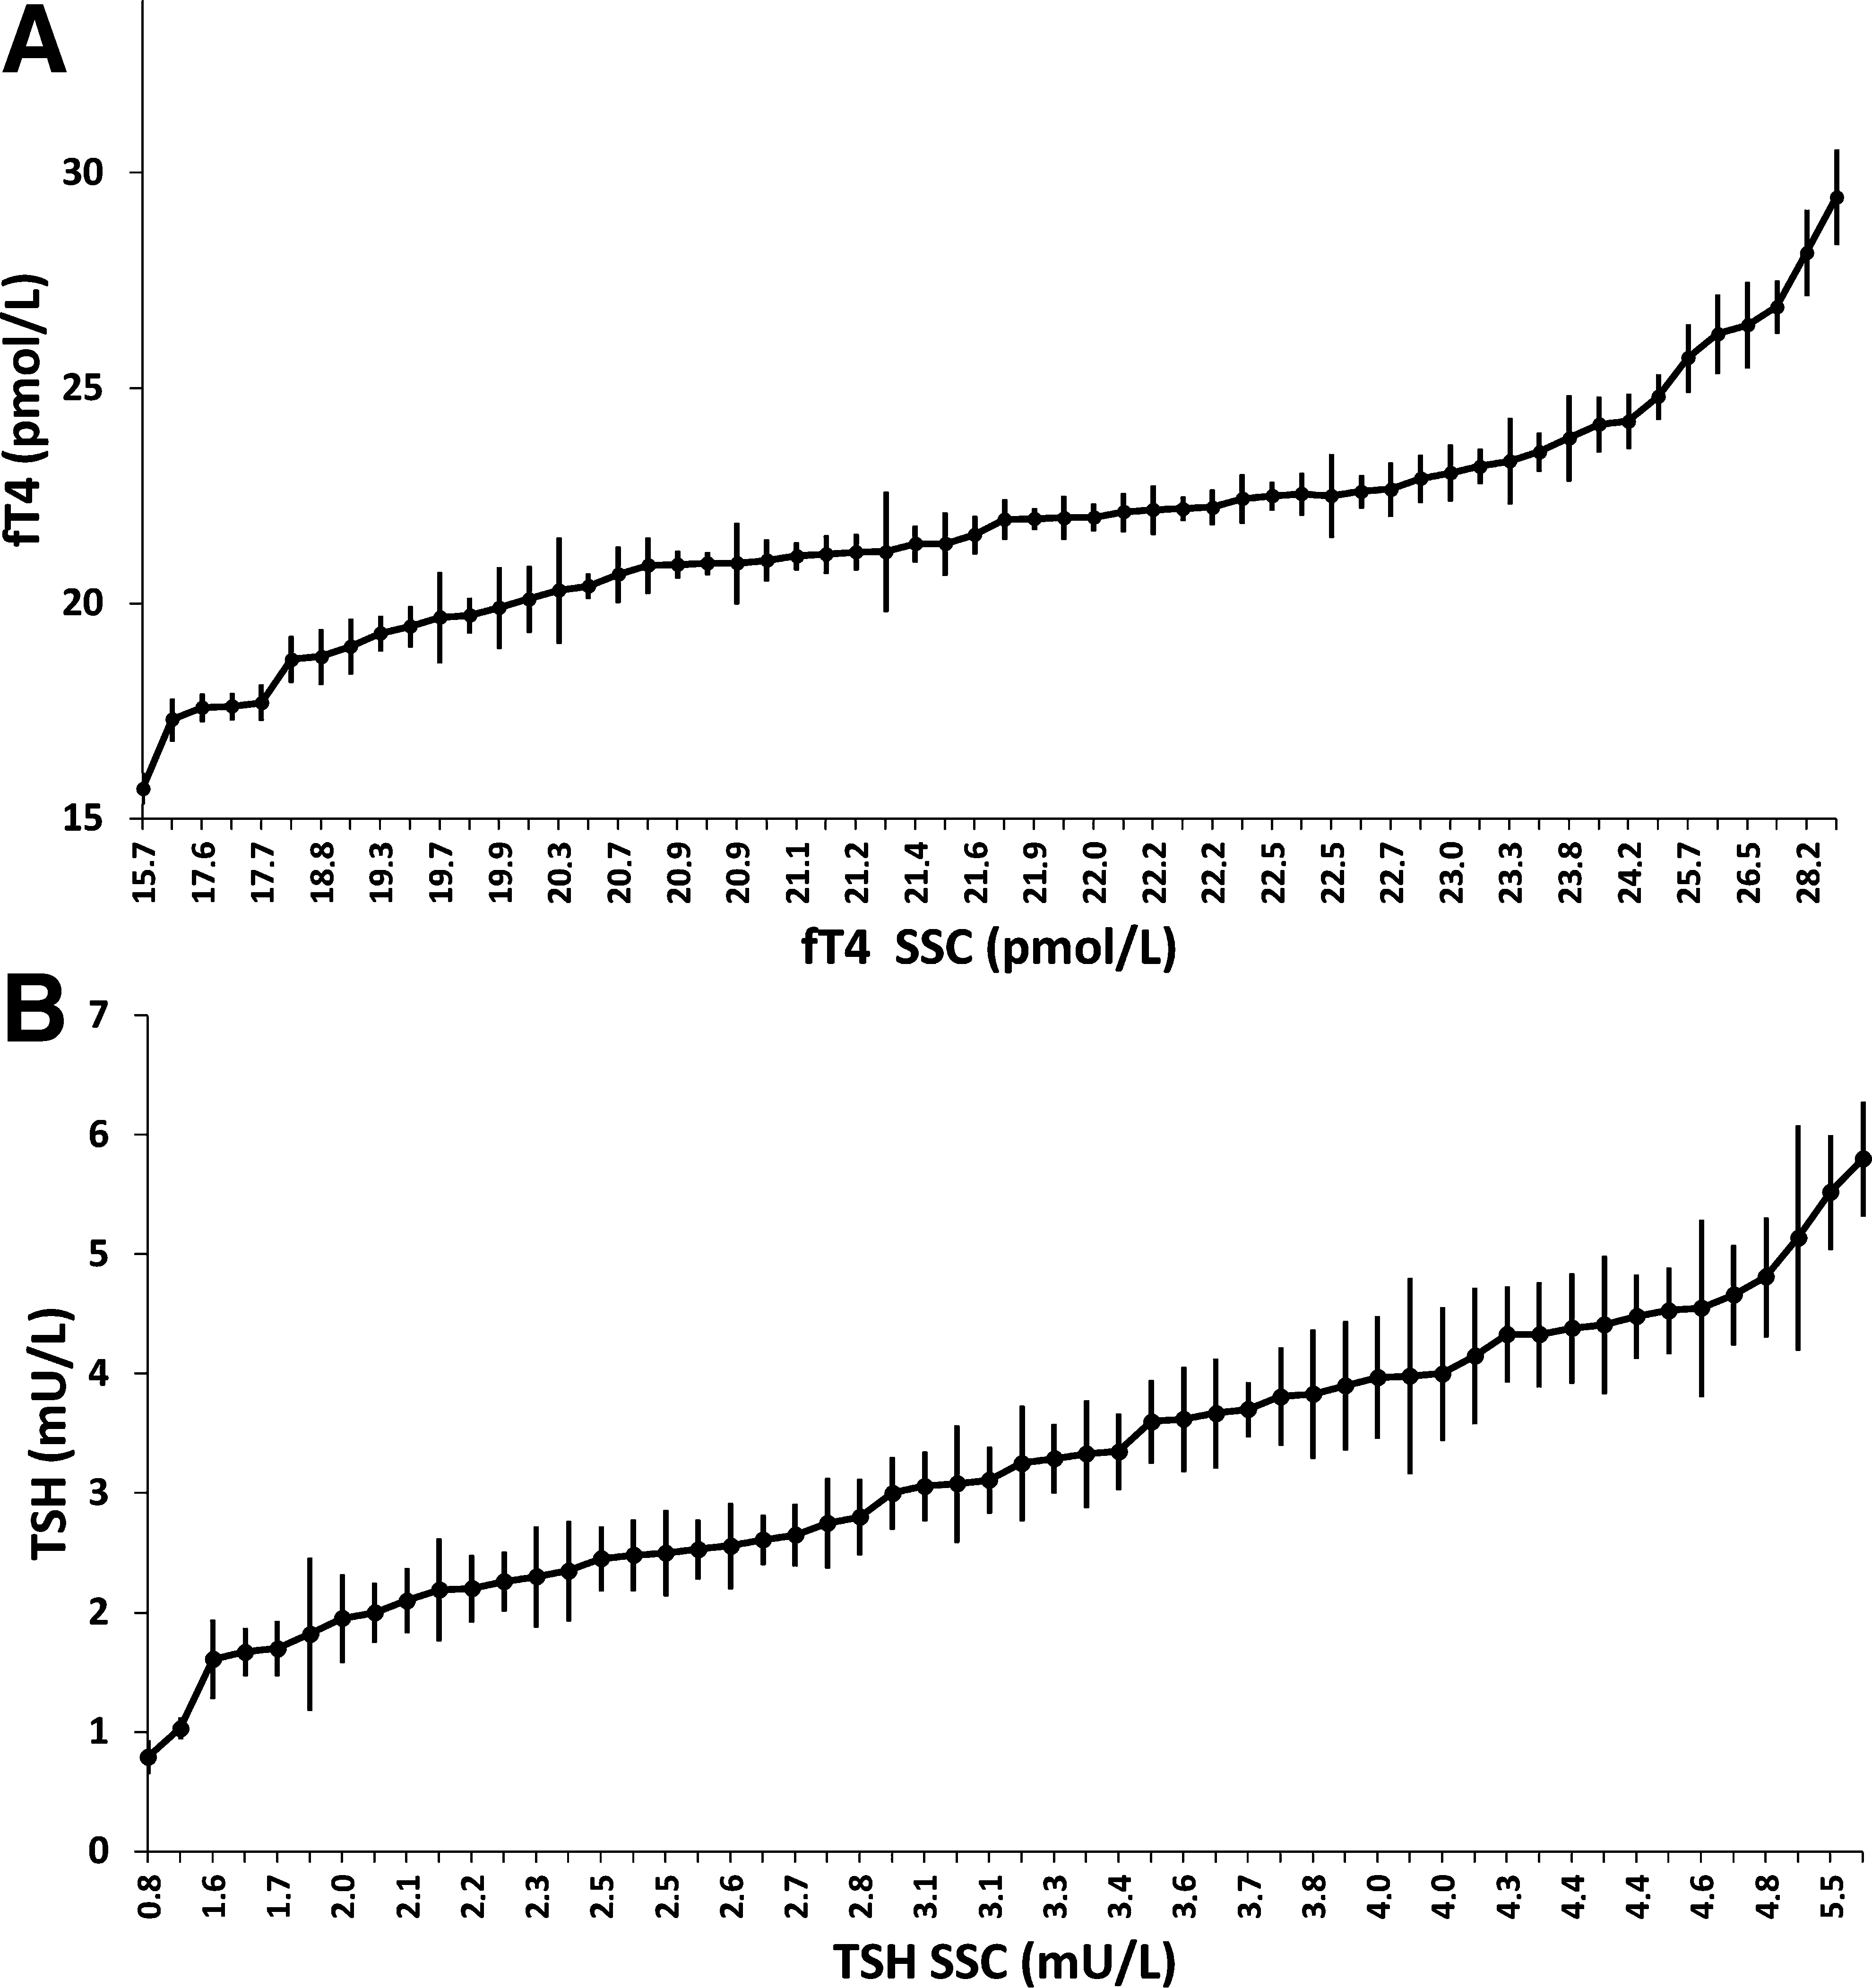
Individual steady-state concentrations (SSCs; mean±1 SEM) for free thyroxine
Age after onset of therapy.
p-Value of differences in SSC or CVw between the first and the last age interval.
p-Value of differences between the SSC of the two TSH intervals.
fT4 interval for initial SSCs: 95% of postinitial fT4 SSCs range of whole study group.
p-Value of differences between initial SSC and SSC for age interval 1.5–132 months.
TSH, thyrotropin; fT4, free thyroxine; SSC, steady-state concentration; CVw, within-subject coefficient of the variation.
Age after onset of therapy.
p-Value of differences in SSC or CVw between the first and the last age interval.
SSCs in initial treatment phase
For the initial phase, fT4 SSCs were found (22.5±3.0 (16.2;27.3) pmol/L), with a CVw value of 13.2±6.3% (Table 1). The fT4 difference between these SSCs and those from the postinitial period (1.0±3.5 pmol/L) was not significant (p=0.07).
Further statistical analyses
TSH and fT4 SSCs did not correlate (R=0.10, p=0.46). Weak, but significant, relationships were found between fT4 and logarithmic TSH values within their individual SSC±2SD ranges for the three postinitial age periods (R=−0.21, R=−0.15, and R=−0.17, respectively; p≤0.002 for all). For the initial period, the relation fT4–log TSH was not significant (R=0.01). fT4 SSC values and the individual mean LT4 dosage over the whole age period (4.0±1.0 (2.4;6.1) μg/kg) did not correlate (R=0.17, p=0.20). Within the patients, the received dose was weakly related to the fT4 values within the SSC range [p=0.031, effect estimate 0.27 (0.03;0.52) pmol/L fT4 per 1 μg/kg LT4]. With the number of samples we used for the postinitial period (21 samples/patient), fT4 SSCs could be estimated with 95% CI at a precision level of 95%, TSH SSCs with a precision level of 75%. To increase the precision level for TSH SSCs to 95%, 507 samples/patient would be needed. The fT4 SSCs in the initial phase (4.6 samples/patient) could be estimated with a precision of 88%. Normality of distribution in the individual samples was better for fT4 (mean W-statistic 0.92±0.05) than for TSH (mean W-statistic 0.88±0.06, p<0.001), as was the skewness of the samples (fT4 0.50±0.63, TSH 0.75±0.55, p=0.030).
Discussion
Our study suggests that in patients with CHT under the therapy regimen considered optimal, TSH and fT4 SSCs can be found. The values of the TSH and fT4 SSCs extended from the upper normal range to above that range. The data seem to indicate that fT4 SSCs exist already just after birth and decrease slightly with age. fT4 SSCs seem largely independent from the administered LT4 dose (range 2.4–6.1 μg/kg). This suggests that the system will somehow try to keep fT4 stable within the individual's SSC range. There are of course limits to the magnitude of the dose that can be overcome by the system. Too high and too low dosages may lead to overtreatment and undertreatment, respectively. fT4 SSCs, determined for the TSH interval 0.5–10 mU/L, were reproducible in terms of mean value, variation, and 95% range when assessed for the two split TSH intervals (0.5–4.49 and 4.5–10 mU/L) as well as for three age periods, 1.5–24, 25–72, and 73–132 months after start of therapy. The small difference in mean fT4 values when assessed for the two split TSH intervals probably reflects the large TSH response to minor fT4 changes (12). TSH SSCs were less well defined than fT4 SSCs with regard to significance, variability around the individual mean, and normality of the distribution.
The most promising aspect of our study is that it may provide a way to assess individual target values in CHT treatment. This is an important issue, because the commonly used fT4 reference ranges in this respect, the upper normal range (3) or 18–30 pmol/L (1,4), seem to be too wide to signal fT4 fluctuations that may be important for the individual patient, especially when his or her fT4 SSC lies at the extreme of the range (21). A serum fT4 value of 24 pmol/L, for instance, may be normal for a patient with an fT4 SSC at 23 pmol/L, but can be too low when the SSC is 30 pmol/L and too high when it is 18 pmol/L. In this way, undertreatment and overtreatment may pass unnoticed, although the serum fT4 concentration is within the CHT reference range. SSC, and especially fT4 SSC, may thus provide a valuable measure to evaluate euthyroidism in the individual patient with CHT.
The validity of the SSC may be questioned in view of the high IoI, above the critical value of 0.6 for both fT4 and TSH SSCs, and the relatively large variation around the individual means (CVw). However, in patients with CHT, it is first of all important that we can establish individual SSCs with sufficient precision. With our 21 measurements per patient, the SSC for fT4 could be estimated with a reasonable precision level of plus or minus 5%, while for TSH the precision level was lower (plus or minus 25%). Furthermore, IoI, the ratio between CVw and CVb, was high mainly because of a high CVw. Our CVw values for fT4 and TSH SSCs (12.0% and 58.9%) were about twice that described for healthy adult and adults with thyroid abnormalities (12,13): 6–10% for fT4 and 10–36% for TSH. Comparison with pediatric values is not possible, because fT4 and TSH SSCs in infants and children were not described earlier. The reason for the high fT4 CVw in the present study is not clear. The large variation may be an intrinsic characteristic of patients with CHT, but it may also have been caused by the unintentional inclusion of hypothyroid and hyperthyroid samples in the analysis, despite the fact that extreme values were excluded, and that samples were only included when both fT4 and TSH were within the individual ranges. Other factors contributing to the large CVw may be the instability of the fT4 assays over the years (22), the fact that some patients changed their hospital (i.e., laboratory), which adds to the CVw, and the variation in the given LT4 dose. Further reduction of the inclusion of abnormal fT4 samples seems not feasible, because the interpretation of euthyroidism based on TSH is troublesome in patients with CHT. Most experts accept TSH concentrations as the best reflection of the euthyroid state (12,23). We found, however, that in patients with CHT, the CVw of TSH was even larger than that of fT4. This may be an intrinsic CHT characteristic, but other factors may play a role too. One of them may be the circadian rhythm of TSH that is present in healthy subjects as well as in patients with CHT, while fT4 hardly displays such rhythm (24,25). Although most infants and children had to be routinely controlled at fixed times, this was not always done so. Another reason for the large CVw of TSH may be the lack of synchronization between fT4 and subsequent TSH changes. For instance, in the initial period, fT4 was already normalized, whereas TSH was still (very) high. Another example is the typical laboratory data occurring in patients with bad compliance. High TSH concentrations are found, reflecting the bad compliance in the period before sampling, in combination with relatively high fT4 values, reflecting the actual situation that medication was taken shortly before sampling. This issue is not unimportant. Infants, especially in the initial period, are more frequently controlled (one to four times a month) with more frequent dose adaptations than adults with the consequence that the interpretation of their individual TSH samples due to diurnal rhythm and lack of synchronization is hazardous. This, together with its relative imprecise SSC, makes TSH (when between 0.5 and 10 mU/L) less reliable in patients with CHT than in normal subjects and in adults with acquired thyroid disease (12 –14). Moreover, in CHT treatment, it seems first of all important to avoid overtreatment and undertreatment, and it is the availability of fT4 and not that of TSH, which determines whether or not damage will be done to brain maturation, most vulnerable in infancy.
If the SSC concept is right, it should be a first concern to normalize the patient's fT4 values before the TSH concentrations. For the first weeks, our suggestion would be to keep fT4 concentrations within the postinitial SSC reference range, which for our cohort was 17–29 pmol/L, with a mean value of 22 pmol/L. The data of the initial phase suggest that fT4 SSC can be assessed with the samples of the first weeks, once fT4 values have stabilized. Assessment of the TSH SSC seems only possible at a later age, when TSH concentration has decreased to <10 mU/L. After that, TSH levels can be kept either within the patient's own individual range or within the SSC reference range that for our CHT cohort was 1.1–5.7 mU/L, with a mean value of 3.3 mU/L. It seems inappropriate to apply adult TSH reference ranges in the follow-up of patients with CHT.
Our results suggest that SSCs may provide a valuable way to evaluate euthyroidism in patients with CHT, because they allow estimating individual target values. Further studies will have to elucidate the clinical relevancy of the SSCs in CHT treatment, especially for optimizing therapy and eventually cognitive outcome.
Footnotes
Acknowledgments
We gratefully acknowledge Prof. T.J. Visser (Department of Internal Medicine, Erasmus University Medical Center) for his critical reading of the manuscript. This study was financially supported by grants from the Theia Foundation, Jan Dekker & Ludgardine Bouwman Foundation, and Erasmus University Rotterdam Association Trust Fund.
Disclosure Statement
None of the authors received any payment, honorarium, or grant to produce the manuscript. This article is not subject to any potential conflict of interest, real or perceived.