
Abstract
Background:
Propylthiouracil (PTU) and methimazole (MMI) are drugs that are widely used to treat Graves' disease. Although both exert an antithyroid effect primarily by blocking thyroid peroxidase activity, their molecular structure and other actions are different. We hypothesized that PTU and MMI may have differential effects on thyroid-specific gene expression and function.
Methods:
The effects of PTU and MMI on thyroid-specific gene expression and function were examined in rat thyroid FRTL-5 cells using DNA microarray, reverse transcriptase (RT)–polymerase chain reaction (PCR), real-time PCR, Western blot, immunohistochemistry, and radioiodine uptake studies.
Results:
DNA microarray analysis showed a marked increase in sodium/iodide symporter (NIS) gene expression after PTU treatment, whereas MMI had no effect. RT-PCR and real-time PCR analysis revealed that PTU-induced NIS mRNA levels were comparable to those elicited by thyroid-stimulating hormone (TSH). PTU increased 5′-1880-bp and 5′-1052-bp activity of the rat NIS promoter. While PTU treatment also increased NIS protein levels, the size of the induced protein was smaller than that induced by TSH, and the protein localized predominantly in the cytoplasm rather than the plasma membrane. Accumulation of 125I in FRTL-5 cells was increased by PTU stimulation, but this effect was weaker than that produced by TSH.
Conclusions:
We found that PTU induces NIS expression and iodide uptake in rat thyroid FRTL-5 cells in the absence of TSH. Although PTU and MMI share similar antithyroid activity, their effects on other thyroid functions appear to be quite different, which could affect their therapeutic effectiveness.
Introduction
PTU and MMI are both rapidly absorbed from the gastrointestinal tract, but their ability to bind serum proteins differs with MMI existing essentially unbound in serum, whereas 80%–90% of PTU is bound to albumin (9). Antithyroid drugs have a variety of minor side effects, as well as potentially life-threatening or even lethal complications. MMI side effects are dose related, whereas the connection to dose is less clear for PTU (9,10). Such side effects occur in ∼5% of patients and include cutaneous reactions (usually urticaria or macular rashes), arthralgia, and gastrointestinal upset (9). There are many reports about the frequency of agranulocytosis, the major and most serious side effect of antithyroid drug therapy. This is thought to be mediated by an autoimmune process, as evidenced by the presence of antigranulocyte antibodies (11,12). Antineutrophil cytoplasmic antibody-positive vasculitis is also commonly found in connection with PTU due to its potential reaction with myeloperoxidase to form reactive intermediates that promote autoimmune inflammation (3,9,13). In addition, since PTU reportedly has a higher frequency of adverse effects, such as hepatotoxicity, MMI is considered to be the first-line drug used by most clinicians with the exception of women who are in early pregnancy (14 –16).
Beside inhibition of TPO, the mechanism of antithyroid drug action remains unclear. The interaction of antithyroid drugs with iodide may divert oxidized iodides away from thyroglobulin (Tg) (17). Iodide is an essential component of thyroid hormone biosynthesis, and is a key regulator of thyroid function (17). Iodide is trapped and concentrated from the bloodstream by active, energy-dependent transport across the thyrocyte basolateral plasma membrane that is mediated by the sodium/iodide symporter (NIS/SLC5A5), a highly glycosylated protein of 87–110 kDa (18). Iodide is transported across the apical membrane of thyrocytes into the follicular colloid, which is in part mediated by pendrin (PDS/SLC26A4) (19 –21). Although the major regulator of iodide uptake is thyroid-stimulating hormone (TSH), other factors, such as iodide itself, retinoic acid, transforming growth factor-β, interleukin-1α, tumor necrosis factor-α (TNF-α), and follicular Tg, also regulate NIS expression (22 –25). In addition, drugs such as adenosine, an autocrine/paracrine factor and a co-neurotransmitter, or histone deacetylase inhibitors (HDACI) are known to increase NIS (gene) expression (26,27), whereas overexpression of the HDAC1 enzyme inhibited basal activity of the NIS promoter (28). In the present study, we investigated the effects of PTU and MMI on thyroid gene expression by focusing on NIS expression. Although PTU and MMI share a similar antithyroid activity, their effect on NIS expression was quite different.
Methods
Cell culture and treatment
Rat thyroid FRTL-5 cells were cultured using the Coon's modified Ham's F-12 medium supplemented with 5% bovine serum (Invitrogen) and a six-hormone mixture consisting of bovine TSH (1 mU/mL), insulin (10 μg/mL), hydrocortisone (0.36 ng/mL), transferrin (5 μg/mL), glycyl-L-histidyl-L-lysine acetate (2 ng/mL), and somatostatin (10 ng/mL). The cells were maintained in 5% CO2 at 37°C and passaged every 7 days (29,30). The cells were initially grown in a fully supplemented medium for 2 days and then transferred to a medium with 0.2% serum without TSH and insulin for 7 days before the experiments. MMI and PTU were dissolved in the culture medium at a final concentration of 5 mM, a concentration that was determined in previous experiments.
DNA microarray analysis
Rat thyroid FRTL-5 cells were initially grown in a medium containing TSH for 2 days and transferred to the same medium with 0.2% serum, but without TSH and insulin for 7 days. The cells were treated with 5 mM MMI, 5 mM PTU, or 1 mU/mL TSH for 24 hours. Total RNA was isolated using the RNeasy Mini Kit (Qiagen) as previously described (29,30). Labeled double-stranded (ds) DNA was prepared by reverse transcription of 10 μg total RNA using SuperScript II (Invitrogen). The cDNA was incubated with 4 μg RNase A (Promega Corp.) at 37°C for 10 minutes, phenol–chloroform extracted, and precipitated with ethanol. Cy3-labeling reactions were performed with the NimbleGen One-Color Labeling Kit (Roche NimbleGen, Inc.). Briefly, 1 μg ds-cDNA was incubated for 10 minutes at 98°C with one OD unit of Cy3-9mer primer. The addition of 8 mmol dNTPs and 100 U Klenow fragment was followed by incubation at 37°C for 2 hours. The reaction was stopped by adding 0.1-volume 0.5 M EDTA, and the labeled cDNA was precipitated with isopropanol. Cy3-labeled samples were resuspended in the NimbleGen Hybridization Buffer (Roche NimbleGen), denatured at 95°C for 5 minutes, and hybridized to arrays in a NimbleGen Hybridization System (Roche NimbleGen) for 18 hours at 42°C. The arrays were washed using the NimbleGen Wash Buffer Kit (Roche NimbleGen), dried by centrifugation, and scanned at a 5-μm resolution using the GenePix 4000B scanner (Molecular Devices).
Reverse transcriptase–polymerase chain reaction and real-time polymerase chain reaction
Total RNA was isolated using the RNeasy Mini Kit (Qiagen) and reverse transcribed to cDNA using High-Capacity cDNA Reverse Transcription Kits (Applied Biosystems) (29,30). The polymerase chain reaction (PCR) primers are listed in Supplementary Table S1 (Supplementary Data are available online at
Quantitative real-time PCR analysis of NIS mRNA was performed using the ABI Prism 7000 Sequence Detection System (Applied Biosystems) as described (29,30). The TaqMan Gene Expression Assay for rat NIS (Slc5a5) and β-actin were purchased from Applied Biosystems. A total of 200 ng cDNA was mixed with TaqMan Universal PCR Master Mix (Applied Biosystems) and the components of the TaqMan Gene Expression Assay in 20 μL/well. The reactions were activated by incubation for 10 minutes at 95°C, followed by 40 cycles consisting of 15 seconds at 95°C and 1 minute at 60°C. NIS mRNA levels were normalized with respect to β-actin using the ΔΔCt method.
Reporter gene assay
Genomic sequences of 5′-1880 bp and 5′-1052 bp of the NIS promoter cloned into the PGL-3Basic plasmid, which carries a luciferase reporter gene (Promega Corp.), were prepared as previously described (25). FuGene6 (Roche Diagnostics) was used to transfect the promoter–reporter gene constructs into rat thyroid FRTL-5 cells (29,30). Briefly, cells were grown in six-well plates, washed with a serum-free culture medium, and incubated with 1 mL of a plasmid/FuGene6 mixture, which was made by incubating 1 μg plasmid DNA with 10 μL Fugene6 and 200 μL serum-free culture medium for 30 minutes at room temperature before dilution with 800 μL serum-free culture medium. Cells were incubated for 4 hours at 37°C, after which 1 mL culture medium containing 10% serum was added. Fresh medium containing 5 mM MMI, 5 mM PTU, or 1 mU/mL TSH was added after 24 hours. Luciferase reporter gene activity was measured 36 hours later as described (29,30).
Western blot analysis and immunofluorescence staining
Cells were lyzed for 1 hour in a buffer containing 50 mM HEPES, 150 mM NaCl, 5 mM EDTA, 0.1% NP40, 20% glycerol, and a protease inhibitor cocktail (Complete Mini, Roche). Cellular proteins were mixed with 4× LDS sample buffer and 10× reducing agent (Invitrogen) and incubated for 10 minutes at 70°C before electrophoresis. Proteins were separated on NuPage 4%–12% Bis-Tris gels and transferred using an iBlot Gel Transfer Device (Invitrogen). The rabbit monoclonal anti-NIS antibody was a generous gift from Dr. N. Carrasco (Albert Einstein College of Medicine). A goat monoclonal antiactin antibody (Santa Cruz Biotechnology) was used for control experiments. Membranes were washed with phosphate-buffered saline with 0.1% Tween 20 (PBST) and blocked with 5% skim milk in PBST for 1 hour, followed by incubation with anti-NIS antibody (dilution 1:1000) for 1 hour at room temperature. Membranes were subsequently washed 3 times for 10 minutes in PBST and incubated with biotinylated donkey anti-rabbit antibody (GE Healthcare; dilution 1:1000) for 1 hour at room temperature. After three washes with PBST, membranes were incubated with streptavidin-horseradish peroxidase (HRP; dilution 1:20,000) for 1 hour at room temperature. After three final washes in PBST, HRP was visualized using an ECL Plus Reagent (GE Healthcare) and exposed to an X-ray film.
FRTL-5 cells were immunofluorescence stained as described (31 –33).
Measurement of I− accumulation
FRTL-5 cells grown in 24-well plates were washed twice with the modified Hanks' balanced salt solution (HBSS) (137 mM NaCl, 5.4 mM KCl, 1.3 mM CaCl2, 0.4 mM MgSO4, 0.5 mM MgCl2, 0.4 mM Na2HPO4, 0.44 mM KH2PO4, and 5.55 mM glucose with 10 mM HEPES buffer, pH 7.3) and incubated for 2 minutes at 37°C in 0.2 mL modified HBSS containing 9.25×10³ Bq carrier-free Na125I and 10 μM NaI, with a final specific activity of 7.4×10⁸ Bq/mmol; a portion of the experiments was performed in the presence of 30 μM NaClO4 (34). The cells were washed twice with ice-cold HBSS when the incubations were terminated. Thirty minutes after, 400 μL 95% ethanol was added to each well, the contents were transferred into vials for counting with a γ-counter. I− uptake was expressed as counts per minute. The DNA content in each well was determined and used for normalization (24,35).
Statistical analysis
All experiments were repeated at least three times with different batches of cells, and the mean±SD of these experiments was calculated. The significance of the differences between experimental values was determined by two-way ANOVA where p<0.05 was significant.
Reagents
All reagents, including PTU and MMI, were purchased from Sigma unless otherwise specified.
Results
Gene expression profile of rat thyroid FRTL-5 cells after stimulation with PTU or MMI
DNA microarray analysis was performed to identify genes possibly affected by antithyroid drugs in rat thyroid FRTL-5 cells after treatment with PTU or MMI for 24 hours. Both PTU and MMI decreased the expression of a significant number of genes in FRTL-5 cells and increased the expression of only a small number of genes during the same period (Fig. 1A, B). When the effects of PTU and MMI on thyroid-specific genes were examined, it was evident that only Nis/Slc5a5 expression was significantly induced by PTU, and not by MMI (Fig. 1C). In fact, Nis/Slc5a5 was the gene most strongly induced by PTU (Fig. 1A). The expression of several thyroid-specific genes and transcription factors, that is, Tg, Tpo, Tshr, Slc26a4, Nkx2-1, Foxe1 and Pax8, was not affected by PTU or MMI. The genes most affected by the treatment are listed in Supplementary Tables S2 and S3. It should be noted that there were several genes whose expression was significantly increased by both PTU and MMI (Supplementary Table S4), although the roles of these genes in thyroid function are unknown.
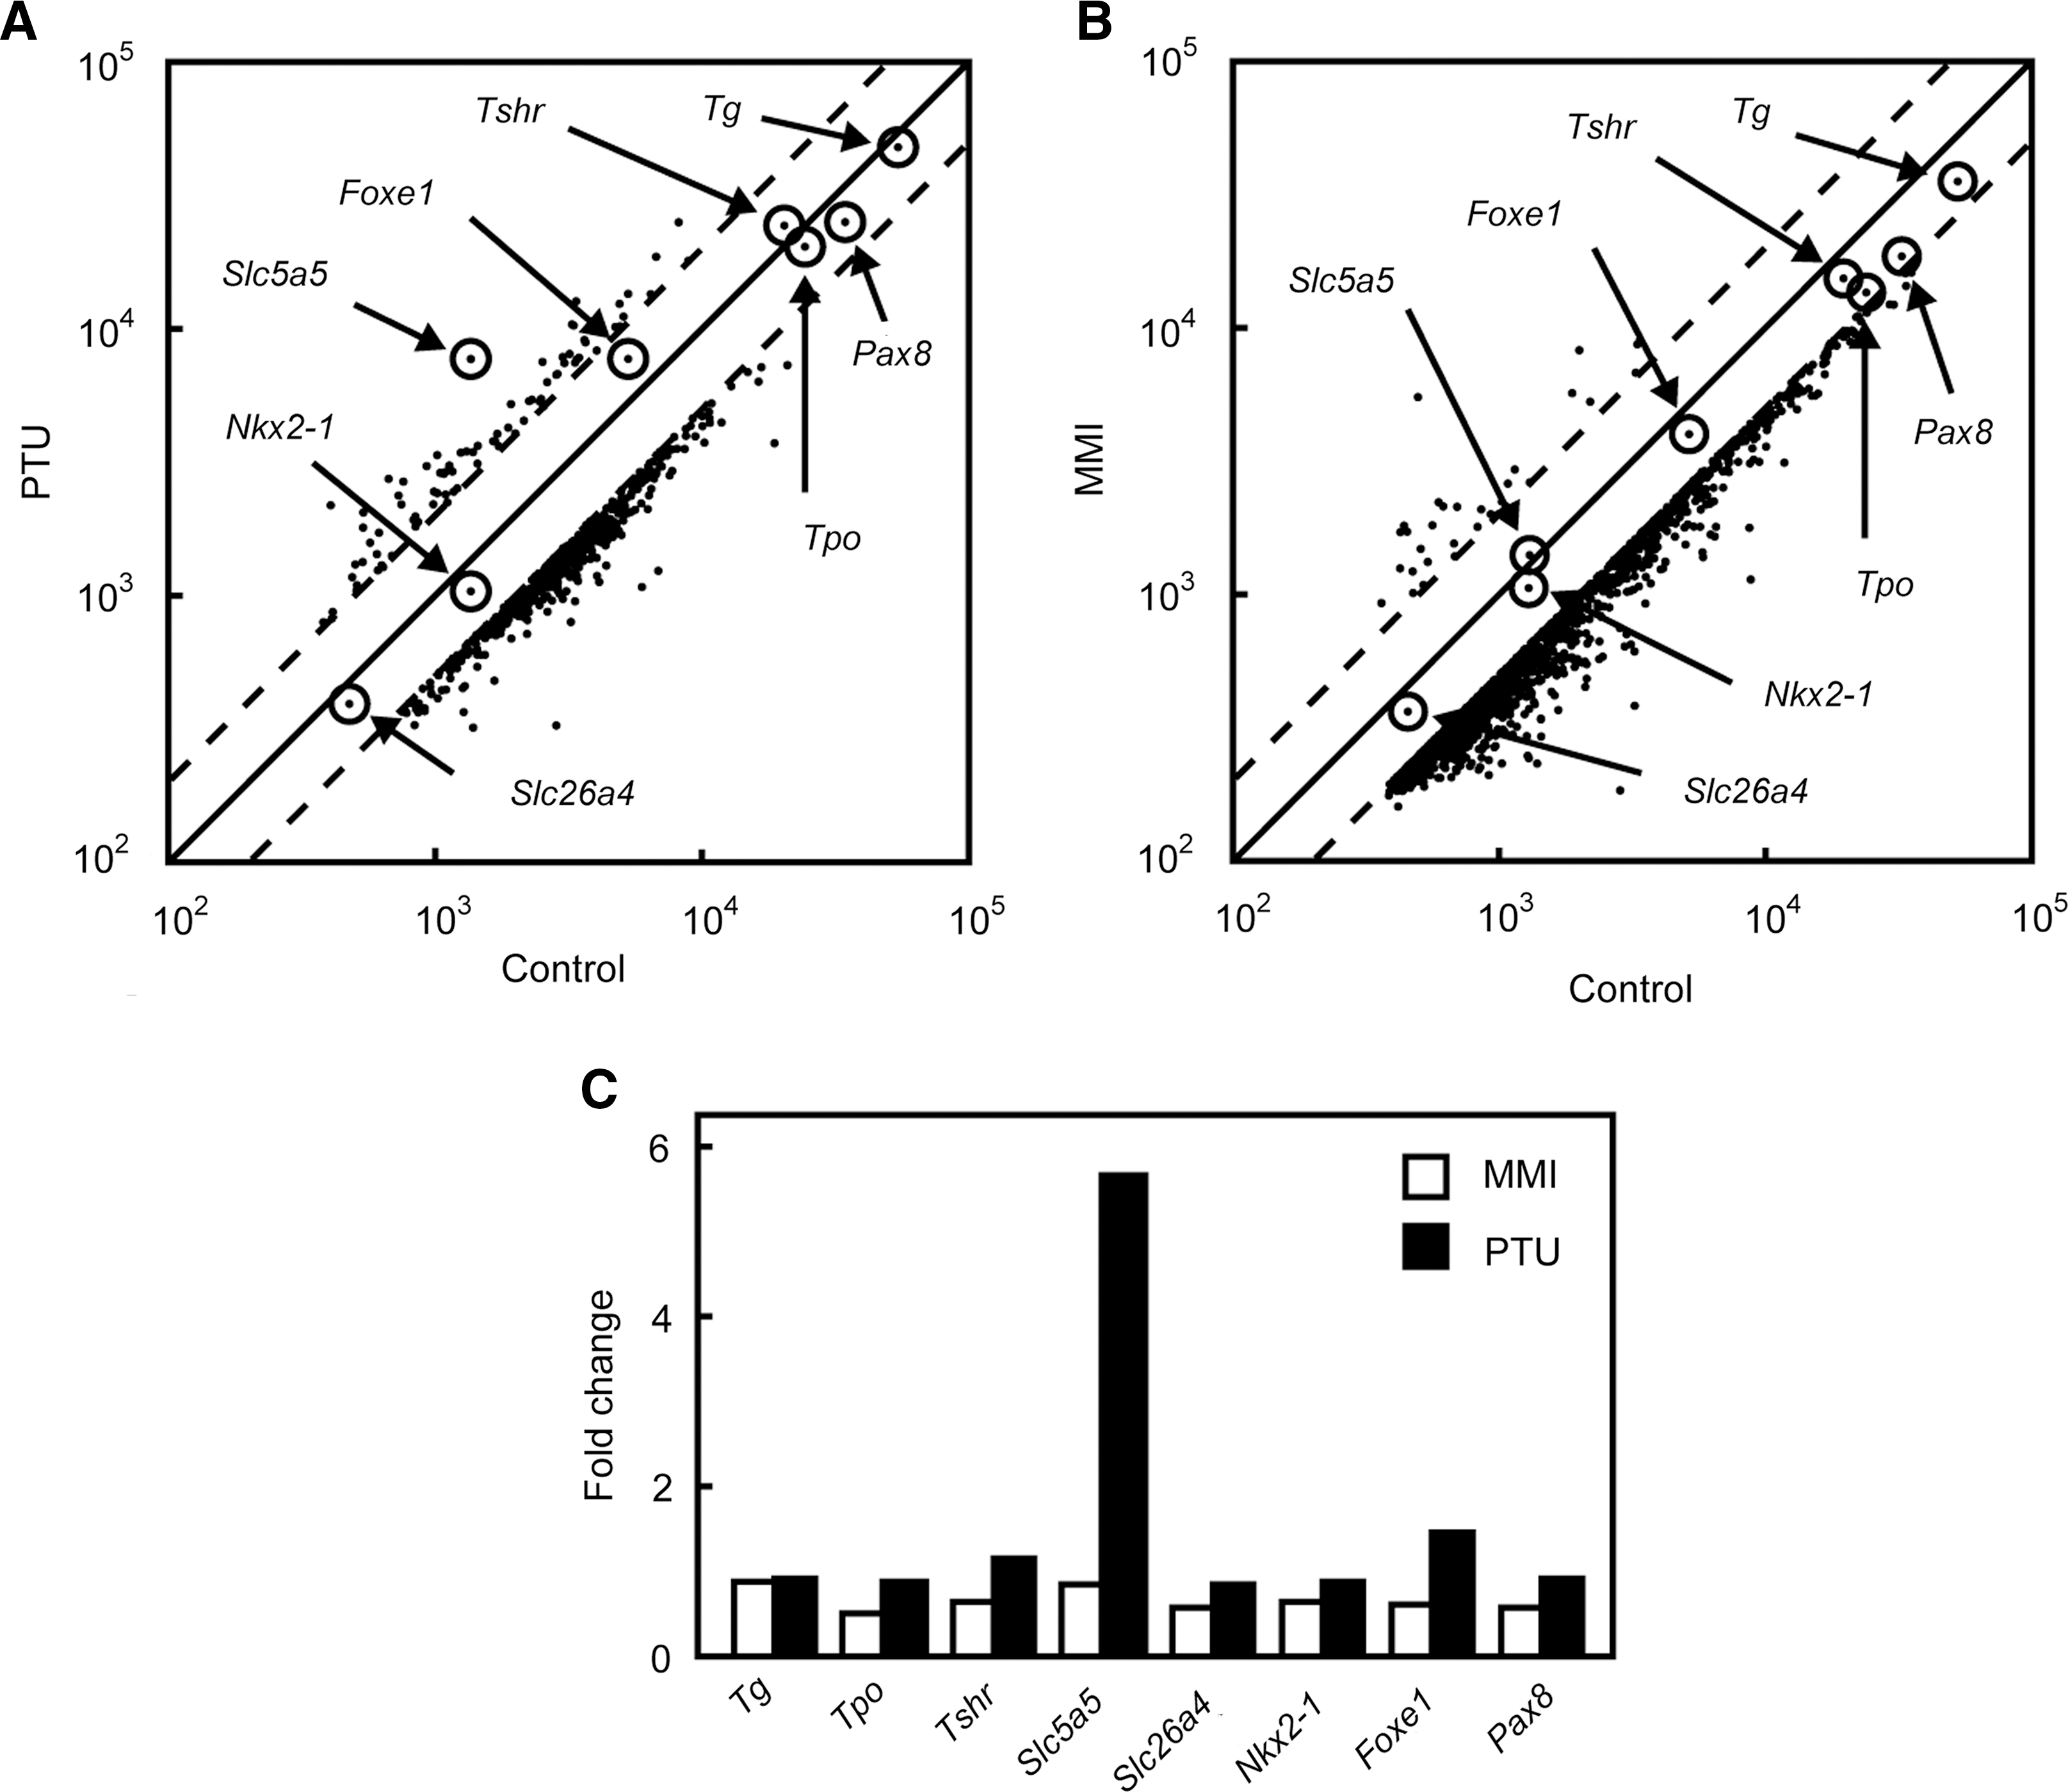
DNA microarray analysis of genes expressed in rat thyroid FRTL-5 cells after stimulation with propylthiouracil (PTU) or methimazole (MMI).
PTU increases NIS mRNA levels and promoter activity
The increase of NIS expression under PTU stimulation was confirmed by a reverse transcriptase (RT)–PCR analysis. As described previously, the NIS mRNA levels were very low in FRTL-5 cells maintained without TSH for 7 days (Fig. 2A, left panel, Slc5a5) (26,32). After 48 hours treatment, PTU significantly increased NIS mRNA expression in the absence of TSH, whereas MMI had no effect (Fig. 2A, left panel). However, in the presence of TSH, induction of NIS expression by PTU was not evident (Fig. 2A, right panel), suggesting that expression was maximally induced by TSH, and that PTU did not further increase mRNA levels. Quantitative real-time PCR analysis revealed that 5 mM PTU increased NIS mRNA expression 18-fold over original levels, which was comparable to the effect of 1 mU/mL TSH (Fig. 2B).
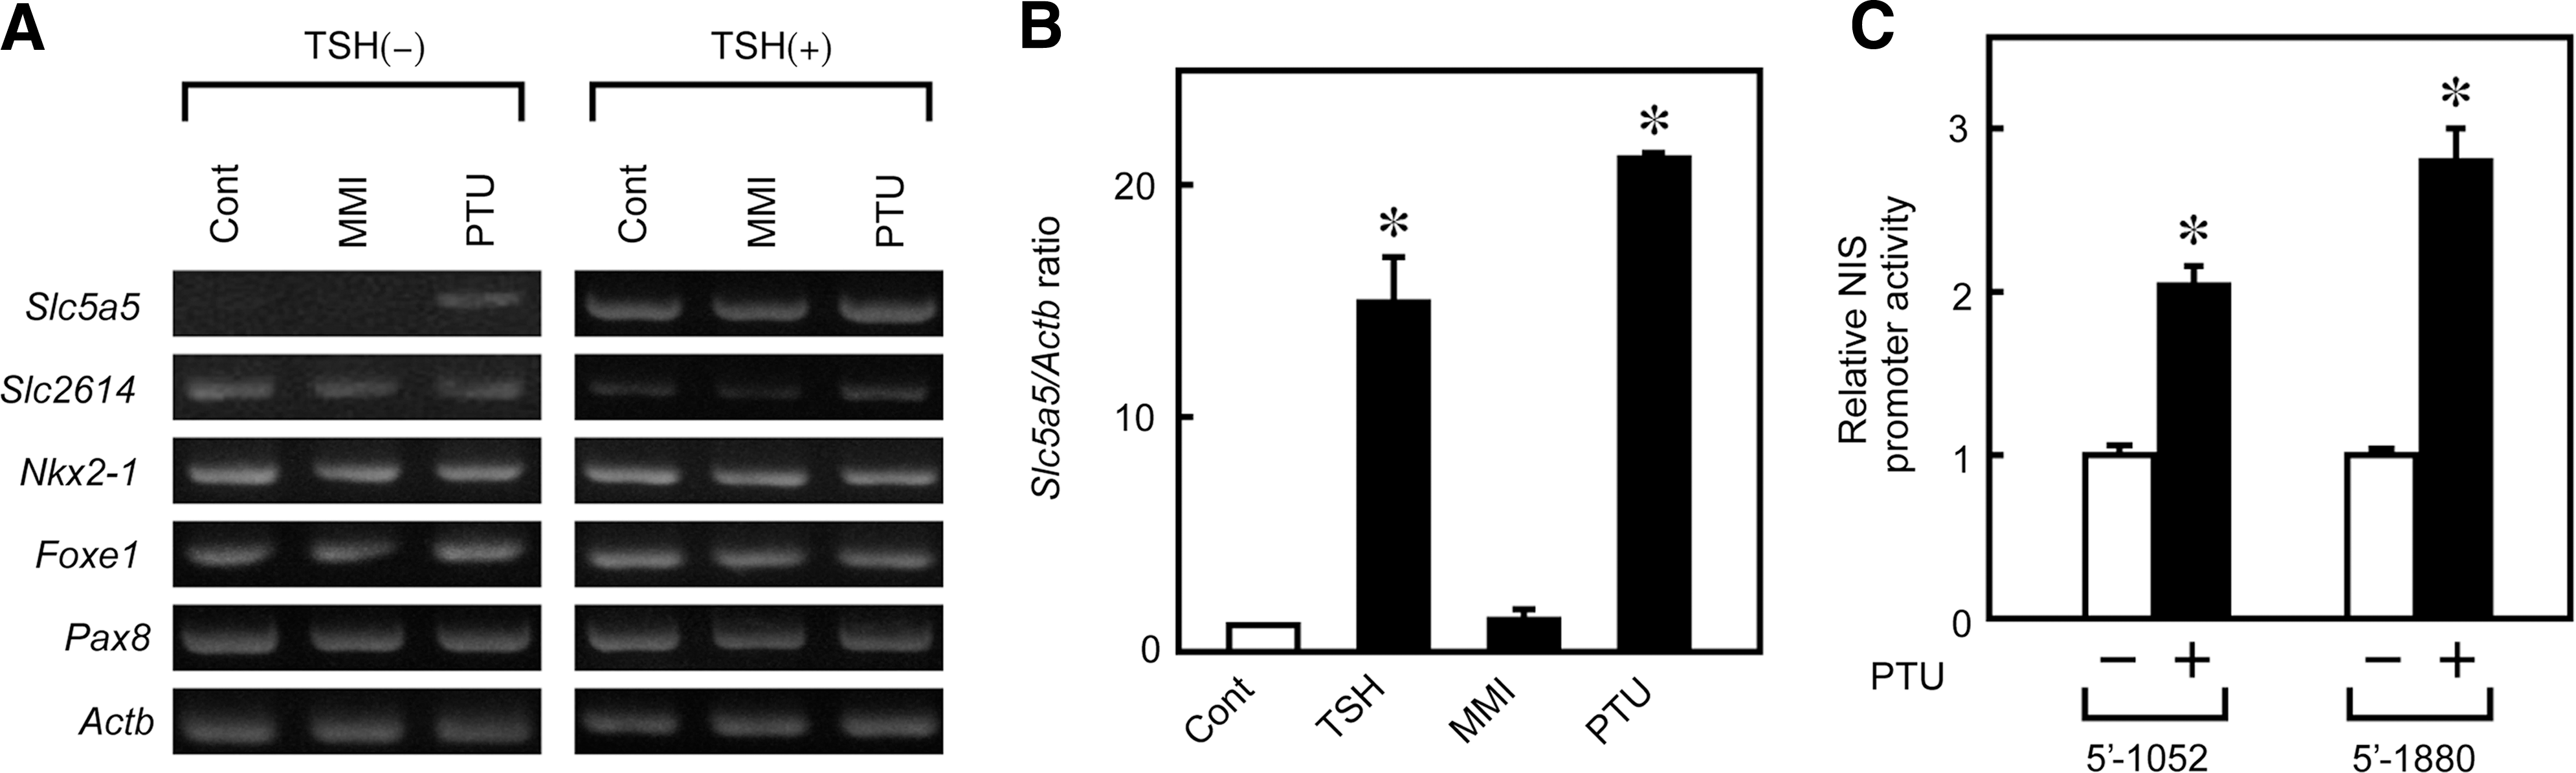
PTU increases sodium/iodide symporter (NIS) mRNA levels and promoter activity.
To determine whether the observed increase in the NIS mRNA level is transcriptional, NIS promoter activity was investigated using a luciferase reporter gene assay. FRTL-5 cells were transiently transfected with an NIS promoter–luciferase chimeric plasmid containing either the 5′-1880-bp or 5′-1052-bp promoter fragment. Luciferase activity was measured 36 hours after PTU stimulation. PTU increased the luciferase activity of both promoter chimeras (Fig. 2C), suggesting that the higher level of NIS mRNA after PTU treatment is due, at least in part, to transcriptional mechanisms.
PTU increases immature forms of NIS protein
Having confirmed that PTU increases NIS mRNA levels, we also investigated the effect of PTU on NIS protein levels. FRTL-5 cells maintained in a medium without TSH for 7 days were stimulated with MMI or PTU for 48 hours, and proteins were extracted for western blot analysis. PTU increased NIS protein to levels that were comparable to the effect of TSH, whereas MMI had no effect (Fig. 3A), which confirms the PTU-induced changes in NIS mRNA levels. Quantitative densitometry analysis of the western blot revealed that PTU increased the amount of NIS protein by 12.3 times over that of the control, which was comparable to that induced by TSH (12.8 times). Although NIS protein was detected as a broad band that reflects the differences in protein glycosylation (25,36 –38), the PTU-induced NIS protein was somewhat smaller than the protein induced by TSH (Fig. 3A), which suggests that most PTU-induced proteins were present in primarily immature forms. The amount of NIS protein gradually decreased after PTU withdrawal, but was still maintained at higher levels than control values, even after 72 hours (Fig. 3B).
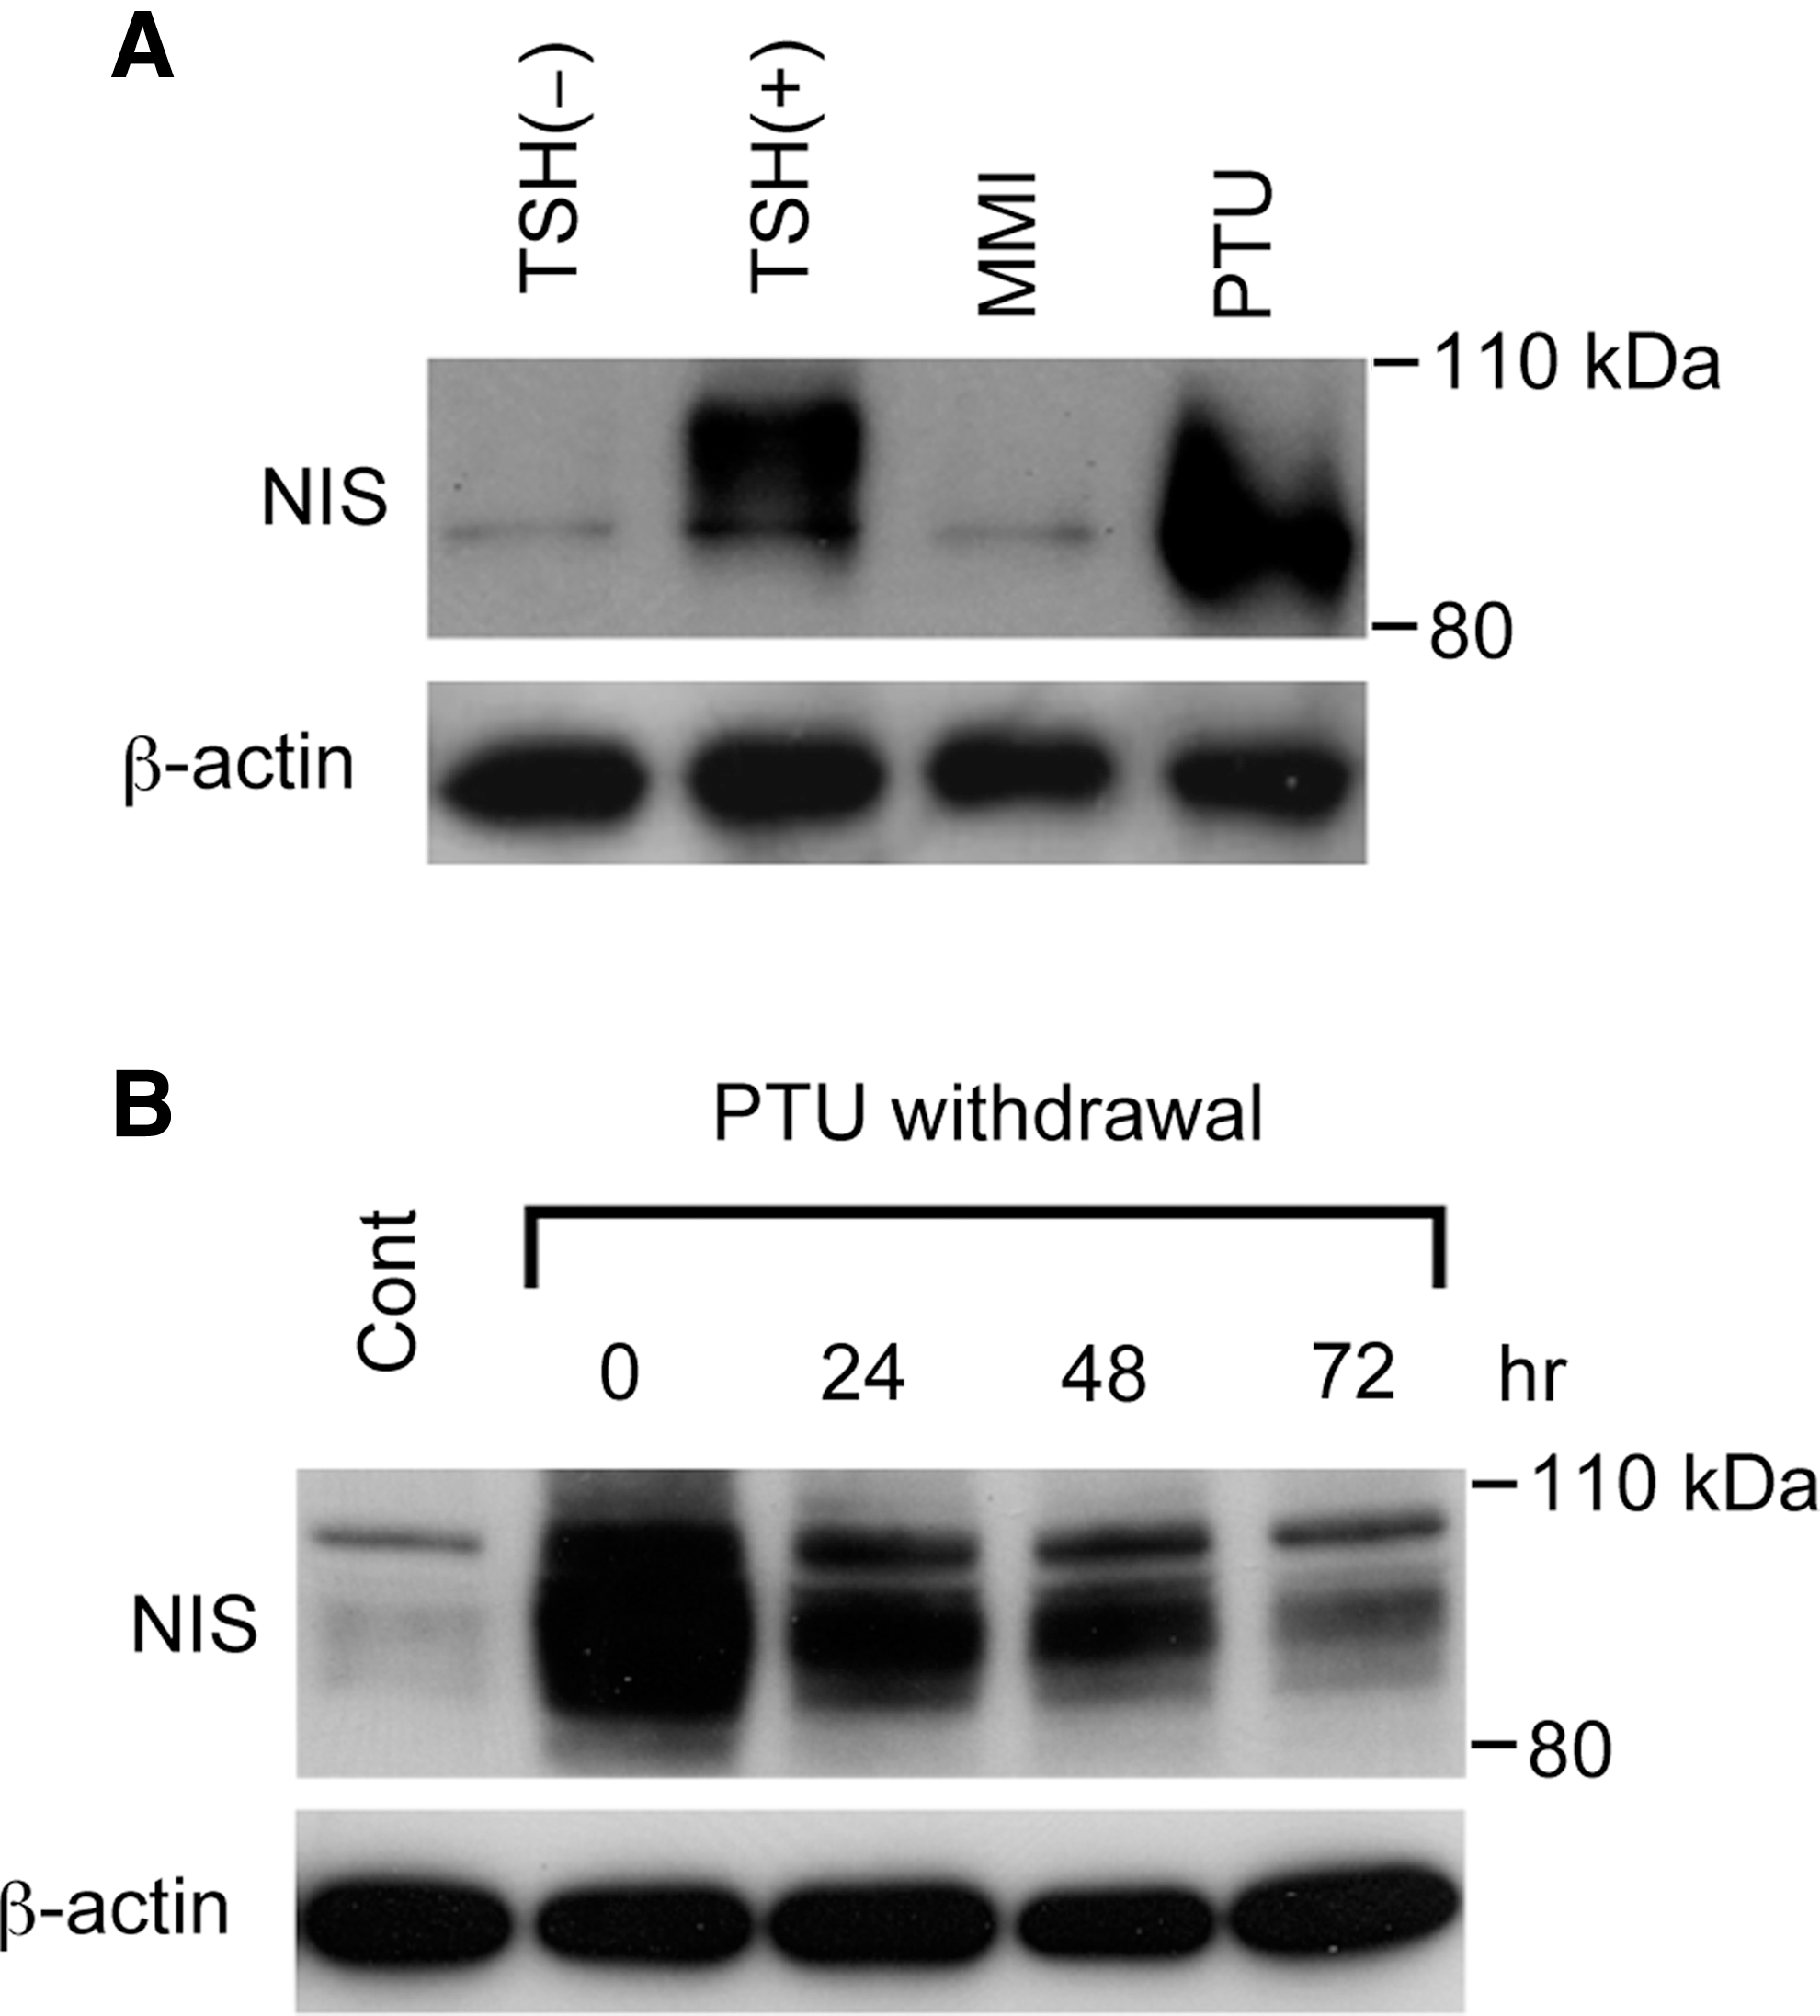
PTU increases NIS protein levels.
Immunofluorescence staining was then performed to assess NIS protein localization in FRTL-5 cells. Consistent with the increase in mRNA and protein levels, NIS staining was significantly increased by PTU (Fig. 4B) and TSH (Fig. 4D), but not MMI (Fig. 4C). Interestingly, however, PTU-induced NIS protein showed a punctate staining pattern in the cytoplasm (Fig. 4B) rather than the linear staining along the plasma membrane seen for TSH treatment (Fig. 4D). The smaller size of PTU-induced NIS protein and its cytoplasmic localization suggest that PTU-produced protein is immature compared to the TSH-induced protein, and is not properly transported to the plasma membrane (36).
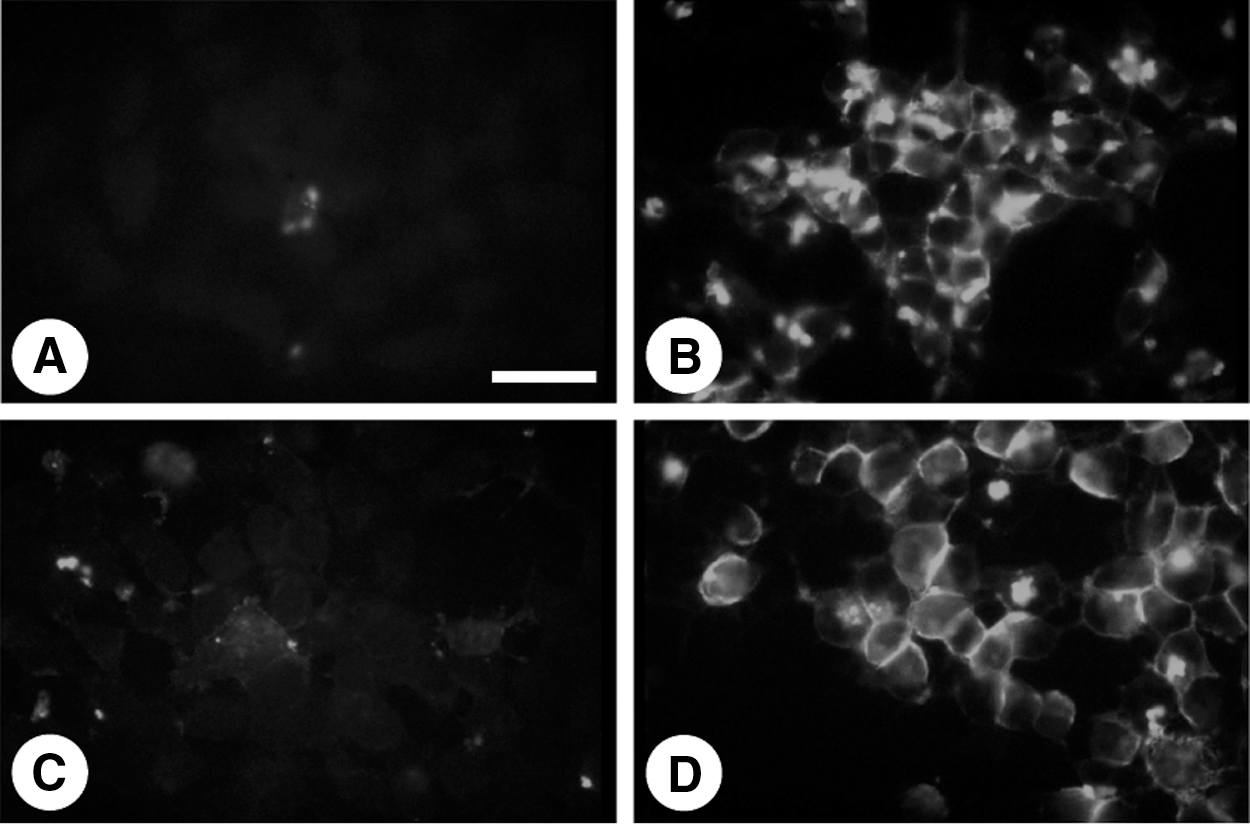
Immunofluorescence analysis of NIS expression in FRTL-5 cells. FRTL-5 cells were maintained in a medium without TSH for 7 days. The medium was then replaced with the same medium
PTU-increased 125I uptake is weaker than TSH
The physiological function of PTU-induced NIS protein was confirmed by evaluating the effect of PTU on I− accumulation in FRTL-5 cells. The cells were maintained in a medium without TSH for 7 days and treated with 5 mM PTU or 1 mU/mL TSH for 0, 6, 24, 48, and 72 hours. After PTU stimulation, cellular I− accumulation increased in 24 to 72 hours (Fig. 5A), although the level of increase was less than that produced by TSH, which may reflect the difference in the subcellular localization of the NIS protein. The I− accumulation of control cells maintained without TSH or PTU did not vary with time from 0 to 72 hours (data not shown). To confirm that the measured iodide uptake is NIS mediated, we also determined I− accumulation in FRTL-5 cells in the presence of perchlorate, a competitive NIS inhibitor. The ability of PTU to increase I− accumulation was significantly decreased by perchlorate at 48 hours, indicating that the observed PTU-dependent I− increases were indeed mediated by the NIS protein (Fig. 5B).
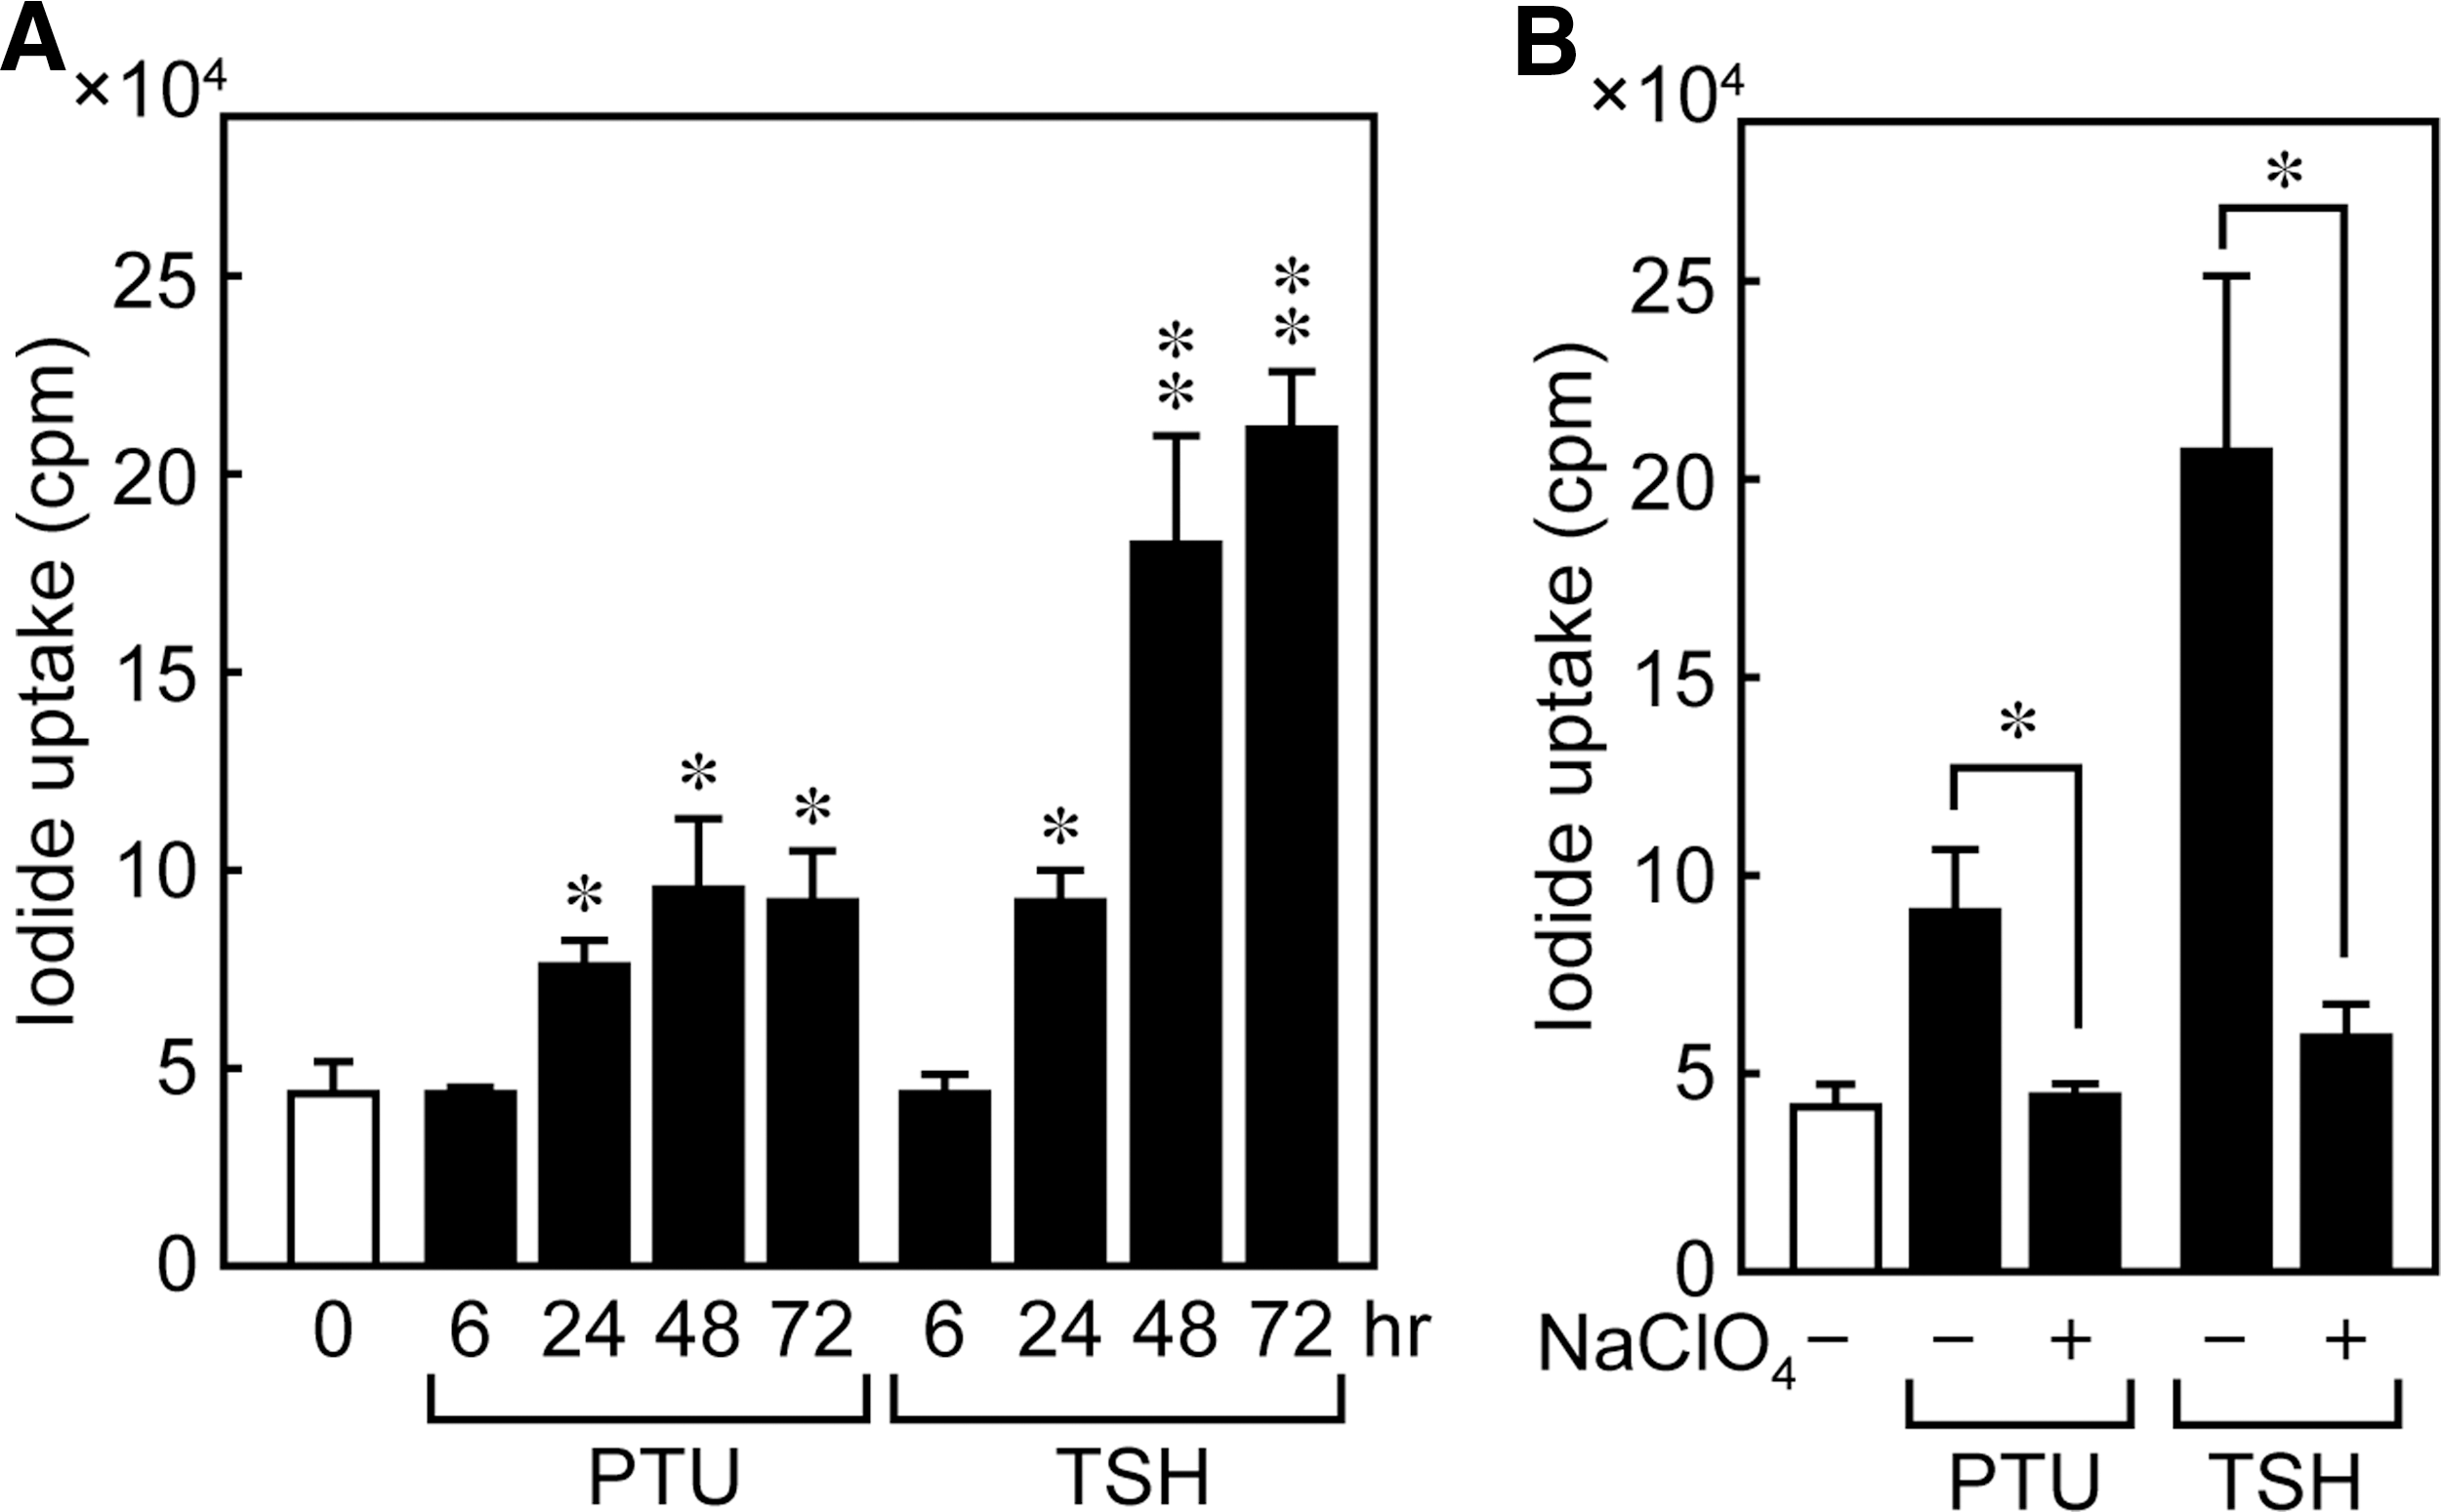
PTU increases uptake of 125I in FRTL-5 cells. FRTL-5 cells were maintained in a medium without TSH for 7 days and treated with 5 mM PTU or 1 mU/mL TSH with perchlorate
Discussion
The present report shows that PTU, an antithyroid drug, induces NIS expression and iodide uptake in rat thyroid FRTL-5 cells in the absence of TSH. Although both PTU and MMI are widely used drugs to treat Graves' disease and have antithyroid effects that are primarily mediated via inhibition of TPO-catalyzed iodination, their molecular structure as well as other functions are quite different (4 –6,8,9).
To determine differences in the effects of PTU and MMI on gene expression, we performed a DNA microarray analysis of rat thyroid FRTL-5 cells and found that NIS was the gene whose levels were most increased by PTU. Although both NIS and PDS are responsible for iodide transport across the basolateral and apical membranes, respectively, and are regulated coordinately by Tg, TSH, and iodide (20,25,39,40), the effect of PTU was specific to NIS, not PDS. Consistent with the increase in NIS mRNA, PTU coordinately increased NIS promoter activity, NIS protein levels, and radioiodine uptake in FRTL-5 cells.
Although NIS protein levels were similarly induced by PTU and TSH, the size of the resulting proteins and their subcellular distribution patterns were different. The fully glycosylated NIS protein migrates with a molecular weight of 87–110 kDa. As such, the observed differences in molecular weight between PTU- and TSH-induced NIS proteins may reflect post-translational modifications such as glycosylation and phosphorylation (36,41,42). These differences suggest that the PTU-induced NIS protein is relatively immature compared to the TSH-induced protein, which could also be consistent with the lower I− accumulation of the PTU-induced NIS protein, as shown in the present report. Harii et al. also described a discrepancy between adenosine-induced iodide uptake activity and NIS protein levels (27). Furthermore, in thyroid tumors, weak intracellular radioiodine labeling has been shown to correspond to immature NIS protein that results from transcriptional and post-transcriptional alterations (43). Other reports suggested that the NIS protein is highly regulated by post-transcriptional events that control, in particular, its subcellular localization (36,44,45). Partially glycosylated forms of NIS correspond most likely to immature proteins that are not properly processed and localized to the plasma membrane (46).
TSH not only regulates NIS transcription and translation but also modulates NIS activity by a post-transcriptional mechanism. NIS is a phosphoprotein whose targeting to or retention in the plasma membrane requires modulation by TSH (36). Thus, NIS is activated and inserted in the basolateral membranes of thyrocytes in the presence of TSH. Immunofluorescence staining in this study revealed that the PTU-induced NIS protein is localized predominantly in intracellular compartments, instead of being properly targeted to the plasma membrane. This localization suggests that the action of PTU on NIS expression differs from that of TSH, although the nature of the short form of the NIS protein induced by PTU awaits determination in a future study.
While the molecular mechanism by which PTU activates the NIS promoter remains unclear, an RT-PCR analysis of essential transcription factors for thyroid function such as Nkx2-1, Foxe1, and Pax8 showed no changes after PTU stimulation. This evidence suggests that the PTU-induced increase of NIS mRNA involves other transcription factors and/or other unknown mechanisms, such as epigenetic factors. PTU induced both 5′-1052 and 5′-1880 NIS promoter activity, which actually was ∼20%–30% lower than TSH-induced NIS promoter activity. Because there was no significant difference between PTU- and TSH-induced NIS mRNA levels, there is a possibility that the PTU-responsive cis-element within the NIS promoter might lie upstream of the 5′-1052-bp promoter region.
HDACI was reported to induce NIS gene expression without affecting thyroid-specific transcription factors such as Nkx2-1, Foxe1, and Pax8 (28). As such, PTU may induce NIS expression after changes in the redox state of thyroid-specific transcription factors (47,48). NIS expression is also induced by adenosine (27) or resveratrol, a polyphenol found in grapes, which both increased iodide accumulation in FRTL-5 cells (49). The underlying molecular mechanisms by which these substances, including PTU, induce NIS expression, for example, activation by an unidentified signaling pathway via an unknown promoter cis-element or epigenetic alterations, remain to be determined.
The effective dose of PTU in FRTL-5 cells was 5 mM, which is much higher than the peak effective blood level of 7.7 μg/mL (0.045 mM) achieved when a daily dose of 200–600 mg was administered to patients (50). Whether the requirement for such high doses in FRTL-5 cells is due to a low sensitivity to PTU, or species differences are not clear. However, the use of cultured cells in vitro allows observation of short-term effects, and not long-term effects seen with the lower doses used for patient treatment.
In this study, NIS protein expression induced by PTU was maintained at least 72 hours after withdrawal. Before radioactive iodine therapy in the clinic, PTU or MMI treatment is suspended for at least several days. Although the clinical effect of these drugs on the efficacy of radioactive iodine therapy in Graves' disease is not clear, analysis of changes in gene expression may provide clues to understand the differential effects of these drugs. The NIS expression level is already high in Graves' patients (51); therefore, we assume that PTU treatment will not further increase NIS expression and as such not worsen Graves' disease. Pretreatment with MMI has no effect on either the time required for cure or the one-year success rate of radioactive iodine therapy (2), whereas PTU pretreatment reduces the effectiveness of radioactive iodine therapy in Graves' disease patients (14,52). This study may shed some light on the differential use of antithyroid drugs.
Footnotes
Acknowledgments
This work was supported in part by a Grant-in-Aid for Scientific Research from the Japan Society for the Promotion of Science (#15390296 and #23801300 to K.S.). The authors wish to thank Dr. I. E. Royaux and A. Mori for their technical assistance and discussions.
The authors would like to add a message of condolence in regard to our coauthor, Dr. Leonard D. Kohn, who passed away during the reviewing process of this article. We would like to dedicate this article to Dr. Kohn, who has contributed to research in this field and for the American Thyroid Association for many years.
Disclosure Statement
The authors declare that no conflicts of interest exist.