
Abstract
Background:
Micro–single-photon emission computed tomography (SPECT) provides a noninvasive way to evaluate the effects of genetic and/or pharmacological modulation on sodium-iodide symporter (NIS)–mediated radionuclide accumulation in mouse thyroid and salivary glands. However, parameters affecting image acquisition and analysis of mouse thyroids and salivary glands have not been thoroughly investigated. In this study, we investigated the effects of region-of-interest (ROI) selection, collimation, scan time, and imaging orbit on image acquisition and quantification of thyroidal and salivary radionuclide accumulation in mice.
Methods:
The effects of data window minima and maxima on thyroidal and salivary ROI selection using a visual boundary method were examined in SPECT images acquired from mice injected with 123I NaI. The effects of collimation, scan time, and imaging orbit on counting linearity and signal intensity were investigated using phantoms filled with various activities of 123I NaI or Tc-99m pertechnetate. Spatial resolution of target organs in whole-animal images was compared between circular orbit with parallel-hole collimation and spiral orbit with five-pinhole collimation. Lastly, the inter-experimental variability of the same mouse scanned multiple times was compared with the intra-experimental variability among different mice scanned at the same time.
Results:
Thyroid ROI was separated from salivary glands by empirically increasing the data window maxima. Counting linearity within the range of 0.5–14.2 μCi was validated by phantom imaging using single- or multiple-pinhole collimators with circular or spiral imaging orbit. Scanning time could be shortened to 15 minutes per mouse without compromising counting linearity despite proportionally decreased signal intensity. Whole-animal imaging using a spiral orbit with five-pinhole collimators achieved a high spatial resolution and counting linearity. Finally, the extent of inter-experimental variability of NIS-mediated radionuclide accumulation in the thyroid and salivary glands by SPECT imaging in the same mouse was less than the magnitude of variability among the littermates.
Conclusions:
The impacts of multiple variables and experimental designs on micro-SPECT imaging and quantification of radionuclide accumulation in mouse thyroid and salivary glands can be minimized. This platform will serve as an invaluable tool to screen for pharmacologic reagents that differentially modulate thyroidal and salivary radioiodine accumulation in preclinical mouse models.
Introduction
In thyroid cancer, thyroidal NIS and iodide organification serve as the basis for targeted radioactive iodide (RAI) therapeutic ablation of post-thyroidectomy remnants. Well-differentiated thyroid cancers, including papillary thyroid carcinoma (PTC) and follicular thyroid carcinoma (FTC), are the most common endocrine malignancies, yet they generally have 89.5% (PTC) and 80% (FTC) 10-year survival rates (4) due, at least in part, to sustained NIS function and iodine avidity. In poorly differentiated or anaplastic thyroid cancers, tumors are iodine refractory due to loss of NIS function; therefore, patients cannot benefit from RAI therapy. It is of clinical significance to identify molecular mechanisms underlying NIS modulation, such that NIS expression/function may be restored in these patients. Moreover, it is also desirable to inhibit NIS-mediated RAI accumulation in the salivary glands to reduce unwanted side effects of salivary dysfunction during RAI therapy. Many reports have demonstrated signaling pathways modulating endogenous NIS expression in thyrocyte cultures; however, cell culture studies do not necessarily recapitulate the physiological and pathological microenvironment of living animals. Therefore, investigating signaling pathways differentially modulating thyroidal and salivary glands NIS function in living animals would be more relevant.
Nuclear imaging allows for NIS-mediated RAI accumulation in the thyroid and salivary glands to be quantified in living patients and animal models (5,6). In small animals, micro-single-photon emission computed tomography (SPECT) provides a noninvasive way to evaluate and quantify the effects of genetic and/or pharmacological modulation on thyroidal and salivary glands NIS-mediated RAI accumulation. Indeed, using quantitative SPECT, we previously reported that the pharmacological reagent 17-AAG prolonged thyroidal RAI retention in both wild-type and Tg-PTC1 mice (5).
Much effort has been made to optimize SPECT parameters that affect image acquisition as well as quantitative analysis of the target tissues in small animals (7 –11). However, different target tissues represent different optimization challenges. For example, physical proximity between the thyroid and salivary glands makes it difficult to accurately segment and quantitate these two organs. In this study, we investigated the effects of region-of-interest (ROI) selection, collimation, scan time, and imaging orbit on image acquisition and quantification of thyroidal and salivary radionuclide accumulation in mice. We also compared the inter-experimental variability of the same mouse scanned multiple times with the intra-experimental variability among different mice scanned at the same time.
Methods
Animals
The study protocol (2009A0118) was approved by our Institutional Animal Care and Use Committee, which oversees the responsible use of animals in university research and instructional activities. All research activities conformed to the statutes of the Animal Welfare Act and the guidelines of the Public Health Service as issued in the Guide for the Care and Use of Laboratory Animals (12). Mice received Harlan Teklad LM-485 Mouse/Rat sterilizable diet (Harlan Teklad Diets) containing 2.61 mg iodine/kg. All mice used in this study were of FVB/N background.
Micro-SPECT imaging
Micro-SPECT imaging was performed using the X-SPECT preclinical platform (Gamma Medica Ideas). The X-SPECT is equipped with two NaI scintillation gamma cameras with 80×80 pixels, each mounted opposite to each other on a rotating gantry. Uniformity correction and geometric calibration were established for the cameras prior to scanning. The cameras were equipped with single-pinhole (75 mm focal distance) or five-pinhole (90 mm focal distance) collimators with 1-mm aperture, or parallel-hole collimators. Phantoms were comprised of polymerase chain reaction tubes filled with equal volumes of various known radioactivity of 123I NaI or Tc-99m pertechnetate that were positioned 6–11 mm apart on a plastic rack. These phantoms were used to assess linearity of counts detected as a function of radioactivity using different collimators, image acquisition time, and scanning orbit. All radioactivity values were measured by a dose calibrator (CRC-12; Capintec) and were normalized for physical decay.
Mice were intraperitoneally injected with ∼100 to 150 μCi of 123I NaI (600 μL) or Tc-99m pertechnetate (100 μL). 123I NaI (Cardinal Health) was prepared by dissolving capsules in saline. Tc-99m pertechnetate in saline was an eluant from Covidien or Lantheus generators. The Ohio State University Medical Center Nuclear Pharmacy prepared all radioisotopes. One hour after 123I NaI or Tc-99m pertechnetate injections, mice were anesthetized using 1.5%–2% isoflurane (Terrell Isoflurane, USP; Minrad, Inc.) mixed with O2 at a flow rate of 1.5 L/min, and were subsequently immobilized on the animal bed. A 0.25-mL microcentrifuge tube containing ∼10 μCi same radionuclide was included as a decay control. SPECT imaging was acquired using 32 projections/camera and 50-second projection duration (unless otherwise stated), with a 25- or 35-mm radius of rotation (ROR), for single-pinhole or five-pinhole collimators, respectively. SPECT images were acquired at 1, 6, and 24 hours after 123I NaI injection or 1 hour after Tc-99m pertechnetate injection.
SPECT image reconstruction and quantification
SPECT images were reconstructed using iterative ordered-subset expectation maximization algorithms with 8 subsets and 10 iterations (FLEX-SPECT; Gamma Medica Ideas). The reconstructed files were analyzed using Amira 4.1.1 imaging software (Mercury Computer Systems). Images acquired using circular orbit or spiral orbit were binned to 256×256×256 voxels or 256×256×1024 voxels, respectively. For quantitative analysis, the data window minima and maxima were visually defined to achieve distinction between the thyroid and salivary glands from background. The ROIs were selected in all orthogonal slices in the transaxial view, and later refined and confirmed in sagittal and coronal views. Tissue statistics (cumulative summation of counts, mean counts, and voxel numbers) as well as histogram statistics were automatically calculated by Amira 4.1.1 imaging software. The percentage of injected dose (%ID) accumulated in target tissues was calculated using the following formula:
Statistical analysis
Linear regression models were used to investigate whether counts detected were linearly correlated with radioactivity under various imaging acquisition parameters. All analyses were performed using SAS/STAT software, version 9.2 (SAS Institute Inc.), under Windows XP system.
Results
The impact of data window minima and maxima on ROI selection and image quantification of the thyroid and salivary glands
The data window is used to define the range of signal intensities to be included for image analysis. Voxels with signal intensity less than the data window minima are considered background and are displayed as black in reconstructed images, while voxels with signal intensities between the data window minima and maxima are displayed with a brightness interval along a black–white gradient. As demonstrated in three planes of a reconstructed image acquired from a mouse injected with 123I NaI (Fig. 1A), the perimeter of the thyroid gland can be easily defined by its high signal intensity, and was relatively less affected by increasing the data window minima from 8 to 40, or to 80. In comparison, the perimeter of the salivary glands was affected much more by increasing the data window minima due to its relatively low and heterogeneous signal. The heterogeneous signal is due to restricted expression of NIS in striated ducts that are discretely distributed in salivary gland (unpublished observation). In addition, the signal of parotid gland is weaker than signals of submandibular/sublingual glands as mouse parotid gland is diffused and with multiple lobes separated by connective tissues and fat. Accordingly, increasing the data window minima had less effect on cumulative summation of counts (i.e., total counts) in the thyroid gland (decreasing to 93% and 87%, respectively) than in salivary glands (decreasing to 70% and 39%, respectively). Thyroidal voxel counts were decreased to 83% and 59%, and the mean voxel intensity was increased to 121% and 149%, respectively. Salivary voxel counts were decreased to 46% and 18% and mean voxel intensity was increased to 153% and 204%, respectively. However, it is important to note that only total counts directly contributed to %ID. Since increasing data window minima appeared to have disproportional effects on total counts between the thyroid and salivary glands, we defined the data window minima as equivalent to the mean background signal intensity in the thoracic region where no RAI accumulation was detected. In our experimental settings, the mean signal intensity for background was 8.1±1.3 counts/voxel. In comparison, the mean signal intensities of the thyroid were 73.3±18.4 and 103.7±31.8 counts/voxel, whereas the mean signal intensities of salivary glands were 88.1±24.7 and 45.0±8.3 counts/voxel, in male and female mice, respectively (data not shown).
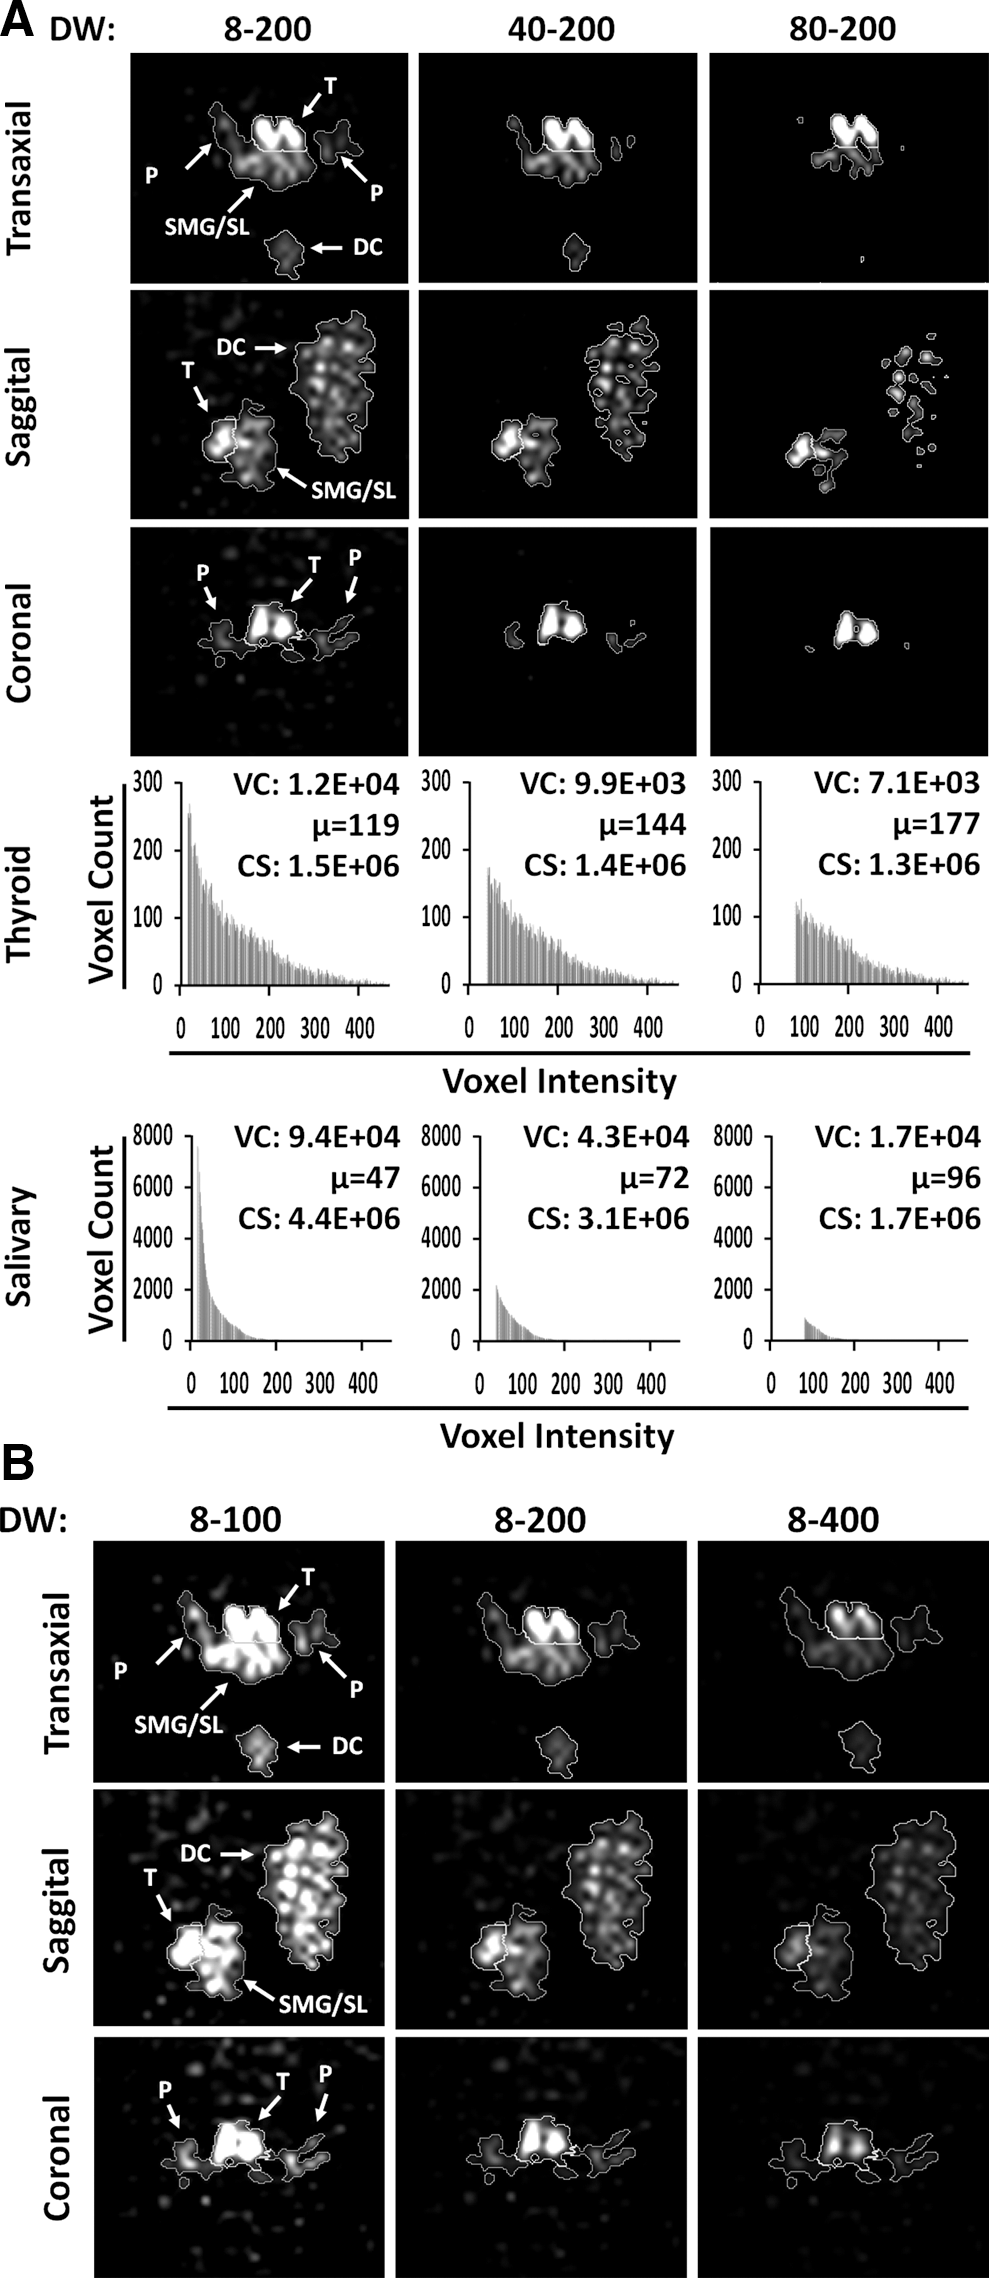
The effects of data window minima and maxima on selection of ROI in quantification of thyroidal and salivary 123I accumulation.
Murine thyroid and salivary glands are in close spatial proximity (1–3 mm apart), and both tissues accumulate NIS substrates. Accordingly, it is difficult to resolve the thyroid from salivary glands in SPECT images due to their overlapping emission signals. Since the mean signal intensity is greater in the thyroid than in salivary glands (Fig. 1A), by empirically increasing the data window maxima, the apparent signal intensity of salivary glands was reduced at greater extent than that of the thyroid (Fig. 1B). For example, when the data window was selected as 8–100, it was difficult to resolve the thyroid from salivary glands in transaxial and sagittal views. Increasing the data window maxima to 200 permitted better visual differentiation between the thyroid and salivary glands. The boundary between the thyroid and salivary glands was equivalently evident with a further increase in the data window maxima to 400. Taken together, the contrast between salivary glands and the thyroid was enhanced when the data window maxima was increased, thus facilitating visual segmentation of the thyroid from salivary glands. Of note, for image quantification, the maximum threshold was set to the maximum voxel value for each ROI.
The effects of collimation on counting linearity and sensitivity
It is important to ensure that the counts detected by SPECT are linear within the range of radioactivity values to be quantified in a given experimental setting. For wild-type mice injected with 96 to 157 μCi of 123I NaI to observe the temporal dynamics of the thyroid and salivary glands radionuclide accumulation (5), the median thyroidal radioactivity values were 2.3 μCi (t1), 4.0 μCi (t6), and 2.5 μCi (t24), and the ranges were 0.8–5.6 μCi (t1), 1.8–10.9 μCi (t6), and 0.5–5.9 μCi (t24). In salivary glands, the median radioactivity values were 5.2 μCi (t1) and 2.0 μCi (t6), and the ranges were 2.2–14.2 μCi (t1) and 1.0–8.8 μCi (t6). Salivary gland's radioactivity is undetectable at t24 when circulating blood RAI has been almost completely cleared from urinary excretion (5). Taken together, the range of 123I NaI radioactivity to be measured in the thyroid and salivary glands in our experimental settings is 0.5–14.2 μCi.
For mouse imaging, the ROR of gamma cameras equipped with five-pinhole collimators was set at 35 mm, as such the camera field of view (FOV) was about 80 mm×80 mm; for cameras equipped with single-pinhole collimators, the ROR was set at 25 mm, providing an FOV of 59 mm×59 mm. Thus, we designed a phantom of 25 mm×25 mm capable of holding four samples of various radioactivity values to investigate whether the counts detected were linearly correlated with radioactivity under various imaging acquisition parameters. The significance of linearity indicated by a p-value typically reflects the accuracy of image quantification. The slopes of fitted regression lines, shown as counts/μCi, indicate signal intensity, which generally correlates to image quality. As shown in Figure 2, linear regression analysis for two independent trials demonstrated that detected counts were linearly correlated with radioactivity for both Tc-99m pertechnetate and 123I NaI, using either single- or five-pinhole collimators (p<0.0001). The slope value for Tc-99m pertechnetate (7.3×10⁵ counts/μCi) was comparable to 123I NaI (7.1×10⁵ counts/μCi) when five-pinhole collimators were used. In comparison, the slope values were decreased about fivefold when single-pinhole collimators were used for both Tc-99m pertechnetate (1.3×10⁵ counts/μCi) and 123I NaI (1.2×10⁵ counts/μCi). Taken together, we validated the linearity of the radioactivity to be quantified in our experimental setting using either single- or five-pinhole collimators.
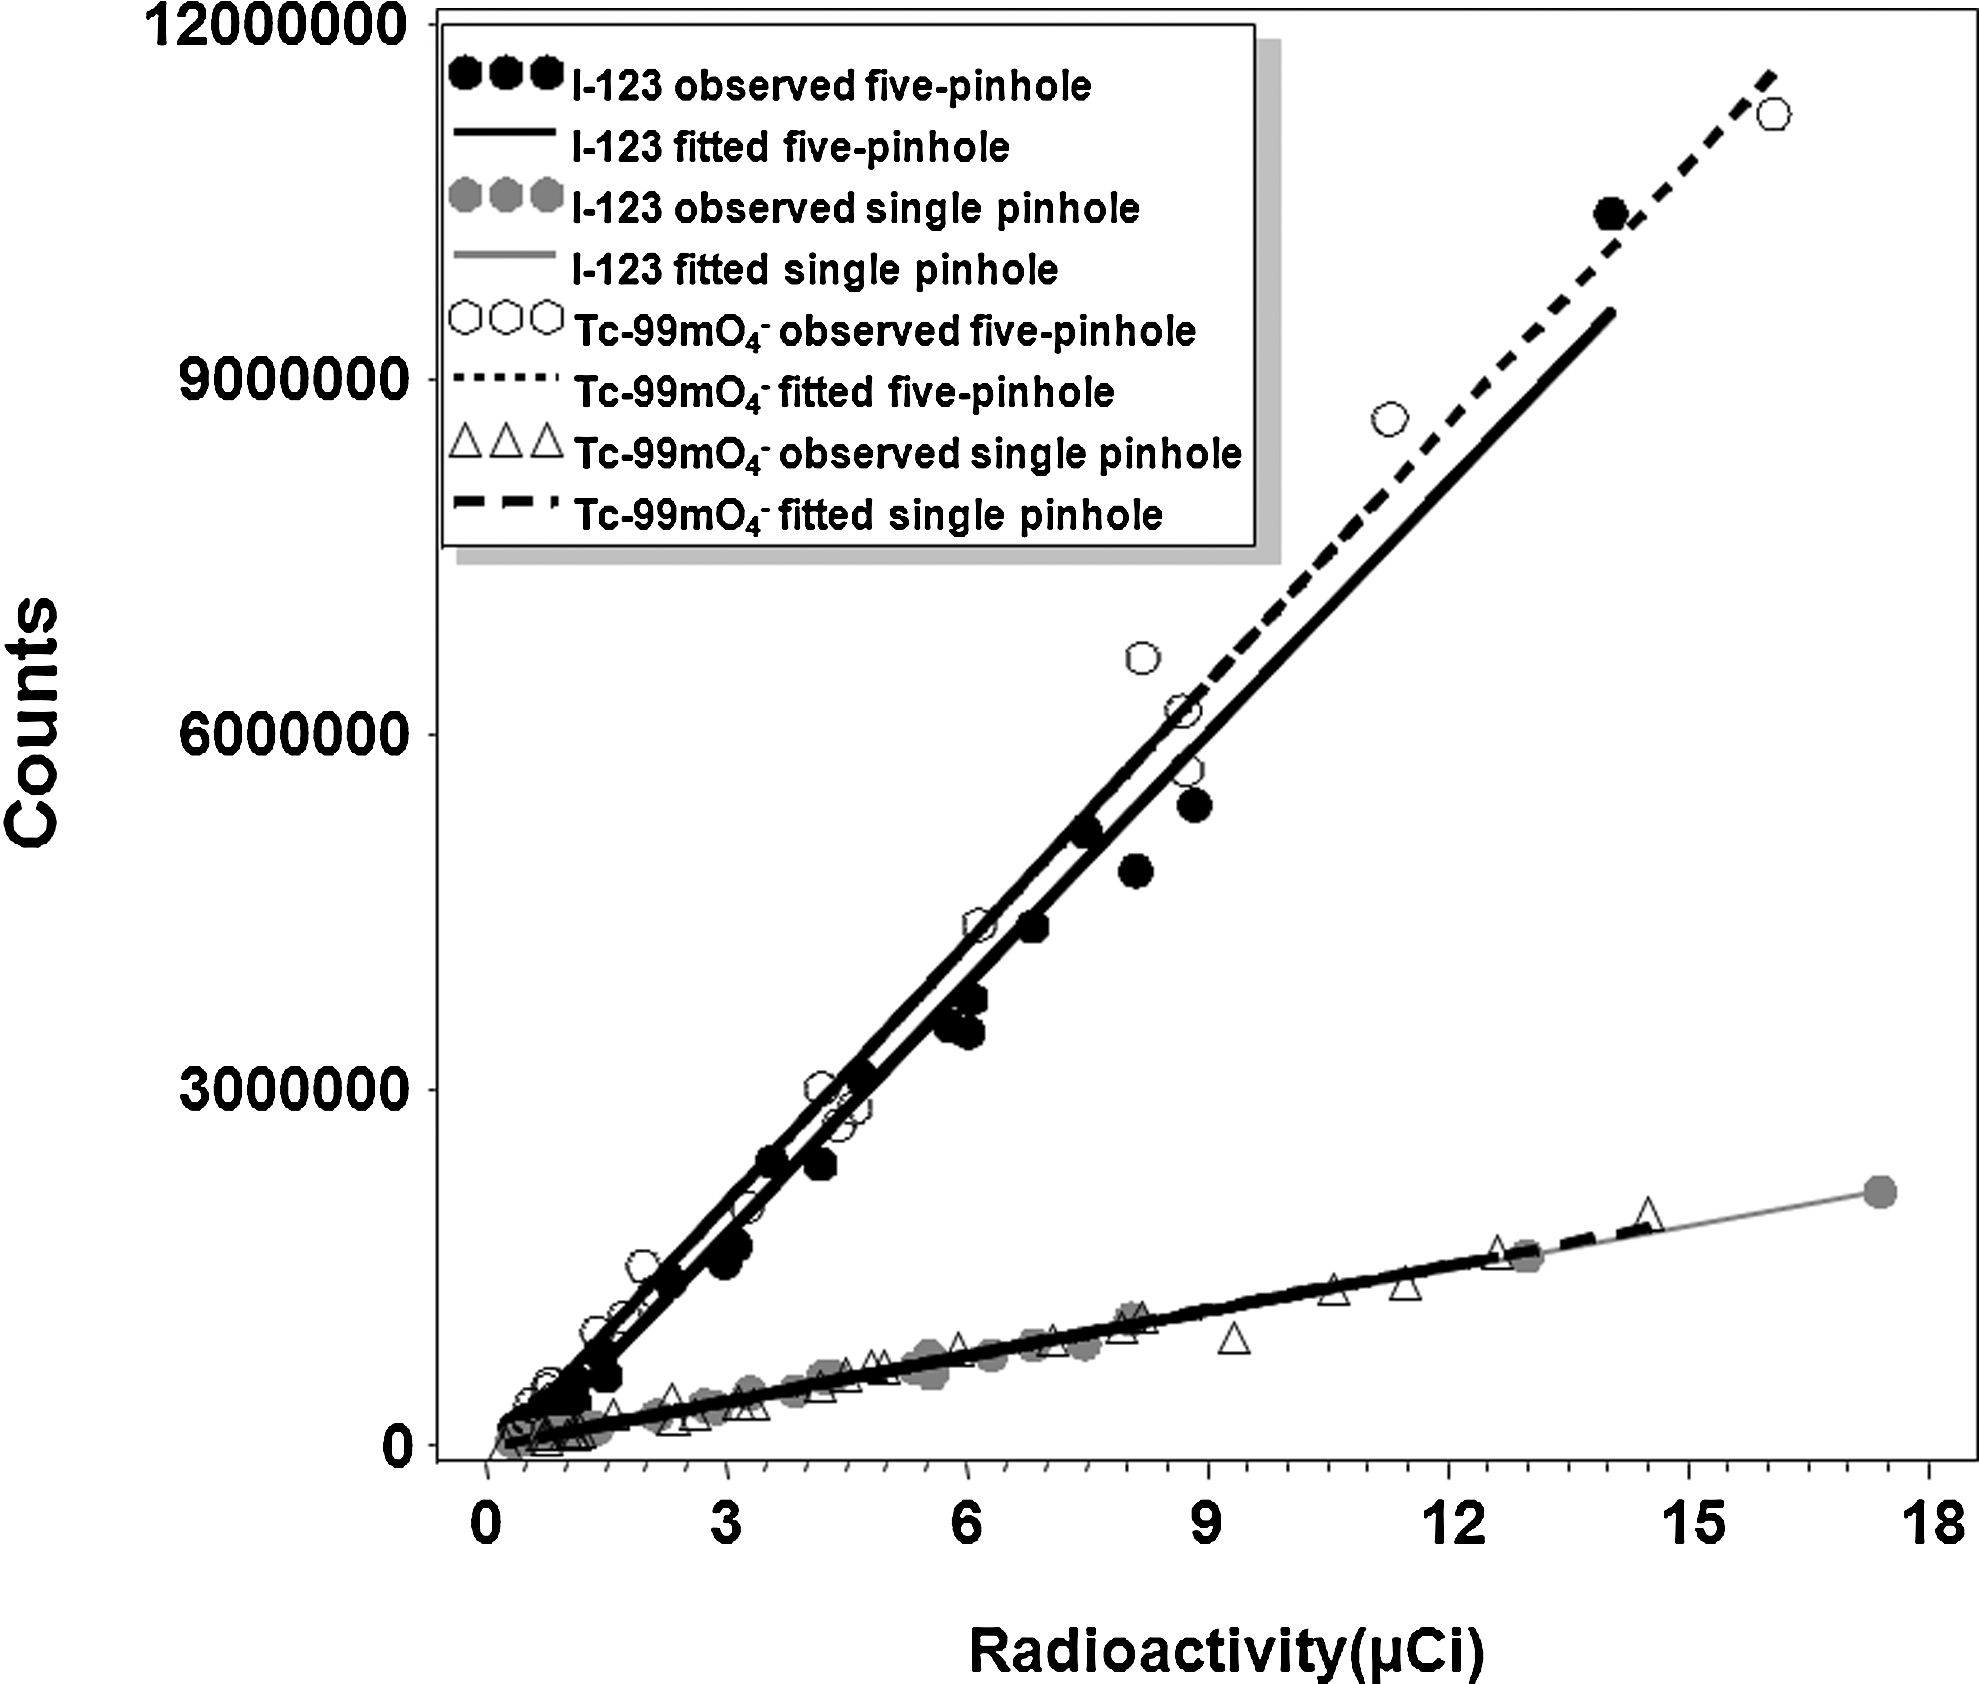
The effects of isotopes and collimators on counting linearity and signal intensity using phantoms. Bivariate plots with regression lines indicate that counts detected by five-pinhole collimators or by single-pinhole collimators are both linearly correlated with radioactivity in phantoms filled with either 123I NaI or Tc-99m pertechnetate. The signal intensity, as reflected by the slope values of the regression lines, is about fivefold higher in images acquired using five-pinhole collimators than that by single-pinhole collimators.
The effects of image acquisition time on counting linearity and sensitivity
It is desirable to optimize workflow and reduce animal exposure to anesthesia by reducing scan time without compromising the accuracy of image quantification. The impact of reducing scan time on total counts detected/μCi and linearity was examined using the aforementioned phantom with Tc-99m pertechnetate. Scan time can be reduced by reducing the number of projections per camera and/or duration of each projection.
As shown in Figure 3, the slope values were proportional to total image acquisition time regardless of different combinations of projection number and projection duration. In other words, the slope values were not significantly affected by a difference in projection number versus projection duration, as long as the total scan time remained the same. However, the linear correlation between counts detected, and radioactivity (p<0.0001) was not compromised by reducing scan time from 60 to 15 minutes, despite a proportional reduction in counts detected/μCi.
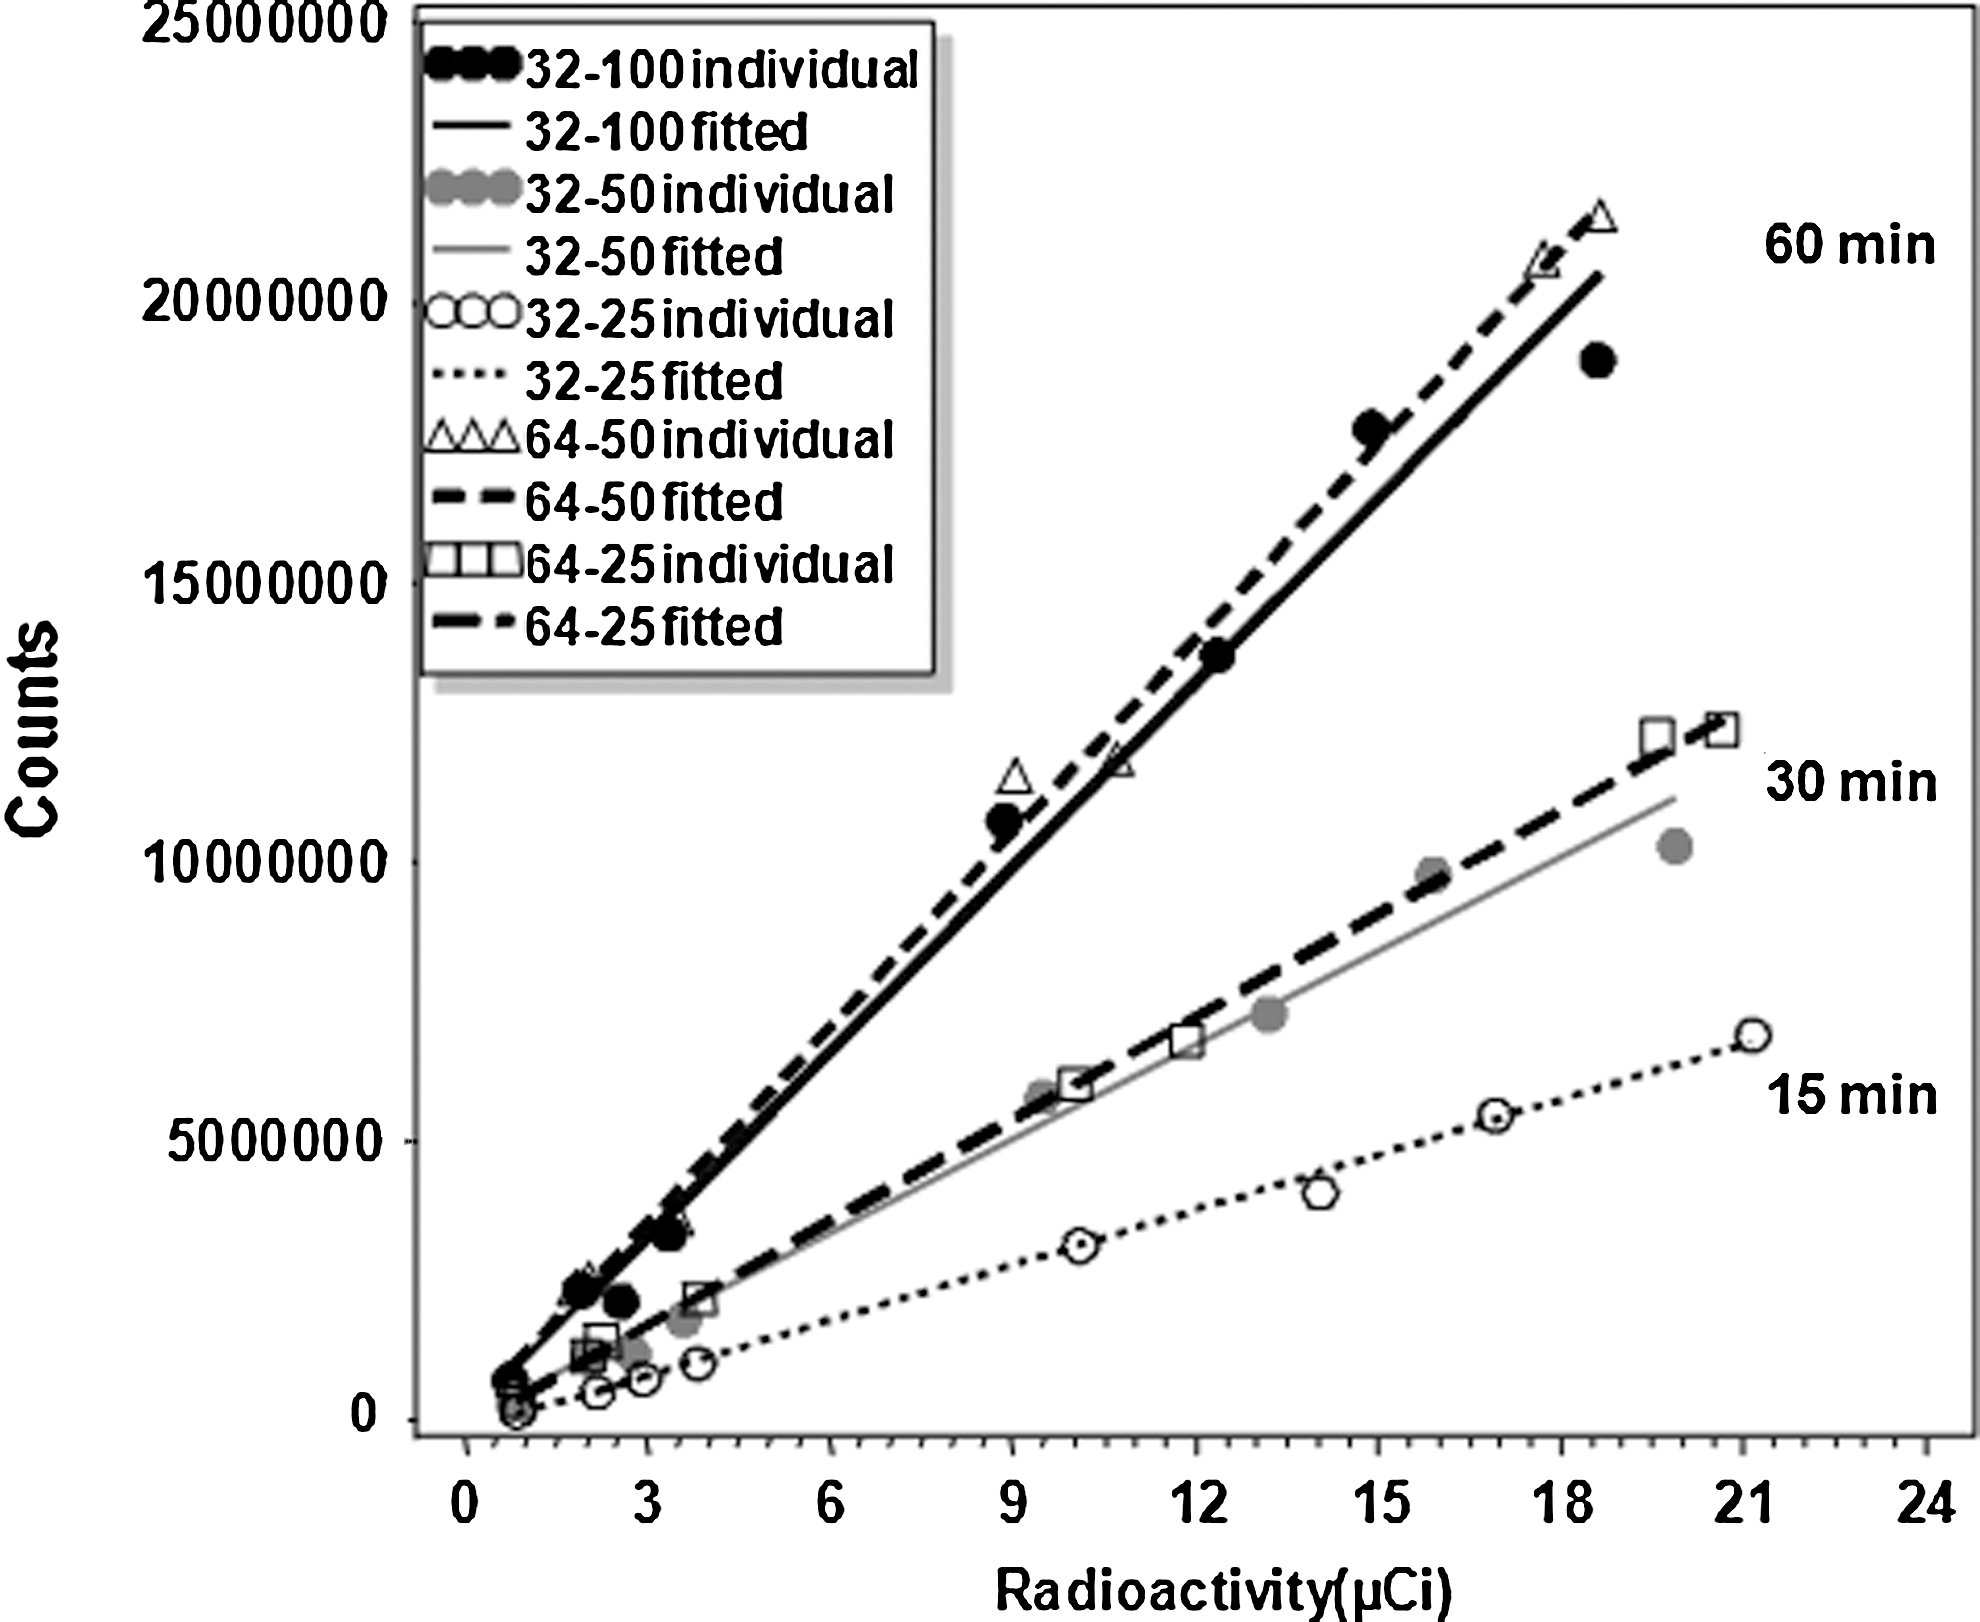
The effects of total scan time, determined by different combinations of projection numbers and projection duration, on counting linearity and signal intensity using phantoms filled with Tc-99m pertechnetate. Bivariate plots with regression lines indicated that reduction of total scan time from 60 to 30 minutes and to 15 minutes proportionally reduced the slope values of regression lines (signal intensity shown as counts/μCi), yet had little effect on counting linearity. Five-pinhole collimators were used. In the figure label, 32–100 represents 32 projections per camera with 100 seconds per projection, and so forth.
Whole-animal image acquisition using multiple-pinhole SPECT with spiral orbit
Parallel-hole collimators (i.e., HRES collimators) are conventionally used for whole-animal imaging; however, the reduced spatial resolution is not sufficient to resolve thyroid from salivary glands (Fig. 4A, left panel). In comparison, SPECT images acquired using pinhole collimators permit high spatial resolution to differentiate thyroid from salivary glands when collimators are sufficiently close to the mice; however, the restricted FOV does not permit whole-animal imaging when using circular orbit. Recently, Metzler et al. (8) reported whole-animal mouse imaging with high spatial resolution, and image quality was achieved by the use of spiral orbit, instead of circular orbit, in a clinical SPECT system with single-pinhole collimation. Here, we confirmed that whole-animal images acquired using five-pinhole collimators with spiral orbit (Fig. 4A, right panel) had a much higher spatial resolution compared to images acquired by parallel-hole collimators. As opposed to acquisition using conventional circular orbit (in which the animal bed remains static during the scan), acquisition using a spiral orbit is achieved in a step-and-shoot manner, in which the bed moves stepwise through the rotating gantry after each projection.
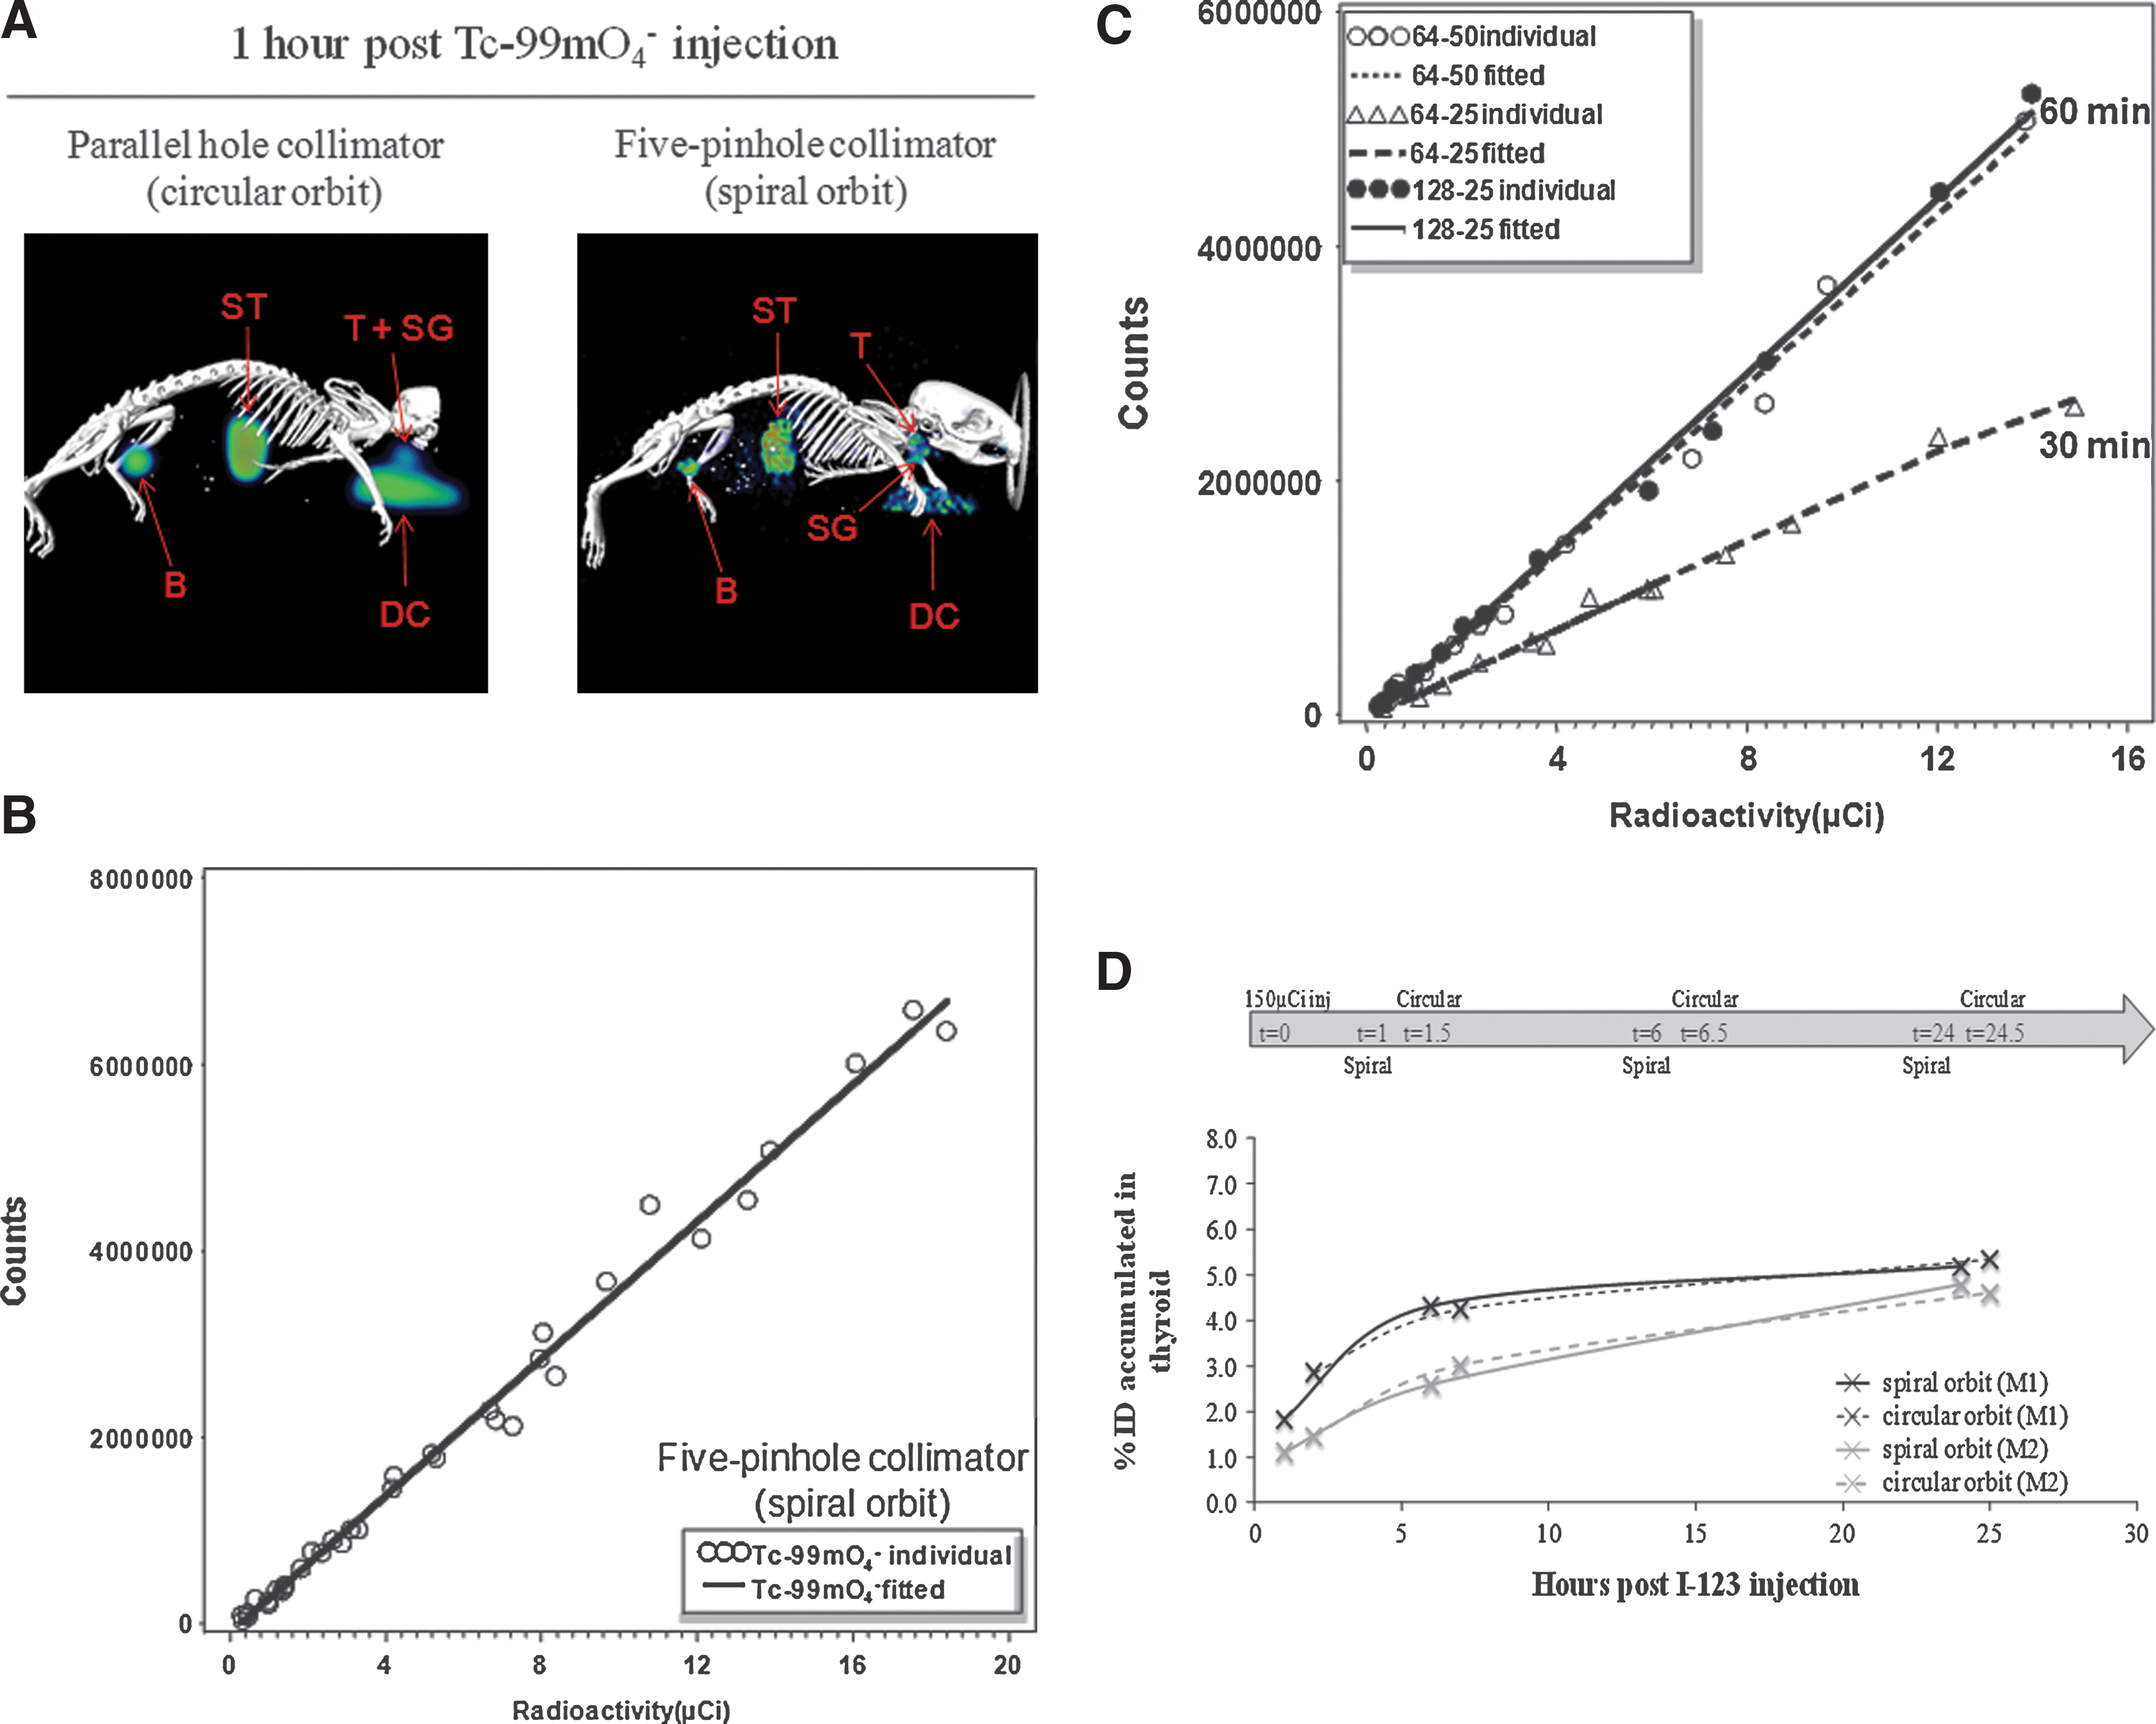
The whole-animal image acquired by a spiral orbit SPECT had high spatial resolution with great counting linearity.
To examine the counting linearity of SPECT images acquired using a spiral orbit, a new phantom of 25×115 mm capable of holding 16 samples of various radioactivity values was designed. For image acquisition with 64 projections, the bed moved 1.83 mm through the gantry after each projection, as calculated by 115 mm/63 steps, such that the total distance moved was sufficient for imaging the entire 115 mm z-axis of the phantom. The phantom was filled with 75 μL Tc-99m pertechnetate of varying radioactivity values within our experimental range, and was scanned using 64 projections/50 s projection duration using five-pinhole collimators with a 35-mm ROR, for three independent trials (Fig. 4B). Linear regression analysis demonstrated that counts detected by SPECT imaging using spiral orbit at these settings remained linearly correlated with radioactivity of Tc-99m pertechnetate (p<0.0001). For spiral orbit imaging, the projection number should not be lower than 64, per manufacturer's instruction as well as based on our experience. As shown in Figure 4C, the acquisition time per projection can be decreased to 25 seconds without compromising counting linearity (p=0.033), despite a significant decrease in counts detected/μCi (p<0.0001).
We examined whether scanning using spiral and circular orbits yields comparable quantification of thyroidal radioiodine accumulation in live animals. Two male mice (M1 and M2) were injected with 150 μCi 123I NaI and subjected to SPECT imaging using either spiral orbit for a 30-minute scan (64 projections, 25 s/projection), or circular orbit for a 15-minute scan (32 projections, 25 s/projection) immediately thereafter, at t1, t6, and t24 postinjection as demonstrated in Figure 4D. In the same mouse, thyroidal radioiodine accumulation as shown by %ID at t1, t6, and t24 measured by the spiral orbit scan was very similar to that acquired by the circular orbit scan. Whole-animal imaging with high spatial resolution and counting linearity is most useful for scanning mouse models of thyroid cancer bearing functional distant metastasis, in that thyroid tumors, as well as lung and bone metastases, may be simultaneously imaged for subsequent quantitative analysis.
Inter-experimental variability of thyroidal and salivary Tc-99m pertechnetate accumulation at t1 by SPECT imaging
To evaluate the effects of pharmacological agents on NIS-mediated radioiodine accumulation in the thyroid and salivary glands, we often use age-matched mice or littermates to compare an experimental group with a control group receiving vehicle treatment. However, if the extent of variability among mice were higher than that among multiple scans of the same mouse, it would be advantageous to compare radioiodine accumulation in the thyroid and salivary glands in the same mouse serving as their own control prior to versus after receiving pharmacological reagents. Accordingly, we evaluate variability among age-matched mice scanned at the same time versus variability among multiple scans of the same mouse. Male and female littermates at various ages were injected with 150 μCi Tc-99m pertechnetate at multiple times, and SPECT image acquisition was performed at 1 hour (t1) after each injection. We found that the time of day of injection (morning, 10:00–11:00 a.m., vs. afternoon, 4:00–5:00 p.m.) did not significantly affect NIS-mediated Tc-99m pertechnetate accumulation at t1 in the thyroid (p=0.5204) or salivary glands (p=0.1043); thus, both time points were pooled for each mouse analysis. As shown in Figure 5, the magnitude of variability among different littermates appears to be greater than the magnitude of inter-experimental variability in the same mouse (shown as error bars for the magnitude of standard error of the mean) except the thyroidal %ID in mice of 14 months old (n=2). NIS-mediated Tc-99m pertechnetate accumulation in the thyroid did not appear to vary greatly according to sex or age of mice. However, NIS-mediated Tc-99m pertechnetate accumulation in salivary glands of male mice was significantly higher than that of female mice in all ages (p<0.0001). Taken together, our study suggests that it is advantageous to compare NIS-mediated Tc-99m pertechnetate accumulation, that is, the equilibrium between efflux and NIS-mediated radionuclide influx, in the thyroid and salivary glands in the same mouse serving as its own control.
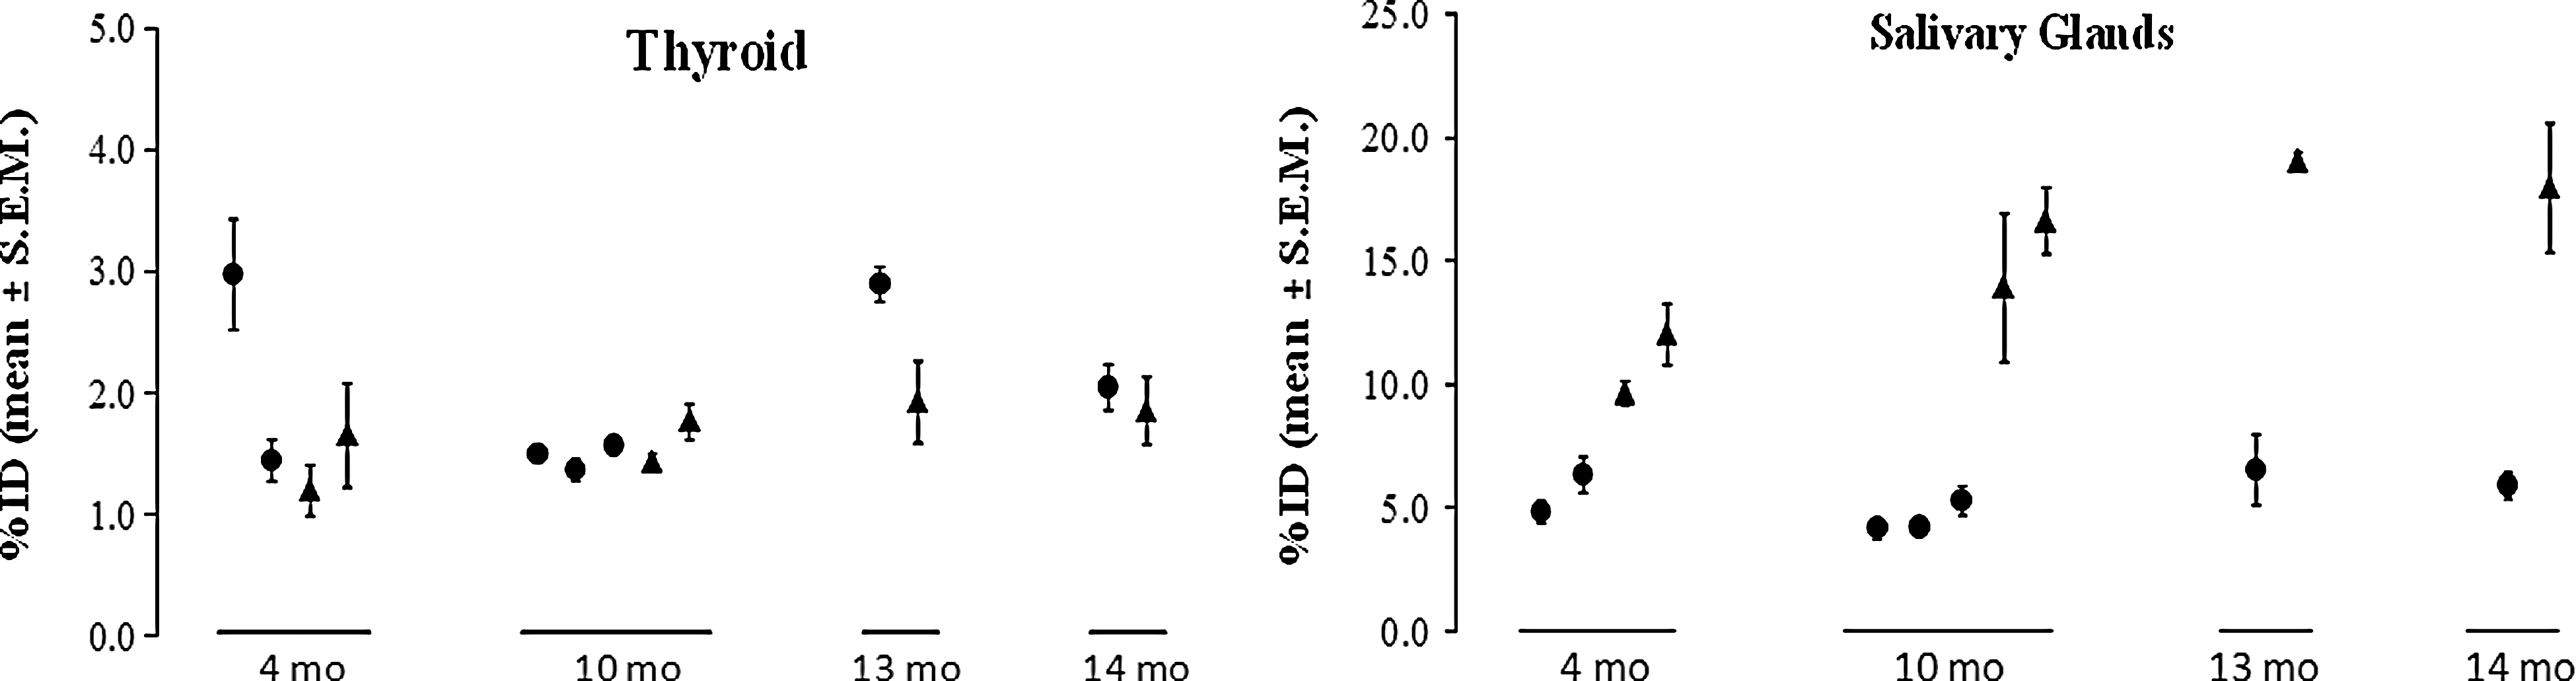
Inter-experimental variability of thyroidal and salivary radionuclide accumulation is less than inter-animal variability among littermates. FVB/N female (●) and male (▴) littermates of various ages were injected three to four times (each injection on a different day) with ∼150 μCi Tc-99m pertechnetate, and SPECT imaging was performed at 1 hour postinjection of radioisotope to measure thyroidal and salivary %ID. Overall, the variability between littermates is greater than the variability between individual mice scanned multiple times in both thyroid and salivary glands. Male mice had significantly higher radioisotope accumulation in salivary glands than female littermates. No statistically significant difference was observed between various times of day of injections or between mice of different ages in thyroidal or salivary NIS-mediated radionuclide accumulation. NIS, sodium-iodide symporter.
Discussion
In this study, we investigated variable parameters that affect image acquisition, as well as quantitative analysis, of thyroidal and salivary glands radionuclide accumulation in mice. The capability to quantify NIS-mediated radionuclide accumulation in the thyroid and salivary glands in a preclinical mouse model is clinically significant as many patients with thyroid cancer are given thyroid-targeted radioiodine therapy yet suffer from salivary gland dysfunction induced by it. Separation of thyroid ROI from salivary glands, based on a visual boundary method, was enhanced by empirically increasing the data window maxima. The linearity between counts detected and radioactivity of the thyroid and salivary glands in our experimental setting was validated using phantoms. Scanning time could be shortened to 15 minutes without compromising counting linearity despite decreased signal intensity. Spiral orbit with five-pinhole collimators was used to acquire whole-animal images, which achieved high spatial resolution and counting linearity. Finally, we recommend the same mice be used as their own controls, as the extent of inter-experimental variability of NIS-mediated radionuclide influx in the thyroid and salivary glands by SPECT imaging in the same mouse is less than the magnitude of variability among the littermates.
In general, the threshold edge-detection technique is considered more accurate than the visual boundary method for ROI selection to avoid overestimation of tissue radioactivity (13,14). However, counting linearity was excellent using phantoms of various radioactivity values that fell within our experimental range with our visual boundary method. In fact, the counting linearity in phantoms was comparable between image analysis using a 25% threshold edge-detection technique and our visual boundary method (data not shown). Furthermore, mice scanned in succession using spiral followed by circular orbit had similar thyroidal %ID at various time points, demonstrating the efficacy and reproducibility of our visual boundary method.
Manipulating the data window maxima allowed us to increase image contrast between the thyroid and salivary glands due to their difference in signal intensity. Franken et al. (6) recently reported that NIS-mediated Tc-99m pertechnetate uptake reached its maximum in the thyroid within 20–40 minutes, yet was still rising in the salivary glands after 90–110 minutes. This discrepancy could be contributed by the differences in NIS transport activity, and/or the ratio between the number of NIS-expressing cells, as well as the volume of the apical compartment (i.e., sizes of thyroid follicles vs ductal lumen of salivary glands) between the thyroid and salivary glands. On the contrary, NIS-mediated 123I NaI accumulation is continuously increased in the thyroid due to prolonged retention of organified 123I, yet NIS-mediated 123I NaI accumulation in the salivary glands usually decreased at t6 compared to t1 (5). While Tc-99m pertechnetate accumulation in the thyroid and salivary glands is only determined by their uptake equilibrium between influx and efflux, radioiodine accumulation in the thyroid is determined by both uptake equilibrium and the amount of radioiodine organified to thyroglobulin. Accordingly, temporal dynamics of Tc-99m pertechnetate and 123I NaI distribution in the thyroid versus salivary glands are expected to be very different. Given that 123I NaI accumulation increases in the thyroid while decreasing in salivary glands with time, the contrast of nuclear images between the thyroid and salivary glands increases at later time points postinjection. Indeed, at 24 hours postinjection, 123I NaI is no longer present in salivary glands, yet thyroidal 123I NaI accumulation remains evident. We noted that, at t1, NIS-mediated thyroidal Tc-99m pertechnetate accumulation (Fig. 5) was less variable than 123I NaI accumulation (5). This discrepancy suggests that the extent of variations in NIS-mediated iodide uptake in the thyroid is much less than that of subsequent iodide organification among different mice.
In hypothyroid mice, or mice bearing irregularly shaped hypofunctioning thyroid tumors, it can be more challenging to resolve the salivary glands from the thyroid. In this case, sequential CT soft tissue imaging may help to delineate the boundary between the thyroid and salivary glands. We have previously shown that NIS-mediated iodine influx can be inhibited in the thyroid by T3 supplementation and presumed thyroid-stimulating hormone suppression without decreasing NIS-mediated iodine accumulation in the salivary glands (5). Therefore, NIS-mediated radionuclide uptake in salivary glands could potentially be quantified independently of thyroid uptake in mice supplemented with the exogenous thyroid hormone. It is of clinical significance to screen reagents that differentially regulate NIS function in the thyroid and salivary glands, thereby reducing harmful side effects of radioiodine accumulation in salivary glands.
SPECT offers superior three-dimensional nuclear images, such that acquisition time is often chosen based on visual image quality rather than the minimum needed for reliable quantification. He and Frey (11) recently reported that acquisition time could be shortened extensively with little effect on quantification accuracy. Indeed, our data indicated that reduction of scan time from 60 to 15 minutes had little effect on counting linearity, despite a proportional decrease in signal intensity. It is also possible to further decrease scan time by administering a larger dose of radioactivity or when the target of interest has high signal intensity.
Typical pharmacological studies involve experimental and nontreated control groups; however, a large number of animals are usually required to address variability in thyroidal and salivary glands %ID accumulation among mice. We demonstrated that, overall, the variability in NIS-mediated radionuclide influx at t1 in the thyroid and salivary glands is greater between littermates than between the same mouse scanned multiple times, suggesting that it may be better to use the same mice as their own pretreatment control. Furthermore, we found that male mice have significantly higher salivary gland radioiodine uptake as opposed to female mice (p<0.0001). Taken together, our study suggests that segregating mice into experimental and control groups may not be optimal, and a smaller number of mice would be sufficient to achieve statistically significant observations if the same mice are used as their own pretreatment control.
In conclusion, we report the impact of multiple variables and experimental designs that optimize micro-SPECT imaging and quantification of radionuclide accumulation in mouse thyroid and salivary glands. This platform will serve as an invaluable tool to screen for pharmacologic reagents that differentially modulate thyroidal and salivary radioiodine accumulation in preclinical mouse models.
Footnotes
Acknowledgments
We wish to thank Rodd Reinhart and Sonny Edwards for preparing radioisotope doses. We also wish to thank Dr. JoAnn Zhang for sharing her expertise and experience in X-SPECT image acquisition and data analysis using Amira 4.1.1 software. This work was supported in part by National Institutes of Health Grant P01CA124570 (project 3 leader: S.M.J.; PI: M.D. Ringel), R01 EB001876 (PI: S.M.J.), and small animal imaging core supported by P30 CA16058 (PI: M.A. Caligiuri).
Disclosure Statement
The authors declare that no competing financial interests exist that would prejudice the impartiality of this scientific work.